Representation of Ethnic Groups in Chemistry and Physics
Representation of Ethnic Groups in Chemistry and Physics
Representation of Ethnic Groups in Chemistry and Physics

You also want an ePaper? Increase the reach of your titles
YUMPU automatically turns print PDFs into web optimized ePapers that Google loves.
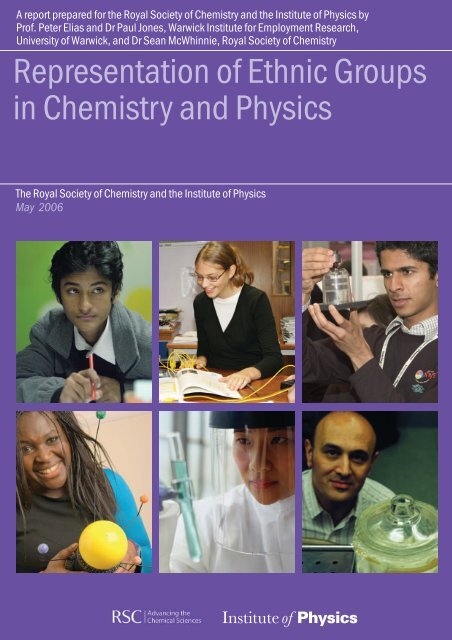
A report prepared for the Royal Society <strong>of</strong> <strong>Chemistry</strong> <strong>and</strong> the Institute <strong>of</strong> <strong>Physics</strong> by<br />
Pr<strong>of</strong>. Peter Elias <strong>and</strong> Dr Paul Jones, Warwick Institute for Employment Research,<br />
University <strong>of</strong> Warwick, <strong>and</strong> Dr Sean McWh<strong>in</strong>nie, Royal Society <strong>of</strong> <strong>Chemistry</strong><br />
<strong>Representation</strong> <strong>of</strong> <strong>Ethnic</strong> <strong>Groups</strong><br />
<strong>in</strong> <strong>Chemistry</strong> <strong>and</strong> <strong>Physics</strong><br />
The Royal Society <strong>of</strong> <strong>Chemistry</strong> <strong>and</strong> the Institute <strong>of</strong> <strong>Physics</strong><br />
May 2006
Executive summary<br />
Focus <strong>of</strong> the research<br />
This study presents a statistical picture <strong>of</strong> the progress <strong>of</strong> Engl<strong>and</strong>- <strong>and</strong> Wales-domiciled students<br />
from different ethnic groups through the various stages <strong>of</strong> the educational system <strong>in</strong>to<br />
undergraduate chemistry <strong>and</strong> physics courses. It then exam<strong>in</strong>es undergraduate achievement<br />
<strong>in</strong> chemistry <strong>and</strong> physics <strong>and</strong> the subsequent study outcomes <strong>of</strong> the students at postgraduate<br />
level. This leads to the identification <strong>of</strong> key differences between different ethnic groups’ achievements<br />
<strong>and</strong> decision mak<strong>in</strong>g.<br />
Key f<strong>in</strong>d<strong>in</strong>gs<br />
The study seeks to underst<strong>and</strong> the processes by which different ethnic groups leave academic<br />
chemistry <strong>and</strong> physics. Students may discont<strong>in</strong>ue the study <strong>of</strong> chemistry or physics either voluntarily<br />
(choos<strong>in</strong>g not to study chemistry or physics although qualified to do so) or <strong>in</strong>voluntarily<br />
(fail<strong>in</strong>g to achieve the prerequisite qualifications to cont<strong>in</strong>ue). Students may discont<strong>in</strong>ue,<br />
or not qualify to cont<strong>in</strong>ue, at different times – from the po<strong>in</strong>t <strong>of</strong> decid<strong>in</strong>g to stay on at school to<br />
study A-levels; through the choice <strong>of</strong> subjects at A-level <strong>and</strong> degree level (<strong>and</strong> the grades<br />
achieved); <strong>and</strong> the decision whether or not to undertake postgraduate study if qualified to do<br />
so. The progress <strong>of</strong> specific ethnic groups through academic chemistry <strong>and</strong> physics is modelled<br />
us<strong>in</strong>g the metaphor <strong>of</strong> a “leaky educational pipel<strong>in</strong>e”, which comprises six stages. Progress<br />
along this pipel<strong>in</strong>e by ethnic group, <strong>and</strong> the propensity <strong>of</strong> <strong>in</strong>dividuals <strong>in</strong> specific ethnic groups<br />
to drop out at each stage, is reported based on notional cohorts <strong>of</strong> 10 000 school-leavers for<br />
each ethnic group. Each <strong>of</strong> the summary po<strong>in</strong>ts below relates to a stage along the pipel<strong>in</strong>e.<br />
The analysis is carried out us<strong>in</strong>g data collected via the Department for Education <strong>and</strong> Skills<br />
(DfES) National Curriculum Assessment, the Youth Cohort Study (YCS) <strong>of</strong> Engl<strong>and</strong> <strong>and</strong> Wales,<br />
<strong>and</strong> the Higher Education Statistics Agency (HESA).<br />
The first stage <strong>of</strong> the educational pipel<strong>in</strong>e is the achievement <strong>of</strong> five GCSEs with<strong>in</strong> the range<br />
<strong>of</strong> grades A*–C. There are notable differences <strong>in</strong> achievement at GCSE by ethnic group. Based<br />
on the benchmark st<strong>and</strong>ard, Ch<strong>in</strong>ese <strong>and</strong> Indian pupils perform best, followed by white pupils,<br />
while people from black Caribbean, Pakistani <strong>and</strong> Bangladeshi backgrounds perform less<br />
well. The consequence <strong>of</strong> this for chemistry <strong>and</strong> physics is that significant attrition <strong>of</strong> ethnicm<strong>in</strong>ority<br />
groups takes place at this very early stage. Many black Caribbean, Pakistani <strong>and</strong><br />
Bangladeshi students fall at the first hurdle – <strong>of</strong>ten before students have the opportunity to specialise<br />
<strong>in</strong> chemistry or physics. Consequently, numbers from these populations are much<br />
lower than might be expected, <strong>in</strong> relation to population size, at later stages <strong>of</strong> academic study.<br />
The second stage is the achievement <strong>of</strong> an A-level <strong>in</strong> either chemistry or physics. Consider<strong>in</strong>g<br />
only students who achieve five GCSE passes at A*–C grades, all ethnic-m<strong>in</strong>ority groups, with<br />
the notable exception <strong>of</strong> black Caribbean students, are more likely to achieve an A-level <strong>in</strong><br />
chemistry than their white counterparts. However, only Indian <strong>and</strong> Ch<strong>in</strong>ese students are more<br />
likely to achieve an A-level <strong>in</strong> physics than their white peers.<br />
A comparison <strong>of</strong> physics <strong>and</strong> chemistry shows that, with the exception <strong>of</strong> white <strong>and</strong> Ch<strong>in</strong>ese<br />
students, other ethnic groups are significantly less likely to achieve an A-level <strong>in</strong> physics than<br />
chemistry. This may well be l<strong>in</strong>ked to the requirement <strong>of</strong> an A-level <strong>in</strong> chemistry to read medic<strong>in</strong>e<br />
at university. In terms <strong>of</strong> the overall survival rates <strong>of</strong> particular ethnic groups, all ethnicm<strong>in</strong>ority<br />
groups except black Caribbean are more likely to achieve an A-level <strong>in</strong> chemistry than<br />
white students. Overall, white students are three times as likely to achieve an A-level <strong>in</strong> chemistry<br />
as black Caribbean students. Overall <strong>in</strong> physics, only Indian <strong>and</strong> Ch<strong>in</strong>ese students are<br />
more likely to achieve an A-level than white students. Ch<strong>in</strong>ese students are almost three times<br />
“Many black<br />
Caribbean,<br />
Pakistani <strong>and</strong><br />
Bangladeshi<br />
students fall at<br />
the first hurdle –<br />
<strong>of</strong>ten before<br />
students have the<br />
chance to<br />
specialise <strong>in</strong><br />
chemistry or<br />
physics.”<br />
R EPRESENTATION OF E THNIC G ROUPS IN C HEMISTRY AND P HYSICS M AY 2006<br />
iii
Executive summary<br />
“In particular,<br />
medic<strong>in</strong>e,<br />
dentistry,<br />
pharmacology<br />
<strong>and</strong> ophthalmics<br />
all have very high<br />
numbers <strong>of</strong><br />
Indian <strong>and</strong><br />
Pakistani<br />
students relative<br />
to their numbers<br />
<strong>in</strong> the<br />
undergraduate<br />
population as a<br />
whole.”<br />
as likely to achieve an A-level <strong>in</strong> physics as white students. However, black Caribbean students<br />
are only a sixth as likely to achieve an A-level <strong>in</strong> physics as their white counterparts.<br />
The third stage <strong>of</strong> the educational pipel<strong>in</strong>e is achievement <strong>of</strong> the qualifications to study<br />
chemistry or physics at undergraduate level. Approximately two-thirds <strong>of</strong> students achiev<strong>in</strong>g<br />
an A-level <strong>in</strong> chemistry are qualified to study chemistry at undergraduate level, based on prerequisite<br />
qualifications as outl<strong>in</strong>ed <strong>in</strong> the study; <strong>and</strong> approximately half <strong>of</strong> students achiev<strong>in</strong>g<br />
an A-level <strong>in</strong> physics are qualified to study physics at undergraduate level, based on<br />
comb<strong>in</strong>ations <strong>of</strong> subjects studied <strong>and</strong> grades achieved. Significant differences between ethnic-m<strong>in</strong>ority<br />
groups are not observed at this stage.<br />
Evidence is found <strong>of</strong> systematic differences <strong>in</strong> subject choices by ethnic group for students<br />
choos<strong>in</strong>g chemistry or physics over other subject areas at degree level, the fourth stage <strong>in</strong> the<br />
pipel<strong>in</strong>e. This is most notable <strong>in</strong> physics where all ethnic-m<strong>in</strong>ority groups, except Ch<strong>in</strong>ese students,<br />
are under-represented relative to their numbers <strong>in</strong> the undergraduate population, <strong>and</strong><br />
relative to numbers <strong>of</strong> students qualified to study chemistry or physics by their A-levels.<br />
Consequently, physics is very much white (<strong>and</strong> male) dom<strong>in</strong>ated.<br />
In chemistry there is a less clear-cut difference between ethnic groups. <strong>Ethnic</strong>-m<strong>in</strong>ority groups<br />
<strong>in</strong> general are over-represented <strong>in</strong> chemistry, relative to their numbers <strong>in</strong> the undergraduate<br />
population, with the exception <strong>of</strong> black Caribbean students. However, even <strong>in</strong> this case the<br />
numbers are over-represented based on the numbers <strong>of</strong> potential undergraduate black<br />
Caribbean chemists.<br />
Alternative areas <strong>of</strong> study<br />
This report also compares alternative areas <strong>of</strong> study. With<strong>in</strong> science, eng<strong>in</strong>eer<strong>in</strong>g <strong>and</strong> technology<br />
(SET) subjects a general bias is found among ethnic-m<strong>in</strong>ority students aga<strong>in</strong>st traditional<br />
areas <strong>of</strong> science, such as the physical sciences, the biological sciences <strong>and</strong><br />
mathematics. In contrast, ethnic-m<strong>in</strong>ority groups <strong>in</strong> general tend to be over-represented <strong>in</strong><br />
<strong>in</strong>formation, communication <strong>and</strong> technology (ICT), <strong>and</strong> computer science, compared with<br />
their white counterparts. Outside science, a very strong bias towards medic<strong>in</strong>e <strong>and</strong> related<br />
subjects is found among non-white groups, especially Asian students. This supports the earlier<br />
observation that chemistry is a popular A-level subject with ethnic-m<strong>in</strong>ority groups because<br />
it is a prerequisite for medic<strong>in</strong>e. In particular, medic<strong>in</strong>e, dentistry, pharmacology <strong>and</strong> ophthalmics<br />
all have very high numbers <strong>of</strong> Indian <strong>and</strong> Pakistani students relative to their numbers<br />
<strong>in</strong> the undergraduate population as a whole.<br />
In addition, ethnic-m<strong>in</strong>ority groups generally show a preference towards other vocational<br />
subjects, such as bus<strong>in</strong>ess <strong>and</strong> adm<strong>in</strong>istration or law. Black Caribbean students, however,<br />
are different from most ethnic-m<strong>in</strong>ority groups, show<strong>in</strong>g a general preference for arts, social sciences<br />
<strong>and</strong> humanities subjects.<br />
The fifth stage <strong>of</strong> the educational pipel<strong>in</strong>e is the achievement <strong>of</strong> a first or upper-second-class<br />
degree, which represents the normal qualify<strong>in</strong>g st<strong>and</strong>ard for further study, especially at doctoral<br />
level. There is strong evidence <strong>of</strong> significantly different patterns <strong>of</strong> achievement <strong>in</strong> chemistry<br />
<strong>and</strong> physics by ethnic group at the conclusion <strong>of</strong> undergraduate studies. White students<br />
have much higher rates <strong>of</strong> success <strong>in</strong> achiev<strong>in</strong>g a first or upper-second degree, <strong>and</strong> thus are <strong>in</strong><br />
a better position to access postgraduate chemistry, physics or related science courses. This differential<br />
achievement by ethnic group is found not only <strong>in</strong> chemistry <strong>and</strong> physics but across<br />
most subject areas. However, there is evidence that most <strong>of</strong> this differential achievement may<br />
be expla<strong>in</strong>ed by subject choice <strong>and</strong> because many ethnic groups are over-represented <strong>in</strong> the<br />
iv R EPRESENTATION OF E THNIC G ROUPS IN C HEMISTRY AND P HYSICS M AY 2006
Executive summary<br />
undergraduate population relative to their white counterparts.<br />
Postgraduate study <strong>in</strong> chemistry or physics is the sixth educational stage. Among students<br />
who achieve high st<strong>and</strong>ards at undergraduate level, ethnic-m<strong>in</strong>ority students are less <strong>in</strong>cl<strong>in</strong>ed<br />
to study chemistry or physics at PhD level than their white counterparts. In contrast with this,<br />
ethnic-m<strong>in</strong>ority graduates <strong>in</strong> chemistry <strong>and</strong> physics are significantly more likely to go on to further<br />
study than their white counterparts. From this it can be <strong>in</strong>ferred that ethnic-m<strong>in</strong>ority students<br />
tend to study subjects outside chemistry <strong>and</strong> physics at postgraduate level. This apparent<br />
drift away from chemistry <strong>and</strong> physics by ethnic-m<strong>in</strong>ority students presents an <strong>in</strong>terest<strong>in</strong>g<br />
avenue for future research.<br />
As well as the ethnic differences described, gender is a recurr<strong>in</strong>g theme throughout this<br />
study. <strong>Physics</strong> <strong>in</strong> particular <strong>and</strong>, to a lesser extent, chemistry tend to be male dom<strong>in</strong>ated.<br />
Moreover, the pattern <strong>of</strong> attrition is such that, <strong>in</strong> mov<strong>in</strong>g along the educational pipel<strong>in</strong>e, the<br />
majority white male group has higher retention rates compared with other groups <strong>and</strong> therefore<br />
becomes an <strong>in</strong>creas<strong>in</strong>gly large majority <strong>in</strong> the later stages.<br />
“Among students<br />
who achieve high<br />
st<strong>and</strong>ards at<br />
undergraduate<br />
level, ethnicm<strong>in</strong>ority<br />
students<br />
are less <strong>in</strong>cl<strong>in</strong>ed<br />
to study<br />
chemistry or<br />
physics at PhD<br />
level than their<br />
white<br />
counterparts.”<br />
Socioeconomic considerations<br />
F<strong>in</strong>ally, not all <strong>of</strong> the differences described <strong>in</strong> the study can be attributed entirely to ethnicity.<br />
Different ethnic groups have different socioeconomic pr<strong>of</strong>iles <strong>and</strong> consequently it is not possible<br />
to say categorically whether the differences observed are the result <strong>of</strong> ethnic differences<br />
per se or whether socioeconomic factors play a part.<br />
Nonetheless, it is clear that ethnicity is correlated with the progress <strong>of</strong> different groups along<br />
the educational pipel<strong>in</strong>e <strong>in</strong> chemistry <strong>and</strong> physics. In address<strong>in</strong>g these differences the challenge<br />
for policy makers is to recognise the diversity <strong>of</strong> <strong>in</strong>fluences likely to be at work <strong>and</strong> to<br />
design policies that, regardless <strong>of</strong> colour, race <strong>and</strong> cultural background, will work to <strong>in</strong>crease<br />
opportunities for under-represented m<strong>in</strong>orities.<br />
R EPRESENTATION OF E THNIC G ROUPS IN C HEMISTRY AND P HYSICS M AY 2006<br />
v
Contents<br />
List <strong>of</strong> figures <strong>and</strong> tables<br />
List <strong>of</strong> appendices<br />
Abbreviations<br />
viii<br />
x<br />
xi<br />
1: Introduction 1<br />
1.1 Scope <strong>of</strong> the review 1<br />
1.2 Background 1<br />
1.3 Structure 2<br />
2: Key concepts 3<br />
2.1 The educational pipel<strong>in</strong>e 3<br />
2.2 Potential undergraduate scientists 3<br />
3: Methodology 5<br />
3.1 Data sources 5<br />
3.1 .1 National Curriculum Assessment 5<br />
3.1 .2 Youth Cohort Study 5<br />
3.1 .3 Higher Education Statistics Agency 5<br />
3.1 .4 Labour Force Survey 6<br />
3.2 L<strong>in</strong>k<strong>in</strong>g Youth Cohort Study <strong>and</strong> Higher Education Statistics Agency data sets 6<br />
3.3 Statistical significance 7<br />
4: The educational pipel<strong>in</strong>e 8<br />
5: <strong>Ethnic</strong>ity <strong>and</strong> compulsory school<strong>in</strong>g 12<br />
6: <strong>Ethnic</strong>ity <strong>and</strong> science at A-level 14<br />
6.1 Science subjects at A-level 14<br />
6.2 Potential undergraduate scientists 16<br />
7: <strong>Ethnic</strong>ity <strong>and</strong> undergraduate studies 20<br />
7.1 <strong>Ethnic</strong>-m<strong>in</strong>ority representation <strong>in</strong> undergraduate chemistry <strong>and</strong> physics 20<br />
7.2 <strong>Ethnic</strong>-m<strong>in</strong>ority representation <strong>in</strong> SET, medic<strong>in</strong>e <strong>and</strong> other subjects 22<br />
7.3 Achievement <strong>in</strong> undergraduate chemistry <strong>and</strong> physics 27<br />
8: <strong>Ethnic</strong>ity <strong>and</strong> postgraduate studies 30<br />
9: Conclusions <strong>and</strong> recommendations 33<br />
References 35<br />
Appendices 36<br />
R EPRESENTATION OF E THNIC G ROUPS IN C HEMISTRY AND P HYSICS M AY 2006<br />
vii
List <strong>of</strong> figures <strong>and</strong> tables<br />
Fig. 1: Overall survival rates <strong>and</strong> stage survival rates <strong>in</strong> academic chemistry 9<br />
Fig. 2: Overall survival rates <strong>and</strong> stage survival rates <strong>in</strong> academic physics 10<br />
Fig. 3: Proportion <strong>of</strong> pupils achiev<strong>in</strong>g five or more GCSEs at grades A*–C, by ethnic group <strong>and</strong> gender 12<br />
Fig. 4: Proportion <strong>of</strong> students achiev<strong>in</strong>g KS3 science, by ethnic group <strong>and</strong> gender 12<br />
Fig. 5: Proportion <strong>of</strong> students achiev<strong>in</strong>g KS2 science, by ethnic group <strong>and</strong> gender 13<br />
Fig. 6: Proportion <strong>of</strong> young people achiev<strong>in</strong>g at least one A-level pass, by ethnic group <strong>and</strong> gender 14<br />
Fig. 7: Sciences at A-level for males, by ethnic group 15<br />
Fig. 8: Sciences at A-level for females, by ethnic group 16<br />
Fig. 9: Science subjects studied at A-level, by ethnic group <strong>and</strong> gender 17<br />
Fig. 10: A-level chemistry <strong>and</strong> potential undergraduate chemists 18<br />
Fig. 11: A-level physics <strong>and</strong> potential undergraduate physicists 19<br />
Fig. 12: <strong>Ethnic</strong> composition <strong>of</strong> undergraduate chemistry <strong>and</strong> physics 21<br />
Fig. 13: EGR <strong>in</strong> chemistry 22<br />
Fig. 14: EGR <strong>in</strong> physics 22<br />
Fig. 15: EGR <strong>in</strong> SET subjects 23<br />
Fig. 16: EGR <strong>in</strong> medic<strong>in</strong>e-related subjects 23<br />
Fig. 17: EGR <strong>in</strong> other subject areas 23<br />
Fig. 18: EGR by SET subject 24<br />
Fig. 19: EGR by medic<strong>in</strong>e <strong>and</strong> related subjects 25<br />
Fig. 20: EGR <strong>in</strong> law 26<br />
Fig. 21: EGR <strong>in</strong> bus<strong>in</strong>ess <strong>and</strong> adm<strong>in</strong>istration 26<br />
Fig. 22: Proportion <strong>of</strong> students obta<strong>in</strong><strong>in</strong>g first- or upper-second-class degrees <strong>in</strong> all subjects, by ethnic group 27<br />
Fig. 23: Proportion <strong>of</strong> students obta<strong>in</strong><strong>in</strong>g first- or upper-second-class degrees <strong>in</strong> chemistry, by ethnic group 28<br />
Fig. 24: Proportion <strong>of</strong> students obta<strong>in</strong><strong>in</strong>g first- or upper-second-class degrees <strong>in</strong> physics, by ethnic group 29<br />
Fig. 25: <strong>Ethnic</strong> <strong>and</strong> gender composition <strong>of</strong> doctorate chemistry 30<br />
Fig. 26: EGR <strong>in</strong> doctorate chemistry 31<br />
Fig. 27: <strong>Ethnic</strong> <strong>and</strong> gender composition <strong>of</strong> doctorate physics 31<br />
Fig. 28: EGR <strong>in</strong> doctorate physics 32<br />
viii R EPRESENTATION OF E THNIC G ROUPS IN C HEMISTRY AND P HYSICS M AY 2006
List <strong>of</strong> figures <strong>and</strong> tables<br />
Fig. 29: Proportion <strong>of</strong> students go<strong>in</strong>g on to further study, by ethnic group 32<br />
Fig. 30: Academic staff <strong>in</strong> chemistry, by ethnic group 42<br />
Fig. 31: Academic staff <strong>in</strong> physics, by ethnic group 42<br />
Table 1: A description <strong>of</strong> the stages along the educational pipel<strong>in</strong>e 3<br />
Table 2: Three def<strong>in</strong>itions <strong>of</strong> potential undergraduate chemist/physicist 4<br />
Table 3: Sample numbers <strong>in</strong> the YCS, based on merged cohorts 1996–2002 6<br />
R EPRESENTATION OF E THNIC G ROUPS IN C HEMISTRY AND P HYSICS M AY 2006<br />
ix
List <strong>of</strong> appendices<br />
Appendix 1: Estimated numbers <strong>of</strong> students at each stage based on a school-leav<strong>in</strong>g cohort 36<br />
Appendix 2: Science A-levels <strong>in</strong> the YCS with DfES cod<strong>in</strong>g 37<br />
Appendix 3: A-level chemistry <strong>and</strong> potential undergraduate chemists 38<br />
Appendix 4: A-level physics <strong>and</strong> potential undergraduate physicists 38<br />
Appendix 5: <strong>Ethnic</strong> composition <strong>of</strong> the Engl<strong>and</strong>- <strong>and</strong> Wales-domiciled undergraduate population 39<br />
Appendix 6: <strong>Ethnic</strong> <strong>and</strong> gender percentages <strong>in</strong> the population <strong>of</strong> chemistry <strong>and</strong> physics students achiev<strong>in</strong>g a<br />
first or upper second degree classification 39<br />
Appendix 7: Undergraduate subject groups ranked by ethnic group participation 40<br />
Appendix 8: Proportion <strong>of</strong> students awarded first or upper second degrees, by ethnicity <strong>and</strong> subject group 40<br />
Appendix 9: <strong>Ethnic</strong>ity <strong>of</strong> academic staff <strong>in</strong> chemistry <strong>and</strong> physics 42<br />
Appendix 10: Statistical <strong>in</strong>ference 43<br />
x R EPRESENTATION OF E THNIC G ROUPS IN C HEMISTRY AND P HYSICS M AY 2006
Abbreviations<br />
DfES<br />
EGR<br />
GCSE<br />
GNVQ<br />
HESA<br />
ICT<br />
IOP<br />
KS<br />
LFS<br />
MChem<br />
MPhys<br />
ONS<br />
RSC<br />
SET<br />
UCAS<br />
YCS<br />
Department for Education <strong>and</strong> Skills<br />
<strong>Ethnic</strong>-gender representation<br />
General Certificate <strong>in</strong> Secondary Education<br />
General National Vocational Qualification<br />
Higher Education Statistics Agency<br />
Information <strong>and</strong> communication technology<br />
Institute <strong>of</strong> <strong>Physics</strong><br />
Key Stage<br />
Labour Force Survey<br />
Master <strong>of</strong> <strong>Chemistry</strong> (four-year enhanced undergraduate degree <strong>in</strong> chemistry)<br />
Master <strong>of</strong> <strong>Physics</strong> (four-year enhanced undergraduate degree <strong>in</strong> physics)<br />
Office for National Statistics<br />
Royal Society <strong>of</strong> <strong>Chemistry</strong><br />
Science, eng<strong>in</strong>eer<strong>in</strong>g <strong>and</strong> technology<br />
Universities <strong>and</strong> Colleges Admissions Service<br />
Youth Cohort Study<br />
R EPRESENTATION OF E THNIC G ROUPS IN C HEMISTRY AND P HYSICS M AY 2006<br />
xi
1: Introduction<br />
1: Introduction<br />
1.1: Scope <strong>of</strong> the study<br />
As part <strong>of</strong> their agenda to address issues relat<strong>in</strong>g to student<br />
diversity <strong>in</strong> chemistry <strong>and</strong> physics, the Royal Society <strong>of</strong><br />
<strong>Chemistry</strong> <strong>and</strong> the Institute <strong>of</strong> <strong>Physics</strong> commissioned this<br />
study to <strong>in</strong>vestigate patterns <strong>of</strong> ethnic-m<strong>in</strong>ority participation<br />
<strong>in</strong> the two subjects through the various stages <strong>of</strong> academic<br />
study <strong>and</strong> <strong>in</strong>to the labour market.<br />
The scope <strong>of</strong> the work is to use exist<strong>in</strong>g sources <strong>of</strong> data to<br />
create a statistical overview, broken down by ethnic group,<br />
<strong>and</strong> to compare participation rates between the groups at<br />
different stages <strong>of</strong> academic study. The aim is to identify<br />
transition po<strong>in</strong>ts between educational stages where significantly<br />
larger or smaller proportions <strong>of</strong> particular ethnicm<strong>in</strong>ority<br />
groups leave education <strong>in</strong> comparison with the<br />
majority white population.<br />
The expectation is that, by identify<strong>in</strong>g po<strong>in</strong>ts where particular<br />
groups leave chemistry <strong>and</strong> physics, further work<br />
can be suggested to <strong>in</strong>vestigate factors that affect these<br />
differences. Although it is recognised that different ethnic<br />
groups exhibit different socioeconomic characteristics,<br />
which may affect educational participation rates, it is<br />
beyond the scope <strong>of</strong> this study to <strong>in</strong>vestigate these additional<br />
issues.<br />
1.2: Background<br />
This report addresses the participation <strong>of</strong> ethnic groups<br />
us<strong>in</strong>g the metaphor <strong>of</strong> a “leaky educational pipel<strong>in</strong>e”. The<br />
pipel<strong>in</strong>e represents the rate at which students leave chemistry<br />
<strong>and</strong> physics by ethnic group dur<strong>in</strong>g the different stages<br />
<strong>of</strong> academic study. The propensity <strong>of</strong> <strong>in</strong>dividuals to leave<br />
at each <strong>of</strong> the six stages is reported based on a notional<br />
cohort <strong>of</strong> 10 000 school-leavers per ethnic group. This<br />
analysis is carried out us<strong>in</strong>g data for Engl<strong>and</strong> <strong>and</strong> Wales 1<br />
from the Department for Education <strong>and</strong> Skills (DfES)<br />
National Curriculum Assessment, the Youth Cohort Study<br />
(YCS) <strong>of</strong> Engl<strong>and</strong> <strong>and</strong> Wales, the Higher Education<br />
Statistics Agency (HESA) <strong>and</strong> the Labour Force Survey<br />
(LFS). The six stages break down the route through academic<br />
chemistry <strong>and</strong> physics <strong>in</strong>to a temporal series <strong>of</strong> academic<br />
achievements, from GCSE through to doctorate study.<br />
The ma<strong>in</strong> purpose <strong>of</strong> this approach is to disentangle the<br />
effects <strong>of</strong> early education (based on GCSE grades); subject<br />
choice both at A-level <strong>and</strong> undergraduate study; <strong>and</strong><br />
atta<strong>in</strong>ment <strong>in</strong> terms <strong>of</strong> achiev<strong>in</strong>g the qualifications to proceed<br />
to later stages <strong>of</strong> study.<br />
Under-representation <strong>of</strong> certa<strong>in</strong> ethnic-m<strong>in</strong>ority groups<br />
<strong>in</strong> chemistry <strong>and</strong> physics, notably young people from black<br />
Caribbean, Pakistani <strong>and</strong> Bangladeshi backgrounds, arises<br />
to some degree because low numbers <strong>of</strong> students from<br />
these groups achieve the requisite GCSE grades at school<br />
<strong>and</strong> therefore most are not qualified to cont<strong>in</strong>ue with further<br />
study after the age <strong>of</strong> 16. The students belong<strong>in</strong>g to<br />
the ethnic-m<strong>in</strong>ority groups mentioned above <strong>in</strong> general<br />
achieve fewer GCSEs (e.g. based on the benchmark st<strong>and</strong>ard<br />
<strong>of</strong> five GCSEs at grade A*–C; Demack et al. 2000;<br />
Gillborn <strong>and</strong> Mirza 2000) than students from other ethnicm<strong>in</strong>ority<br />
groups. This is particularly the case <strong>in</strong> science <strong>and</strong><br />
mathematics (Harrison et al. 2003). Consequently, students<br />
from these ethnic groups are less likely than students<br />
from other ethnic-m<strong>in</strong>ority groups to obta<strong>in</strong> an A-level. Thus<br />
students <strong>of</strong> black Caribbean, Pakistani <strong>and</strong> Bangladeshi<br />
backgrounds are less likely to be <strong>in</strong> higher education generally<br />
than students from other ethnic groups (Connor et<br />
al. 2003; Leslie <strong>and</strong> Dr<strong>in</strong>kwater 1999).<br />
Although these <strong>in</strong>fluences do not relate solely to chemistry<br />
<strong>and</strong> physics, the consequence for the physical sciences<br />
is that there is a significant attrition <strong>of</strong> numbers <strong>of</strong><br />
black Caribbean, Pakistani <strong>and</strong> Bangladeshi students at<br />
the first hurdle – the transition from GCSEs to A-levels –<br />
<strong>of</strong>ten even before students have the chance to specialise <strong>in</strong><br />
chemistry or physics per se. This results <strong>in</strong> a huge loss <strong>of</strong><br />
potential talent. Consequently, patterns <strong>of</strong> ethnic representation<br />
across SET, both <strong>in</strong> science education <strong>and</strong><br />
employment, correspond closely with these patterns <strong>of</strong><br />
achievement at GCSE <strong>and</strong> <strong>in</strong>deed at Key Stage (KS) 3<br />
(Jones <strong>and</strong> Elias 2004).<br />
Tak<strong>in</strong>g <strong>in</strong>to account this early attrition, this report proceeds<br />
to look for systematic biases <strong>and</strong> revealed preferences<br />
by ethnic group at various stages <strong>of</strong> higher education<br />
<strong>in</strong> chemistry <strong>and</strong> physics. This yields <strong>in</strong>terest<strong>in</strong>g results.<br />
Indian <strong>and</strong> Ch<strong>in</strong>ese students show a strong preference for<br />
science at A-level compared with other ethnic groups. In<br />
contrast, black Caribbean students reveal a strong aversion<br />
to both chemistry <strong>and</strong> physics, even at this early stage.<br />
In degree-level chemistry, most ethnic-m<strong>in</strong>ority groups –<br />
particularly Pakistani <strong>and</strong> Bangladeshi students – are overrepresented<br />
relative to their numbers <strong>in</strong> the undergraduate<br />
population. In physics, however, ethnic-m<strong>in</strong>ority students<br />
tend to be under-represented compared with the white population.<br />
This report also presents data on the ethnic-gender<br />
make-up <strong>of</strong> students <strong>of</strong> chemistry <strong>and</strong> physics. In general,<br />
university chemistry <strong>and</strong> physics is male dom<strong>in</strong>ated,<br />
physics be<strong>in</strong>g particularly so, <strong>and</strong> that pattern is followed<br />
with<strong>in</strong> all ethnic groups. Thus university physics is very much<br />
white <strong>and</strong> male dom<strong>in</strong>ated.<br />
This study presents a detailed statistical picture <strong>of</strong> ethnicgroup<br />
participation <strong>in</strong> chemistry <strong>and</strong> physics, <strong>and</strong> <strong>in</strong> particular<br />
it highlights differences <strong>in</strong> participation between<br />
ethnic groups. The work<strong>in</strong>g assumption, or null hypothesis,<br />
is that, all th<strong>in</strong>gs be<strong>in</strong>g equal, the distribution <strong>of</strong> ethnic<br />
groups will be r<strong>and</strong>om, <strong>and</strong> thus the ethnic make-up <strong>of</strong> a<br />
population at one educational or atta<strong>in</strong>ment level will be<br />
the same as that at the level below.<br />
“Indian <strong>and</strong><br />
Ch<strong>in</strong>ese students<br />
show a strong<br />
preference for<br />
science at A-level<br />
compared with<br />
other ethnic<br />
groups.”<br />
1. Scotl<strong>and</strong> <strong>and</strong> Northern Irel<strong>and</strong><br />
are excluded from the study<br />
ow<strong>in</strong>g to a lack <strong>of</strong> data.<br />
R EPRESENTATION OF E THNIC G ROUPS IN C HEMISTRY AND P HYSICS M AY 2006<br />
1
1: Introduction<br />
2. For more on the socioeconomic<br />
background <strong>of</strong> ethnic groups, see<br />
the Office for National Statistics’<br />
<strong>in</strong>formation on Focus on <strong>Ethnic</strong>ity<br />
& Identity (http://www.statistics.<br />
gov.uk/focuson/ethnicity).<br />
Where differences are found between expected <strong>and</strong> real<br />
participation rates, explanations are not sought for why<br />
choices are made or why some ethnic groups under- or overperform<br />
compared with others.<br />
However, the study does suggest a number <strong>of</strong> reasons<br />
for the propensity <strong>of</strong> ethnic-m<strong>in</strong>ority students to study<br />
chemistry <strong>and</strong> physics.<br />
● The effect <strong>of</strong> peer group Under-representation <strong>of</strong> a<br />
particular ethnic group at an early stage <strong>in</strong> the<br />
educational pipel<strong>in</strong>e (e.g. at A-level) might be selfre<strong>in</strong>forc<strong>in</strong>g<br />
<strong>and</strong> lead to a greater under-representation<br />
at a later stage (e.g. postgraduate study). This merits<br />
further <strong>in</strong>vestigation.<br />
● Family pressure Differences <strong>in</strong> the subject choices<br />
made by different ethnic groups may have their orig<strong>in</strong>s<br />
<strong>in</strong> family attitudes towards education <strong>and</strong> towards<br />
what subjects <strong>and</strong> courses are seen as lead<strong>in</strong>g to<br />
pr<strong>of</strong>essional careers. This family pressure may apply at<br />
any po<strong>in</strong>t so that students may be dissuaded from<br />
cont<strong>in</strong>u<strong>in</strong>g their study <strong>of</strong> an apparently less vocational<br />
subject, such as chemistry or physics, <strong>in</strong> favour <strong>of</strong><br />
further study <strong>in</strong> subjects such as law or IT.<br />
● The socioeconomic composition <strong>of</strong> ethnic-m<strong>in</strong>ority<br />
groups It is well documented that the Indian <strong>and</strong><br />
Ch<strong>in</strong>ese population are more likely to come from<br />
higher socioeconomic groups than other ethnicm<strong>in</strong>ority<br />
groups (Modood et al. 1997; Owen et al.<br />
2003), whereas the opposite is true, for example, for<br />
the Bangladeshi <strong>and</strong> black Caribbean populations.<br />
How the socioeconomic composition <strong>of</strong> particular<br />
ethnic groups affects subject choice, particularly<br />
relat<strong>in</strong>g to academic versus vocational study, would<br />
therefore be a fruitful area for further study. 2<br />
1.3: Structure<br />
The rema<strong>in</strong>der <strong>of</strong> this report is structured as follows: section<br />
2 outl<strong>in</strong>es the key concepts relat<strong>in</strong>g to the leaky<br />
pipel<strong>in</strong>e <strong>and</strong> <strong>in</strong>troduces the notion <strong>of</strong> “potential undergraduate<br />
scientists”; section 3 outl<strong>in</strong>es methodology <strong>and</strong><br />
data sources; <strong>and</strong> section 4 summarises broad f<strong>in</strong>d<strong>in</strong>gs by<br />
ethnic group <strong>in</strong> terms <strong>of</strong> progress along the leaky pipel<strong>in</strong>e.<br />
Sections 5–8 provide a more detailed analysis <strong>of</strong> performance<br />
at GCSE, as well as subject choice <strong>and</strong> atta<strong>in</strong>ment<br />
at A-level, undergraduate level <strong>and</strong> postgraduate level.<br />
Section 9 draws conclusions <strong>and</strong> makes a number <strong>of</strong> recommendations<br />
for areas for further study.<br />
2 R EPRESENTATION OF E THNIC G ROUPS IN C HEMISTRY AND P HYSICS M AY 2006
2: Key concepts<br />
2: Key concepts<br />
2.1: The educational pipel<strong>in</strong>e<br />
This study uses the concept <strong>of</strong> a leaky educational pipel<strong>in</strong>e<br />
to describe the withdrawal <strong>of</strong> students from academic<br />
chemistry <strong>and</strong> physics. It breaks down the route that they<br />
take through academic chemistry <strong>and</strong> physics <strong>in</strong>to a<br />
process <strong>of</strong> six stages, or transition/decision po<strong>in</strong>ts, correspond<strong>in</strong>g<br />
to l<strong>and</strong>mark academic achievements, as shown<br />
<strong>in</strong> table 1. At each po<strong>in</strong>t there is a natural exit where <strong>in</strong>dividuals<br />
may choose to drop science <strong>and</strong> pursue alternative<br />
career choices or studies; or where they may fail to<br />
achieve the qualifications to cont<strong>in</strong>ue <strong>in</strong> science. This study<br />
analyses progress along this pipel<strong>in</strong>e by ethnic group, <strong>and</strong><br />
the propensity <strong>of</strong> <strong>in</strong>dividuals with<strong>in</strong> particular ethnic-m<strong>in</strong>ority<br />
groups to drop out at each po<strong>in</strong>t.<br />
The first transition po<strong>in</strong>t (stage 1) relates to achievement<br />
<strong>in</strong> compulsory school<strong>in</strong>g, specifically ga<strong>in</strong><strong>in</strong>g five or more<br />
GCSEs at grades A*–C. Although not specifically related<br />
to science education, this measure provides a proxy for the<br />
number <strong>of</strong> students who are likely to be able to cont<strong>in</strong>ue<br />
successfully <strong>in</strong> further academic studies. It is a st<strong>and</strong>ard<br />
benchmark <strong>in</strong> terms <strong>of</strong> achievement at school (DfES, 2004)<br />
<strong>and</strong> provides an approximate measure <strong>of</strong> the pool <strong>of</strong> potential<br />
science (chemistry or physics) students at A-level. 3<br />
The second <strong>and</strong> third transition po<strong>in</strong>ts are <strong>in</strong>terconnected<br />
<strong>and</strong> relate to studies <strong>of</strong> chemistry <strong>and</strong> physics at A-level. In<br />
Engl<strong>and</strong> <strong>and</strong> Wales, A-levels still provide the primary route<br />
from science at school <strong>in</strong>to science at university, <strong>and</strong>, <strong>in</strong><br />
the vast majority <strong>of</strong> cases, access to degree courses <strong>in</strong><br />
chemistry <strong>and</strong> physics requires an A-level <strong>in</strong> the same subject<br />
(along with other stipulations, which are discussed<br />
later). The second transition po<strong>in</strong>t is the achievement <strong>of</strong> an<br />
A-level <strong>in</strong> chemistry or physics <strong>and</strong> covers the number <strong>of</strong><br />
students who obta<strong>in</strong> an A-level <strong>in</strong> chemistry or physics at<br />
grade E or above. Those who pass through the third transition<br />
po<strong>in</strong>t are people who are suitably qualified to study<br />
chemistry or physics at university.<br />
Students who pass this hurdle are referred to as “potential<br />
undergraduate scientists” (chemists or physicists).<br />
Different universities have different criteria for students to<br />
enter their courses, so a range <strong>of</strong> alternative def<strong>in</strong>itions <strong>of</strong><br />
potential undergraduate scientists are used. These are discussed<br />
<strong>in</strong> section 2.2.<br />
The last three transition po<strong>in</strong>ts along the pipel<strong>in</strong>e relate<br />
to degree-level studies <strong>in</strong> chemistry <strong>and</strong> physics. The fourth<br />
stage is the study <strong>of</strong> chemistry or physics at undergraduate<br />
level, specifically by those undertak<strong>in</strong>g either a first<br />
degree or an enhanced first degree (usually lead<strong>in</strong>g to an<br />
MChem or MPhys qualification). Analysis <strong>in</strong> this case<br />
focuses on the actual numbers <strong>of</strong> students, compared with<br />
the numbers <strong>of</strong> potential undergraduate scientists. The fifth<br />
stage is the achievement <strong>of</strong> either a first- or upper-secondclass<br />
degree, <strong>and</strong> the study exam<strong>in</strong>es the proportion <strong>of</strong><br />
Table 1: A description <strong>of</strong> the stages along the educational pipel<strong>in</strong>e<br />
Compulsory school<strong>in</strong>g<br />
Stage 1<br />
A-level studies<br />
Stage 2<br />
Stage 3<br />
A-level studies<br />
Stage 4<br />
Stage 5<br />
Stage 6<br />
Achiev<strong>in</strong>g five or more GCSEs at grades A*–C<br />
Achiev<strong>in</strong>g an A-level <strong>in</strong> chemistry or physics<br />
Potential undergraduate scientist: suitably qualified at<br />
A-level to study chemistry or physics at university<br />
undergraduate students <strong>in</strong> chemistry <strong>and</strong> physics who<br />
achieve these degree classes. A prerequisite for doctorallevel<br />
studies <strong>in</strong> chemistry or physics is normally the achievement<br />
<strong>of</strong> a first- or upper-second- degree. Routes <strong>in</strong>to<br />
postgraduate study are complex <strong>and</strong> do not relate precisely<br />
to undergraduate degree classification. However, this measure<br />
provides a close proxy.<br />
The sixth transition po<strong>in</strong>t is choos<strong>in</strong>g to study for a doctorate<br />
<strong>in</strong> chemistry or physics <strong>and</strong> analysis focuses on the<br />
number <strong>of</strong> students who take up the opportunity <strong>of</strong> postgraduate<br />
study compared with those qualified to do so. The<br />
end <strong>of</strong> the educational pipel<strong>in</strong>e is when students emerge<br />
with a doctorate <strong>in</strong> chemistry or physics. 4<br />
2.2: Potential undergraduate scientists<br />
A key aim <strong>of</strong> analys<strong>in</strong>g the <strong>in</strong>formation about A-level studies<br />
is to identify the proportion <strong>of</strong> young people, by ethnic<br />
group, who might be considered potential undergraduate<br />
chemists or physicists. This concept is useful <strong>in</strong> provid<strong>in</strong>g an<br />
ethnic pr<strong>of</strong>ile <strong>of</strong> the pool <strong>of</strong> students from which chemistry<br />
<strong>and</strong> physics departments recruit at undergraduate level. It<br />
Study<strong>in</strong>g undergraduate chemistry or physics<br />
Achiev<strong>in</strong>g a first- or upper-second <strong>in</strong> chemistry or physics<br />
Study<strong>in</strong>g for a doctorate <strong>in</strong> chemistry or physics<br />
Table 2: Three def<strong>in</strong>itions <strong>of</strong> a potential undergraduate chemist/physicist<br />
<strong>Chemistry</strong><br />
<strong>Chemistry</strong> A-level, plus<br />
At least one other science or mathematics<br />
subject at A-level, plus either<br />
UCAS 12<br />
12 UCAS po<strong>in</strong>ts <strong>in</strong> total, with grade C or<br />
above <strong>in</strong> chemistry, or<br />
UCAS 18<br />
18 UCAS po<strong>in</strong>ts <strong>in</strong> total, with grade C or<br />
above <strong>in</strong> chemistry, or<br />
UCAS 24<br />
24 UCAS po<strong>in</strong>ts <strong>in</strong> total, with grade C or<br />
above <strong>in</strong> chemistry<br />
<strong>Physics</strong><br />
<strong>Physics</strong> A-level, plus<br />
A-level mathematics, plus either<br />
UCAS 12<br />
12 UCAS po<strong>in</strong>ts <strong>in</strong> total, with grade C<br />
or above <strong>in</strong> physics, or<br />
UCAS 18<br />
18 UCAS po<strong>in</strong>ts <strong>in</strong> total, with grade C<br />
or above <strong>in</strong> physics, or<br />
UCAS 24<br />
24 UCAS po<strong>in</strong>ts <strong>in</strong> total, with grade C<br />
or above <strong>in</strong> physics<br />
3. The correspondence between<br />
GCSE performance <strong>and</strong> access to<br />
A-level courses is not exact <strong>and</strong><br />
<strong>in</strong>deed varies across schools <strong>and</strong><br />
colleges. The choice <strong>of</strong> this proxy<br />
measure was determ<strong>in</strong>ed<br />
primarily by the availability <strong>of</strong><br />
data.<br />
4. Numbers on taught masters<br />
programmes <strong>in</strong> physical sciences<br />
are generally small compared<br />
with other subject areas, so this<br />
stage is not considered<br />
separately.<br />
R EPRESENTATION OF E THNIC G ROUPS IN C HEMISTRY AND P HYSICS M AY 2006<br />
3
2: Key concepts<br />
5. Note that UCAS <strong>in</strong>troduced a<br />
new po<strong>in</strong>ts system <strong>in</strong> 2004<br />
whereby A = 100 po<strong>in</strong>ts,<br />
B = 80 po<strong>in</strong>ts, C = 60 po<strong>in</strong>ts,<br />
D = 40 po<strong>in</strong>ts <strong>and</strong> E = 20 po<strong>in</strong>ts.<br />
also provides a useful benchmark for measur<strong>in</strong>g the leakage<br />
<strong>of</strong> potential talent from chemistry <strong>and</strong> physics courses<br />
immediately after A-level studies.<br />
The def<strong>in</strong>ition <strong>of</strong> potential undergraduate chemists or<br />
physicists is based on two factors: the choice <strong>of</strong> subjects<br />
at A-level <strong>and</strong> their overall achievement <strong>in</strong> terms <strong>of</strong> grades.<br />
These requirements are summarised <strong>in</strong> table 2, where three<br />
alternative def<strong>in</strong>itions are used, based on the Universities<br />
<strong>and</strong> Colleges Admissions Service (UCAS) po<strong>in</strong>ts system<br />
(i.e. grade A = 10 po<strong>in</strong>ts, grade B = 8 po<strong>in</strong>ts, grade C = 6<br />
po<strong>in</strong>ts, grade D = 4 po<strong>in</strong>ts <strong>and</strong> grade E = 2 po<strong>in</strong>ts). 5 The<br />
requirement to get onto a chemistry or physics undergraduate<br />
degree course is not clear cut <strong>and</strong> varies greatly across<br />
universities, so three different po<strong>in</strong>ts criteria are used:<br />
“UCAS 12” (most lenient), “UCAS 18” <strong>and</strong> “UCAS 24”<br />
(strictest). These are based on the range <strong>of</strong> typical entry<br />
requirements at the time <strong>of</strong> writ<strong>in</strong>g.<br />
Note that the requirements to study chemistry <strong>in</strong>clude<br />
the study <strong>of</strong> chemistry plus one other science (possibly<br />
mathematics) at A-level, whereas the requirements for<br />
study<strong>in</strong>g physics are stricter, with a requirement for physics<br />
plus mathematics at A-level.<br />
4 R EPRESENTATION OF E THNIC G ROUPS IN C HEMISTRY AND P HYSICS M AY 2006
3: Methodology<br />
3: Methodology<br />
The purpose <strong>of</strong> this study is to quantify numbers <strong>of</strong> students<br />
at each stage <strong>of</strong> the pipel<strong>in</strong>e described <strong>in</strong> section 2. This is<br />
done by ethnic group based on a notional cohort <strong>of</strong> schoolleavers,<br />
where the size <strong>of</strong> the cohort is normalised to<br />
10 000 <strong>in</strong> each case for ease <strong>of</strong> comparison. Numbers at<br />
each stage <strong>of</strong> the pipel<strong>in</strong>e are established based on three<br />
separate data sources:<br />
● The DfES’ National Curriculum Assessment data on<br />
achievement at GCSE by pupil characteristics are<br />
used. These have census coverage <strong>and</strong> <strong>in</strong>clude all<br />
students <strong>in</strong> Engl<strong>and</strong>, with detailed analysis by pupil<br />
ethnicity <strong>and</strong> gender.<br />
● Data on achievement at A-level are obta<strong>in</strong>ed from<br />
successive cohorts <strong>of</strong> the YCS <strong>of</strong> Engl<strong>and</strong> <strong>and</strong> Wales.<br />
This survey also provides estimates <strong>of</strong> the proportion <strong>of</strong><br />
young people who are study<strong>in</strong>g on degree courses at<br />
age 18/19, which gives a base from which<br />
achievement at A-level can be l<strong>in</strong>ked with numbers on<br />
degree courses.<br />
● Student numbers on degree courses are based on<br />
HESA data. These provide a comprehensive picture <strong>of</strong><br />
undergraduate <strong>and</strong> postgraduate study by subject <strong>and</strong><br />
<strong>in</strong>formation on degree classification. For consistency,<br />
analysis <strong>of</strong> these data sets is restricted to students<br />
domiciled <strong>in</strong> Engl<strong>and</strong> <strong>and</strong> Wales.<br />
In addition to these sources, the LFS is utilised to provide<br />
further <strong>in</strong>formation about ethnic populations <strong>and</strong> economic<br />
activity. Each source is described <strong>in</strong> more detail<br />
below.<br />
3.1: Data sources<br />
3.1.1: National Curriculum Assessment<br />
Data about achievement at GCSE by pupil characteristics<br />
are available from the DfES. The DfES publishes annual<br />
National Curriculum Assessment data, which provide<br />
detailed <strong>in</strong>formation about the performance <strong>of</strong> pupils <strong>in</strong><br />
GCSE exam<strong>in</strong>ations, as well as <strong>in</strong>formation about atta<strong>in</strong>ment<br />
at GNVQ <strong>and</strong> at KS levels (<strong>in</strong>clud<strong>in</strong>g KS2 <strong>and</strong> KS3 <strong>in</strong><br />
science). These data have census coverage with detailed<br />
analysis by pupil ethnicity <strong>and</strong> gender, as well as other<br />
dimensions. Whereas data throughout the rest <strong>of</strong> this study<br />
relate to Engl<strong>and</strong> <strong>and</strong> Wales, 6 the proportion <strong>of</strong> pupils<br />
achiev<strong>in</strong>g five or more GCSEs at grade A*–C (i.e. the first<br />
stage <strong>of</strong> the pipel<strong>in</strong>e) is based on data for Engl<strong>and</strong> only.<br />
It is unlikely that this biases the results unless pupil<br />
achievement by ethnicity <strong>in</strong> Wales differs significantly from<br />
that <strong>in</strong> Engl<strong>and</strong>. However, it should be noted that students<br />
<strong>in</strong> Wales are much more likely to do A-level physics than<br />
those <strong>in</strong> Engl<strong>and</strong>.<br />
The National Curriculum Assessment data used <strong>in</strong> this<br />
study relate to pupils complet<strong>in</strong>g their GCSE studies <strong>in</strong><br />
2002, <strong>of</strong> whom there were 571 750 (<strong>of</strong> which 64 900 were<br />
from non-white ethnic-m<strong>in</strong>ority groups).<br />
3.1.2: Youth Cohort Study<br />
To establish a detailed picture <strong>of</strong> study at A-level, survey<br />
data must be relied on, <strong>and</strong> for Engl<strong>and</strong> <strong>and</strong> Wales these<br />
derive pr<strong>in</strong>cipally from the YCS. 7 At the time <strong>of</strong> writ<strong>in</strong>g the<br />
DfES <strong>and</strong> the Office for National Statistics (ONS) do not<br />
publish census data about A-level achievement by ethnic<br />
group.<br />
The YCS is a postal survey <strong>of</strong> approximately 10 000<br />
school-leavers <strong>in</strong> Engl<strong>and</strong> <strong>and</strong> Wales, with new cohorts<br />
<strong>in</strong>troduced biannually. The survey is conducted on a voluntary<br />
response basis, <strong>and</strong> responses are weighted by the<br />
ONS to correct for bias <strong>in</strong> sample selection. Data are collected<br />
from a representative sample <strong>of</strong> young people.<br />
Individuals are <strong>in</strong>itially sampled <strong>in</strong> the spr<strong>in</strong>g after complet<strong>in</strong>g<br />
their compulsory education (sweep 1: at which time<br />
they are 16/17); they are revisited two years subsequently<br />
(sweep 2: at which time they are 18/19).<br />
The YCS records <strong>in</strong>formation about past educational<br />
achievement <strong>and</strong> current studies, as well as data relat<strong>in</strong>g to<br />
labour-market participation.<br />
The analysis <strong>in</strong> this report utilises data from the second<br />
sweep <strong>of</strong> the YCS, <strong>in</strong> which <strong>in</strong>dividuals are questioned<br />
about their current academic studies <strong>and</strong> past academic<br />
achievements subsequent to complet<strong>in</strong>g compulsory education<br />
<strong>in</strong> year 11. This <strong>in</strong>cludes details <strong>of</strong> A-level studies,<br />
<strong>in</strong>clud<strong>in</strong>g subjects taken <strong>and</strong> grades achieved.<br />
The survey is biannual <strong>and</strong> the four most recently available<br />
cohorts <strong>of</strong> the survey are utilised from 1996 (cohort 7)<br />
to 2002 (cohort 10). The <strong>in</strong>formation conta<strong>in</strong>ed <strong>in</strong> the YCS<br />
<strong>in</strong>cludes academic achievements at 18/19 years, two<br />
years after the completion <strong>of</strong> academic study. 8 This <strong>in</strong>formation<br />
is used to analyse achievement <strong>in</strong> chemistry <strong>and</strong><br />
physics at A-level, particularly to establish proportions, by<br />
ethnic group, at stages 2 <strong>and</strong> 3 <strong>of</strong> the pipel<strong>in</strong>e.<br />
The ma<strong>in</strong> drawback <strong>of</strong> us<strong>in</strong>g survey data (as opposed to<br />
census data) is that sample numbers are fairly small, especially<br />
for non-white ethnic-m<strong>in</strong>ority groups. Merg<strong>in</strong>g successive<br />
cohorts <strong>of</strong> the survey from 1996 to 2002 (i.e. the<br />
most recent four data sets) yields the sample sizes reported<br />
<strong>in</strong> table 3.<br />
Note that ow<strong>in</strong>g to sampl<strong>in</strong>g <strong>of</strong> students <strong>in</strong> the YCS, figures<br />
reported at stages 2 <strong>and</strong> 3 are subject to sampl<strong>in</strong>g<br />
error. St<strong>and</strong>ard errors are thus reported where pert<strong>in</strong>ent.<br />
3.1.3: Higher Education Statistics Agency<br />
HESA is the central source for higher-education statistics<br />
<strong>in</strong> the UK. It collects census data on an annual basis from<br />
6. Data for Scotl<strong>and</strong> <strong>and</strong> Northern<br />
Irel<strong>and</strong> are more problematic. In<br />
particular, these regions <strong>of</strong> the UK<br />
are not <strong>in</strong>cluded <strong>in</strong> the YCS. This<br />
means that the focus is on<br />
Engl<strong>and</strong> <strong>and</strong> Wales.<br />
7. Alternative sources <strong>of</strong> data<br />
<strong>in</strong>clude the National Child<br />
Development Study, the British<br />
Household Panel Study <strong>and</strong> the<br />
Longitud<strong>in</strong>al Birth Cohort Studies.<br />
However, these sources are<br />
generally <strong>in</strong>ferior to the YCS <strong>in</strong><br />
terms <strong>of</strong> detailed <strong>in</strong>formation<br />
about studies <strong>and</strong> samples by<br />
ethnic group.<br />
8. By this po<strong>in</strong>t, most full-time<br />
students have completed their<br />
A-levels <strong>and</strong> are on the first year<br />
<strong>of</strong> their undergraduate degree<br />
programmes.<br />
R EPRESENTATION OF E THNIC G ROUPS IN C HEMISTRY AND P HYSICS M AY 2006<br />
5
3: Methodology<br />
9. HESA data are also available<br />
for 1996/1997 <strong>and</strong><br />
2001/2002, <strong>and</strong> these are used<br />
for comparison, where<br />
appropriate.<br />
10. This analysis was undertaken<br />
as an <strong>in</strong>vestigative data exercise<br />
comb<strong>in</strong><strong>in</strong>g Asian <strong>and</strong> black<br />
groups as broad ethnic<br />
categories. Even at this very<br />
coarse level <strong>of</strong> aggregation,<br />
sample numbers were<br />
prohibitively small. An analysis <strong>of</strong><br />
broad employment patterns for<br />
the populations as a whole is<br />
available from the authors on<br />
request.<br />
Table 3: Sample numbers <strong>in</strong> the YCS, based on<br />
merged cohorts 1996–2002<br />
<strong>Ethnic</strong>ity<br />
white<br />
black Caribbean<br />
black African<br />
Indian<br />
Pakistani<br />
Bangladeshi<br />
Ch<strong>in</strong>ese<br />
mixed race<br />
other<br />
Total<br />
Comb<strong>in</strong>ed YCS sample<br />
28 704<br />
140<br />
115<br />
874<br />
546<br />
229<br />
189<br />
249<br />
527<br />
31 573<br />
Note: In cohort 7, a detailed ethnic breakdown for the black population is<br />
not available. Similarly, numbers for mixed race <strong>and</strong> other m<strong>in</strong>orities are<br />
comb<strong>in</strong>ed for this cohort. In these <strong>in</strong>stances, totals are given for cohorts 8,<br />
9 <strong>and</strong> 10 only.<br />
Source: Youth Cohort Study<br />
universities <strong>and</strong> from other higher-education <strong>in</strong>stitutions,<br />
<strong>in</strong>clud<strong>in</strong>g details relat<strong>in</strong>g to current students, staff <strong>and</strong> <strong>in</strong>formation<br />
about recent leavers. Two relevant data sets are<br />
utilised <strong>in</strong> this study:<br />
● The student data set This is an annual census <strong>of</strong><br />
students undertak<strong>in</strong>g studies at UK universities at the<br />
time <strong>of</strong> survey, <strong>in</strong>clud<strong>in</strong>g students on both<br />
undergraduate <strong>and</strong> postgraduate courses.<br />
● First dest<strong>in</strong>ation data set This is an annual census <strong>of</strong><br />
the activities <strong>of</strong> graduates approximately six months<br />
after complet<strong>in</strong>g their courses, <strong>in</strong>clud<strong>in</strong>g details<br />
regard<strong>in</strong>g further study <strong>and</strong> economic activity. This<br />
data set provides <strong>in</strong>formation about the degree<br />
classification obta<strong>in</strong>ed by students on the completion<br />
<strong>of</strong> their undergraduate studies.<br />
HESA student data set for the academic year<br />
2002/2003 are used to analyse student numbers at both<br />
undergraduate <strong>and</strong> postgraduate level. 9 Primarily this is<br />
done <strong>in</strong> relation to chemistry <strong>and</strong> physics, but the data also<br />
provide <strong>in</strong>formation about student choice with regard to<br />
alternative areas <strong>of</strong> study (e.g. other science subjects or<br />
alternative vocational routes, such as medic<strong>in</strong>e-related<br />
subjects, bus<strong>in</strong>ess <strong>and</strong> law). The first dest<strong>in</strong>ation data set<br />
is analysed to exam<strong>in</strong>e achievement by degree classification<br />
<strong>and</strong> patterns <strong>of</strong> further study by ethnic group, based<br />
on data for the academic year 2001/2002.<br />
F<strong>in</strong>ally, note that to achieve consistency with GCSE <strong>and</strong><br />
A-level data, the analysis <strong>of</strong> HESA data is restricted to students<br />
domiciled <strong>in</strong> Engl<strong>and</strong> <strong>and</strong> Wales.<br />
3.1.4: Labour Force Survey<br />
The LFS is a sample survey <strong>of</strong> households liv<strong>in</strong>g at private<br />
addresses <strong>in</strong> the UK. The surveys are conducted on a quarterly<br />
basis <strong>and</strong> provide data about approximately 65 000<br />
employed people per quarter. The survey is conducted on<br />
a voluntary response basis, <strong>and</strong> responses are weighted<br />
by the ONS to correct for bias <strong>in</strong> sample selection.<br />
Information is collected from one household member (face<br />
to face <strong>in</strong>itially, then by telephone <strong>in</strong>terviews) about the<br />
education, tra<strong>in</strong><strong>in</strong>g <strong>and</strong> employment <strong>of</strong> all household members,<br />
<strong>and</strong> each household <strong>in</strong> the sample is surveyed for five<br />
successive quarters subsequent to <strong>in</strong>itial contact. The survey<br />
also records basic demographic details, <strong>in</strong>clud<strong>in</strong>g ethnicity<br />
<strong>and</strong> gender. The LFS is used <strong>in</strong> this study to provide<br />
subsidiary <strong>in</strong>formation about population sizes <strong>and</strong> economic<br />
activity.<br />
The other potential use <strong>of</strong> LFS data <strong>in</strong> relation to employment<br />
dest<strong>in</strong>ations <strong>of</strong> chemistry <strong>and</strong> physics graduates (i.e.<br />
their occupations <strong>and</strong> <strong>in</strong>dustry dest<strong>in</strong>ations) is not pursued<br />
<strong>in</strong> this study. This is because <strong>of</strong> the very small sample numbers<br />
encountered when analys<strong>in</strong>g ethnic-m<strong>in</strong>ority graduates.<br />
10<br />
3.2: L<strong>in</strong>k<strong>in</strong>g Youth Cohort Study <strong>and</strong> Higher<br />
Education Statistics data sets<br />
A crucial element <strong>of</strong> the methodology <strong>of</strong> construct<strong>in</strong>g the<br />
educational pipel<strong>in</strong>e outl<strong>in</strong>ed <strong>in</strong> table 1 is l<strong>in</strong>k<strong>in</strong>g YCS <strong>and</strong><br />
HESA data sets. The YCS provides detailed <strong>in</strong>formation<br />
about the proportion <strong>of</strong> young people obta<strong>in</strong><strong>in</strong>g A-level<br />
qualifications based on a survey sample. In contrast, HESA<br />
data provide estimates <strong>of</strong> the actual number <strong>of</strong> degree students<br />
based on census data. In l<strong>in</strong>k<strong>in</strong>g these data sets it is<br />
useful to estimate the proportions <strong>of</strong> a notional cohort <strong>of</strong><br />
young people study<strong>in</strong>g chemistry <strong>and</strong> physics at degree<br />
level (stages 4–6).<br />
To comb<strong>in</strong>e the data sets, the follow<strong>in</strong>g procedure is<br />
used. A proportion <strong>of</strong> all school-leavers who are undertak<strong>in</strong>g<br />
degree studies at age 18/19 is estimated based on<br />
sample data from the YCS. This figure is <strong>in</strong>flated to take <strong>in</strong>to<br />
account that not all students start degree studies <strong>in</strong> the<br />
September two years after complet<strong>in</strong>g compulsory school<strong>in</strong>g,<br />
when they are 18/19. Hav<strong>in</strong>g established proportions<br />
<strong>of</strong> young people <strong>in</strong> undergraduate degree studies by ethnic<br />
group, HESA data are used to track populations by ethnic<br />
group, <strong>in</strong>to specific subject areas (i.e. chemistry <strong>and</strong><br />
physics) at undergraduate level, <strong>and</strong> thereafter through to<br />
postgraduate study.<br />
The second stage <strong>of</strong> this process provides the crucial l<strong>in</strong>k<br />
between YCS <strong>and</strong> HESA data sets. This is achieved by reconcil<strong>in</strong>g<br />
aggregate numbers <strong>in</strong> undergraduate studies from<br />
HESA, with aggregate estimates <strong>of</strong> student numbers based<br />
on YCS <strong>and</strong> LFS data. This can be illustrated with reference<br />
to the aggregate figures for Engl<strong>and</strong> <strong>and</strong> Wales. (More<br />
detailed figures can be found <strong>in</strong> appendices 1a <strong>and</strong> 1b,<br />
where estimates <strong>of</strong> aggregate numbers at each <strong>of</strong> the six<br />
stages <strong>of</strong> the pipel<strong>in</strong>e are presented.)<br />
Based on HESA data from 2002/2003, there are<br />
241 575 first-year undergraduate degree students study<strong>in</strong>g<br />
for first degrees or enhanced first degrees who are domiciled<br />
<strong>in</strong> Engl<strong>and</strong> <strong>and</strong> Wales. Compar<strong>in</strong>g this figure with the<br />
number <strong>of</strong> young people <strong>of</strong> school-leav<strong>in</strong>g age estimated<br />
from spr<strong>in</strong>g 2004, the LFS – which gives the size <strong>of</strong> the<br />
Engl<strong>and</strong> <strong>and</strong> Wales school-leav<strong>in</strong>g cohort as approximately<br />
6 R EPRESENTATION OF E THNIC G ROUPS IN C HEMISTRY AND P HYSICS M AY 2006
3: Methodology<br />
665 000 – leads to the <strong>in</strong>ference that 36.3% <strong>of</strong> the schoolleav<strong>in</strong>g<br />
cohort undertake undergraduate studies at some<br />
stage. 11 However, us<strong>in</strong>g data from the YCS, a lower percentage<br />
<strong>of</strong> 21.7% is obta<strong>in</strong>ed. 12<br />
From this it is <strong>in</strong>ferred that only 59.8% <strong>of</strong> undergraduates<br />
enter courses aged 18/19 (two years after complet<strong>in</strong>g<br />
compulsory school<strong>in</strong>g). This figure is used to adjust estimates<br />
<strong>of</strong> undergraduate participation <strong>in</strong> the YCS. 13<br />
3.3: Statistical significance<br />
The study aims to look for statistically significant differences<br />
<strong>in</strong> participation <strong>and</strong> achievement between ethnic groups.<br />
Statistical tests are therefore used to look for statistically<br />
significant patterns <strong>in</strong> the data. Differences <strong>in</strong> participation<br />
<strong>and</strong>/or achievement are identified at each stage by ethnicity,<br />
<strong>and</strong> where appropriate by gender, <strong>and</strong> statistically<br />
significant differences between groups are identified. The<br />
nature <strong>of</strong> the data sets used <strong>in</strong> this study varies, <strong>and</strong> therefore<br />
so do the statistical tests.<br />
YCS data are a sample survey <strong>and</strong> therefore estimates<br />
from these (i.e. proportions <strong>of</strong> students achiev<strong>in</strong>g a particular<br />
outcome by ethnic group) are subject to sampl<strong>in</strong>g error.<br />
Moreover, for some <strong>of</strong> the smaller ethnic groups, such as<br />
Bangladeshi <strong>and</strong> Ch<strong>in</strong>ese students, these sampl<strong>in</strong>g errors<br />
can potentially be quite large. When us<strong>in</strong>g this data set,<br />
significance tests are therefore performed, based on<br />
achievement relative to the white population <strong>and</strong> us<strong>in</strong>g a<br />
series <strong>of</strong> two-sample T-tests, to compare ethnic groups with<br />
the white population <strong>in</strong> a pairwise fashion. (This was<br />
applied, for example, when compar<strong>in</strong>g the proportion <strong>of</strong><br />
Indian students versus the proportion <strong>of</strong> white students<br />
who achieve an A-level <strong>in</strong> chemistry.)<br />
These tests are based on the null hypothesis that there is<br />
no difference between ethnic groups, thus the results <strong>of</strong><br />
the statistical tests are used either to accept or to reject<br />
this hypothesis.<br />
The DfES <strong>and</strong> HESA data sets are both census data (data<br />
are collected from the whole populations <strong>and</strong> not from samples<br />
<strong>of</strong> those populations) <strong>and</strong> are therefore not subject to<br />
the usual sampl<strong>in</strong>g error. Us<strong>in</strong>g these data sets, distribution<br />
patterns <strong>of</strong> ethnic groups among subjects are compared<br />
with what might be expected if there were no<br />
systematic ethnicity/gender effects on self-selection <strong>in</strong>to<br />
subject areas.<br />
This is done us<strong>in</strong>g a series <strong>of</strong> chi-squared tests, which<br />
compare actual <strong>and</strong> expected student numbers based on<br />
the null hypothesis that there is a r<strong>and</strong>om allocation <strong>of</strong> students<br />
to subject areas by ethnic group (<strong>and</strong> therefore that<br />
participation/achievement rates will be equal), <strong>and</strong> this<br />
hypothesis is either accepted or rejected.<br />
St<strong>and</strong>ard errors are presented <strong>in</strong> the appendices, where<br />
appropriate, <strong>and</strong> reference is also made to statistical significance<br />
<strong>in</strong> the text. Throughout, significance is based on<br />
rejection <strong>of</strong> the null hypothesis at the 5% error level. More<br />
detail about the significance tests used is presented <strong>in</strong><br />
appendix 10.<br />
11. Implicit assumptions are<br />
made here that the school-leaver<br />
cohort is constant over time, as is<br />
the propensity to stay on <strong>in</strong> higher<br />
education.<br />
12. This smaller figure may also,<br />
<strong>in</strong> part, reflect the upward trend <strong>in</strong><br />
undergraduate numbers <strong>in</strong> the<br />
period 1996–2002.<br />
13. The adjustment is based on<br />
multiply<strong>in</strong>g the orig<strong>in</strong>al proportion<br />
by a multiple <strong>of</strong> 1/0.598. In<br />
essence, this ensures that the<br />
estimates <strong>of</strong> the aggregate<br />
number <strong>of</strong> undergraduate<br />
students based on the school<br />
cohorts <strong>and</strong> the YCS (appendix 1)<br />
are equal to the aggregate<br />
number <strong>of</strong> undergraduate<br />
students <strong>in</strong> HESA data.<br />
R EPRESENTATION OF E THNIC G ROUPS IN C HEMISTRY AND P HYSICS M AY 2006<br />
7
4: The educational pipel<strong>in</strong>e<br />
4: The educational pipel<strong>in</strong>e<br />
“The black<br />
Caribbean ethnic<br />
group has the<br />
lowest overall<br />
survival rate <strong>in</strong><br />
academic<br />
chemistry <strong>and</strong><br />
physics.”<br />
Fig. 1 (opposite):<br />
Overall survival rates<br />
<strong>and</strong> stage survival rates<br />
<strong>in</strong> academic chemistry.<br />
14. For a general guide to<br />
def<strong>in</strong>itions <strong>of</strong> ethnic groups, see<br />
http://www.statistics.gov.uk/<br />
about/ethnic_group_statistics/<br />
downloads/ethnic_group_<br />
statistics.pdf<br />
Note: the way <strong>in</strong> which “other”<br />
<strong>and</strong> “mixed” ethnicity are def<strong>in</strong>ed<br />
differs <strong>in</strong> the YCS <strong>and</strong> HESA, mak<strong>in</strong>g<br />
any l<strong>in</strong>k<strong>in</strong>g <strong>of</strong> the two data<br />
sets impracticable for these<br />
groups.<br />
15. The over- or underrepresentation<br />
is calculated us<strong>in</strong>g<br />
the formula 100((overall survival<br />
rate <strong>of</strong> ethnic group at stage X/<br />
overall survival rate <strong>of</strong> white group<br />
at stage X)–1).<br />
16. These percentages can be<br />
thought <strong>of</strong> as quasi-probabilities<br />
(i.e. the probability <strong>of</strong> a<br />
representative <strong>in</strong>dividual<br />
rema<strong>in</strong><strong>in</strong>g <strong>in</strong> academic chemistry<br />
or physics at each stage). Note<br />
also that the rate <strong>of</strong> attrition can<br />
be calculated on this basis as<br />
100% m<strong>in</strong>us the rate <strong>of</strong> retention.<br />
The metaphor <strong>of</strong> the leaky educational pipel<strong>in</strong>e is now summarised<br />
for each <strong>of</strong> the ma<strong>in</strong> ethnic groups. 14 The population<br />
mov<strong>in</strong>g through the pipel<strong>in</strong>e start<strong>in</strong>g with a (notional)<br />
school-leav<strong>in</strong>g cohort gradually dim<strong>in</strong>ishes <strong>in</strong> mov<strong>in</strong>g from<br />
stages 1 to 6. The retention/attrition at each stage is the<br />
key consideration <strong>in</strong> assess<strong>in</strong>g when <strong>and</strong> how students<br />
“drop out” <strong>of</strong> academic studies <strong>in</strong> chemistry <strong>and</strong> physics, by<br />
ethnic group. The data are presented <strong>in</strong> three different ways:<br />
● Progress through the pipel<strong>in</strong>e is summarised by<br />
report<strong>in</strong>g the number <strong>of</strong> students rema<strong>in</strong><strong>in</strong>g, based on<br />
a notional cohort <strong>of</strong> 10 000 school-leavers per ethnic<br />
group. This figure gives the overall survival rate.<br />
● At each stage the overall over- or under-representation<br />
<strong>of</strong> each ethnic-m<strong>in</strong>ority group relative to the majority<br />
white population is reported. In other words,<br />
comparisons are reported between the overall survival<br />
rate <strong>of</strong> the majority white population <strong>and</strong> the overall<br />
survival rate <strong>of</strong> a particular ethnic group. 15<br />
● For each stage the proportion <strong>of</strong> each group mov<strong>in</strong>g<br />
through from the previous stage is expressed as a<br />
percentage based on the number <strong>of</strong> people surviv<strong>in</strong>g<br />
relative to that at the previous stage. 16 This is the stage<br />
survival rate <strong>in</strong> mov<strong>in</strong>g from one stage to the next.<br />
Figure 1 illustrates the leakage <strong>in</strong> chemistry, show<strong>in</strong>g the<br />
survival rates <strong>in</strong> chemistry based on a notional cohort <strong>of</strong><br />
10 000 school-leavers per ethnic group, as well as the rates<br />
<strong>of</strong> retention at each stage. Similarly, figure 2 describes the<br />
pipel<strong>in</strong>e for studies <strong>in</strong> physics.<br />
The emerg<strong>in</strong>g picture is quite complex, so the pipel<strong>in</strong>e is<br />
best described by means <strong>of</strong> an example based on the black<br />
Caribbean school-leavers. This group has the lowest overall<br />
survival rate <strong>in</strong> academic chemistry <strong>and</strong> physics, with<br />
only one student <strong>in</strong> 10 000 expected to undertake a doctorate<br />
degree <strong>in</strong> chemistry <strong>and</strong> fewer than one student <strong>in</strong><br />
10 000 expected to undertake a doctorate degree <strong>in</strong><br />
physics. The key question is therefore: where are the ma<strong>in</strong><br />
attrition po<strong>in</strong>ts for this group?<br />
This question is answered with reference to the white<br />
population (which can be used as a benchmark).<br />
First, black Caribbean students on average are much less<br />
likely to achieve five or more GCSEs at grade A*–C than<br />
their white counterparts. Only 29.2% <strong>of</strong> black Caribbean<br />
students achieve this benchmark, whereas the correspond<strong>in</strong>g<br />
figure for Engl<strong>and</strong>- <strong>and</strong> Wales-domiciled white<br />
students is 49.5%. There is an overall under-representation<br />
<strong>of</strong> black Caribbean students at this stage (41%) relative<br />
to the white majority group. In this <strong>in</strong>stance it is likely to<br />
be the result <strong>of</strong> external <strong>in</strong>fluences that have little to do with<br />
the study <strong>of</strong> science, such as socioeconomic factors, experiences<br />
<strong>of</strong> compulsory school<strong>in</strong>g <strong>and</strong> parental <strong>in</strong>put.<br />
Although these factors may be exogenous as far as the science<br />
community is concerned, many black Caribbean students<br />
fall at this first hurdle <strong>and</strong> therefore never have the<br />
opportunity to make positive choices regard<strong>in</strong>g the study<br />
<strong>of</strong> science. In this respect, lack <strong>of</strong> atta<strong>in</strong>ment at GCSE level<br />
alone potentially goes a long way to expla<strong>in</strong><strong>in</strong>g the lack <strong>of</strong><br />
black Caribbean scientists at university.<br />
There appear to be two other key po<strong>in</strong>ts <strong>of</strong> attrition for<br />
black Caribbean students. The first is <strong>in</strong> choos<strong>in</strong>g A-levels.<br />
Figures 1 <strong>and</strong> 2 show that black Caribbean students are<br />
much less likely to take A-level chemistry or physics than<br />
white students. Of the population <strong>of</strong> white students achiev<strong>in</strong>g<br />
five or more GCSEs at grade A*–C, approximately 10%<br />
go on to do an A-level <strong>in</strong> chemistry or physics. These figures<br />
compare with only 6% (chemistry) <strong>and</strong> 3% (physics) for the<br />
black Caribbean population. Black Caribbean students<br />
appear to f<strong>in</strong>d physical science unattractive even when<br />
choos<strong>in</strong>g A-levels.<br />
There is also a high level <strong>of</strong> attrition dur<strong>in</strong>g undergraduate<br />
studies. Black Caribbean students are much less likely to<br />
achieve a first- or upper-second-class degree than their<br />
white counterparts. The data show that this observation<br />
also applies <strong>in</strong> most other subject areas. For white students,<br />
53% <strong>of</strong> those study<strong>in</strong>g chemistry <strong>and</strong> 54% <strong>of</strong> those study<strong>in</strong>g<br />
physics obta<strong>in</strong> a first- or upper-second-class degree.<br />
This compares with 36% <strong>and</strong> 29% respectively for black<br />
Caribbean students. Moreover, <strong>of</strong> the students obta<strong>in</strong><strong>in</strong>g<br />
a first or upper-second, a smaller proportion <strong>of</strong> black<br />
Caribbean students go on to study chemistry or physics at<br />
doctorate level. This suggests that, even at university level,<br />
black Caribbean students appear to be deterred compared<br />
with their white peers.<br />
Complex picture<br />
The picture <strong>of</strong> retention/attrition across all ethnic groups<br />
is quite complex. Along with black Caribbean students,<br />
black African, Pakistani <strong>and</strong> Bangladeshi students are also<br />
less likely to achieve five or more GCSEs at grade A*–C<br />
compared with their white counterparts.<br />
Among ethnic-m<strong>in</strong>ority groups, only black Caribbean students<br />
appear to have a particular aversion to chemistry <strong>and</strong><br />
physics at A-level.<br />
This po<strong>in</strong>t is illustrated by compar<strong>in</strong>g the stage survival<br />
rates for black Caribbean students with those for other<br />
groups. The cumulative effects <strong>of</strong> small numbers <strong>of</strong> black<br />
Caribbean students achiev<strong>in</strong>g five GCSEs at grades A*–C,<br />
<strong>and</strong> a low take-up <strong>of</strong> A-level chemistry <strong>and</strong> physics, is illustrated<br />
by the overall under-representation <strong>of</strong> black<br />
Caribbean students at stage 2 <strong>of</strong> the educational pipel<strong>in</strong>e<br />
(–66% for chemistry; –83% for physics).<br />
8 R EPRESENTATION OF E THNIC G ROUPS IN C HEMISTRY AND P HYSICS M AY 2006
4: The educational pipel<strong>in</strong>e<br />
Stage 1<br />
five GCSEs at<br />
grades A*–C<br />
Stage 2<br />
A-level<br />
chemistry<br />
Stage 3<br />
potential chemistry<br />
undergraduate<br />
(UCAS 18)<br />
Stage 4<br />
undergraduate<br />
chemistry<br />
Stage 5<br />
first or uppersecond<br />
degree<br />
<strong>in</strong> chemistry<br />
Stage 6<br />
study<strong>in</strong>g for a<br />
doctorate <strong>in</strong><br />
chemistry<br />
white<br />
students<br />
leav<strong>in</strong>g formal chemistry education<br />
10000<br />
4950 510 331 42 22 15<br />
50%<br />
10%<br />
65%<br />
13%<br />
53% 66%<br />
black Caribbean<br />
students<br />
leav<strong>in</strong>g formal chemistry education<br />
10000<br />
2920<br />
–41%<br />
173<br />
–66%<br />
69<br />
–79%<br />
17<br />
–59%<br />
6<br />
–72%<br />
1<br />
–90%<br />
29%<br />
6%<br />
40%<br />
25%<br />
36% 24%<br />
black African<br />
students<br />
leav<strong>in</strong>g formal chemistry education<br />
10000<br />
3740<br />
–24%<br />
768<br />
+51%<br />
533<br />
+61%<br />
43<br />
+2%<br />
12<br />
–48%<br />
3<br />
–17%<br />
37%<br />
21%<br />
69%<br />
8%<br />
27% 22%<br />
Indian<br />
students<br />
leav<strong>in</strong>g formal chemistry education<br />
10000<br />
6260<br />
+27%<br />
1198<br />
+135%<br />
776<br />
+134%<br />
83<br />
+96%<br />
32<br />
+42%<br />
13<br />
–10%<br />
Pakistani<br />
students<br />
63%<br />
19%<br />
65%<br />
leav<strong>in</strong>g formal chemistry education<br />
11%<br />
39% 41%<br />
10000<br />
3850<br />
–22%<br />
587<br />
+15%<br />
379<br />
+15%<br />
54<br />
+28%<br />
19<br />
–16%<br />
5<br />
–67%<br />
39%<br />
15%<br />
65%<br />
14%<br />
35% 26%<br />
Bangladeshi<br />
students<br />
leav<strong>in</strong>g formal chemistry education<br />
10000<br />
4330<br />
–12%<br />
674<br />
+32%<br />
379<br />
+15%<br />
48<br />
+13%<br />
17<br />
–23%<br />
4<br />
+25%<br />
43%<br />
16%<br />
56%<br />
13%<br />
36% 22%<br />
Ch<strong>in</strong>ese<br />
students<br />
leav<strong>in</strong>g formal chemistry education<br />
10000<br />
7010<br />
+42%<br />
1459<br />
+186%<br />
1187<br />
+259%<br />
137<br />
+224%<br />
58<br />
+158%<br />
30<br />
+101%<br />
70%<br />
21%<br />
81%<br />
12%<br />
42%<br />
51%<br />
overall over-or under-representation<br />
<strong>of</strong> ethnic group relative to the white<br />
population at the same stage<br />
7010<br />
+42%<br />
1459<br />
+186%<br />
“overall survival rate” at stage based on a<br />
notional cohort <strong>of</strong> 10000 students <strong>of</strong> each<br />
ethnic group<br />
21%<br />
“stage survival rate”: percentage <strong>of</strong> students<br />
mov<strong>in</strong>g from one stage to the next<br />
R EPRESENTATION OF E THNIC G ROUPS IN C HEMISTRY AND P HYSICS M AY 2006<br />
9
4: The educational pipel<strong>in</strong>e<br />
Stage 1<br />
five GCSEs at<br />
grades A*–C<br />
Stage 2<br />
A-level<br />
physics<br />
Stage 3<br />
potential physics<br />
undergraduate<br />
(UCAS 18)<br />
Stage 4<br />
undergraduate<br />
physics<br />
Stage 5<br />
first or uppersecond<br />
degree<br />
<strong>in</strong> physics<br />
Stage 6<br />
study<strong>in</strong>g for a<br />
doctorate <strong>in</strong><br />
physics<br />
white<br />
students<br />
leav<strong>in</strong>g formal physics education<br />
10000<br />
4950 471 250 32 17 8<br />
50%<br />
10%<br />
53%<br />
13%<br />
54% 49%<br />
black Caribbean<br />
students<br />
leav<strong>in</strong>g formal physics education<br />
10000<br />
2920<br />
–41%<br />
82<br />
–83%<br />
45<br />
–82%<br />
5<br />
–76%<br />
1<br />
–92%<br />
0<br />
–97%<br />
29%<br />
3%<br />
55%<br />
10%<br />
29% 21%<br />
black African<br />
students<br />
leav<strong>in</strong>g formal physics education<br />
10000<br />
3740<br />
–24%<br />
369<br />
–22%<br />
153<br />
–39%<br />
7<br />
–80%<br />
2<br />
–86%<br />
1<br />
–83%<br />
37%<br />
10%<br />
41%<br />
4%<br />
37% 58%<br />
Indian<br />
students<br />
leav<strong>in</strong>g formal physics education<br />
10000<br />
6260<br />
+26%<br />
793<br />
+68%<br />
386<br />
+54%<br />
13<br />
–61%<br />
6<br />
–66%<br />
2<br />
–80%<br />
Pakistani<br />
students<br />
63%<br />
13%<br />
49%<br />
leav<strong>in</strong>g formal physics education<br />
3%<br />
47% 28%<br />
10000<br />
3850<br />
–22%<br />
223<br />
–53%<br />
52<br />
–79%<br />
3<br />
–92%<br />
1<br />
–95%<br />
0<br />
–95%<br />
39%<br />
6%<br />
23%<br />
5%<br />
35% 43%<br />
Bangladeshi<br />
students<br />
leav<strong>in</strong>g formal physics education<br />
10000<br />
4330<br />
–13%<br />
358<br />
–24%<br />
185<br />
–26%<br />
27<br />
–18%<br />
12<br />
–32%<br />
2<br />
–77%<br />
43%<br />
8%<br />
52%<br />
14%<br />
45% 17%<br />
Ch<strong>in</strong>ese<br />
students<br />
leav<strong>in</strong>g formal physics education<br />
10000<br />
7010<br />
+42%<br />
1275<br />
+171%<br />
801<br />
+220%<br />
42<br />
+31%<br />
19<br />
+8%<br />
5<br />
–45%<br />
70%<br />
18%<br />
63%<br />
5%<br />
44%<br />
25%<br />
overall over-or under-representation<br />
<strong>of</strong> ethnic group relative to the white<br />
population at the same stage<br />
7010<br />
+42%<br />
1459<br />
+186%<br />
“overall survival rate” at stage based on a<br />
notional cohort <strong>of</strong> 10000 students <strong>of</strong> each<br />
ethnic group<br />
21%<br />
“stage survival rate”: percentage <strong>of</strong> students<br />
mov<strong>in</strong>g from one stage to the next<br />
10 R EPRESENTATION OF E THNIC G ROUPS IN C HEMISTRY AND P HYSICS M AY 2006
4: The educational pipel<strong>in</strong>e<br />
There do not appear to be strong negative biases aga<strong>in</strong>st<br />
chemistry among ethnic-m<strong>in</strong>ority groups <strong>in</strong> terms <strong>of</strong> suitably<br />
qualified students choos<strong>in</strong>g to study chemistry at<br />
degree level rather than other subjects. In physics, however,<br />
there is evidence <strong>of</strong> most ethnic groups (except for<br />
Pakistani students) be<strong>in</strong>g less <strong>in</strong>cl<strong>in</strong>ed to study physics at<br />
degree level than their white counterparts.<br />
Most strik<strong>in</strong>g are the different patterns <strong>of</strong> attrition from<br />
chemistry <strong>and</strong> physics dur<strong>in</strong>g <strong>and</strong> after undergraduate studies.<br />
A strong statistical f<strong>in</strong>d<strong>in</strong>g is that, almost without exception,<br />
ethnic-m<strong>in</strong>ority groups tend to do less well <strong>in</strong> their<br />
undergraduate studies <strong>in</strong> terms <strong>of</strong> achiev<strong>in</strong>g a first or uppersecond<br />
degree classification. Moreover, <strong>of</strong> students who<br />
achieve these st<strong>and</strong>ards, non-white students are much less<br />
likely to study chemistry or physics at doctorate level. The<br />
reasons for this are unclear <strong>and</strong> require further research.<br />
However, because these groups are under-represented <strong>in</strong><br />
these subjects relative to white students, it is possible that<br />
peer-group pressure not to cont<strong>in</strong>ue study<strong>in</strong>g chemistry or<br />
physics is greater among ethnic groups, <strong>and</strong> <strong>in</strong> particular<br />
among British Asian groups where there is a preponderance<br />
to study what may be regarded as more vocational subjects.<br />
Fig. 2 (opposite):<br />
Overall survival rates<br />
<strong>and</strong> stage survival rates<br />
<strong>in</strong> academic physics.<br />
R EPRESENTATION OF E THNIC G ROUPS IN C HEMISTRY AND P HYSICS M AY 2006<br />
11
5: <strong>Ethnic</strong>ity <strong>and</strong> compulsory school<strong>in</strong>g<br />
5: <strong>Ethnic</strong>ity <strong>and</strong> compulsory school<strong>in</strong>g<br />
“The pool <strong>of</strong><br />
potential<br />
scientists among<br />
some ethnic<br />
groups is be<strong>in</strong>g<br />
severely limited<br />
very early <strong>in</strong> the<br />
educational<br />
pipel<strong>in</strong>e.”<br />
Fig. 3: Proportion <strong>of</strong><br />
pupils achiev<strong>in</strong>g five or<br />
more GCSEs at grades<br />
A*–C, by ethnic group<br />
<strong>and</strong> gender.<br />
Source: DfES, National<br />
Curriculum Assessment 2004<br />
The differences <strong>in</strong> achievement <strong>in</strong> compulsory school<strong>in</strong>g<br />
by ethnic group (<strong>and</strong> gender) have attracted much attention<br />
over recent years, <strong>in</strong>clud<strong>in</strong>g <strong>in</strong>itiatives to improve the<br />
performance <strong>of</strong> some ethnic-m<strong>in</strong>ority groups, such as the<br />
Aim Higher <strong>in</strong>itiative for black Caribbean pupils. The picture<br />
<strong>of</strong> achievement before the age <strong>of</strong> 16 is one <strong>of</strong> high<br />
achievement among white, Indian <strong>and</strong> Ch<strong>in</strong>ese pupils but<br />
low achievement among other ethnic-m<strong>in</strong>ority groups.<br />
Evidence <strong>of</strong> this is shown <strong>in</strong> figure 3, which gives the proportion<br />
<strong>of</strong> pupils achiev<strong>in</strong>g five or more GCSEs at grades<br />
A*–C. Based on this measure, black Caribbean students<br />
perform notably worse <strong>in</strong> school than do other groups, but<br />
percentage <strong>of</strong> pupils by ethnic group<br />
80<br />
70<br />
60<br />
50<br />
40<br />
30<br />
20<br />
boys girls overall<br />
black African, Pakistani <strong>and</strong> Bangladeshi pupils also, on<br />
average, perform worse than their white counterparts.<br />
Note also that, <strong>in</strong> each case, gender is an important factor,<br />
with girls consistently outperform<strong>in</strong>g boys at GCSE.<br />
The relevance <strong>of</strong> these data for chemistry <strong>and</strong> physics is<br />
that the pool <strong>of</strong> potential scientists among some ethnic<br />
groups is be<strong>in</strong>g severely limited very early <strong>in</strong> the educational<br />
pipel<strong>in</strong>e. Assum<strong>in</strong>g that departure from academic<br />
studies is for the most part irreversible, then, pro rata, the<br />
proportion <strong>of</strong> Indian <strong>and</strong> Ch<strong>in</strong>ese students with the qualifications<br />
to access higher education <strong>in</strong> science will be<br />
approximately double that for black Caribbean students.<br />
10<br />
Fig. 4: Proportion <strong>of</strong><br />
students achiev<strong>in</strong>g KS3<br />
science, by ethnic<br />
group <strong>and</strong> gender.<br />
Source: DfES, National<br />
Curriculum Assessment 2004<br />
percentage <strong>of</strong> pupils by ethnic group<br />
0<br />
90<br />
80<br />
70<br />
60<br />
50<br />
40<br />
30<br />
20<br />
10<br />
white black Caribbean black African Indian Pakistani Bangladeshi Ch<strong>in</strong>ese<br />
boys girls overall<br />
0<br />
white black Caribbean black African Indian Pakistani Bangladeshi Ch<strong>in</strong>ese<br />
12 R EPRESENTATION OF E THNIC G ROUPS IN C HEMISTRY AND P HYSICS M AY 2006
5: <strong>Ethnic</strong>ity <strong>and</strong> compulsory school<strong>in</strong>g<br />
percentage <strong>of</strong> pupils by ethnic group<br />
100<br />
90<br />
80<br />
70<br />
60<br />
50<br />
40<br />
30<br />
20<br />
10<br />
boys girls overall<br />
Fig. 5: Proportion <strong>of</strong><br />
students achiev<strong>in</strong>g KS2<br />
science, by ethnic<br />
group <strong>and</strong> gender.<br />
Source: DfES, National<br />
Curriculum Assessment 2004<br />
0<br />
white black Caribbean black African Indian Pakistani Bangladeshi Ch<strong>in</strong>ese<br />
This evidence po<strong>in</strong>ts to the fact that much <strong>of</strong> the attrition<br />
from science <strong>in</strong> some ethnic groups – noticeable much later<br />
<strong>in</strong> the representation <strong>of</strong> particular ethnic groups <strong>in</strong> scientific<br />
pr<strong>of</strong>essions, <strong>in</strong> later life – starts at the first stage <strong>of</strong> the<br />
education pipel<strong>in</strong>e (i.e. dur<strong>in</strong>g compulsory school<strong>in</strong>g).<br />
Data available about atta<strong>in</strong>ment at KS level reveal that<br />
this pattern <strong>of</strong> differential achievement by ethnic-m<strong>in</strong>ority<br />
group starts before GCSE. KS data provide specific <strong>in</strong>formation<br />
about science education <strong>in</strong> school. Figure 4 shows<br />
the proportion <strong>of</strong> students achiev<strong>in</strong>g the national target <strong>in</strong><br />
science at the end <strong>of</strong> KS3 tests, which students take aged<br />
14. The figure reveals a remarkably similar pattern <strong>of</strong><br />
achievement by ethnic-m<strong>in</strong>ority group to the GCSE data<br />
shown previously, suggest<strong>in</strong>g that the different academic<br />
achievement by ethnic group at GCSE is already manifest at<br />
this earlier stage. In addition, whereas this figure specifically<br />
relates to achievement <strong>in</strong> science, as opposed to the<br />
more general measure <strong>of</strong> five or more GCSEs at A*–C<br />
grades, the close correspondence <strong>of</strong> the data by ethnic<br />
group suggests that the choice <strong>of</strong> the stage 1 measure <strong>in</strong><br />
the present study is appropriate.<br />
F<strong>in</strong>ally, it should be noted that differences <strong>in</strong> achievement<br />
<strong>in</strong> science by ethnic group are found <strong>in</strong> atta<strong>in</strong>ment<br />
results at the end <strong>of</strong> KS2 (when pupils are 11), although<br />
the magnitude <strong>of</strong> the difference is less dramatic than those<br />
found at KS3 <strong>and</strong> at GCSE. Figure 5 shows the proportion <strong>of</strong><br />
students achiev<strong>in</strong>g the national st<strong>and</strong>ard at the end <strong>of</strong> KS2<br />
<strong>in</strong> science by ethnic group <strong>and</strong> gender. It is worth not<strong>in</strong>g<br />
the dramatic reduction <strong>in</strong> performance <strong>of</strong> black Caribbean<br />
boys. At KS2, this group’s performance is <strong>in</strong> l<strong>in</strong>e with, or<br />
better than, a number <strong>of</strong> ethnic groups with about 78%<br />
achiev<strong>in</strong>g the national st<strong>and</strong>ard. However, only 22% <strong>of</strong><br />
black Caribbean boys achieve five or more GCSEs at grades<br />
A*–C, which is a lower proportion than any other group.<br />
R EPRESENTATION OF E THNIC G ROUPS IN C HEMISTRY AND P HYSICS M AY 2006<br />
13
6: <strong>Ethnic</strong>ity <strong>and</strong> science at A-level<br />
6: <strong>Ethnic</strong>ity <strong>and</strong> science at A-level<br />
“Interest<strong>in</strong>gly,<br />
black African<br />
female students<br />
are almost twice<br />
as likely to<br />
achieve three or<br />
more A-levels <strong>in</strong> a<br />
science subject.”<br />
For the vast majority <strong>of</strong> students <strong>in</strong> Engl<strong>and</strong> <strong>and</strong> Wales the<br />
ma<strong>in</strong> route <strong>in</strong>to study<strong>in</strong>g physical sciences at university is<br />
A-levels. Therefore, whether or not <strong>in</strong>dividuals choose to<br />
study chemistry <strong>and</strong> physics along with other science subjects<br />
at A-level has a great bear<strong>in</strong>g on the numbers progress<strong>in</strong>g<br />
along the educational pipel<strong>in</strong>e.<br />
In particular, the tendency not to study science at A-level<br />
will ultimately restrict numbers enter<strong>in</strong>g university courses<br />
<strong>and</strong> pr<strong>of</strong>essional science. Many students make the decision<br />
not to study A-levels at all, or do not successfully complete<br />
their A-level studies. The start<strong>in</strong>g po<strong>in</strong>t is therefore to<br />
consider the proportion <strong>of</strong> young people at 18/19 obta<strong>in</strong><strong>in</strong>g<br />
at least one A-level <strong>in</strong> any subject.<br />
Figure 6 presents these data, analysed by ethnic group<br />
<strong>and</strong> gender, based on the comb<strong>in</strong>ed cohorts <strong>of</strong> the YCS<br />
1996–2002. 17 This figure shows a very similar pattern <strong>of</strong><br />
atta<strong>in</strong>ment at A-level to that at GCSE by ethnic group. There<br />
is wide variation <strong>in</strong> the achievement by ethnic group (particularly<br />
among males), with a significantly higher proportion<br />
<strong>of</strong> Ch<strong>in</strong>ese <strong>and</strong> Indian students achiev<strong>in</strong>g an A-level<br />
compared with the white population.<br />
In l<strong>in</strong>e with performance at GCSE, a significantly lower<br />
proportion <strong>of</strong> black Caribbean, Pakistani <strong>and</strong> Bangladeshi<br />
students also achieve an A-level compared with the white<br />
population. 18<br />
6.1: Science subjects at A-level<br />
Focus<strong>in</strong>g more specifically on study<strong>in</strong>g science at A-level,<br />
figures 7 <strong>and</strong> 8 show the percentage <strong>of</strong> young people, by<br />
gender, obta<strong>in</strong><strong>in</strong>g a science A-level, based on the comb<strong>in</strong>ed<br />
cohorts <strong>of</strong> the YCS 1996–2002. The lower frame <strong>of</strong> each<br />
figure analyses this proportion further by number <strong>of</strong> science<br />
subjects studied. In this case, <strong>and</strong> subsequently, a science<br />
subject at A-level is def<strong>in</strong>ed us<strong>in</strong>g the DfES subject def<strong>in</strong>itions<br />
used <strong>in</strong> the YCS. These are shown <strong>in</strong> appendix 2. The<br />
list <strong>in</strong>cludes s<strong>in</strong>gle-subject chemistry <strong>and</strong> physics, other<br />
sciences (primarily biology) <strong>and</strong> mathematics, which <strong>in</strong>corporates<br />
further mathematics <strong>and</strong> statistics.<br />
This analysis is extended <strong>in</strong> figure 9, which presents student<br />
numbers by subject area at A-level (i.e. chemistry,<br />
physics, mathematics or other science – primarily biology<br />
– based on the comb<strong>in</strong>ed YCS cohorts 1996–2002).<br />
Figures are expressed as a percentage <strong>of</strong> all people aged<br />
18/19 by ethnic group <strong>and</strong> gender.<br />
Gender significance<br />
The analysis reveals major differences <strong>in</strong> patterns <strong>of</strong> the<br />
study <strong>of</strong> science at A-level by ethnic group <strong>and</strong> gender. The<br />
differences by ethnic groups reported for A-levels as a whole<br />
are accentuated for science, especially among males.<br />
Young Ch<strong>in</strong>ese males are three times as likely to study a<br />
science subject as young white males; Indian males are<br />
twice as likely. Statistically significant higher proportions<br />
<strong>of</strong> Ch<strong>in</strong>ese <strong>and</strong> Indian students achieve a science A-level<br />
compared with the white population. Moreover, this observation<br />
holds for both gender groups. 19<br />
Another important observation is that, for men <strong>and</strong><br />
women, Indian <strong>and</strong> Ch<strong>in</strong>ese students are significantly more<br />
likely to achieve three or more science A-levels than students<br />
from any other ethnic group. For males, relative to<br />
white students, Indian students are three times as likely,<br />
<strong>and</strong> Ch<strong>in</strong>ese students are four times as likely, to achieve<br />
Fig. 6: Proportion <strong>of</strong><br />
young people aged<br />
18/19 achiev<strong>in</strong>g at<br />
least one A-level pass,<br />
by ethnic group <strong>and</strong><br />
gender.<br />
Source: Youth Cohort Study,<br />
1996–2002<br />
17. Trends <strong>in</strong> atta<strong>in</strong>ment over<br />
time by YCS cohort are shown <strong>in</strong><br />
appendix 2, where non-white<br />
groups are comb<strong>in</strong>ed to avoid<br />
small sample sizes.<br />
18. Based on a two-sample<br />
proportions T-test.<br />
19. Based on two-sample<br />
proportions T-test.<br />
percentage <strong>of</strong> all young people achiev<strong>in</strong>g an A-level pass<br />
50<br />
40<br />
30<br />
20<br />
10<br />
0<br />
male female all<br />
white black Caribbean black African Indian Pakistani Bangladeshi Ch<strong>in</strong>ese<br />
mixed<br />
14 R EPRESENTATION OF E THNIC G ROUPS IN C HEMISTRY AND P HYSICS M AY 2006
6: <strong>Ethnic</strong>ity <strong>and</strong> science at A-level<br />
40<br />
percentage <strong>of</strong> all males aged 18/19<br />
30<br />
20<br />
10<br />
0<br />
40<br />
white black Caribbean black African Indian Pakistani Bangladeshi Ch<strong>in</strong>ese<br />
any science A-level, <strong>in</strong>clud<strong>in</strong>g mathematics<br />
mixed<br />
percentage <strong>of</strong> all males aged 18/19<br />
30<br />
20<br />
10<br />
1 science<br />
2 sciences<br />
3 sciences<br />
4 or more sciences<br />
0<br />
white black Caribbean black African Indian Pakistani Bangladeshi Ch<strong>in</strong>ese<br />
three or more science A-levels.<br />
For females, similar differences are observed. Indian students<br />
are twice as likely, <strong>and</strong> Ch<strong>in</strong>ese students are three<br />
times as likely, to achieve three or more A-Levels <strong>in</strong> a science<br />
subject. Interest<strong>in</strong>gly, black African female students<br />
are almost twice as likely to achieve three or more A-levels<br />
<strong>in</strong> science.<br />
Vocationally driven choices<br />
It is <strong>in</strong>terest<strong>in</strong>g to speculate that the significantly larger proportions<br />
<strong>of</strong> Indian <strong>and</strong> Ch<strong>in</strong>ese students achiev<strong>in</strong>g three or<br />
more science A-levels may reflect vocationally driven<br />
choices <strong>of</strong> A-level subjects, perhaps <strong>in</strong>fluenced by family<br />
pressure. In contrast, black Caribbean males are only half<br />
as likely to achieve an A-level <strong>in</strong> science compared with<br />
number <strong>of</strong> sciences, <strong>in</strong>clud<strong>in</strong>g mathematics<br />
their white counterparts, <strong>and</strong> females are only a fifth as<br />
likely as their white counterparts. Both <strong>of</strong> these differences,<br />
when they are compared with the white population, are statistically<br />
significant. 20<br />
Other under-achiev<strong>in</strong>g ethnic groups are Pakistani <strong>and</strong><br />
Bangladeshi students. A significantly lower proportion <strong>of</strong><br />
these students (based on comb<strong>in</strong>ed gender) achieve a science<br />
A-level when their results are compared with the<br />
achievement <strong>of</strong> the white population. 21<br />
Referr<strong>in</strong>g to figure 9, which shows subject choices <strong>in</strong><br />
more detail, broadly similar patterns emerge. However, differences<br />
by gender emerge strongly <strong>in</strong> the study <strong>of</strong> physics<br />
at A-level. Males are much more <strong>in</strong>cl<strong>in</strong>ed to study physics at<br />
A-level, with strong significant differences between gender<br />
groups; <strong>in</strong> chemistry, differences were not significant. 22 The<br />
mixed<br />
Fig. 7: A-level sciences<br />
for males, by ethnic<br />
group.<br />
Source: Youth Cohort Study,<br />
1996–2002<br />
20–22. Based on a two-sample<br />
proportions T-test.<br />
R EPRESENTATION OF E THNIC G ROUPS IN C HEMISTRY AND P HYSICS M AY 2006<br />
15
6: <strong>Ethnic</strong>ity <strong>and</strong> science at A-level<br />
30<br />
percentage <strong>of</strong> all females aged 18/19<br />
20<br />
10<br />
0<br />
30<br />
white black Caribbean black African Indian Pakistani Bangladeshi Ch<strong>in</strong>ese<br />
any science A-level, <strong>in</strong>clud<strong>in</strong>g mathematics<br />
mixed<br />
percentage <strong>of</strong> all females aged 18/19<br />
20<br />
10<br />
1 science<br />
2 sciences<br />
3 sciences<br />
4 or more sciences<br />
0<br />
white black Caribbean black African Indian Pakistani Bangladeshi Ch<strong>in</strong>ese<br />
number <strong>of</strong> sciences, <strong>in</strong>clud<strong>in</strong>g mathematics<br />
mixed<br />
Fig. 8: A-level sciences<br />
for females, by ethnic<br />
group.<br />
Source: Youth Cohort Study,<br />
1996–2002<br />
23. Note that the st<strong>and</strong>ard errors<br />
on the proportions reported from<br />
the YCS are quite large <strong>in</strong> some<br />
cases, <strong>and</strong> <strong>in</strong> particular among<br />
ethnic-m<strong>in</strong>ority groups whose<br />
sample numbers <strong>in</strong> the survey are<br />
quite small. In contrast, st<strong>and</strong>ard<br />
errors for the majority white<br />
population are small, giv<strong>in</strong>g us a<br />
high degree <strong>of</strong> confidence with<br />
regard to our f<strong>in</strong>d<strong>in</strong>gs for this<br />
group.<br />
differences by ethnic group are along the l<strong>in</strong>es <strong>of</strong> those discussed<br />
so far, with differences by ethnic group generally<br />
more pronounced among males.<br />
Trends with time <strong>in</strong> atta<strong>in</strong>ment <strong>of</strong> chemistry <strong>and</strong> physics<br />
A-levels by YCS cohort are reported <strong>in</strong> appendix 4. Sample<br />
sizes for ethnic-m<strong>in</strong>ority groups are very small <strong>in</strong> a s<strong>in</strong>gle<br />
cohort, so non-white groups are comb<strong>in</strong>ed <strong>and</strong> compared<br />
with the white population.<br />
6.2: Potential undergraduate scientists<br />
Consideration <strong>of</strong> the next stage along the educational<br />
pipel<strong>in</strong>e requires identification <strong>of</strong> the proportion <strong>of</strong> young<br />
people, by ethnic group, who might be considered “potential<br />
undergraduate scientists” (i.e. either potential undergraduate<br />
chemists or physicists), based on subject choices<br />
<strong>and</strong> achievement at A-level.<br />
This concept is useful <strong>in</strong> provid<strong>in</strong>g an ethnic pr<strong>of</strong>ile <strong>of</strong><br />
the pool <strong>of</strong> students from which chemistry <strong>and</strong> physics is<br />
recruit<strong>in</strong>g at higher levels.<br />
The detailed concept <strong>of</strong> the potential undergraduate<br />
chemist or physicist is outl<strong>in</strong>ed <strong>in</strong> section 2, <strong>in</strong>clud<strong>in</strong>g prerequisite<br />
subject choices <strong>and</strong> grades obta<strong>in</strong>ed at A-level.<br />
The section gave three def<strong>in</strong>itions accord<strong>in</strong>g to different<br />
levels <strong>of</strong> achievement <strong>in</strong> A-level studies, based on the number<br />
<strong>of</strong> UCAS po<strong>in</strong>ts achieved. In short, a potential undergraduate<br />
chemist is def<strong>in</strong>ed as achiev<strong>in</strong>g an A-level <strong>in</strong><br />
chemistry, plus 12, 18 or 24 UCAS po<strong>in</strong>ts (with a m<strong>in</strong>imum<br />
<strong>of</strong> a grade C <strong>in</strong> chemistry, or grade B for 24 UCAS po<strong>in</strong>ts);<br />
the potential undergraduate physicist is expected to<br />
achieve an A-level <strong>in</strong> physics <strong>and</strong> <strong>in</strong> a mathematics-related<br />
discipl<strong>in</strong>e plus 12, 18 or 24 UCAS po<strong>in</strong>ts (with a m<strong>in</strong>imum<br />
<strong>of</strong> a grade C <strong>in</strong> physics, or grade B for 24 UCAS po<strong>in</strong>ts).<br />
Apply<strong>in</strong>g these def<strong>in</strong>itions to the pooled YCS data for<br />
1996–2002 provides estimates <strong>of</strong> the proportions <strong>of</strong><br />
potential undergraduate chemists/physicists. Figure 10<br />
presents the proportions <strong>of</strong> the population aged 18/19 by<br />
ethnic group <strong>and</strong> gender who may be categorised as potential<br />
undergraduate chemists. The detailed figures, <strong>in</strong>clud<strong>in</strong>g<br />
st<strong>and</strong>ard errors <strong>and</strong> sample sizes, are presented <strong>in</strong><br />
appendix 3. Similarly, figure 11 shows the proportions <strong>of</strong><br />
the population aged 18/19 years by ethnic group <strong>and</strong> gender<br />
who may be categorised as potential undergraduate<br />
physicists. The detailed figures, <strong>in</strong>clud<strong>in</strong>g st<strong>and</strong>ard errors<br />
<strong>and</strong> sample sizes, are presented <strong>in</strong> appendix 4. 23<br />
16 R EPRESENTATION OF E THNIC G ROUPS IN C HEMISTRY AND P HYSICS M AY 2006
6: <strong>Ethnic</strong>ity <strong>and</strong> science at A-level<br />
35<br />
30<br />
chemistry physics mathematics other science<br />
percentage <strong>of</strong> all males aged 18/19 years<br />
25<br />
20<br />
15<br />
10<br />
5<br />
0<br />
25<br />
white black Caribbean black African Indian Pakistani Bangladeshi Ch<strong>in</strong>ese<br />
Stark gender differences<br />
In addition to differences by ethnic group, there are stark<br />
gender differences <strong>in</strong> proportions <strong>of</strong> potential undergraduate<br />
physicists. Not only is the proportion <strong>of</strong> females<br />
achiev<strong>in</strong>g an A-level <strong>in</strong> physics small, but apply<strong>in</strong>g the<br />
strictest criteria for def<strong>in</strong><strong>in</strong>g potential undergraduate physimales<br />
chemistry physics mathematics other science<br />
mixed<br />
percentage <strong>of</strong> all females aged 18/19 years<br />
20<br />
15<br />
10<br />
5<br />
0<br />
white black Caribbean black African Indian Pakistani Bangladeshi Ch<strong>in</strong>ese<br />
The results show marked differences across ethnic<br />
groups <strong>in</strong> terms <strong>of</strong> students qualified to study on undergraduate<br />
chemistry programmes. These differences tend<br />
to highlight the differences seen so far by ethnic group. That<br />
is, the Ch<strong>in</strong>ese <strong>and</strong> Indian populations – the highest achievers<br />
<strong>in</strong> terms <strong>of</strong> GCSE <strong>and</strong> A-level atta<strong>in</strong>ment – have by far<br />
the highest proportions <strong>of</strong> potential undergraduate<br />
chemists <strong>and</strong> physicists; members <strong>of</strong> both groups are significantly<br />
more likely to be potential undergraduate scientists<br />
than members <strong>of</strong> the white population, based on the<br />
three alternative measures <strong>and</strong> comb<strong>in</strong><strong>in</strong>g gender<br />
groups. 24 On a pro rata basis the Ch<strong>in</strong>ese <strong>and</strong> Indian populations<br />
have approximately double the proportion <strong>of</strong><br />
potential undergraduate scientists than any other group.<br />
females<br />
Once aga<strong>in</strong>, this observation correlates with the propensity<br />
<strong>of</strong> some groups to seek to study medic<strong>in</strong>e: c<strong>and</strong>idates<br />
are likely to require an A-level <strong>in</strong> chemistry to study medic<strong>in</strong>e<br />
<strong>and</strong> also to have at least 24 UCAS po<strong>in</strong>ts.<br />
In contrast, a very low proportion <strong>of</strong> the black Caribbean<br />
population qualifies as potential undergraduate scientists,<br />
<strong>and</strong> this is especially true for physics. 25<br />
mixed<br />
Fig. 9: Science subjects<br />
studied at A-level, by<br />
ethnic group <strong>and</strong><br />
gender.<br />
Source: Youth Cohort Study,<br />
1996–2002<br />
24. Based on a two-sample<br />
proportions T-test.<br />
25. Note that, <strong>in</strong> this case,<br />
differences between ethnic<br />
groups are not significant, given<br />
the small proportions <strong>in</strong>volved<br />
<strong>and</strong> the small sample base for<br />
black Caribbean students.<br />
R EPRESENTATION OF E THNIC G ROUPS IN C HEMISTRY AND P HYSICS M AY 2006<br />
17
6: <strong>Ethnic</strong>ity <strong>and</strong> science at A-level<br />
16<br />
percentage <strong>of</strong> all males aged 18/19 years<br />
14<br />
12<br />
10<br />
8<br />
6<br />
4<br />
potential chemist (UCAS 24)<br />
potential chemist (UCAS 18)<br />
potential chemist (UCAS 12)<br />
plus 1 science, <strong>in</strong>clud<strong>in</strong>g maths<br />
A-level chemistry<br />
2<br />
0<br />
16<br />
white black Caribbean black African Indian Pakistani Bangladeshi Ch<strong>in</strong>ese<br />
males<br />
mixed<br />
percentage <strong>of</strong> all females aged 18/19 years<br />
14<br />
12<br />
10<br />
8<br />
6<br />
4<br />
potential chemist (UCAS 24)<br />
potential chemist (UCAS 18)<br />
potential chemist (UCAS 12)<br />
plus 1 science, <strong>in</strong>clud<strong>in</strong>g maths<br />
A-level chemistry<br />
2<br />
0<br />
Fig. 10: A-level<br />
chemistry <strong>and</strong> potential<br />
undergraduate<br />
chemists.<br />
Source: Youth Cohort Study,<br />
1996–2002<br />
white black Caribbean black African Indian Pakistani Bangladeshi Ch<strong>in</strong>ese<br />
females<br />
cists (def<strong>in</strong>ition UCAS 24) gives a very small number <strong>of</strong><br />
potential undergraduate female physicists outside the<br />
white <strong>and</strong> Indian populations.<br />
For females, differences between other ethnic groups<br />
mixed<br />
<strong>and</strong> the white population are not generally significant for<br />
the proportion <strong>of</strong> potential undergraduate scientists.<br />
However, this is <strong>in</strong> part the result <strong>of</strong> the small sample numbers<br />
that are available to be analysed.<br />
18 R EPRESENTATION OF E THNIC G ROUPS IN C HEMISTRY AND P HYSICS M AY 2006
6: <strong>Ethnic</strong>ity <strong>and</strong> science at A-level<br />
20<br />
percentage <strong>of</strong> all males aged 18/19 years<br />
18<br />
16<br />
14<br />
12<br />
10<br />
8<br />
6<br />
4<br />
potential physicist (UCAS 24)<br />
potential physicist (UCAS 18)<br />
potential physicist (UCAS 12)<br />
plus maths A-level<br />
A-level physics<br />
2<br />
0<br />
20<br />
white black Caribbean black African Indian Pakistani Bangladeshi Ch<strong>in</strong>ese<br />
males<br />
mixed<br />
percentage <strong>of</strong> all females aged 18/19 years<br />
18<br />
16<br />
14<br />
12<br />
10<br />
8<br />
6<br />
4<br />
potential physicist (UCAS 24)<br />
potential physicist (UCAS 18)<br />
potential physicist (UCAS 12)<br />
plus maths A-level<br />
A-level physics<br />
2<br />
0<br />
white black Caribbean black African Indian Pakistani Bangladeshi Ch<strong>in</strong>ese<br />
females<br />
mixed<br />
Fig. 11: A-level physics<br />
<strong>and</strong> potential<br />
undergraduate<br />
physicists.<br />
Source: Youth Cohort Study,<br />
1996–2002<br />
R EPRESENTATION OF E THNIC G ROUPS IN C HEMISTRY AND P HYSICS M AY 2006<br />
19
7: <strong>Ethnic</strong>ity <strong>and</strong> undergraduate studies<br />
7: <strong>Ethnic</strong>ity <strong>and</strong> undergraduate studies<br />
“The most underrepresented<br />
ethnic groups<br />
tend to do the<br />
least well <strong>in</strong> their<br />
undergraduate<br />
studies.”<br />
The <strong>in</strong>fluence <strong>of</strong> ethnicity on the choice <strong>of</strong> studies at undergraduate<br />
degree level is now considered. In particular, this<br />
section exam<strong>in</strong>es the <strong>in</strong>cl<strong>in</strong>ation towards study<strong>in</strong>g chemistry<br />
<strong>and</strong> physics at undergraduate level compared with<br />
alternative subjects that might compete <strong>in</strong> attract<strong>in</strong>g potential<br />
undergraduate scientists.<br />
7.1: <strong>Ethnic</strong>-m<strong>in</strong>ority representation <strong>in</strong><br />
undergraduate chemistry <strong>and</strong> physics<br />
Utilis<strong>in</strong>g HESA 2002/2003 student data, the ethnic <strong>and</strong><br />
gender breakdown <strong>of</strong> the undergraduate population <strong>in</strong><br />
chemistry <strong>and</strong> physics, domiciled <strong>in</strong> Engl<strong>and</strong> <strong>and</strong> Wales<br />
<strong>and</strong> study<strong>in</strong>g for a first or enhanced first degree <strong>in</strong> chemistry<br />
<strong>and</strong> physics, is shown <strong>in</strong> figure 12. The charts show<br />
that both student bodies are ethnically white <strong>and</strong> male<br />
dom<strong>in</strong>ated. This is particularly the case <strong>in</strong> physics, where<br />
white males account for approximately three-quarters <strong>of</strong><br />
the population <strong>and</strong> ethnic-m<strong>in</strong>ority females account for less<br />
than 3% <strong>of</strong> all students. Although chemistry is male dom<strong>in</strong>ated,<br />
it is more ethnically diverse than physics <strong>and</strong> has a<br />
more balanced gender pr<strong>of</strong>ile.<br />
These charts do not, however, convey the extent to which<br />
ethnic groups are under- or over-represented relative to their<br />
numbers <strong>in</strong> the undergraduate population. HESA data are<br />
not a representative survey <strong>of</strong> activities <strong>in</strong> the population, as<br />
is the case with YCS data, but are <strong>in</strong>stead a census <strong>of</strong> students.<br />
Thus analysis is only possible <strong>of</strong> the ethnic structure<br />
with<strong>in</strong> the student body domiciled <strong>in</strong> Engl<strong>and</strong> <strong>and</strong> Wales. To<br />
normalise these data, the percentages for each subject ethnic-gender<br />
group are divided by the percentage <strong>of</strong> students<br />
<strong>in</strong> each <strong>of</strong> the respective ethnic-gender groups <strong>in</strong> the undergraduate<br />
student body as a whole, domiciled <strong>in</strong> Engl<strong>and</strong><br />
<strong>and</strong> Wales. The result<strong>in</strong>g figures have one taken away are<br />
then themselves expressed as percentages. The result<strong>in</strong>g<br />
figure yields the percentage under- or over-representation<br />
<strong>of</strong> each ethnic-gender group by subject area.<br />
This is now referred to as a measure <strong>of</strong> ethnic-gender representation<br />
(EGR), the formula for which is shown below.<br />
EGR =<br />
% ethnic-gender group <strong>in</strong> subject X<br />
100 ( –1)<br />
% ethnic-gender group <strong>in</strong> undergraduate population<br />
Us<strong>in</strong>g HESA student data for 2002/2003, evidence is<br />
found <strong>of</strong> pronounced ethnic differences <strong>in</strong> chemistry <strong>and</strong><br />
physics. Us<strong>in</strong>g a chi-squared significance test, it is shown<br />
that students are not r<strong>and</strong>omly allocated to physics <strong>and</strong><br />
chemistry by ethnic group. Figures 13 <strong>and</strong> 14 present the<br />
measures <strong>of</strong> EGR for chemistry <strong>and</strong> physics. The charts<br />
show that white males, but not white females, are over-represented<br />
<strong>in</strong> both chemistry <strong>and</strong> physics relative to their<br />
numbers <strong>in</strong> the undergraduate population. Among ethnicm<strong>in</strong>ority<br />
groups, ethnic Asian (Pakistani, Bangladeshi,<br />
Indian <strong>and</strong> Ch<strong>in</strong>ese) students, particularly Pakistani <strong>and</strong><br />
Bangladeshi students but also Indian <strong>and</strong> Ch<strong>in</strong>ese students,<br />
are over-represented <strong>in</strong> chemistry relative to their<br />
numbers <strong>in</strong> the undergraduate population. This contrasts<br />
with black students, <strong>and</strong> <strong>in</strong> particular black Caribbean students,<br />
who are notably under-represented. In physics, the<br />
under-representation <strong>of</strong> all ethnic-m<strong>in</strong>ority groups, with the<br />
exception <strong>of</strong> Ch<strong>in</strong>ese, is clear. Females are also under-represented<br />
generally.<br />
Lost potential<br />
The transfer <strong>in</strong>to undergraduate chemistry <strong>and</strong> physics<br />
courses relative to those identified as potential undergraduates<br />
is <strong>in</strong>terest<strong>in</strong>g (figures 1 <strong>and</strong> 2). For the most part,<br />
similar proportions <strong>of</strong> ethnic groups qualify<strong>in</strong>g as UCAS 12<br />
potential undergraduate chemists become undergraduate<br />
chemists. Interest<strong>in</strong>gly, 25% <strong>of</strong> black Caribbean potential<br />
undergraduate chemists become undergraduate chemists<br />
– almost twice the proportion for white students. However,<br />
overall, black Caribbean students are significantly less<br />
likely to read undergraduate chemistry than their white<br />
counterparts (figure 1).<br />
In contrast, overall, Indian <strong>and</strong> Ch<strong>in</strong>ese students are<br />
more likely to read undergraduate chemistry than white students:<br />
Indian students are twice as likely <strong>and</strong> Ch<strong>in</strong>ese students<br />
three times as likely. Interest<strong>in</strong>gly, overall, Pakistani<br />
students are one-<strong>and</strong>-a-half times as likely as white students<br />
to read undergraduate chemistry. Aga<strong>in</strong>, these observations<br />
are <strong>in</strong> l<strong>in</strong>e with the higher proportions <strong>of</strong> Indian <strong>and</strong><br />
Ch<strong>in</strong>ese students who are qualified to read chemistry.<br />
Comparison between potential undergraduate physicists<br />
<strong>and</strong> those read<strong>in</strong>g physics shows more variation <strong>in</strong> the proportions<br />
<strong>of</strong> students mov<strong>in</strong>g through. However, as the number<br />
<strong>of</strong> ethnic-m<strong>in</strong>ority students read<strong>in</strong>g undergraduate<br />
physics is small, more variation would be expected. Hav<strong>in</strong>g<br />
noted that, only Pakistani students are more likely than<br />
white students to transfer from be<strong>in</strong>g potential undergraduate<br />
physicists to become undergraduate physicists.<br />
However, overall, relative to the number <strong>of</strong> young people<br />
<strong>in</strong> the population, only Ch<strong>in</strong>ese students are more likely<br />
to read undergraduate physics than white students. In fact,<br />
Ch<strong>in</strong>ese students are twice as likely as white students to<br />
read undergraduate physics.<br />
Another comparison is with the students with three or<br />
more science A-levels. Given that significantly greater proportions<br />
<strong>of</strong> Indian <strong>and</strong> Ch<strong>in</strong>ese students than white students<br />
have three or more science A-levels, it is <strong>in</strong>terest<strong>in</strong>g to<br />
note that this does not result <strong>in</strong> similarly greater proportions<br />
<strong>of</strong> Indian <strong>and</strong> Ch<strong>in</strong>ese students read<strong>in</strong>g chemistry <strong>and</strong><br />
physics. However, as discussed later <strong>in</strong> this report, Asian<br />
students <strong>in</strong> particular favour medic<strong>in</strong>e-related subjects.<br />
20 R EPRESENTATION OF E THNIC G ROUPS IN C HEMISTRY AND P HYSICS M AY 2006
7: <strong>Ethnic</strong>ity <strong>and</strong> undergraduate studies<br />
percentage <strong>of</strong> all chemistry undergraduates<br />
80<br />
70<br />
60<br />
50<br />
40<br />
30<br />
20<br />
10<br />
0<br />
45.7<br />
white<br />
0.4 0.8<br />
black Caribbean<br />
black African<br />
male female<br />
male<br />
2.7 2.6<br />
0.8 1.2 2.3<br />
Indian<br />
Pakistani<br />
Bangladeshi<br />
Ch<strong>in</strong>ese<br />
other/mixed<br />
34.5<br />
white<br />
chemistry<br />
female<br />
0.4 1.3 2.6 1.9 0.5 0.8 1.5<br />
black Caribbean<br />
black African<br />
Indian<br />
Pakistani<br />
Bangladeshi<br />
Ch<strong>in</strong>ese<br />
other/mixed<br />
Fig. 12: <strong>Ethnic</strong><br />
composition <strong>of</strong><br />
undergraduate<br />
chemistry <strong>and</strong> physics.<br />
Notes:<br />
1. The percentages relate to<br />
Engl<strong>and</strong>- <strong>and</strong> Walesdomiciled<br />
students<br />
study<strong>in</strong>g for a first or<br />
enhanced first degree.<br />
2. Numbers exclude those<br />
whose ethnicity is unknown.<br />
Source: HESA student data set<br />
2002/2003<br />
percentage <strong>of</strong> all physics undergraduates<br />
80<br />
70<br />
60<br />
50<br />
40<br />
30<br />
20<br />
10<br />
0<br />
74.6<br />
white<br />
0.3 0.4<br />
black Caribbean<br />
black African<br />
male female<br />
male<br />
2.4 1.1 0.3 0.7<br />
Indian<br />
Pakistani<br />
Bangladeshi<br />
Ch<strong>in</strong>ese<br />
2.7<br />
other/mixed<br />
15.3<br />
white<br />
physics<br />
female<br />
0.0 0.1 0.7 0.1 0.0 0.3 1.0<br />
black Caribbean<br />
black African<br />
Indian<br />
Pakistani<br />
Bangladeshi<br />
Ch<strong>in</strong>ese<br />
other/mixed<br />
80<br />
percentage <strong>of</strong> all undergraduates<br />
70<br />
60<br />
50<br />
40<br />
30<br />
20<br />
37.2<br />
male<br />
male<br />
female<br />
43.9<br />
undergraduate population<br />
female<br />
10<br />
0<br />
white<br />
0.5 1.4 2.6 1.6 0.5 0.6<br />
black Caribbean<br />
black African<br />
Indian<br />
Pakistani<br />
Bangladeshi<br />
Ch<strong>in</strong>ese<br />
2.2<br />
other/mixed<br />
white<br />
1.0 1.4 2.5 1.3 0.4 0.6<br />
black Caribbean<br />
black African<br />
Indian<br />
Pakistani<br />
Bangladeshi<br />
Ch<strong>in</strong>ese<br />
2.4<br />
other/mixed<br />
R EPRESENTATION OF E THNIC G ROUPS IN C HEMISTRY AND P HYSICS M AY 2006<br />
21
7: <strong>Ethnic</strong>ity <strong>and</strong> undergraduate studies<br />
Fig. 13: EGR <strong>in</strong><br />
chemistry.<br />
Notes:<br />
1. Figures based on<br />
undergraduate students<br />
only.<br />
2. Engl<strong>and</strong>- <strong>and</strong> Walesdomiciled<br />
EGR is calculated<br />
with respect to the ethnicgender<br />
breakdown <strong>of</strong> the<br />
undergraduate population<br />
as a whole.<br />
Source: HESA student data set<br />
2002/2003<br />
ethnic–gender presentation<br />
120<br />
100<br />
80<br />
60<br />
40<br />
20<br />
0<br />
–20<br />
male female all<br />
–40<br />
–60<br />
white black Caribbean black African Indian Pakistani Bangladeshi Ch<strong>in</strong>ese<br />
other/mixed<br />
Fig. 14: EGR <strong>in</strong> physics.<br />
Notes:<br />
1. Figures based on<br />
undergraduate students<br />
only.<br />
2. Engl<strong>and</strong>- <strong>and</strong> Walesdomiciled<br />
EGR is calculated<br />
with respect to the ethnicgender<br />
breakdown <strong>of</strong> the<br />
undergraduate population<br />
as a whole.<br />
Source: HESA student data set<br />
2002/2003<br />
ethnic–gender representation<br />
120<br />
100<br />
80<br />
60<br />
40<br />
20<br />
0<br />
–20<br />
–40<br />
–60<br />
–80<br />
male female all<br />
–100<br />
white black Caribbean black African Indian Pakistani Bangladeshi Ch<strong>in</strong>ese<br />
other/mixed<br />
26. Appendix 9 shows the ethnic<br />
breakdown by subject group for<br />
all subjects, along with ranked<br />
participation by ethnic group.<br />
27. Nurs<strong>in</strong>g is excluded from the<br />
analysis <strong>of</strong> medic<strong>in</strong>e <strong>and</strong> related<br />
subjects.<br />
7.2: <strong>Ethnic</strong>-m<strong>in</strong>ority representation <strong>in</strong> SET,<br />
medic<strong>in</strong>e <strong>and</strong> other subjects<br />
As a comparison <strong>of</strong> wider subject choice, an analysis was<br />
undertaken to show what other subjects the potential<br />
chemistry or physics students might study. 26<br />
Consider the EGR <strong>in</strong> the three broad areas <strong>of</strong> study:<br />
● SET;<br />
● medic<strong>in</strong>e <strong>and</strong> related subjects (exclud<strong>in</strong>g nurs<strong>in</strong>g);<br />
● all other subjects (this group encompasses subject<br />
areas such as arts, social sciences <strong>and</strong> humanities).<br />
Evidence is found <strong>of</strong> pronounced ethnic differences<br />
across subject areas. Us<strong>in</strong>g a chi-squared significance test,<br />
it is shown that students are not r<strong>and</strong>omly allocated to<br />
these three subject areas by ethnic group.<br />
Figures 15–17 present the measures <strong>of</strong> EGR <strong>in</strong> each<br />
subject area. The charts show that SET subjects are successful<br />
<strong>in</strong> attract<strong>in</strong>g ethnic-m<strong>in</strong>ority students, relative to<br />
the numbers expected, based on the ethnic composition <strong>of</strong><br />
the undergraduate population. Notably, with the exception<br />
<strong>of</strong> black Caribbean students, ethnic-m<strong>in</strong>ority groups<br />
are over-represented compared with white students.<br />
However, gender differences tend to dom<strong>in</strong>ate ethnicity<br />
aspects, with SET subjects prov<strong>in</strong>g far more attractive to<br />
males than females, irrespective <strong>of</strong> ethnicity.<br />
In medic<strong>in</strong>e <strong>and</strong> related subjects, 27 all ethnic-m<strong>in</strong>ority<br />
groups, except black Caribbean students, are over-represented<br />
compared with white students. Moreover, these subjects<br />
appear particularly attractive to Indian <strong>and</strong> Pakistani<br />
students. In contrast to SET subjects, medic<strong>in</strong>e <strong>and</strong> related<br />
subjects are preferred more by females than males.<br />
As expected from the data about medic<strong>in</strong>e <strong>and</strong> subjects<br />
related to it, white students are over-represented relative to<br />
other ethnic groups <strong>in</strong> subject areas outside SET <strong>and</strong> medic<strong>in</strong>e.<br />
Black Caribbean students are also significantly over-<br />
22 R EPRESENTATION OF E THNIC G ROUPS IN C HEMISTRY AND P HYSICS M AY 2006
7: <strong>Ethnic</strong>ity <strong>and</strong> undergraduate studies<br />
ethnic–gender representation<br />
100<br />
80<br />
60<br />
40<br />
20<br />
0<br />
–20<br />
–40<br />
male female all<br />
Fig. 15: EGR <strong>in</strong> SET<br />
subjects.<br />
Notes:<br />
1. Figures based on<br />
undergraduate students<br />
only.<br />
2. Engl<strong>and</strong>- <strong>and</strong> Walesdomiciled<br />
EGR is calculated<br />
with respect to the ethnicgender<br />
breakdown <strong>of</strong> the<br />
undergraduate population<br />
as a whole.<br />
–60<br />
white black Caribbean black African Indian Pakistani Bangladeshi Ch<strong>in</strong>ese<br />
other/mixed<br />
Source: HESA student data set<br />
2002/2003<br />
ethnic-gender representation<br />
160<br />
140<br />
120<br />
100<br />
80<br />
60<br />
40<br />
20<br />
0<br />
–20<br />
male female all<br />
Fig. 16: EGR <strong>in</strong><br />
medic<strong>in</strong>e-related<br />
subjects.<br />
Notes:<br />
1. Figures based on<br />
undergraduate students<br />
only.<br />
2. Engl<strong>and</strong>- <strong>and</strong> Walesdomiciled<br />
EGR is calculated<br />
with respect to the ethnicgender<br />
breakdown <strong>of</strong> the<br />
undergraduate population<br />
as a whole.<br />
Source: HESA student data set<br />
2002/2003<br />
ethnic–gender representation<br />
–40<br />
–60<br />
40<br />
20<br />
0<br />
–20<br />
–40<br />
–60<br />
white black Caribbean black African Indian Pakistani Bangladeshi Ch<strong>in</strong>ese<br />
male female all<br />
white black Caribbean black African Indian Pakistani Bangladeshi Ch<strong>in</strong>ese<br />
other/mixed<br />
other/mixed<br />
represented <strong>in</strong> subjects outside science <strong>and</strong> medic<strong>in</strong>e.<br />
These groups <strong>in</strong> general show a preference for arts, social<br />
sciences <strong>and</strong> humanities subjects (appendix 7). In contrast,<br />
ethnic Asian groups – especially Asian males – are<br />
very much under-represented <strong>in</strong> these areas.<br />
It is worth not<strong>in</strong>g that groups such as black Caribbean<br />
<strong>and</strong> black African students are more likely to attend a post-<br />
1992 university, where chemistry <strong>and</strong> physics courses are<br />
relatively rare. However, it is difficult to know whether <strong>in</strong>stitutional<br />
choice – for <strong>in</strong>stance, preferr<strong>in</strong>g a local university,<br />
which, if it is a post-1992 <strong>in</strong>stitution is less likely to <strong>of</strong>fer<br />
chemistry or physics – overrides subject choice for these<br />
groups, or whether the converse is true.<br />
The SET group <strong>of</strong> subjects was exam<strong>in</strong>ed further to identify<br />
which subjects were most attractive to students from<br />
ethnic-m<strong>in</strong>ority backgrounds. Figure 18 presents the analysis<br />
<strong>and</strong> shows the SET group broken down to five broad subject<br />
groups: biological sciences, physical sciences<br />
(<strong>in</strong>clud<strong>in</strong>g physics <strong>and</strong> chemistry), mathematical sciences,<br />
computer science, <strong>and</strong> eng<strong>in</strong>eer<strong>in</strong>g <strong>and</strong> technology. A chisquared<br />
significance test reveals that students are not r<strong>and</strong>omly<br />
allocated to these five subject areas when analysed<br />
by ethnic group.<br />
The chart shows that ethnic-m<strong>in</strong>ority students tend to be<br />
under-represented generally, relative to their white counterparts,<br />
<strong>in</strong> what might be considered to be the traditional<br />
subject areas <strong>of</strong> science (i.e. biological, physical <strong>and</strong> mathematical<br />
sciences). In contrast, ethnic-m<strong>in</strong>ority students<br />
Fig. 17: EGR <strong>in</strong> other<br />
subject areas.<br />
Notes:<br />
1. Figures based on<br />
undergraduate students<br />
only.<br />
2. Engl<strong>and</strong>- <strong>and</strong> Walesdomiciled<br />
EGR is calculated<br />
with respect to the ethnicgender<br />
breakdown <strong>of</strong> the<br />
undergraduate population<br />
as a whole.<br />
Source: HESA student data set<br />
2002/2003<br />
Fig. 18 (p24): EGR by<br />
SET subject.<br />
Notes:<br />
1. Figures based on<br />
undergraduate students<br />
only.<br />
2. Engl<strong>and</strong>- <strong>and</strong> Walesdomiciled<br />
EGR is calculated<br />
with respect to the ethnicgender<br />
breakdown <strong>of</strong> the<br />
undergraduate population<br />
as a whole.<br />
Source: HESA student data set<br />
2002/2003<br />
R EPRESENTATION OF E THNIC G ROUPS IN C HEMISTRY AND P HYSICS M AY 2006<br />
23
7: <strong>Ethnic</strong>ity <strong>and</strong> undergraduate studies<br />
400<br />
350<br />
300<br />
biological<br />
science<br />
computer<br />
science<br />
physical<br />
science<br />
eng<strong>in</strong>eer<strong>in</strong>g <strong>and</strong><br />
technology<br />
mathematical<br />
science<br />
ethnic-gender representation<br />
250<br />
200<br />
150<br />
100<br />
50<br />
0<br />
–50<br />
ethnic-gender representation<br />
–100<br />
200<br />
150<br />
100<br />
50<br />
0<br />
–50<br />
white black Caribbean black African Indian Pakistani Bangladeshi Ch<strong>in</strong>ese<br />
biological<br />
science<br />
computer<br />
science<br />
physical<br />
science<br />
eng<strong>in</strong>eer<strong>in</strong>g <strong>and</strong><br />
technology<br />
mathematical<br />
science<br />
males<br />
other/mixed<br />
ethnic-gender representation<br />
–100<br />
250<br />
200<br />
150<br />
100<br />
50<br />
0<br />
–50<br />
white black Caribbean black African Indian Pakistani Bangladeshi Ch<strong>in</strong>ese<br />
biological<br />
science<br />
computer<br />
science<br />
physical<br />
science<br />
eng<strong>in</strong>eer<strong>in</strong>g <strong>and</strong><br />
technology<br />
mathematical<br />
science<br />
females<br />
other/mixed<br />
–100<br />
white black Caribbean black African Indian Pakistani Bangladeshi Ch<strong>in</strong>ese<br />
all<br />
Fig. 18: For caption see p23.<br />
other/mixed<br />
24 R EPRESENTATION OF E THNIC G ROUPS IN C HEMISTRY AND P HYSICS M AY 2006
7: <strong>Ethnic</strong>ity <strong>and</strong> undergraduate studies<br />
600<br />
500<br />
medic<strong>in</strong>e dentistry pharmacology ophthalmics<br />
ethnic–gender representation<br />
400<br />
300<br />
200<br />
100<br />
0<br />
–100<br />
white black Caribbean black African Indian Pakistani Bangladeshi Ch<strong>in</strong>ese mixed<br />
males<br />
1100<br />
900<br />
medic<strong>in</strong>e dentistry pharmacology ophthalmics<br />
ethnic–gender representation<br />
700<br />
500<br />
300<br />
100<br />
–100<br />
white black Caribbean black African Indian Pakistani Bangladeshi Ch<strong>in</strong>ese mixed<br />
females<br />
700<br />
600<br />
medic<strong>in</strong>e dentistry pharmacology ophthalmics<br />
ethnic–gender representation<br />
500<br />
400<br />
300<br />
200<br />
100<br />
0<br />
–100<br />
white black Caribbean black African Indian Pakistani Bangladeshi Ch<strong>in</strong>ese mixed<br />
all<br />
Fig. 19: For caption see p25.<br />
R EPRESENTATION OF E THNIC G ROUPS IN C HEMISTRY AND P HYSICS M AY 2006<br />
25
7: <strong>Ethnic</strong>ity <strong>and</strong> undergraduate studies<br />
Fig. 20: EGR <strong>in</strong> law.<br />
Notes:<br />
1. Figures based on<br />
undergraduate students<br />
only.<br />
2. Engl<strong>and</strong>- <strong>and</strong> Walesdomiciled<br />
EGR is calculated<br />
with respect to the ethnicgender<br />
breakdown <strong>of</strong> the<br />
undergraduate population<br />
as a whole.<br />
Source: HESA student data set<br />
2002/2003<br />
Fig. 21: EGR <strong>in</strong> bus<strong>in</strong>ess<br />
<strong>and</strong> adm<strong>in</strong>istration.<br />
Notes:<br />
1. Figures based on<br />
undergraduate students<br />
only.<br />
2. Engl<strong>and</strong>- <strong>and</strong> Walesdomiciled<br />
EGR is calculated<br />
with respect to the ethnicgender<br />
breakdown <strong>of</strong> the<br />
undergraduate population<br />
as a whole.<br />
Source: HESA student data set<br />
2002/2003<br />
ethnic–gender representation<br />
ethnic–gender representation<br />
200<br />
180<br />
160<br />
140<br />
120<br />
100<br />
80<br />
60<br />
40<br />
20<br />
0<br />
–20<br />
–40<br />
–60<br />
120<br />
100<br />
80<br />
60<br />
40<br />
20<br />
0<br />
male female all<br />
white black Caribbean black African Indian Pakistani Bangladeshi Ch<strong>in</strong>ese<br />
male female all<br />
other/mixed<br />
–20<br />
–40<br />
white black Caribbean black African Indian Pakistani Bangladeshi Ch<strong>in</strong>ese<br />
other/mixed<br />
Fig. 19 (previous<br />
spread): EGR by<br />
medic<strong>in</strong>e <strong>and</strong> related<br />
subjects.<br />
Notes:<br />
1. Figures based on<br />
undergraduate students<br />
only.<br />
2. Engl<strong>and</strong>- <strong>and</strong> Walesdomiciled<br />
EGR is calculated<br />
with respect to the ethnicgender<br />
breakdown <strong>of</strong> the<br />
undergraduate population<br />
as a whole.<br />
Source: HESA student data set<br />
2002/2003<br />
are particularly prevalent <strong>in</strong> computer science. <strong>Ethnic</strong> Asian<br />
groups <strong>in</strong> particular are over-represented <strong>in</strong> this subject<br />
area, with Indian, Pakistani <strong>and</strong> Bangladeshi males almost<br />
three times as likely to study comput<strong>in</strong>g as would be<br />
expected based on the undergraduate population. There is<br />
a strong gender divide <strong>in</strong> these subjects, with males dom<strong>in</strong>at<strong>in</strong>g<br />
particularly <strong>in</strong> physical <strong>and</strong> mathematical sciences.<br />
Similarly, figure 20 presents the analysis <strong>of</strong> EGR <strong>in</strong> medic<strong>in</strong>e<br />
<strong>and</strong> other related subjects (i.e. dentistry, pharmacology<br />
<strong>and</strong> ophthalmics). These subjects are vocational<br />
alternatives to science at undergraduate level <strong>and</strong> thus<br />
compete with chemistry <strong>and</strong> physics for students. The<br />
results show a very strong ethnic Asian bias towards these<br />
subjects, irrespective <strong>of</strong> gender. A chi-squared significance<br />
test shows that students are not r<strong>and</strong>omly allocated to<br />
these subjects by ethnic group.<br />
A strong preference for study<strong>in</strong>g medic<strong>in</strong>e is particularly<br />
apparent for Indian students. They account for 27% <strong>of</strong> all<br />
dentistry students, 19% <strong>of</strong> all pharmacology students <strong>and</strong><br />
32% <strong>of</strong> all ophthalmics students. These figures are remarkably<br />
large compared with the numbers that might be<br />
expected based on the proportion <strong>of</strong> Indian students <strong>in</strong> the<br />
undergraduate body. Indian students are 5% <strong>of</strong> the undergraduate<br />
student body <strong>and</strong> only 2.3% <strong>of</strong> the population <strong>of</strong><br />
young people. At the same time, both white <strong>and</strong> black students<br />
are very much under-represented <strong>in</strong> all <strong>of</strong> these areas<br />
(with the exception <strong>of</strong> a relatively large number <strong>of</strong> black<br />
African students <strong>in</strong> pharmacology).<br />
Law <strong>and</strong> bus<strong>in</strong>ess<br />
It is <strong>in</strong>formative to analyse two other vocational subject<br />
areas outside SET <strong>and</strong> medic<strong>in</strong>e that may be attractive as<br />
26 R EPRESENTATION OF E THNIC G ROUPS IN C HEMISTRY AND P HYSICS M AY 2006
7: <strong>Ethnic</strong>ity <strong>and</strong> undergraduate studies<br />
60<br />
percentage <strong>of</strong> all students <strong>in</strong> all subject areas<br />
50<br />
40<br />
30<br />
20<br />
10<br />
first<br />
upper second<br />
0<br />
white black Caribbean black African Indian Pakistani Bangladeshi Ch<strong>in</strong>ese<br />
alternative career paths, that is law <strong>and</strong> bus<strong>in</strong>ess.<br />
EGR <strong>in</strong> these subject areas is shown <strong>in</strong> figures 20 <strong>and</strong><br />
21. Aga<strong>in</strong>, strong ethnicity effects emerge. A chi-squared<br />
significance test shows that students are not r<strong>and</strong>omly allocated<br />
by ethnic group. Both subjects are successful <strong>in</strong><br />
attract<strong>in</strong>g ethnic-m<strong>in</strong>ority students. Law, <strong>in</strong> particular,<br />
attracts large numbers <strong>of</strong> ethnic-m<strong>in</strong>ority females. Pakistani<br />
<strong>and</strong> Bangladeshi women are almost three times as prevalent<br />
<strong>in</strong> law as would be expected based on undergraduate<br />
population numbers.<br />
Similarly, bus<strong>in</strong>ess <strong>and</strong> adm<strong>in</strong>istration is successful <strong>in</strong><br />
attract<strong>in</strong>g ethnic-m<strong>in</strong>ority groups; aga<strong>in</strong>, especially women.<br />
In contrast to SET, the ethnic-m<strong>in</strong>ority group over-representation<br />
<strong>in</strong> this area also <strong>in</strong>cludes students from black<br />
Caribbean <strong>and</strong> black African backgrounds.<br />
7.3: Achievement <strong>in</strong> undergraduate<br />
chemistry <strong>and</strong> physics<br />
High achievement <strong>in</strong> undergraduate chemistry <strong>and</strong> physics<br />
is normally a prerequisite for further study <strong>and</strong> progress<strong>in</strong>g<br />
towards a career <strong>in</strong> either science. This stage <strong>of</strong> atta<strong>in</strong>ment<br />
is not only a key milestone <strong>in</strong> progress along the educational<br />
pipel<strong>in</strong>e, but also provides a benchmark population<br />
for compar<strong>in</strong>g numbers <strong>of</strong> students <strong>in</strong> postgraduate study<br />
<strong>in</strong> the next section <strong>of</strong> this report.<br />
The proportions <strong>of</strong> students obta<strong>in</strong><strong>in</strong>g first- or upper-second-class<br />
degrees by ethnic group <strong>in</strong> chemistry, physics<br />
<strong>and</strong> overall are presented <strong>in</strong> figures 22–24. This analysis<br />
uses a merged data set <strong>of</strong> students complet<strong>in</strong>g their studies<br />
between 1996/1997 <strong>and</strong> 2001/2002. The strik<strong>in</strong>g<br />
feature <strong>of</strong> the results is that a much higher proportion <strong>of</strong><br />
white students obta<strong>in</strong> first- or upper-second-class degrees<br />
compared with students from other ethnicities. 28 This<br />
applies not only to chemistry <strong>and</strong> physics but across all<br />
subjects. If obta<strong>in</strong><strong>in</strong>g a first or upper-second is ranked by<br />
all subjects<br />
ethnicity, rank<strong>in</strong>gs <strong>in</strong> chemistry <strong>and</strong> physics are remarkably<br />
consistent, not only with all subjects (lower panel <strong>in</strong> the figure)<br />
but with a whole range <strong>of</strong> subjects. The general pattern<br />
<strong>of</strong> white students be<strong>in</strong>g the highest achievers, followed<br />
by Ch<strong>in</strong>ese <strong>and</strong> Indian, is repeated with remarkable consistency.<br />
Evidence <strong>of</strong> this is shown <strong>in</strong> appendix 8.<br />
The implication <strong>of</strong> these f<strong>in</strong>d<strong>in</strong>gs for chemistry <strong>and</strong><br />
physics is that the most under-represented ethnic groups <strong>in</strong><br />
the student body (i.e. black students <strong>in</strong> chemistry, <strong>and</strong> <strong>in</strong><br />
physics all groups other than white <strong>and</strong> Ch<strong>in</strong>ese students)<br />
tend to be the ethnic group<strong>in</strong>gs that do the least well <strong>in</strong> their<br />
undergraduate studies. This further restricts the proportions<br />
<strong>of</strong> these groups qualified for postgraduate study <strong>in</strong> chemistry<br />
<strong>and</strong> physics.<br />
The effect <strong>of</strong> this is that the higher levels <strong>of</strong> chemistry <strong>and</strong><br />
physics are dom<strong>in</strong>ated by a small number <strong>of</strong> ethnic groups.<br />
Most severely affected by low achievement <strong>in</strong> undergraduate<br />
studies are black Caribbean <strong>and</strong> black African students.<br />
On average they are only half as likely to get a first or<br />
upper-second compared with white students.<br />
<strong>Ethnic</strong> Asian groups <strong>in</strong> general fair a little better, especially<br />
Indian students, but still students from these groups<br />
tend to fair less well than their white counterparts.<br />
A recent study attempts to expla<strong>in</strong> some <strong>of</strong> the differences<br />
<strong>in</strong> degree performance between white students <strong>and</strong><br />
non-white groups (Leslie, 2005). It is argued that much <strong>of</strong><br />
the under-performance can be expla<strong>in</strong>ed because ethnicm<strong>in</strong>ority<br />
students are, on average, less well qualified when<br />
they enter, which may be partially expla<strong>in</strong>ed because far<br />
larger numbers apply. A dim<strong>in</strong>ution <strong>in</strong> average quality <strong>of</strong><br />
applicant would be expected. A second cause is that the<br />
ethnic communities tend to specialise <strong>in</strong> subjects where<br />
fewer good degrees are awarded (e.g. medic<strong>in</strong>e).<br />
The study presents a methodology for account<strong>in</strong>g for the<br />
difference <strong>in</strong> entry qualifications <strong>and</strong> “subject ease” (which<br />
other/mixed<br />
Fig. 22: Proportion <strong>of</strong><br />
students obta<strong>in</strong><strong>in</strong>g firstor<br />
upper-second-class<br />
degrees <strong>in</strong> all subjects,<br />
by ethnic group.<br />
Notes:<br />
1. Engl<strong>and</strong>- <strong>and</strong> Walesdomiciled<br />
students only.<br />
2. Percentages exclude<br />
those whose ethnicity is not<br />
known.<br />
Source: HESA first dest<strong>in</strong>ation<br />
surveys comb<strong>in</strong>ed cohort<br />
1996/1997–2001/2002<br />
28. White students are<br />
significantly more likely to obta<strong>in</strong><br />
a first or upper-second <strong>in</strong><br />
chemistry or physics than all<br />
other ethnic-m<strong>in</strong>ority groups,<br />
<strong>in</strong>dividually or taken as a whole,<br />
us<strong>in</strong>g a two-sample proportions<br />
T-test. This strong result can be<br />
replicated for most subject<br />
group<strong>in</strong>gs (appendix 8).<br />
R EPRESENTATION OF E THNIC G ROUPS IN C HEMISTRY AND P HYSICS M AY 2006<br />
27
7: <strong>Ethnic</strong>ity <strong>and</strong> undergraduate studies<br />
60<br />
percentage <strong>of</strong> students complet<strong>in</strong>g chemistry degrees<br />
50<br />
40<br />
30<br />
20<br />
10<br />
first<br />
upper second<br />
0<br />
Fig. 23: Proportion <strong>of</strong><br />
students obta<strong>in</strong><strong>in</strong>g firstor<br />
upper-second-class<br />
degrees <strong>in</strong> chemistry, by<br />
ethnic group.<br />
Notes:<br />
1. Engl<strong>and</strong>- <strong>and</strong> Walesdomiciled<br />
students only.<br />
2. Percentages exclude<br />
those whose ethnicity is not<br />
known.<br />
Source: HESA first dest<strong>in</strong>ation<br />
surveys comb<strong>in</strong>ed cohort<br />
1996/1997–2001/2002<br />
white black Caribbean black African Indian Pakistani Bangladeshi Ch<strong>in</strong>ese<br />
chemistry<br />
is def<strong>in</strong>ed by the proportion <strong>of</strong> first <strong>and</strong> upper-seconds<br />
awarded to white students). This shows that, at least <strong>in</strong> part,<br />
the under-achievement <strong>of</strong> different ethnic groups can be<br />
accounted for by lower higher-education entry qualifications<br />
<strong>and</strong> by subject difficulty.<br />
However, even after account<strong>in</strong>g for entry qualifications<br />
<strong>and</strong> subject choice, the ethnic-m<strong>in</strong>ority communities are<br />
other/mixed<br />
still somewhat beh<strong>in</strong>d <strong>in</strong> terms <strong>of</strong> degree result. The study<br />
exam<strong>in</strong>es broad subject classifications (e.g. physical sciences)<br />
rather than <strong>in</strong>dividual subjects <strong>and</strong> does not take<br />
socioeconomic factors <strong>in</strong>to account. Consequently,<br />
although overall performance <strong>of</strong> the ethnic-m<strong>in</strong>ority cohorts<br />
<strong>in</strong> broad subjects may be to some extent expla<strong>in</strong>ed by the<br />
study, questions still rema<strong>in</strong> at the <strong>in</strong>dividual subject level.<br />
28 R EPRESENTATION OF E THNIC G ROUPS IN C HEMISTRY AND P HYSICS M AY 2006
8: <strong>Ethnic</strong>ity <strong>and</strong> postgraduate studies<br />
60<br />
percentage <strong>of</strong> students compleat<strong>in</strong>g physics degrees<br />
50<br />
40<br />
30<br />
20<br />
10<br />
first<br />
upper second<br />
0<br />
white black caribbian black African Indian Pakistani Bangladeshi Ch<strong>in</strong>ese<br />
physics<br />
other/mixed<br />
Fig. 24: Proportion <strong>of</strong><br />
students obta<strong>in</strong><strong>in</strong>g firstor<br />
upper-second-class<br />
degrees <strong>in</strong> physics, by<br />
ethnic group.<br />
Note: 1. Engl<strong>and</strong>- <strong>and</strong><br />
Wales-domiciled students<br />
only.<br />
2. Percentages exclude<br />
those whose ethnicity is not<br />
known.<br />
Source: HESA first dest<strong>in</strong>ation<br />
surveys comb<strong>in</strong>ed cohort<br />
1996/1997–2001/2002<br />
R EPRESENTATION OF E THNIC G ROUPS IN C HEMISTRY AND P HYSICS M AY 2006<br />
29
8: <strong>Ethnic</strong>ity <strong>and</strong> postgraduate studies<br />
8: <strong>Ethnic</strong>ity <strong>and</strong> postgraduate studies<br />
“<strong>Ethnic</strong>-m<strong>in</strong>ority<br />
students<br />
graduat<strong>in</strong>g <strong>in</strong><br />
chemistry <strong>and</strong><br />
physics are more<br />
<strong>in</strong>cl<strong>in</strong>ed to study<br />
subjects other<br />
than chemistry<br />
<strong>and</strong> physics at<br />
postgraduate<br />
level.”<br />
Fig. 25: <strong>Ethnic</strong> <strong>and</strong><br />
gender composition <strong>of</strong><br />
doctorate chemistry.<br />
Notes:<br />
1. The percentages relate to<br />
Engl<strong>and</strong>- <strong>and</strong> Walesdomiciled<br />
students<br />
study<strong>in</strong>g for a doctorate.<br />
2. Numbers exclude those<br />
whose ethnicity is unknown.<br />
Source: HESA student data set<br />
2002/2003<br />
29. The benchmark population is<br />
shown <strong>in</strong> section 6, based on<br />
students complet<strong>in</strong>g their<br />
undergraduate studies <strong>in</strong><br />
2001/2002. The ethnic <strong>and</strong><br />
gender breakdown <strong>of</strong> this group <strong>in</strong><br />
chemistry <strong>and</strong> physics, which is<br />
used for benchmark<br />
comparisons, is shown <strong>in</strong><br />
appendix 8.<br />
percentage <strong>of</strong> all chemistry postgraduates<br />
70<br />
60<br />
50<br />
40<br />
30<br />
20<br />
10<br />
0<br />
59.3<br />
white<br />
0.1 0.2<br />
black Caribbean<br />
black African<br />
2.3<br />
Indian<br />
0.8 0.3 0.8 1.8<br />
Pakistani<br />
male<br />
male<br />
Bangladeshi<br />
female<br />
Ch<strong>in</strong>ese<br />
mixed<br />
The completion <strong>of</strong> undergraduate studies is the f<strong>in</strong>al bifurcation<br />
po<strong>in</strong>t <strong>in</strong> the educational pipel<strong>in</strong>e. At this po<strong>in</strong>t, students<br />
must make decisions regard<strong>in</strong>g their careers <strong>and</strong>, <strong>in</strong><br />
particular, whether or not to study chemistry or physics at<br />
postgraduate level; study <strong>in</strong> an area perhaps more vocationally<br />
orientated; or enter the job market. This section<br />
exam<strong>in</strong>es the extent to which attrition from undergraduate<br />
to postgraduate study depends on ethnicity. This is done<br />
by analys<strong>in</strong>g EGR among postgraduates <strong>in</strong> chemistry <strong>and</strong><br />
physics <strong>in</strong> a similar manner to that previously described.<br />
EGR is measured with reference to a benchmark group <strong>of</strong><br />
those achiev<strong>in</strong>g a first- or upper-second-class degree <strong>in</strong><br />
chemistry or physics. 29<br />
Exam<strong>in</strong><strong>in</strong>g the ethnic composition <strong>of</strong> students study<strong>in</strong>g<br />
for postgraduate qualifications <strong>in</strong> chemistry or physics<br />
based on 2002/2003 student data reveals that, <strong>in</strong> chemistry<br />
<strong>and</strong> physics, the majority <strong>of</strong> students classed as postgraduate<br />
are on doctoral rather than masters programmes.<br />
Based on 2002/2003 figures, 79% <strong>of</strong> postgraduate students<br />
<strong>in</strong> chemistry <strong>and</strong> 76% <strong>of</strong> postgraduate students <strong>in</strong><br />
physics were enrolled on doctorate programmes. Analysis<br />
is therefore restricted to the last stage <strong>of</strong> the pipel<strong>in</strong>e (i.e.<br />
those study<strong>in</strong>g on doctorate programmes).<br />
Figure 25 shows the ethnic <strong>and</strong> gender composition <strong>of</strong><br />
doctorate chemistry, based on a percentage breakdown <strong>of</strong><br />
the student body. White males dom<strong>in</strong>ate the Engl<strong>and</strong>- <strong>and</strong><br />
Wales-domiciled doctorate chemistry student body, <strong>in</strong> contrast<br />
to the less pronounced gender imbalance <strong>in</strong> undergraduate<br />
chemistry, with numbers <strong>of</strong> ethnic-m<strong>in</strong>ority<br />
students be<strong>in</strong>g very small.<br />
To measure EGR the data are normalised (by subject)<br />
with respect to the population that achieves a first or uppersecond,<br />
as described above. The result<strong>in</strong>g measures <strong>of</strong> EGR<br />
are shown <strong>in</strong> figure 26. This confirms white male dom<strong>in</strong>ation.<br />
Us<strong>in</strong>g a chi-squared significance test, it is shown that<br />
students are not r<strong>and</strong>omly allocated to postgraduate chemistry<br />
by ethnic group, based on the population <strong>of</strong> undergraduates<br />
achiev<strong>in</strong>g a first- or upper-second-class degree <strong>in</strong><br />
chemistry.<br />
Data show that white males are over-represented relative<br />
to their undergraduate numbers, whereas white<br />
females <strong>and</strong> most non-white groups, particularly ethnic<br />
Asian students, are notably under-represented.<br />
Similar patterns are observed for physics. Us<strong>in</strong>g a chisquared<br />
significance test, it is shown that students are not<br />
r<strong>and</strong>omly allocated to postgraduate physics by ethnic<br />
group, based on the population <strong>of</strong> undergraduates achiev<strong>in</strong>g<br />
a first or upper-second <strong>in</strong> the same subject. Figure 27<br />
shows the ethnic <strong>and</strong> gender composition <strong>of</strong> the Engl<strong>and</strong><strong>and</strong><br />
Wales-domiciled doctorate physics student body.<br />
Figure 28 shows the EGR for physics relative to numbers<br />
achiev<strong>in</strong>g a first or upper-second at undergraduate level.<br />
The data show that, even relative to the population<br />
achiev<strong>in</strong>g first- or upper-second-class degrees at undergraduate<br />
level, those outside the white male population<br />
(with only m<strong>in</strong>or exceptions) show relatively little <strong>in</strong>cl<strong>in</strong>ation<br />
to study physics beyond undergraduate level.<br />
Further study <strong>in</strong> other subjects<br />
The proportion <strong>of</strong> students go<strong>in</strong>g on to further study <strong>in</strong> general,<br />
not necessarily <strong>in</strong> chemistry or physics, is now exam<strong>in</strong>ed.<br />
Figure 29 shows the percentage <strong>of</strong> chemistry <strong>and</strong><br />
physics graduates, by ethnic group, go<strong>in</strong>g on to further<br />
study (irrespective <strong>of</strong> subject), based onthe HESA first des-<br />
30.4<br />
white<br />
0.1 0.3 1.3 0.7 0.1 0.5 1.1<br />
black Caribbean<br />
black African<br />
Indian<br />
Pakistani<br />
female<br />
Bangladeshi<br />
Ch<strong>in</strong>ese<br />
other/mixed<br />
30 R EPRESENTATION OF E THNIC G ROUPS IN C HEMISTRY AND P HYSICS M AY 2006
8: <strong>Ethnic</strong>ity <strong>and</strong> postgraduate studies<br />
ethnic-gender representation<br />
80<br />
60<br />
40<br />
20<br />
0<br />
–20<br />
–40<br />
–60<br />
male female all<br />
Fig. 26: EGR <strong>in</strong><br />
doctorate chemistry.<br />
Notes:<br />
1. Figures based on<br />
doctoral students.<br />
2. Engl<strong>and</strong>- <strong>and</strong> Walesdomiciled<br />
EGR is calculated<br />
with respect to the ethnicgender<br />
breakdown <strong>of</strong> the<br />
undergraduate population<br />
achiev<strong>in</strong>g a first- or uppersecond-class<br />
degree <strong>in</strong><br />
chemistry.<br />
3. Numbers exclude those<br />
whose ethnicity is unknown.<br />
Source: HESA student data set<br />
2002/2003<br />
–80<br />
white black Caribbean black African Indian Pakistani Bangladeshi Ch<strong>in</strong>ese<br />
other/mixed<br />
percentage <strong>of</strong> all physics postgraduates<br />
70<br />
60<br />
50<br />
40<br />
30<br />
20<br />
10<br />
0<br />
75.1<br />
white<br />
male female<br />
0.1 0.3 1.4 0.5 0.2 0.6 2.1<br />
black Caribbean<br />
black African<br />
Indian<br />
Pakistani<br />
Bangladeshi<br />
Ch<strong>in</strong>ese<br />
other/mixed<br />
male<br />
18.0<br />
white<br />
0.0 0.1 0.4 0.2 0.0 0.1 1.0<br />
black Caribbean<br />
black African<br />
Indian<br />
Pakistani<br />
Bangladeshi<br />
Ch<strong>in</strong>ese<br />
other/mixed<br />
female<br />
Fig. 27: <strong>Ethnic</strong> <strong>and</strong><br />
gender composition <strong>of</strong><br />
doctorate physics.<br />
Notes:<br />
1. The percentages relate to<br />
Engl<strong>and</strong>- <strong>and</strong> Walesdomiciled<br />
students<br />
study<strong>in</strong>g for a doctorate.<br />
2. Numbers exclude those<br />
whose ethnicity is unknown.<br />
Source: HESA student data set<br />
2002/2003<br />
t<strong>in</strong>ation survey <strong>in</strong> 2001/2002. The figures show that, while<br />
the majority <strong>of</strong> students do not choose further study<br />
(approximately a third <strong>of</strong> chemistry <strong>and</strong> physics graduates<br />
study at postgraduate level), 30 ethnic-m<strong>in</strong>ority students<br />
complet<strong>in</strong>g chemistry <strong>and</strong> physics degrees are, <strong>in</strong> fact, significantly<br />
more likely to cont<strong>in</strong>ue <strong>in</strong> further study than their<br />
white counterparts. 31 It appears, then, that ethnic-m<strong>in</strong>ority<br />
students graduat<strong>in</strong>g <strong>in</strong> chemistry <strong>and</strong> physics are more<br />
<strong>in</strong>cl<strong>in</strong>ed to study subjects other than chemistry <strong>and</strong> physics<br />
at postgraduate level.<br />
What cannot be determ<strong>in</strong>ed from quantitative census<br />
data, however, is whether this is the result <strong>of</strong> push or pull<br />
factors (i.e. whether ethnic-m<strong>in</strong>ority students become disillusioned<br />
with physical sciences dur<strong>in</strong>g their undergraduate<br />
studies or whether they show a more general<br />
preference, say, towards postgraduate programmes that<br />
they perceive to be more vocational).<br />
Further qualitative work is recommended to determ<strong>in</strong>e<br />
the causes, <strong>and</strong> further quantitative work to determ<strong>in</strong>e the<br />
nature <strong>of</strong> the further study.<br />
R EPRESENTATION OF E THNIC G ROUPS IN C HEMISTRY AND P HYSICS M AY 2006<br />
31
8: <strong>Ethnic</strong>ity <strong>and</strong> postgraduate studies<br />
Fig. 28: EGR <strong>in</strong><br />
doctorate physics.<br />
Notes:<br />
1. Figures based on<br />
doctoral students.<br />
2. Engl<strong>and</strong>- <strong>and</strong> Walesdomiciled<br />
EGR is calculated<br />
with respect to the ethnicgender<br />
breakdown <strong>of</strong> the<br />
undergraduate population<br />
achiev<strong>in</strong>g a first- or uppersecond-class<br />
degree <strong>in</strong><br />
physics.<br />
3. Numbers exclude those<br />
whose ethnicity is unknown.<br />
Source: HESA student data set<br />
2002/2003<br />
ethnic–gender representation<br />
120<br />
100<br />
80<br />
60<br />
40<br />
20<br />
0<br />
–20<br />
–40<br />
–60<br />
–80<br />
–100<br />
male female all<br />
white black Caribbean black African Indian Pakistani Bangladeshi Ch<strong>in</strong>ese<br />
other/mixed<br />
Fig. 29: Proportion <strong>of</strong><br />
students go<strong>in</strong>g on to<br />
further study, by ethnic<br />
group.<br />
Notes:<br />
1. Engl<strong>and</strong>- <strong>and</strong> Walesdomiciled<br />
students only.<br />
2. Percentages exclude<br />
those whose ethnicity is<br />
unknown.<br />
Source: HESA first dest<strong>in</strong>ation<br />
surveys comb<strong>in</strong>ed cohort<br />
1996/1997 – 2001/2002<br />
percentage <strong>of</strong> 2001/2 graduates<br />
60<br />
50<br />
40<br />
30<br />
20<br />
chemistry graduates physics graduates all graduates<br />
30. The percentage <strong>of</strong> students<br />
go<strong>in</strong>g on to further study from<br />
chemistry <strong>and</strong> physics is notably<br />
higher than the average for all<br />
subject areas.<br />
31. Based on a two-sample<br />
proportions T-test.<br />
10<br />
0<br />
white black Caribbean black African Indian Pakistani Bangladeshi Ch<strong>in</strong>ese<br />
other/mixed<br />
32 R EPRESENTATION OF E THNIC G ROUPS IN C HEMISTRY AND P HYSICS M AY 2006
9: Conclusions <strong>and</strong> recommendations<br />
9: Conclusions <strong>and</strong> recommendations<br />
The metaphor <strong>of</strong> the educational pipel<strong>in</strong>e helps us to visualise<br />
progression through a career <strong>in</strong> chemistry <strong>and</strong> physics.<br />
<strong>Chemistry</strong> <strong>and</strong> physics are white <strong>and</strong> male dom<strong>in</strong>ated at<br />
doctorate level (based on numbers <strong>of</strong> Engl<strong>and</strong>- <strong>and</strong> Walesdomiciled<br />
students), <strong>and</strong> the pipel<strong>in</strong>e helps us to underst<strong>and</strong><br />
how, <strong>and</strong> at what stage, different ethnic groups tend<br />
to leave chemistry <strong>and</strong> physics.<br />
Attrition is complex. Rates <strong>of</strong> attrition vary by ethnic group<br />
<strong>and</strong> gender at each stage. However, patterns emerge relat<strong>in</strong>g<br />
to ethnic-m<strong>in</strong>ority groups. Based on subject choices at<br />
A-level, only black Caribbean students show a strong preference<br />
aga<strong>in</strong>st study<strong>in</strong>g science subjects, relative to the<br />
white population.<br />
At undergraduate level, relative to the overall or to the<br />
undergraduate population, ethnic-m<strong>in</strong>ority groups generally<br />
tend not to study physics, result<strong>in</strong>g <strong>in</strong> a very strong white<br />
(<strong>and</strong> male) dom<strong>in</strong>ance <strong>in</strong> the subject. However, relative to<br />
those qualified to read physics (“potential undergraduate<br />
physicists”), ethnic-m<strong>in</strong>ority groups’ preference to read<br />
physics is variable. Only Pakistani students are more likely<br />
than white students to transfer from be<strong>in</strong>g potential undergraduate<br />
physicists to become undergraduate physicists.<br />
However, overall, relative to the number <strong>of</strong> young people<br />
<strong>in</strong> the population, only Ch<strong>in</strong>ese students are more likely to<br />
read undergraduate physics than white students. In fact,<br />
Ch<strong>in</strong>ese students are twice as likely as white students to<br />
read undergraduate physics.<br />
In undergraduate chemistry, only black Caribbean students<br />
are very much under-represented relative to the overall<br />
numbers <strong>in</strong> the population. In contrast, Indian <strong>and</strong><br />
Ch<strong>in</strong>ese students are more likely to read undergraduate<br />
chemistry than white students: Indian students are twice<br />
as likely, <strong>and</strong> Ch<strong>in</strong>ese students are three times as likely.<br />
Interest<strong>in</strong>gly, overall, Pakistani students are one-<strong>and</strong>-a-half<br />
times as likely as white students to read undergraduate<br />
chemistry.<br />
Greater attrition <strong>of</strong> ethnic m<strong>in</strong>orities<br />
The strongest evidence <strong>of</strong> a greater attrition rate <strong>of</strong> ethnicm<strong>in</strong>ority<br />
students relative to white students applies to the<br />
stages once students have begun their undergraduate studies.<br />
In common with other subjects, white students <strong>in</strong> chemistry<br />
<strong>and</strong> physics have far higher rates <strong>of</strong> achiev<strong>in</strong>g a first or<br />
upper-second degree than their ethnic-m<strong>in</strong>ority counterparts.<br />
However, the relative under-achievement <strong>of</strong> ethnicm<strong>in</strong>ority<br />
groups may be partly expla<strong>in</strong>ed because they are<br />
more likely to enter higher education <strong>and</strong> thus might, on<br />
average, be expected to do less well than the white majority.<br />
Tak<strong>in</strong>g <strong>in</strong>to account different groups’ achievement <strong>of</strong> a<br />
first or upper second, white students are more <strong>in</strong>cl<strong>in</strong>ed<br />
towards further study <strong>in</strong> chemistry <strong>and</strong> physics at postgraduate<br />
level. Evidence suggests that ethnic-m<strong>in</strong>ority students<br />
are not averse to postgraduate study, but they tend to study<br />
<strong>in</strong> other subject areas. This leads to the suspicion that there<br />
are different factors affect<strong>in</strong>g the decision mak<strong>in</strong>g <strong>of</strong> ethnicm<strong>in</strong>ority<br />
group students compared with white students.<br />
The under-representation <strong>of</strong> some ethnic-m<strong>in</strong>ority groups<br />
<strong>in</strong> chemistry <strong>and</strong> physics (notably young people <strong>of</strong> black<br />
Caribbean, Pakistani <strong>and</strong> Bangladeshi backgrounds) is<br />
largely the result <strong>of</strong> small numbers <strong>of</strong> students from these<br />
groups achiev<strong>in</strong>g at school or stay<strong>in</strong>g on for further study<br />
post-16. The result <strong>of</strong> this is attrition <strong>of</strong> these cohorts before<br />
patterns <strong>of</strong> study <strong>and</strong> revealed preferences for subject<br />
areas become clear. Unfortunately, this is <strong>in</strong> some sense<br />
exogenous to the science community because the causes<br />
<strong>of</strong> poor educational achievement among these groups lie<br />
outside science education <strong>and</strong> are possibly rooted <strong>in</strong><br />
socioeconomic circumstances, as well as parental <strong>and</strong><br />
peer-group <strong>in</strong>fluences. <strong>Groups</strong>’ self-fulfill<strong>in</strong>g expectations<br />
may also play a part (Harrison et al. 2003).<br />
It must also be noted that, for all ethnic groups, socioeconomic<br />
factors may play a significant role <strong>in</strong> educational<br />
achievement, <strong>in</strong> subject choices <strong>and</strong> <strong>in</strong> <strong>in</strong>fluenc<strong>in</strong>g decisions<br />
as to whether or not to undertake further study <strong>in</strong><br />
chemistry <strong>and</strong> physics. It is beyond the scope <strong>of</strong> this present<br />
study to exam<strong>in</strong>e the socioeconomic <strong>in</strong>fluences.<br />
Hav<strong>in</strong>g noted that, it is known that some ethnic groups are,<br />
on average, characterised as belong<strong>in</strong>g to lower socioeconomic<br />
classes than the average for the UK’s white population<br />
(Owen et al. 2003). This factor alone will adversely<br />
affect educational achievement.<br />
On the other h<strong>and</strong>, some <strong>of</strong> the observations highlighted<br />
<strong>in</strong> this report cannot be expla<strong>in</strong>ed solely by socioeconomic<br />
factors (e.g. the significantly higher proportion <strong>of</strong> Indian<br />
students who attend university relative to the white population,<br />
<strong>and</strong> the subject choices <strong>of</strong> some ethnic groups).<br />
Clearly, much detailed work could be carried out to disaggregate<br />
the effects <strong>of</strong> ethnicity <strong>and</strong> socioeconomic class<br />
on educational achievement.<br />
One other issue is the clear preference among some ethnic<br />
groups for medic<strong>in</strong>e-related subjects. Students <strong>in</strong> all<br />
ethnic-m<strong>in</strong>ority groups except black Caribbean students<br />
are more likely to achieve a chemistry A-level than white<br />
students. This is probably because A-level chemistry is<br />
required to study medic<strong>in</strong>e <strong>in</strong> higher education. Similarly,<br />
students <strong>in</strong> all ethnic-m<strong>in</strong>ority groups except the black<br />
Caribbean group are more likely to be a potential undergraduate<br />
chemist than white students.<br />
At the culm<strong>in</strong>ation <strong>of</strong> the chemistry <strong>and</strong> physics educational<br />
pipel<strong>in</strong>e, qualified chemists <strong>and</strong> physicists make<br />
choices regard<strong>in</strong>g occupation, <strong>in</strong>clud<strong>in</strong>g the choice <strong>of</strong><br />
whether or not to seek employment <strong>in</strong> academic chemistry<br />
<strong>and</strong> physics, <strong>in</strong> university departments as well as schools<br />
<strong>and</strong> colleges. 32 A lack <strong>of</strong> British non-white role models for<br />
“The underrepresentation<br />
<strong>of</strong><br />
some ethnicm<strong>in</strong>ority<br />
groups is<br />
largely the result<br />
<strong>of</strong> low numbers <strong>of</strong><br />
students from<br />
these groups<br />
achiev<strong>in</strong>g at<br />
school or stay<strong>in</strong>g<br />
on for further<br />
study post-16.”<br />
R EPRESENTATION OF E THNIC G ROUPS IN C HEMISTRY AND P HYSICS M AY 2006<br />
33
9: Conclusions <strong>and</strong> recommendations<br />
32. Employment choices are not<br />
analysed <strong>in</strong> this report.<br />
non-white students to aspire to, or to <strong>of</strong>fer guidance <strong>and</strong><br />
support, as an end-effect <strong>of</strong> the attrition <strong>of</strong> ethnic-m<strong>in</strong>ority<br />
groups documented, may <strong>in</strong> part contribute to non-white<br />
groups’ relative reluctance to study chemistry <strong>and</strong> physics.<br />
A detailed exam<strong>in</strong>ation <strong>of</strong> the occupations <strong>of</strong> chemistry<br />
<strong>and</strong> physics leavers from higher education is not possible<br />
because populations are too small for statistically significant<br />
conclusions to be drawn. Similarly, chemists <strong>and</strong><br />
physicists from ethnic-m<strong>in</strong>ority groups are too scarce <strong>in</strong> LFS<br />
data to allow any firm conclusions to be drawn about the<br />
occupations <strong>of</strong> different ethnic groups.<br />
To obta<strong>in</strong> <strong>in</strong>formation about the career paths <strong>of</strong> chemists<br />
<strong>and</strong> physicists from different ethnic groups, a longitud<strong>in</strong>al<br />
study would probably be the best approach. However, there<br />
will not be enough graduates from some ethnic groups for<br />
even this approach to yield statistically significant data.<br />
Some <strong>in</strong>formation about the ethnicity <strong>of</strong> academic staff<br />
<strong>in</strong> chemistry <strong>and</strong> physics is given <strong>in</strong> appendix 9.<br />
Based on the f<strong>in</strong>d<strong>in</strong>gs <strong>in</strong> this report, the follow<strong>in</strong>g recommendations<br />
are made:<br />
● Work should be undertaken to disaggregate the effects<br />
<strong>of</strong> socioeconomic class <strong>and</strong> ethnicity <strong>in</strong> respect <strong>of</strong><br />
educational achievement <strong>and</strong> subject choices.<br />
● A study should be undertaken to exam<strong>in</strong>e factors<br />
affect<strong>in</strong>g undergraduate subject choice by ethnic<br />
group, especially concentrat<strong>in</strong>g on those study<strong>in</strong>g<br />
A-level comb<strong>in</strong>ations that are likely to qualify them as<br />
potential undergraduate chemists <strong>and</strong> physicists.<br />
● Work should be undertaken to exam<strong>in</strong>e different ethnic<br />
groups’ experiences <strong>of</strong> higher education <strong>in</strong> chemistry<br />
<strong>and</strong> physics, to explore <strong>in</strong> more detail why ethnicm<strong>in</strong>ority<br />
groups on average do less well than the<br />
majority white population at university; <strong>and</strong> why these<br />
groups are also less likely than the white population to<br />
choose postgraduate study <strong>in</strong> chemistry <strong>and</strong> physics,<br />
even when qualified to do so.<br />
● Related to the recommendation above, work should be<br />
undertaken to exam<strong>in</strong>e what courses <strong>of</strong> further study<br />
students, especially ethnic m<strong>in</strong>ority-groups, do<br />
undertake <strong>and</strong> the reasons for their choices.<br />
34 R EPRESENTATION OF E THNIC G ROUPS IN C HEMISTRY AND P HYSICS M AY 2006
References<br />
Connor H, Tyers C, Davis S <strong>and</strong> Tackay, N D 2003 M<strong>in</strong>ority<br />
ethnic students <strong>in</strong> higher education: <strong>in</strong>terim report,<br />
Institute for Employment Studies, DfES Research<br />
Report 448.<br />
Demack S, Drew D <strong>and</strong> Grimsley M 2002 M<strong>in</strong>d<strong>in</strong>g the<br />
gap: ethnic, gender <strong>and</strong> social class differences <strong>in</strong><br />
atta<strong>in</strong>ment at 16. Race, <strong>Ethnic</strong>ity <strong>and</strong> Education 3(2)<br />
118–143.<br />
DfES 2004 National Curriculum Assessment <strong>and</strong> GCSE<br />
<strong>and</strong> GNVQ Atta<strong>in</strong>ment by Pupil Characteristics <strong>in</strong><br />
Engl<strong>and</strong>.<br />
Elias P, McKnight A, Pitcher J, Purcell K, <strong>and</strong> Simm C<br />
1999 Mov<strong>in</strong>g on: Graduate Careers Three Years after<br />
Graduation (CSU, Manchester).<br />
Gilborn D <strong>and</strong> Mirza H 2000 Educational <strong>in</strong>equality:<br />
mapp<strong>in</strong>g race, class <strong>and</strong> gender, report for OfSTED,<br />
HMSO.<br />
Harrison B, Mannion K, Bev<strong>in</strong>s S C <strong>and</strong> Jordan J 2003<br />
<strong>Ethnic</strong>ity <strong>and</strong> underachievement <strong>in</strong> science <strong>and</strong><br />
mathematics education, report for the Royal Society,<br />
Centre for Science Education, Sheffield Hallam<br />
University.<br />
Jones P <strong>and</strong> Elias P 2004 Science, eng<strong>in</strong>eer<strong>in</strong>g <strong>and</strong><br />
technology <strong>and</strong> the UK’s ethnic m<strong>in</strong>ority population,<br />
report for the Royal Society.<br />
Leslie D 2005 Why people from the UK’s m<strong>in</strong>ority ethnic<br />
communities achieve weaker degree results than<br />
whites Applied Economics 37 619–632.<br />
Leslie D <strong>and</strong> Dr<strong>in</strong>kwater S 1999 Stay<strong>in</strong>g on <strong>in</strong> full-time<br />
education: reasons for higher participation rates<br />
among ethnic m<strong>in</strong>ority males <strong>and</strong> females Economica<br />
London School <strong>of</strong> Economics <strong>and</strong> Political Science 66<br />
(127) 63–77.<br />
Modood T 1997 <strong>Ethnic</strong> M<strong>in</strong>orities <strong>in</strong> Brita<strong>in</strong>: Diversity <strong>and</strong><br />
Disadvantage (Policy Studies Institute, London).<br />
Owen D, Green A, Pitcher J <strong>and</strong> Maguire M 2003 M<strong>in</strong>ority<br />
ethnic participation <strong>and</strong> achievements <strong>in</strong> education,<br />
tra<strong>in</strong><strong>in</strong>g <strong>and</strong> the labour market, DfES research report<br />
225.<br />
R EPRESENTATION OF E THNIC G ROUPS IN C HEMISTRY AND P HYSICS M AY 2006<br />
35
Appendices<br />
Appendix 1a: Estimated numbers <strong>of</strong> students at each stage <strong>in</strong> chemistry based on a school-leav<strong>in</strong>g cohort (all<br />
ethnic groups comb<strong>in</strong>ed)<br />
Stage description Estimated Percentage<br />
numbers <strong>of</strong> cohorts<br />
Youth Cohort Study<br />
(LFS estimate) year group cohort <strong>of</strong> 16/17-year-olds 665 000 100.0<br />
1 obta<strong>in</strong><strong>in</strong>g five or more GCSEs at grades A*–C 325 900 49.0<br />
2 obta<strong>in</strong><strong>in</strong>g an A-level <strong>in</strong> chemistry 36 000 5.4<br />
3 potential undergraduate chemist: suitably qualified at A-level to study chemistry at university 23 300 3.5<br />
study<strong>in</strong>g on a degree course at 18/19 144 600 21.7<br />
HESA data<br />
undergraduate degree students – all years* 717 600 100.0<br />
first-year undergraduate students – all subjects* 241 600 33.7<br />
4 study<strong>in</strong>g undergraduate degree <strong>in</strong> chemistry – all years* 8800 1.2<br />
5 achiev<strong>in</strong>g a first or upper second <strong>in</strong> chemistry † 4600 0.6<br />
*Figure <strong>in</strong>cludes undergraduates <strong>of</strong> any age domiciled <strong>in</strong> Engl<strong>and</strong> <strong>and</strong> Wales.<br />
†Figure based on percentage <strong>of</strong> those study<strong>in</strong>g undergraduate degree <strong>in</strong> chemistry.<br />
Notes:<br />
1. The size <strong>of</strong> the school-leav<strong>in</strong>g cohort is estimated based on estimates from the LFS (spr<strong>in</strong>g 2004).<br />
2. Proportions <strong>in</strong> the YCS are based on merged data 1996–2004. Numbers are <strong>in</strong>ferred based on these percentages <strong>of</strong> the school-leav<strong>in</strong>g cohort.<br />
3. Potential scientists at A-level are identified us<strong>in</strong>g the UCAS18 def<strong>in</strong>ition described <strong>in</strong> section 6.2.<br />
4. Student numbers on degree programmes are based on HESA data from 2002/2003.<br />
5. Degree classification is based on the HESA first-dest<strong>in</strong>ation data from 2001/2002.<br />
6. Estimates are rounded to the nearest hundred.<br />
Appendix 1b: Estimated numbers <strong>of</strong> students at each stage <strong>in</strong> physics based on a school-leav<strong>in</strong>g cohort (all ethnic<br />
groups comb<strong>in</strong>ed)<br />
Stage description Estimated Percentage<br />
numbers <strong>of</strong> cohorts<br />
Youth Cohort Study<br />
(LFS estimate) year group cohort <strong>of</strong> 16/17-year-olds 665 000 100.0<br />
1 obta<strong>in</strong><strong>in</strong>g five or more GCSEs at grades A*–C 325 900 49.0<br />
2 obta<strong>in</strong><strong>in</strong>g an A-level <strong>in</strong> physics 31 500 4.7<br />
3 potential undergraduate physicist: suitably qualified at A-level to study physics at university 16 600 2.5<br />
study<strong>in</strong>g on a degree course at 18/19 144 600 21.7<br />
HESA data<br />
undergraduate degree students – all years* 717 600 100.0<br />
first-year undergraduate students – all subjects* 241 600 33.7<br />
4 study<strong>in</strong>g undergraduate degree <strong>in</strong> physics – all years* 6600 0.9<br />
5 achiev<strong>in</strong>g a first or upper second <strong>in</strong> physics † 3800 0.6<br />
*Figure <strong>in</strong>cludes undergraduates <strong>of</strong> any age domiciled <strong>in</strong> Engl<strong>and</strong> <strong>and</strong> Wales.<br />
†Figure based on percentage <strong>of</strong> those study<strong>in</strong>g undergraduate degree <strong>in</strong> physics.<br />
Notes:<br />
1. The size <strong>of</strong> the school-leav<strong>in</strong>g cohort is estimated based on estimates from the LFS (spr<strong>in</strong>g 2004).<br />
2. Proportions <strong>in</strong> the YCS are based on merged data 1996–2004. Numbers are <strong>in</strong>ferred based on these percentages <strong>of</strong> the school-leav<strong>in</strong>g cohort.<br />
3. Potential scientists at A-level are identified us<strong>in</strong>g the UCAS18 def<strong>in</strong>ition described <strong>in</strong> section 6.2.<br />
4. Student numbers on degree programmes are based on HESA data from 2002/2003.<br />
5. Degree classification is based on the HESA first-dest<strong>in</strong>ation data from 2001/2002.<br />
6. Estimates are rounded to the nearest hundred.<br />
36 R EPRESENTATION OF E THNIC G ROUPS IN C HEMISTRY AND P HYSICS M AY 2006
Appendices<br />
Appendix 2: Science A-levels <strong>in</strong> the YCS with DfES cod<strong>in</strong>g<br />
001 101 Biology<br />
002 103 Biology: human<br />
003 105 Biology: social<br />
004 106 Biology: human <strong>and</strong> social<br />
005 111 <strong>Chemistry</strong><br />
006 121 <strong>Physics</strong><br />
007 131 Science: S<strong>in</strong>gle Award<br />
008 133 Science: Dual Award (1st grade)<br />
009 135 Science: Dual Award (2nd grade)<br />
010 137 Science: Double Award (1st grade)<br />
011 139 Science: Double Award (2nd grade)<br />
012 141 Science: biology <strong>and</strong> chemistry<br />
013 145 Science: biology <strong>and</strong> physics<br />
014 147 Science: chemistry <strong>and</strong> physics<br />
015 163 Aeronautics<br />
016 165 Science: agriculture<br />
017 167 Science: applied<br />
018 169 Science: astronomy<br />
019 171 Botany<br />
020 173 Science: electronics<br />
021 175 Science: environmental<br />
022 177 Science: geology<br />
023 179 Science: horticulture<br />
024 181 Science: physical<br />
026 185 Robotics<br />
027 187 Science: rural<br />
028 191 Science <strong>in</strong> society<br />
029 193 Science: technology<br />
030 197 Science: zoology<br />
031 199 Science: meteorology<br />
032 201 Eng<strong>in</strong>eer<strong>in</strong>g science<br />
033 203 Science: other<br />
034 221 Mathematics<br />
035 223 Mathematics (pure)<br />
036 224 Decision/discrete mathematics<br />
037 225 Mathematics (applied)<br />
038 227 Mathematics (pure <strong>and</strong> applied)<br />
039 228 Pure <strong>and</strong> decision mathematics<br />
040 229 Mathematics (pure <strong>and</strong> statistics)<br />
041 230 Statistics <strong>and</strong> decision mathematics<br />
042 231 Mathematics (pure <strong>and</strong> mechanics)<br />
043 233 Mathematics (further)<br />
044 234 Additional mathematics<br />
045 235 Mathematical studies<br />
046 251 Statistics<br />
Note: First column is the National Centre for Social Research code. Second<br />
column is the DfES code.<br />
Source: Office <strong>of</strong> National Statistics<br />
R EPRESENTATION OF E THNIC G ROUPS IN C HEMISTRY AND P HYSICS M AY 2006<br />
37
Appendices<br />
Appendix 3: A-level chemistry <strong>and</strong> potential undergraduate chemists<br />
<strong>Ethnic</strong> group A-level chemistry plus 1 science, potential potential potential YCS sample<br />
males <strong>in</strong>clud<strong>in</strong>g maths undergraduate undergraduate undergraduate<br />
chemist (UCAS12) chemist (UCAS18) chemist (UCAS24)<br />
white 5.31 (0.21) 4.82 (0.20) 3.47 (0.17) 3.30 (0.17) 2.39 (0.14) 12 104<br />
black Caribbean 2.92 (3.25) 2.92 (3.12) 0.76 (2.67) 0.76 (2.61) 0.00 (2.23) 50<br />
black African 5.47 (3.39) 5.47 (3.25) 4.28 (2.79) 3.26 (2.72) 1.09 (2.32) 46<br />
Indian 12.51 (1.17) 11.91 (1.12) 8.70 (0.96) 8.38 (0.94) 6.77 (0.80) 386<br />
Pakistani 5.21 (1.56) 5.21 (1.49) 3.89 (1.28) 3.37 (1.25) 1.14 (1.07) 218<br />
Bangladeshi 7.52 (2.24) 7.52 (2.15) 5.63 (1.85) 5.06 (1.80) 2.16 (1.54) 105<br />
Ch<strong>in</strong>ese 14.17 (2.42) 14.17 (2.33) 12.53 (1.99) 11.53 (1.94) 10.64 (1.66) 90<br />
mixed 7.14 (2.45) 6.60 (2.35) 4.82 (2.02) 4.82 (1.97) 3.22 (1.68) 88<br />
<strong>Ethnic</strong> group A-level chemistry plus 1 science, potential potential potential YCS sample<br />
females <strong>in</strong>clud<strong>in</strong>g maths undergraduate undergraduate undergraduate<br />
chemist (UCAS12) chemist (UCAS18) chemist (UCAS24)<br />
white 4.89 (0.17) 4.44 (0.16) 3.46 (0.15) 3.31 (0.14) 2.30 (0.12) 16 600<br />
black Caribbean 0.63 (2.34) 0.63 (2.23) 0.63 (1.98) 0.63 (1.94) 0.63 (1.61) 90<br />
black African 9.87 (2.67) 8.71 (2.55) 7.37 (2.26) 7.37 (2.21) 3.43 (1.84) 69<br />
Indian 11.40 (1.00) 10.34 (0.96) 7.64 (0.85) 7.09 (0.83) 4.90 (0.69) 488<br />
Pakistani 6.49 (1.21) 5.56 (1.17) 4.35 (1.04) 4.18 (1.01) 2.77 (0.85) 328<br />
Bangladeshi 5.86 (1.19) 3.71 (1.90) 2.73 (1.69) 2.37 (1.65) 1.37 (1.38) 124<br />
Ch<strong>in</strong>ese 15.05 (2.23) 14.40 (2.13) 12.24 (1.89) 12.24 (1.85) 5.99 (1.54) 99<br />
mixed 8.48 (1.75) 7.99 (1.67) 6.49 (1.48) 5.77 (1.45) 3.76 (1.21) 61<br />
Notes: These proportions are based on (weighted) means <strong>in</strong> the population. St<strong>and</strong>ard errors are shown <strong>in</strong> parentheses.<br />
Source: Youth Cohort Study, 1996 – 2002<br />
Appendix 4: A-level physics <strong>and</strong> potential undergraduate physicists<br />
<strong>Ethnic</strong> group A-level physics plus maths A-level potential potential potential YCS sample<br />
males undergraduate undergraduate undergraduate<br />
physicist (UCAS12) physicist (UCAS18) physicist (UCAS24)<br />
white 7.10 (0.24) 5.56 (0.21) 4.05 (0.18) 3.8 (0.17) 2.77 (0.15) 12 104<br />
black Caribbean 1.70 (3.67) 0.94 (3.27) 0.94 (2.80) 0.94 (2.72) 0.94 (2.33) 50<br />
black African 5.64 (3.82) 5.64 (3.41) 3.08 (2.92) 3.08 (2.84) 0.94(2.42) 46<br />
Indian 12.24 (1.32) 9.94 (1.18) 6.18 (1.01) 5.82 (0.98) 3.86 (0.84) 386<br />
Pakistani 3.79 (1.76) 2.05 (1.57) 1.05 (1.34) 0.77 (1.30) 0.48 (1.11) 218<br />
Bangladeshi 6.35 (2.53) 5.44 (2.26) 3.51 (1.94) 3.51 (1.88) 1.44 (1.60) 105<br />
Ch<strong>in</strong>ese 19.17 (2.73) 16.21 (2.44) 13.67 (2,09) 12.78 (2.03) 9.80 (1.73) 90<br />
mixed 6.06 (2.76) 4.15 (2.47) 2.96 (2.11) 2.96 (2.05) 1.59 (1.75) 88<br />
<strong>Ethnic</strong> group A-level physics plus maths A-level potential potential potential YCS sample<br />
females undergraduate undergraduate undergraduate<br />
physicist (UCAS12) physicist (UCAS18) physicist (UCAS24)<br />
white 2.29 (0.12) 1.54 (0.10) 1.24 (0.09) 1.18 (0.08) 0.90 (0.07) 16 600<br />
black Caribbean 0.00 (1.57) 0.00 (1.29) 0.00 (1.16) 0.00 (1.13) 0.00 (0.98) 90<br />
black African 1.76 (1.80) 0.74 (1.48) 0.00 (1.32) 0.00 (1.29) 0.00 (1.12) 69<br />
Indian 3.22 (0.68) 2.35 (0.56) 1.72 (0.50) 1.72 (0.49) 1.25 (0.42) 488<br />
Pakistani 0.78 (0.82) 0.30 (0.68) 0.30 (0.61) 0.30 (0.59) 0.30 (0.51) 328<br />
Bangladeshi 0.49 (1.34) 0.49 (1.10) 0.00 (0.99) 0.00 (0.96) 0.00 (0.84) 124<br />
Ch<strong>in</strong>ese 5.72 (1.54) 2.78 (1.23) 2.78 (1.10) 2.78 (1.08) 0.00 (0.94) 99<br />
mixed 1.79 (1.18) 1.47 (0.97) 1.03 (0.87) 1.03 (0.85) 0.33 (0.73) 161<br />
Note: These proportions are based on (weighted) means <strong>in</strong> the population. St<strong>and</strong>ard errors are shown <strong>in</strong> parentheses.<br />
Source: Youth Cohort Study, 1996 – 2002<br />
38 R EPRESENTATION OF E THNIC G ROUPS IN C HEMISTRY AND P HYSICS M AY 2006
Appendices<br />
Appendix 5: <strong>Ethnic</strong> composition <strong>of</strong> the Engl<strong>and</strong>- <strong>and</strong> Wales-domiciled undergraduate population<br />
<strong>Ethnic</strong> group % or undergraduates % <strong>in</strong> population 18–25 ratio undergraduates:population<br />
male female all male female all male female all<br />
white 37.20 43.90 81.00 43.60 44.40 87.90 0.85 0.99 0.92<br />
black Caribbean 0.50 1.00 1.50 0.40 0.50 0.90 1.39 1.79 1.63<br />
black African 1.40 1.40 2.70 0.60 0.70 1.30 2.30 1.93 2.10<br />
Indian 2.60 2.50 5.10 1.30 1.00 2.30 2.05 2.54 2.27<br />
Pakistani 1.60 1.30 2.90 1.00 1.00 2.00 1.68 1.24 1.45<br />
Bangladeshi 0.50 0.40 0.80 0.60 0.40 0.90 0.81 0.99 0.88<br />
Ch<strong>in</strong>ese 0.60 0.60 1.20 0.50 0.50 1.00 1.21 1.25 1.23<br />
other/mixed 2.20 2.40 4.70 1.70 1.90 3.70 1.28 1.26 1.27<br />
population (1000s) 390.30 448.50 839.00 2870.00 2914.00 5783.00 – – –<br />
Notes:<br />
1. The percentages relate to Engl<strong>and</strong>- <strong>and</strong> Wales-domiciled students <strong>in</strong> the first year <strong>of</strong> study for a first or enhanced first degree.<br />
2. Population numbers are estimates based on demographic <strong>in</strong>formation from the LFS, March–May 2004.<br />
Source: HESA student data set, 2002–2003<br />
Appendix 6: <strong>Ethnic</strong> <strong>and</strong> gender percentages <strong>in</strong> the population <strong>of</strong> chemistry <strong>and</strong> physics students achiev<strong>in</strong>g a first or<br />
upper second degree classification<br />
<strong>Ethnic</strong> group % chemistry % physics<br />
male female all male female all<br />
white 51.20 36.30 87.50 73.70 18.70 92.50<br />
black Caribbean 0.10 0.20 0.30 0.10 0.10 0.10<br />
black African 0.30 0.40 0.70 0.30 0.00 0.30<br />
Indian 2.10 2.00 4.20 2.00 0.40 2.30<br />
Pakistani 1.30 1.20 2.50 0.70 0.10 0.80<br />
Bangladeshi 0.40 0.30 0.70 0.30 0.10 0.40<br />
Ch<strong>in</strong>ese 0.50 0.80 1.40 0.70 0.30 1.00<br />
other/mixed 1.20 1.40 2.70 1.60 0.90 2.50<br />
Note: Engl<strong>and</strong>- <strong>and</strong> Wales-domiciled students only.<br />
Source: HESA first-def<strong>in</strong>ition data set, 2001–2002<br />
R EPRESENTATION OF E THNIC G ROUPS IN C HEMISTRY AND P HYSICS M AY 2006<br />
39
Appendices<br />
Appendix 7: Undergraduate subject groups ranked by ethnic group participation<br />
Percentage ethnic group composition <strong>of</strong> student body by subject group<br />
Subject group white rank black rank black rank Indian rank<br />
Caribbean<br />
African<br />
medic<strong>in</strong>e <strong>and</strong> dentistry 62.00 18 0.3 17 1.8 9 14.4 1<br />
subjects allied to medic<strong>in</strong>e 75.50 15 1.4 7 3.6 3 5.8 6<br />
biological sciences 84.20 8 1.1 10 1.3 12 3.2 10<br />
veter<strong>in</strong>ary science 95.00 1 0.1 19 0.1 19 0.4 19<br />
agriculture <strong>and</strong> related subjects 93.10 2 0.2 18 0.4 17 0.8 18<br />
physical sciences 87.60 5 0.4 14 0.8 15 2.5 13<br />
mathematical sciences 79.40 11 0.3 16 1.0 13 7.6 4<br />
computer science 57.50 19 1.5 6 4.5 1 13.1 2<br />
eng<strong>in</strong>eer<strong>in</strong>g <strong>and</strong> technology 75.90 14 0.9 12 3.1 4 5.0 7<br />
architecture, build<strong>in</strong>g <strong>and</strong> plann<strong>in</strong>g 80.40 10 1.4 8 2.3 6 2.7 12<br />
social, economic <strong>and</strong> political studies 79.20 12 1.7 4 2.1 8 4.3 8<br />
law 69.10 17 2.1 2 4.1 2 7.0 5<br />
bus<strong>in</strong>ess <strong>and</strong> adm<strong>in</strong>istrative studies 73.60 16 1.5 5 3.1 5 7.6 3<br />
librarianship <strong>and</strong> <strong>in</strong>formation science 81.50 9 2.3 1 2.2 7 3.1 11<br />
languages 89.20 4 0.6 13 0.5 16 1.3 16<br />
humanities 90.30 3 0.4 14 0.4 17 1.0 17<br />
creative arts <strong>and</strong> design 86.30 6 1.2 9 0.9 14 1.9 14<br />
education 84.50 7 1.9 3 1.5 10 1.5 15<br />
comb<strong>in</strong>ed 79.20 13 1.0 11 1.5 10 4.2 9<br />
Note: The percentages relate to Engl<strong>and</strong>- <strong>and</strong> Wales-domiciled students <strong>in</strong> the first year <strong>of</strong> study for a first or enhanced first degree.<br />
Source: HESA first-def<strong>in</strong>ition data set 2002/2003<br />
Appendix 8: Proportion <strong>of</strong> students awarded first or upper-second degrees, by ethnicity <strong>and</strong> subject group<br />
Percentage ethnic group receiv<strong>in</strong>g a first- or upper-second-class degree<br />
Subject area medic<strong>in</strong>e subjects biological agriculture physical mathematical computer eng<strong>in</strong>eer<strong>in</strong>g<br />
<strong>and</strong> allied to sciences <strong>and</strong> related sciences sciences sciences <strong>and</strong><br />
dentistry medic<strong>in</strong>e subjects technology<br />
white 18.4 58.7 60.0 49.4 52.4 55.4 50.7 51.9<br />
black Caribbean 16.1 32.5 37.3 26.3 33.9 30.3 30.9 29.7<br />
black African 16.7 32.0 31.3 10.3 27.1 26.8 24.8 25.7<br />
Indian 17.0 54.4 46.4 35.3 39.6 47.4 39.6 39.6<br />
Pakistani 10.7 48.1 40.1 38.1 35.0 41.0 33.2 31.1<br />
Bangladeshi 18.5 47.2 40.2 33.3 37.9 39.5 34.3 33.7<br />
Ch<strong>in</strong>ese 24.2 59.6 49.7 50.0 42.3 51.2 38.5 42.1<br />
other/mixed 17.4 52.6 51.3 38.5 48.4 47.5 39.6 38.2<br />
Ranked by medic<strong>in</strong>e subjects biological agriculture physical mathematical computer eng<strong>in</strong>eer<strong>in</strong>g<br />
ethnicity <strong>and</strong> allied to sciences <strong>and</strong> related sciences sciences sciences <strong>and</strong><br />
dentistry medic<strong>in</strong>e subjects technology<br />
white 3 2 1 2 1 1 1 1<br />
black Caribbean 7 7 7 7 7 7 7 7<br />
black African 6 8 8 8 8 8 8 8<br />
Indian 5 3 4 5 4 4 3 3<br />
Pakistani 8 5 6 4 6 5 6 6<br />
Bangladeshi 2 6 5 6 5 6 5 5<br />
Ch<strong>in</strong>ese 1 1 3 1 3 2 4 2<br />
other/mixed 4 4 2 3 2 3 2 4<br />
*Percentages are calculated <strong>in</strong>clud<strong>in</strong>g unclassified degrees. The percentages <strong>of</strong> each ethnic group receiv<strong>in</strong>g a first- or upper-second-class degree <strong>in</strong> medic<strong>in</strong>e <strong>and</strong> dentistry appear low because<br />
<strong>of</strong> the large percentage <strong>of</strong> unclassified degrees awarded <strong>in</strong> these subjects.<br />
Note: The percentages relate to Engl<strong>and</strong>- <strong>and</strong> Wales-domiciled students <strong>in</strong> the first year <strong>of</strong> study for a first or enhanced first degree.<br />
Source: HESA first-def<strong>in</strong>ition data sets 1996/1997–2001/2002<br />
40 R EPRESENTATION OF E THNIC G ROUPS IN C HEMISTRY AND P HYSICS M AY 2006
Appendices<br />
Appendix 7: cont<strong>in</strong>ued<br />
Pakistani rank Bangladeshi rank Ch<strong>in</strong>ese rank<br />
4.9 3 1.2 3 2.1 3<br />
3.0 5 0.7 8 0.7 11<br />
1.7 10 0.5 10 0.7 12<br />
0.0 19 0.0 19 0.1 19<br />
0.6 16 0.1 18 0.4 16<br />
1.5 12 0.4 13 0.9 10<br />
1.9 9 1.0 4 2.4 1<br />
8.2 1 1.9 1 2.2 2<br />
2.9 6 0.8 7 2.0 4<br />
1.3 13 0.4 14 1.7 5<br />
2.1 8 0.9 5 0.9 9<br />
5.2 2 1.4 2 0.9 8<br />
3.1 4 0.8 6 1.6 6<br />
1.1 14 0.6 9 0.5 14<br />
0.7 15 0.3 15 0.4 15<br />
0.5 18 0.2 16 0.2 17<br />
0.5 17 0.2 16 1.0 7<br />
1.5 11 0.5 11 0.2 18<br />
2.8 7 0.5 12 0.6 13<br />
Appendix 8: cont<strong>in</strong>ued<br />
architecture social, law bus<strong>in</strong>ess librarianship languages humanities creative education comb<strong>in</strong>ed<br />
build<strong>in</strong>g <strong>and</strong> economic <strong>and</strong> <strong>and</strong> adm<strong>in</strong> <strong>and</strong> <strong>in</strong>formation arts <strong>and</strong><br />
plann<strong>in</strong>g political studies studies science design<br />
48.3 57.3 59.7 50.1 59.2 69.0 68.2 57.7 50.7 51.8<br />
27.8 32.8 27.6 26.1 40.6 43.9 32.8 36.0 28.7 29.0<br />
17.3 28.9 24.3 20.9 29.4 44.9 38.0 32.7 16.1 23.2<br />
38.9 44.9 40.5 36.9 43.4 57.3 53.6 39.5 37.8 38.3<br />
30.0 37.3 33.2 29.1 37.1 54.8 49.4 34.8 39.0 33.6<br />
22.4 37.8 36.0 28.3 16.9 58.9 50.5 37.1 35.2 32.4<br />
37.0 48.8 50.4 38.0 58.8 59.9 67.0 45.1 45.9 45.0<br />
38.0 52.5 46.2 40.0 52.4 65.9 64.7 50.1 44.3 49.0<br />
architecture social, law bus<strong>in</strong>ess librarianship languages humanities creative education comb<strong>in</strong>ed<br />
build<strong>in</strong>g <strong>and</strong> economic <strong>and</strong> <strong>and</strong> adm<strong>in</strong> <strong>and</strong> <strong>in</strong>formation arts <strong>and</strong><br />
plann<strong>in</strong>g political studies studies science design<br />
1 1 1 1 1 1 1 1 1 1<br />
6 7 7 7 5 8 8 6 7 7<br />
8 8 8 8 7 7 7 8 8 8<br />
2 4 4 4 4 5 4 4 5 4<br />
5 6 6 5 6 6 6 7 4 5<br />
7 5 5 6 8 4 5 5 6 6<br />
4 3 2 3 2 3 2 3 2 3<br />
3 2 3 2 3 2 3 2 3 2<br />
R EPRESENTATION OF E THNIC G ROUPS IN C HEMISTRY AND P HYSICS M AY 2006<br />
41
Appendices<br />
Appendix 9: <strong>Ethnic</strong>ity <strong>of</strong> academic staff <strong>in</strong> chemistry <strong>and</strong> physics<br />
Fig. 30: Academic staff<br />
<strong>in</strong> chemistry, by ethnic<br />
group.<br />
Note: The analysis excludes staff<br />
whose ethnic group is not known.<br />
Source: HESA data sets<br />
2001/2002<br />
researcher<br />
lecturer<br />
white black Asian Ch<strong>in</strong>ese other/mixed<br />
senior lecturer<br />
pr<strong>of</strong>essor<br />
70% 80% 90% 100%<br />
Fig. 31: Academic staff<br />
<strong>in</strong> physics, by ethnic<br />
group.<br />
Note: The analysis excludes staff<br />
whose ethnic group is not known.<br />
Source: HESA data sets<br />
2001/2002<br />
researcher<br />
lecturer<br />
white black Asian Ch<strong>in</strong>ese other/mixed<br />
senior lecturer<br />
pr<strong>of</strong>essor<br />
70% 80% 90% 100%<br />
HESA provides an annual census on academic staff by<br />
grade. This <strong>of</strong>fers full coverage <strong>of</strong> academic staff <strong>and</strong> is<br />
therefore comprehensive. The ma<strong>in</strong> drawback is the relatively<br />
high <strong>in</strong>cidence <strong>of</strong> “miss<strong>in</strong>g” data about ethnicity.<br />
Approximately 12% <strong>of</strong> ethnicity responses are returned as<br />
“not known”, where <strong>in</strong>dividuals prefer not to provide<br />
details. Information is not available about whether or not<br />
this <strong>in</strong>troduces a systematic bias <strong>in</strong>to the data. That is,<br />
members <strong>of</strong> some ethnic m<strong>in</strong>ority groups might be more<br />
reluctant to answer this question than others.<br />
An additional consideration when us<strong>in</strong>g these data is<br />
that not all members <strong>of</strong> staff are born <strong>in</strong> the UK. The numbers<br />
cannot therefore be compared mean<strong>in</strong>gfully, for example,<br />
to student numbers, where the analysis is based on<br />
those who are Engl<strong>and</strong> <strong>and</strong> Wales domiciled. F<strong>in</strong>ally, staff<br />
data will also conta<strong>in</strong> “cohort effects”, which are important<br />
when consider<strong>in</strong>g ethnicity. That is, for example, the<br />
data on ethnicity <strong>of</strong> pr<strong>of</strong>essors cannot be compared with<br />
that <strong>of</strong> junior academics <strong>and</strong> researchers on the grounds<br />
that these cohorts have been drawn from very different ethnic<br />
distributions <strong>in</strong> the population, based on their age<br />
group.<br />
42 R EPRESENTATION OF E THNIC G ROUPS IN C HEMISTRY AND P HYSICS M AY 2006
Appendices<br />
Appendix 10: Statistical <strong>in</strong>ference<br />
This report considers differences <strong>in</strong> participation between<br />
ethnic groups either with respect to study<strong>in</strong>g chemistry or<br />
physics at various academic levels (A-level, undergraduate,<br />
etc) or with respect to achiev<strong>in</strong>g required levels <strong>of</strong> competences<br />
(e.g. m<strong>in</strong>imum GCSE <strong>and</strong> A-level requirements<br />
or based on degree classification). Throughout the study,<br />
reference is made to “statistically significant” patterns <strong>of</strong><br />
study or differences, such as when compared to the majority<br />
white population.<br />
Statistical significance, <strong>in</strong> the simplest terms, purports<br />
that the pattern or difference observed, <strong>in</strong> this <strong>in</strong>stance with<br />
respect to study by ethnic groups, is unlikely to have occurred<br />
by chance. More precisely, statistical significance means<br />
that we are able to <strong>in</strong>fer with a certa<strong>in</strong> degree <strong>of</strong> error that<br />
the patterns or differences did not occur r<strong>and</strong>omly based on<br />
a test aga<strong>in</strong>st a null hypothesis that the pattern or difference<br />
is r<strong>and</strong>om. Throughout this report, tests <strong>of</strong> statistical significance<br />
are based (follow<strong>in</strong>g st<strong>and</strong>ard practice) on the use <strong>of</strong><br />
a 5% error level when reject<strong>in</strong>g the null hypothesis.<br />
In this study, two types <strong>of</strong> test are used to test for statistical<br />
significance. First, direct comparisons between ethnic<br />
groups (e.g. percentage <strong>of</strong> white versus ethnic-m<strong>in</strong>ority<br />
students study<strong>in</strong>g chemistry at A-level) are done based on<br />
a series <strong>of</strong> two-sample T-tests. In short this test measures<br />
the difference <strong>in</strong> values or proportions (for the ma<strong>in</strong> part) <strong>in</strong><br />
relation to the st<strong>and</strong>ard error associated with the two-sample<br />
estimates. A sufficient large difference between the two<br />
values (relative to comb<strong>in</strong>ed st<strong>and</strong>ard error) results <strong>in</strong> a T<br />
value that we would not expect to observe based on a normal<br />
distribution. In this case differences are statistically<br />
significant.<br />
Second, for analysis <strong>of</strong> patterns <strong>of</strong> study based on a cont<strong>in</strong>gency<br />
table <strong>of</strong> sample numbers (e.g. numbers <strong>of</strong> undergraduate<br />
chemistry students by ethnic group <strong>and</strong> gender),<br />
statistically significant effects are observed based on a Chisquared<br />
test, which compares the frequencies to what we<br />
would have anticipated based on the “neutral” assumption<br />
that students were r<strong>and</strong>omly allocated to subjects by<br />
ethnic group <strong>and</strong> gender. A sufficiently large discrepancy<br />
between the observed <strong>and</strong> neutral pattern generates a Chisquared<br />
statistic that is significant based on a normal distribution<br />
<strong>of</strong> outcomes.<br />
F<strong>in</strong>ally, throughout the study we have been careful to<br />
comb<strong>in</strong>e ethnic groups <strong>and</strong>/or restrict dimensions <strong>of</strong> analysis<br />
when sample numbers would be too small to permit statistical<br />
<strong>in</strong>ference.<br />
R EPRESENTATION OF E THNIC G ROUPS IN C HEMISTRY AND P HYSICS M AY 2006<br />
43
A report prepared for the Royal Society <strong>of</strong> <strong>Chemistry</strong> <strong>and</strong> the Institute <strong>of</strong> <strong>Physics</strong><br />
<strong>Representation</strong> <strong>of</strong> <strong>Ethnic</strong> <strong>Groups</strong><br />
<strong>in</strong> <strong>Chemistry</strong> <strong>and</strong> <strong>Physics</strong><br />
For further <strong>in</strong>formation about the report, please contact:<br />
Sean McWh<strong>in</strong>nie<br />
Royal Society <strong>of</strong> <strong>Chemistry</strong><br />
Burl<strong>in</strong>gton House<br />
Piccadilly<br />
London W1J 0BA<br />
UK<br />
Tel: +44 (0) 20 7440 3309<br />
Fax: +44 (0) 20 7734 1227<br />
E-mail: mcwh<strong>in</strong>nies@rsc.org<br />
Web: www.rsc.org<br />
Registered charity no. 207890<br />
Taj<strong>in</strong>der Panesor<br />
Institute <strong>of</strong> <strong>Physics</strong><br />
76 Portl<strong>and</strong> Place<br />
London W1B 1NT<br />
UK<br />
Tel: +44 (0) 20 7470 4800<br />
Fax: +44 (0) 20 7470 4848<br />
E-mail: taj<strong>in</strong>der.panesor@iop.org<br />
Web: www.iop.org<br />
Registered charity no. 293851<br />
© The Royal Society <strong>of</strong> <strong>Chemistry</strong> <strong>and</strong> the Institute <strong>of</strong> <strong>Physics</strong><br />
The material <strong>in</strong>cluded <strong>in</strong> this report may be reproduced <strong>and</strong> dissem<strong>in</strong>ated without <strong>in</strong>fr<strong>in</strong>g<strong>in</strong>g<br />
copyright provid<strong>in</strong>g the follow<strong>in</strong>g acknowledgement is given:<br />
<strong>Representation</strong> <strong>of</strong> <strong>Ethnic</strong> <strong>Groups</strong> <strong>in</strong> <strong>Chemistry</strong> <strong>and</strong> <strong>Physics</strong>, 2006 – Reproduced by<br />
permission <strong>of</strong> the Royal Society <strong>of</strong> <strong>Chemistry</strong> <strong>and</strong> the Institute <strong>of</strong> <strong>Physics</strong>.