September - Vol 70, No 1 - International Technology and ...
September - Vol 70, No 1 - International Technology and ...
September - Vol 70, No 1 - International Technology and ...

You also want an ePaper? Increase the reach of your titles
YUMPU automatically turns print PDFs into web optimized ePapers that Google loves.
events (Mitts, 2008). Before tabulating these gender<br />
choices, the description of each TSA competitive event<br />
listed in the official guides for both middle <strong>and</strong> high school<br />
was examined; then based upon the Weber-Custer study, a<br />
predictive judgment was made by the researcher as to the<br />
type of event category in which it belonged. Out of a total<br />
of 64 events, it was determined that 26 were designing<br />
<strong>and</strong>/or communication-type events, <strong>and</strong> 26 were utilizingtype<br />
events.<br />
Definite conclusions were drawn from the resulting<br />
data. Male <strong>and</strong> female participants in these TSA state<br />
conferences differed in their preferences for types of<br />
competitive event activities. Males clearly had a strong<br />
bias for utilizing-type activities such as Dragster Design<br />
(7 out of 9 events), while females had a preference for<br />
nonutilizing design <strong>and</strong>/or communication-type events (10<br />
out of 10). These results were consistent with the findings<br />
of the Weber-Custer research. A correct prediction of<br />
gender preferences for TSA competitive events was made<br />
before data analysis in 20 out of 21 cases (95%) for which<br />
statistically significant results were found. Some TSA<br />
events were omitted from the study because there were not<br />
enough entrants to analyze validly. In addition, the data<br />
clearly suggested that both males <strong>and</strong> females prefer team<br />
activities by 77%. Of high importance to researchers, but<br />
of little utility to teachers, the validity <strong>and</strong> reliability of the<br />
Weber-Custer criteria as a predictor of gender preferences<br />
was confirmed.<br />
New Findings Discovered in the Mitts Study<br />
The original Mitts study used raw numbers of students<br />
selecting certain TSA events <strong>and</strong> the “Chi-Square” statistic<br />
as the basis for determining the predictive capability<br />
of the Weber-Custer assumptions. Thus, if the Weber-<br />
Custer approach predicted that the event “Manufacturing<br />
Prototype” would be favored by males, <strong>and</strong> then 10 boys<br />
<strong>and</strong> 8 girls actually entered the contest, it would appear<br />
that boys preferred this event. However, if the same data is<br />
reexamined based on percentages of the total numbers of<br />
girls <strong>and</strong> boys attending the conference selecting this event,<br />
we see that the 10 boys were from a group of 244 total<br />
(4.10%) while of the total girls present (115) the 8 selecting<br />
this event represents 6.96%. In actuality, the percentage of<br />
girls selecting Manufacturing Prototype at this particular<br />
conference was slightly higher than the percentage of boys.<br />
Hence, the present study reexamines all of the Mitts (2008)<br />
data to provide information easily understood in laymen’s<br />
terms concerning which activities <strong>and</strong> TSA competitive<br />
events might be more attractive to girls, which are more<br />
or less neutral, <strong>and</strong> which boys prefer. It is acknowledged<br />
that this casual approach of examining percentages does<br />
not rise to the level of statistical significance available via<br />
the Chi-Square technique, but it allows us to make good<br />
guesses about cases with small numbers, whereas it could<br />
take several years of collecting data to attain statistical<br />
significance for them.<br />
In the reexamination of data from the Mitts study,<br />
columns were added to the original data tables showing<br />
the percentages of males <strong>and</strong> females selecting each<br />
competitive event, while the previous columns concerning<br />
the Weber-Custer predictions were deleted. The resulting<br />
tables, including the columns of percentages (Tables 3 <strong>and</strong><br />
4 for middle school <strong>and</strong> high school), were then examined<br />
<strong>and</strong> used to identify specific events favored by males or<br />
females <strong>and</strong> an informal indication of the magnitude of<br />
their preferences. The following scale of capital <strong>and</strong> lower<br />
case letters indicating magnitude was used to indicate<br />
preferences:<br />
M = Strong Male preference (more than 5% points)<br />
m = slight Male preference (1-4.99 % points)<br />
none = no preference (less than 1% point difference)<br />
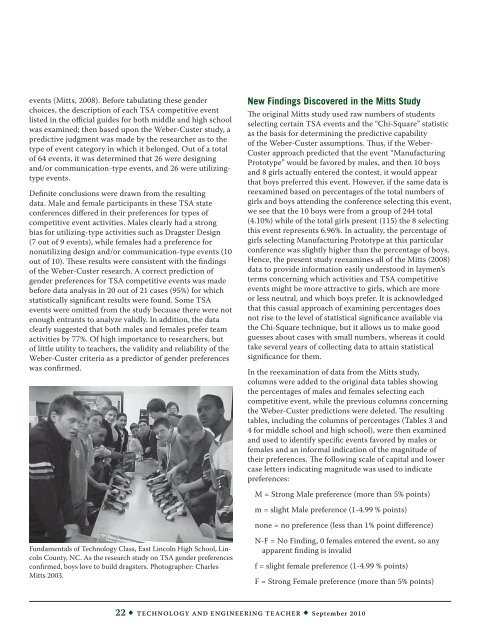
Fundamentals of <strong>Technology</strong> Class, East Lincoln High School, Lincoln<br />
County, NC. As the research study on TSA gender preferences<br />
confirmed, boys love to build dragsters. Photographer: Charles<br />
Mitts 2003.<br />
N-F = <strong>No</strong> Finding, 0 females entered the event, so any<br />
apparent finding is invalid<br />
f = slight female preference (1-4.99 % points)<br />
F = Strong Female preference (more than 5% points)<br />
22 • <strong>Technology</strong> <strong>and</strong> Engineering Teacher • <strong>September</strong> 2010