Punnett Squares and Binomials
Punnett Squares and Binomials
Punnett Squares and Binomials

Create successful ePaper yourself
Turn your PDF publications into a flip-book with our unique Google optimized e-Paper software.
*A, Learn mathematics through problem solving, inquiry, <strong>and</strong> discovery; B,<br />
Communicate their mathematical thinking coherently <strong>and</strong> clearly to peers,<br />
teachers, <strong>and</strong> others, both orally <strong>and</strong> in writing; C, Recognize recurring themes<br />
across mathematical domains (e.g., patterns in number, algebra, <strong>and</strong> geometry);<br />
D, Recognize that mathematical facts, procedures, <strong>and</strong> claims must be justified.<br />
Anticipation of Questions: I expect students to have difficulty remembering the pattern of<br />
a squared binomial. Some of the questions I anticipate the students asking are as follows:<br />
1. Why can’t you just distribute the power like we did when we did monomials?<br />
2. Why are there two middle terms when you square a binomial?<br />
3. How is a <strong>Punnett</strong> square similar to a squared binomial?<br />
*More questions will arise as the lesson proceeds.<br />
Vocabulary:<br />
1. Binomial<br />
2. Polynomial<br />
3. <strong>Punnett</strong> square<br />
4. Homozygous<br />
5. Heterozygous<br />
Motivational questions:<br />
1. Why do we resemble one parent more than they other?<br />
2. Why is there sometimes a mix of looking like both parents?<br />
Phase of Inquiry:<br />
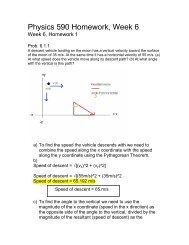
<strong>Punnett</strong> squares are diagrams that are used to show the possible ways that genes<br />
can combine at fertilization. In a <strong>Punnett</strong> square, dominant genes are shown in capital<br />
letters. Recessive genes are shown with lowercase letters. Letters representing parents’<br />
genes are placed on the two of the outer sides of the <strong>Punnett</strong> square. Letters inside the<br />
squares of the <strong>Punnett</strong> square show the possible gene combinations of their offspring.<br />
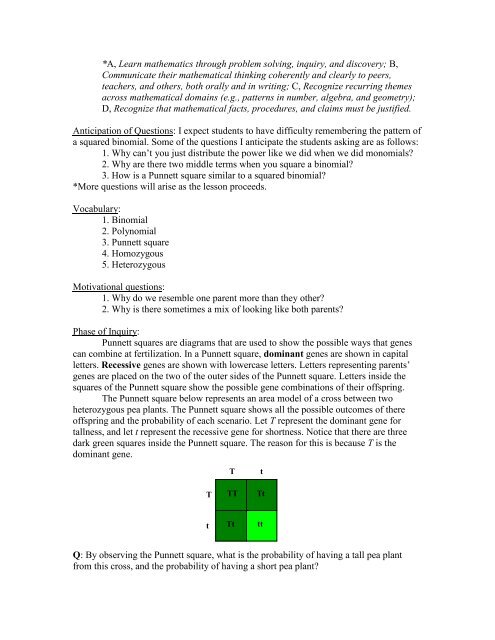
The <strong>Punnett</strong> square below represents an area model of a cross between two<br />
heterozygous pea plants. The <strong>Punnett</strong> square shows all the possible outcomes of there<br />
offspring <strong>and</strong> the probability of each scenario. Let T represent the dominant gene for<br />
tallness, <strong>and</strong> let t represent the recessive gene for shortness. Notice that there are three<br />
dark green squares inside the <strong>Punnett</strong> square. The reason for this is because T is the<br />
dominant gene.<br />
T<br />
T<br />
TT<br />
t<br />
Tt<br />
t<br />
Tt<br />
tt<br />
Q: By observing the <strong>Punnett</strong> square, what is the probability of having a tall pea plant<br />
from this cross, <strong>and</strong> the probability of having a short pea plant?