Perception of tonalness of tyre/road noise and objective ... - Acoustics
Perception of tonalness of tyre/road noise and objective ... - Acoustics
Perception of tonalness of tyre/road noise and objective ... - Acoustics

Create successful ePaper yourself
Turn your PDF publications into a flip-book with our unique Google optimized e-Paper software.
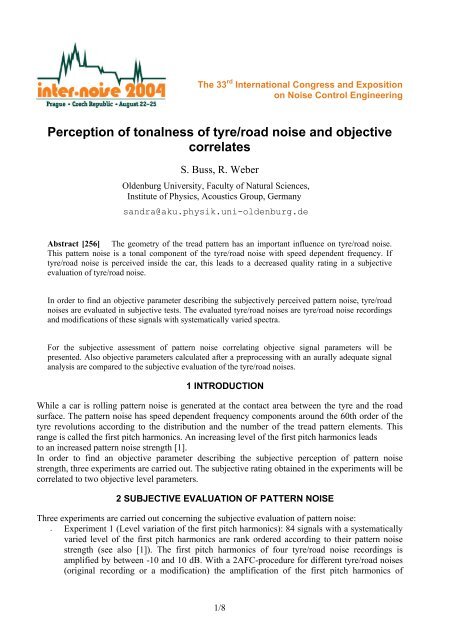
The 33 rd International Congress <strong>and</strong> Exposition<br />
on Noise Control Engineering<br />
<strong>Perception</strong> <strong>of</strong> <strong>tonalness</strong> <strong>of</strong> <strong>tyre</strong>/<strong>road</strong> <strong>noise</strong> <strong>and</strong> <strong>objective</strong><br />
correlates<br />
S. Buss, R. Weber<br />
Oldenburg University, Faculty <strong>of</strong> Natural Sciences,<br />
Institute <strong>of</strong> Physics, <strong>Acoustics</strong> Group, Germany<br />
s<strong>and</strong>ra@aku.physik.uni-oldenburg.de<br />
Abstract [256] The geometry <strong>of</strong> the tread pattern has an important influence on <strong>tyre</strong>/<strong>road</strong> <strong>noise</strong>.<br />
This pattern <strong>noise</strong> is a tonal component <strong>of</strong> the <strong>tyre</strong>/<strong>road</strong> <strong>noise</strong> with speed dependent frequency. If<br />
<strong>tyre</strong>/<strong>road</strong> <strong>noise</strong> is perceived inside the car, this leads to a decreased quality rating in a subjective<br />
evaluation <strong>of</strong> <strong>tyre</strong>/<strong>road</strong> <strong>noise</strong>.<br />
In order to find an <strong>objective</strong> parameter describing the subjectively perceived pattern <strong>noise</strong>, <strong>tyre</strong>/<strong>road</strong><br />
<strong>noise</strong>s are evaluated in subjective tests. The evaluated <strong>tyre</strong>/<strong>road</strong> <strong>noise</strong>s are <strong>tyre</strong>/<strong>road</strong> <strong>noise</strong> recordings<br />
<strong>and</strong> modifications <strong>of</strong> these signals with systematically varied spectra.<br />
For the subjective assessment <strong>of</strong> pattern <strong>noise</strong> correlating <strong>objective</strong> signal parameters will be<br />
presented. Also <strong>objective</strong> parameters calculated after a preprocessing with an aurally adequate signal<br />
analysis are compared to the subjective evaluation <strong>of</strong> the <strong>tyre</strong>/<strong>road</strong> <strong>noise</strong>s.<br />
1 INTRODUCTION<br />
While a car is rolling pattern <strong>noise</strong> is generated at the contact area between the <strong>tyre</strong> <strong>and</strong> the <strong>road</strong><br />
surface. The pattern <strong>noise</strong> has speed dependent frequency components around the 60th order <strong>of</strong> the<br />
<strong>tyre</strong> revolutions according to the distribution <strong>and</strong> the number <strong>of</strong> the tread pattern elements. This<br />
range is called the first pitch harmonics. An increasing level <strong>of</strong> the first pitch harmonics leads<br />
to an increased pattern <strong>noise</strong> strength [1].<br />
In order to find an <strong>objective</strong> parameter describing the subjective perception <strong>of</strong> pattern <strong>noise</strong><br />
strength, three experiments are carried out. The subjective rating obtained in the experiments will be<br />
correlated to two <strong>objective</strong> level parameters.<br />
2 SUBJECTIVE EVALUATION OF PATTERN NOISE<br />
Three experiments are carried out concerning the subjective evaluation <strong>of</strong> pattern <strong>noise</strong>:<br />
- Experiment 1 (Level variation <strong>of</strong> the first pitch harmonics): 84 signals with a systematically<br />
varied level <strong>of</strong> the first pitch harmonics are rank ordered according to their pattern <strong>noise</strong><br />
strength (see also [1]). The first pitch harmonics <strong>of</strong> four <strong>tyre</strong>/<strong>road</strong> <strong>noise</strong> recordings is<br />
amplified by between -10 <strong>and</strong> 10 dB. With a 2AFC-procedure for different <strong>tyre</strong>/<strong>road</strong> <strong>noise</strong>s<br />
(original recording or a modification) the amplification <strong>of</strong> the first pitch harmonics <strong>of</strong><br />
1/8
another recording is measured leading to the same pattern <strong>noise</strong> strength. The experiment is<br />
carried out by four subjects: one female <strong>and</strong> three male.<br />
- Experiment 2 (Variation <strong>of</strong> the spectral shape <strong>of</strong> the first pitch harmonics): In a paired<br />
comparison test Thurstonian scale values according to the pattern <strong>noise</strong> strength <strong>of</strong> 6 signals<br />
with a systematically varied spectral shape <strong>of</strong> the first pitch harmonics are obtained. The<br />
signals are based on one <strong>tyre</strong>/<strong>road</strong> <strong>noise</strong> recording. Besides the original spectral shape the<br />
different spectral shapes are obtained by an amplification <strong>of</strong> one or two third around the<br />
mean <strong>of</strong> the first pitch harmonics by 2 or 4 dB <strong>and</strong> a following attenuation <strong>of</strong> the level <strong>of</strong> the<br />
first pitch harmonics to the original level. Since the differences between these signals is<br />
small a paired comparison test is carried in order to have a great accuracy <strong>of</strong> the subjective<br />
rating. By means <strong>of</strong> Thurstone's law <strong>of</strong> comparative judgment the subjective ratings are<br />
interval scaled. Eight subjects take part in the experiment: two female <strong>and</strong> six male.<br />
- Experiment 3 (Variation <strong>of</strong> the level <strong>and</strong> the spectral shape <strong>of</strong> the first pitch harmonics): In<br />
the first two experiments the influence <strong>of</strong> the level <strong>of</strong> the first pitch harmonics <strong>and</strong> the<br />
spectral shape on the subjective evaluation <strong>of</strong> the pattern <strong>noise</strong> strength are assessed isolated<br />
from each other. In a third experiment the combined influence <strong>of</strong> both parameters on the<br />
pattern <strong>noise</strong> strength is evaluated. A second paired comparison test leads to Thurstonian<br />
scale values according to the pattern <strong>noise</strong> strength <strong>of</strong> 12 signals with a systematically varied<br />
level <strong>and</strong> spectral shape <strong>of</strong> the first pitch harmonics. All signals are based on one <strong>tyre</strong>/<strong>road</strong><br />
<strong>noise</strong> recording. Here the level <strong>of</strong> the first pitch harmonics is the original level <strong>and</strong> an<br />
amplification <strong>of</strong> the first pitch harmonics by 0.5 <strong>and</strong> 1 dB. The different spectral shapes are<br />
the original shape <strong>and</strong> an amplification <strong>of</strong> one third around the mean <strong>of</strong> the first pitch<br />
harmonics by 2 or 4 dB <strong>and</strong> an amplification <strong>of</strong> two third around the mean <strong>of</strong> the first pitch<br />
harmonics by 4 dB. The first pitch harmonics than is attenuated in order to leave the level <strong>of</strong><br />
the first pitch harmonics constant for all different spectral shapes <strong>of</strong> the first pitch<br />
harmonics. The experiment is carried out by ten subjects: three female <strong>and</strong> seven male.<br />
The assessed signals are <strong>tyre</strong>/<strong>road</strong> <strong>noise</strong> recordings with an artificial head st<strong>and</strong>ing on the front<br />
passenger seat while the car is coasting <strong>and</strong> modifications <strong>of</strong> these signals. The signals are about 6s<br />
long <strong>and</strong> represent a coasting from 110 to 100 km/h.<br />
The experiment is carried out in a soundpro<strong>of</strong> chamber. The signals are played back via<br />
headphones. All signals have the same dB(A)-level <strong>of</strong> 69 dB(A).<br />
The subjects are untrained in evaluating <strong>tyre</strong>/<strong>road</strong> <strong>noise</strong>.<br />
3 OBJECTIVE SIGNAL PARAMETERS<br />
3.1 Level <strong>of</strong> the first pitch harmonics<br />
From the averaged order spectrum <strong>of</strong> the left <strong>and</strong> right channel the level in the range <strong>of</strong> the first<br />
pitch harmonics (approx. 50th to 85th order) is calculated.<br />
The subjective ranking <strong>of</strong> the signals in the first experiment is significantly correlated with the level<br />
<strong>of</strong> the first pitch harmonics. This can be seen in figure 1 for one subject (see also [1]). The<br />
correlation coefficients <strong>of</strong> all subjects are between 0.85 <strong>and</strong> 0.92 <strong>and</strong> are therefore significant.<br />
2/8
80<br />
ranking according to the pattern <strong>noise</strong> strength<br />
70<br />
60<br />
50<br />
40<br />
30<br />
20<br />
10<br />
0<br />
44 46 48 50 52 54 56 58 60 62<br />
level <strong>of</strong> the first pitch harmonics [dB(A)]<br />
Figure 1: Ranking <strong>of</strong> the signals according to the pattern <strong>noise</strong> strength in the first experiment (variation <strong>of</strong><br />
the level <strong>of</strong> the first pitch harmonics) in dependence <strong>of</strong> the level <strong>of</strong> the first pitch harmonics. This plot shows<br />
a typical ranking by one subject. There is a significant correlation (r=0.92*)(* = significant with p≤0.05).<br />
3<br />
2.5<br />
Thurstonian scale value accoring<br />
to the pattern <strong>noise</strong> strength<br />
2<br />
1.5<br />
1<br />
0.5<br />
0<br />
53 53.5 54 54.5 55<br />
level <strong>of</strong> the first pitch harmonics [dB(A)]<br />
Figure 2: Interval scaled Thurstonian scale values <strong>of</strong> the signals representing the pattern <strong>noise</strong> strength in<br />
the second experiment (variation <strong>of</strong> the spectral shape <strong>of</strong> the first pitch harmonics) in dependence <strong>of</strong> the level<br />
<strong>of</strong> the first pitch harmonics. There is no significant correlation (r=-0.08).<br />
3/8
The paired comparison data <strong>of</strong> the experiment concerned with the variation <strong>of</strong> the spectral shape <strong>of</strong><br />
the first pitch harmonics is interval scaled by Thurstone's law <strong>of</strong> comparative judgment. These<br />
interval scaled data is plotted against the level <strong>of</strong> the first pitch harmonics . As shown in figure 2 the<br />
Thurstonian scale values <strong>of</strong> the signals in the second experiment do not correlate with the level <strong>of</strong><br />
the first pitch harmonics. In this experiment the spectral shape <strong>of</strong> the first pitch harmonics <strong>of</strong> the<br />
signals is varied while the level <strong>of</strong> the first pitch harmonics is held nearly constant. It can be seen<br />
that the level <strong>of</strong> the first pitch harmonics can not be the only parameter being related to the pattern<br />
<strong>noise</strong> strength. Also the spectral shape has an influence on the amount <strong>of</strong> perceived pattern <strong>noise</strong>.<br />
3<br />
Thurstonian scale value according<br />
to the pattern <strong>noise</strong> strength<br />
2.5<br />
2<br />
1.5<br />
1<br />
0.5<br />
0<br />
53.8 54 54.2 54.4 54.6 54.8<br />
level <strong>of</strong> the first pitch harmonics [dB(A)]<br />
Figure 3: Interval scaled Thurstonian scale values <strong>of</strong> the signals representing the pattern <strong>noise</strong> strength in<br />
the third experiment (variation <strong>of</strong> the level <strong>and</strong> the spectral shape <strong>of</strong> the first pitch harmonics) in dependence<br />
<strong>of</strong> the level <strong>of</strong> the first pitch harmonics. There is no significant correlation (r=-0.23).<br />
In the third experiment there is also no correlation between the Thurstonian scale values <strong>and</strong> the<br />
level <strong>of</strong> the first pitch harmonics (figure 3). Since the level <strong>and</strong> the spectral shape <strong>of</strong> the first pitch<br />
harmonics seem to have an influence on the perceived pattern <strong>noise</strong> strength, it can not be described<br />
by the level <strong>of</strong> the first pitch harmonics alone.<br />
3.2 Level <strong>of</strong> the first pitch harmonics <strong>of</strong> the frequency tracks<br />
The frequency tracks represent the tonal components <strong>of</strong> the <strong>tyre</strong>/<strong>road</strong> <strong>noise</strong>. By means <strong>of</strong> the<br />
s<strong>of</strong>tware VIPER (Cortex Instruments) the frequency tracks <strong>of</strong> the signals are calculated. The<br />
procedure is based on the aurally adequate signal analysis by calculating contours in [2] <strong>and</strong> [bib4].<br />
The time course <strong>of</strong> tonal component characterised by local maxima in level at each point in time are<br />
extracted. Also the masking properties <strong>of</strong> the human ear are regarded. The noisy parts <strong>of</strong> the signal<br />
are not further analysed. From the frequency tracks an order spectrum is calculated. Analog to the<br />
calculation <strong>of</strong> the level <strong>of</strong> the first pitch harmonics the level <strong>of</strong> the first pitch harmonics <strong>of</strong> the<br />
frequency tracks is calculated as the level <strong>of</strong> the first pitch harmonics from the order spectrum <strong>of</strong><br />
the contours. By this value the level <strong>of</strong> the tonal components <strong>of</strong> the first pitch harmonics is<br />
represented.<br />
4/8
80<br />
ranking according to the pattern <strong>noise</strong> strength<br />
70<br />
60<br />
50<br />
40<br />
30<br />
20<br />
10<br />
0<br />
15 16 17 18 19 20 21 22 23 24 25<br />
level <strong>of</strong> the first pitch harmonics <strong>of</strong> the frequency tracks [dB]<br />
Figure 4: Ranking <strong>of</strong> the signals according to the pattern <strong>noise</strong> strength in the first experiment (variation <strong>of</strong><br />
the level <strong>of</strong> the first pitch harmonics) in dependence <strong>of</strong> the level <strong>of</strong> the first pitch harmonics <strong>of</strong> the frequency<br />
tracks. This plot shows a typical ranking by one subject. There is a significant correlation (r=0.96*)(*<br />
means significant with p≤ 0.05).<br />
The ranking <strong>of</strong> the signals in the first experiment is significantly correlated with the level <strong>of</strong> the first<br />
pitch harmonics <strong>of</strong> the frequency tracks (figure 4). For all subjects the correlation coefficient is<br />
significant <strong>and</strong> lies in the range 0.94 to 0.97. This correlation is stronger than in the case <strong>of</strong> the level<br />
<strong>of</strong> the first pitch harmonics. This finding indicates the tonal components <strong>of</strong> the first pitch harmonics<br />
being the important factor <strong>of</strong> the pattern <strong>noise</strong>. Since the pattern <strong>noise</strong> is a tonal component <strong>of</strong> the<br />
<strong>tyre</strong>/<strong>road</strong> <strong>noise</strong>, this result could be expected.<br />
Though there is a general increase <strong>of</strong> the Thurstonian scale values <strong>of</strong> the second experiment with<br />
the level <strong>of</strong> the first pitch harmonics <strong>of</strong> the frequency tracks, the correlation is not significant (figure<br />
5). But in contrast to the level <strong>of</strong> the first pitch harmonics there is a clear tendency <strong>of</strong> an increase <strong>of</strong><br />
pattern <strong>noise</strong> strength with increasing level <strong>of</strong> the first pitch harmonics <strong>of</strong> the frequency tracks. So<br />
also in this experiment an increasing pattern <strong>noise</strong> strength with increasing level <strong>of</strong> the first pitch<br />
harmonics <strong>of</strong> the frequency tracks can be assumed, but it does not get significant.<br />
5/8
3<br />
2.5<br />
Thurstonian scale value according<br />
to the pattern <strong>noise</strong> strength<br />
2<br />
1.5<br />
1<br />
0.5<br />
0<br />
18.5 19 19.5 20 20.5<br />
level <strong>of</strong> the first pitch harmonics <strong>of</strong> the frequency tracks [dB]<br />
Figure 5: Interval scaled Thurstonian scale values <strong>of</strong> the signals representing the pattern <strong>noise</strong> strength in<br />
the second experiment (variation <strong>of</strong> the spectral shape <strong>of</strong> the first pitch harmonics) in dependence <strong>of</strong> the level<br />
<strong>of</strong> the first pitch harmonics <strong>of</strong> the frequency tracks. There is no significant correlation (r=0.46)<br />
3<br />
Thurstonian scale value according<br />
to the pattern <strong>noise</strong> stregth<br />
2.5<br />
2<br />
1.5<br />
1<br />
0.5<br />
0<br />
18 18.2 18.4 18.6 18.8 19 19.2 19.4 19.6 19.8 20<br />
level <strong>of</strong> the first pitch harmonics <strong>of</strong> the frequency tracks [dB]<br />
Figure 6: Thurstonian scale values <strong>of</strong> the signals representing pattern <strong>noise</strong> strength in the third experiment<br />
(variation <strong>of</strong> level <strong>and</strong> spectral shape <strong>of</strong> the first pitch harmonics) in dependence <strong>of</strong> the level <strong>of</strong> the first pitch<br />
harmonics <strong>of</strong> the frequency tracks. There is a significant correlation (r=0.91*)(* = significant with p≤0.05).<br />
6/8
If the level <strong>and</strong> the spectral shape <strong>of</strong> the first pitch harmonics are varied (third experiment), the<br />
Thurstonian scale values are significantly correlated with the level <strong>of</strong> the first pitch harmonics <strong>of</strong><br />
the frequency tracks (figure 6). So it can be concluded that the level <strong>of</strong> the first pitch harmonics <strong>of</strong><br />
the frequency tracks describes the influence <strong>of</strong> the level as well as the spectral shape <strong>of</strong> the first<br />
pitch harmonics on the perceived pattern <strong>noise</strong> strength.<br />
3.3 Comparison between the order spectra <strong>of</strong> the original signal <strong>and</strong> the frequency<br />
tracks<br />
55<br />
50<br />
original<br />
frequency tracks<br />
45<br />
40<br />
level [dB(A)]/level [dB]<br />
35<br />
30<br />
25<br />
20<br />
15<br />
10<br />
5<br />
0<br />
0 10 20 30 40 50 60 70 80 90 100<br />
order<br />
Figure 7: Order spectra <strong>of</strong> one signal: order spectrum <strong>of</strong> the original signal (solid line) <strong>and</strong> order spectrum<br />
<strong>of</strong> the frequency tracks (dashed line).<br />
In order to demonstrate the influence <strong>of</strong> the calculation <strong>of</strong> frequency tracks on the signal, as an<br />
example the order spectra <strong>of</strong> one signal used in the experiments are plotted in figure 7. The solid<br />
line represents the order spectrum <strong>of</strong> the original signal. After calculating the frequency tracks the<br />
order spectrum looks like the dashed line.<br />
The level <strong>of</strong> the order spectrum <strong>of</strong> the frequency tracks is lower than the level <strong>of</strong> the order spectrum<br />
<strong>of</strong> the original signal. This level difference is a result <strong>of</strong> the reduction <strong>of</strong> the signal to the tonal<br />
components by deleting the noisy parts <strong>of</strong> the signal.<br />
Another difference between both order spectra is the shape <strong>of</strong> the first pitch harmonics. The order<br />
spectrum <strong>of</strong> the original signal shows a b<strong>road</strong> level increase in the range <strong>of</strong> the first pitch harmonics<br />
ranging from about the 45th to about the 90th order. In the order spectrum <strong>of</strong> the frequency tracks<br />
the first pitch harmonics has a clear level increase in the range from about the 50th to about the 70th<br />
order. So by calculating frequency tracks the first pitch harmonics is better distinguished from other<br />
parts <strong>of</strong> the signal.<br />
7/8
4 CONCLUSION<br />
Three experiments are carried out in order to evaluate the influence <strong>of</strong> the level <strong>of</strong> the first pitch<br />
harmonics <strong>and</strong> the spectral shape <strong>of</strong> the first pitch harmonics <strong>and</strong> the combined influence on the<br />
perceived pattern <strong>noise</strong> strength. The level as well as the spectral shape have an influence on the<br />
perceived pattern <strong>noise</strong> strength.<br />
Two <strong>objective</strong> parameters are related to the subjective evaluation <strong>of</strong> the pattern <strong>noise</strong> strength: a)<br />
the level <strong>of</strong> the first pitch harmonics <strong>and</strong> b) the level <strong>of</strong> the first pitch harmonics <strong>of</strong> the frequency<br />
tracks representing the level <strong>of</strong> the tonal components <strong>of</strong> the first pitch harmonics.<br />
If only the level <strong>of</strong> the first pitch harmonics is varied (Experiment 1), the pattern <strong>noise</strong> strength<br />
increases with increasing level <strong>of</strong> the first pitch harmonics. If as well or only the spectral shape is<br />
varied (Experiment 2 <strong>and</strong> 3), the level <strong>of</strong> the first pitch harmonics is not related to the pattern <strong>noise</strong><br />
strength.<br />
Whereas an increasing level <strong>of</strong> the first pitch harmonics <strong>of</strong> the frequency tracks <strong>and</strong> therefore an<br />
increasing level <strong>of</strong> the tonal components <strong>of</strong> the first pitch harmonics lead to an increasing pattern<br />
<strong>noise</strong> strength. This relation can be found for all three experiments. It gets significant in the case <strong>of</strong><br />
a level variation <strong>of</strong> the first pitch harmonics (Experiment 1) <strong>and</strong> also an additional variation <strong>of</strong> the<br />
spectral shape <strong>of</strong> the first pitch harmonics (Experiment 3).<br />
So with increasing level <strong>of</strong> the first pitch harmonics <strong>of</strong> the frequency tracks the pattern <strong>noise</strong><br />
strength increases. The level <strong>of</strong> the first pitch harmonics correlates with the rated pattern <strong>noise</strong><br />
strength only, if the spectral shape is held constant. So the level <strong>of</strong> the first pitch harmonics <strong>of</strong> the<br />
frequency tracks shows a stronger relation with the pattern <strong>noise</strong> strength than the level <strong>of</strong> the first<br />
pitch harmonics.<br />
Both parameters differ only in the calculation <strong>of</strong> frequency tracks before calculating the level <strong>of</strong> the<br />
first pitch harmonics. It is shown that an aurally adequate signal analysis extracting tonal<br />
components increases the correlation between <strong>objective</strong> signal parameters <strong>and</strong> the subjective<br />
evaluation <strong>of</strong> pattern <strong>noise</strong>. This parameter takes into account both the level <strong>and</strong> the spectral shape<br />
<strong>of</strong> the first pitch harmonics <strong>of</strong> the first pitch harmonics.<br />
REFERENCES<br />
[1] S. Buss, R. Weber <strong>and</strong> W. Liederer, ``Objektivierung des subjektiv wahrgenommenen Pr<strong>of</strong>ilgeräuschs in Reifen-<br />
Fahrbahn-Geräuschen'', in Fortschritte der Akustik - DAGA 2002, Bochum, 2002.<br />
[2] M. Mummert, Sprachkodierung durch Konturierung eines gehörangepaßten Spektrogramms und ihre<br />
Anwendung zur Datenreduktion, VDI-Fortschrittberichte, Reihe 10, VDI-Verlag, Düsseldorf 1998.<br />
[3] S. Buss <strong>and</strong> R. Weber, ``Subjective <strong>and</strong> <strong>objective</strong> characterization <strong>of</strong> tonal components in <strong>tyre</strong>/<strong>road</strong> <strong>noise</strong>'', in<br />
Fortschritte der Akustik - DAGA 2004, Strasbourg, 2004.<br />
[4] P. Daniel, ``Auditory Spectrograms <strong>and</strong> Auditory Contours in Musical <strong>Acoustics</strong>'', in Fortschritte der Akustik –<br />
DAGA 2004, Strasbourg, 2004.<br />
8/8