Saudi Arabia & KAUST - National US-Arab Chamber of Commerce
Saudi Arabia & KAUST - National US-Arab Chamber of Commerce
Saudi Arabia & KAUST - National US-Arab Chamber of Commerce

Create successful ePaper yourself
Turn your PDF publications into a flip-book with our unique Google optimized e-Paper software.
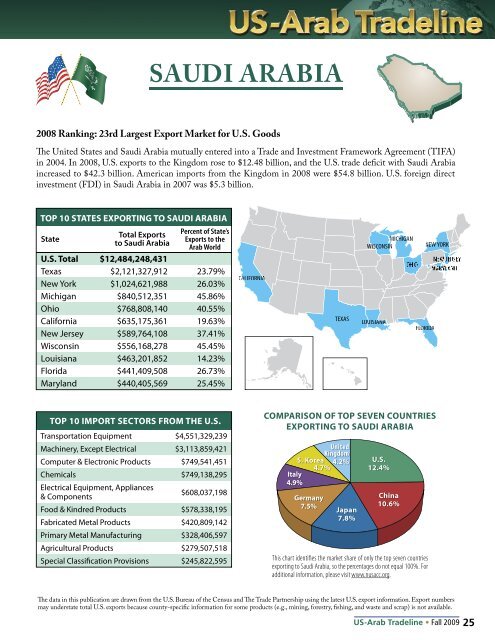
SAUDI ARABIA<br />
2008 Ranking: 23rd Largest Export Market for U.S. Goods<br />
increased to $42.3 billion. American imports from the Kingdom in 2008 were $54.8 billion. U.S. foreign direct<br />
investment (FDI) in <strong>Saudi</strong> <strong><strong>Arab</strong>ia</strong> in 2007 was $5.3 billion.<br />
TOP 10 STATES EXPORTING TO SAUDI ARABIA<br />
State<br />
Total Exports<br />
to <strong>Saudi</strong> <strong><strong>Arab</strong>ia</strong><br />
Percent <strong>of</strong> State’s<br />
Exports to the<br />
<strong>Arab</strong> World<br />
U.S. Total $12,484,248,431<br />
Texas $2,121,327,912 23.79%<br />
New York $1,024,621,988 26.03%<br />
Michigan $840,512,351 45.86%<br />
Ohio $768,808,140 40.55%<br />
California $635,175,361 19.63%<br />
New Jersey $589,764,108 37.41%<br />
Wisconsin $556,168,278 45.45%<br />
Louisiana $463,201,852 14.23%<br />
Florida $441,409,508 26.73%<br />
Maryland $440,405,569 25.45%<br />
CALIFORNIA<br />
TEXAS<br />
MICHIGAN<br />
WISCONSIN<br />
N<br />
LOU<br />
UISIANA<br />
A<br />
NEW YORK<br />
FLORIDA<br />
TOP 10 IMPORT SECTORS FROM THE U.S.<br />
Transportation Equipment $4,551,329,239<br />
Machinery, Except Electrical $3,113,859,421<br />
Computer & Electronic Products $749,541,451<br />
Chemicals<br />
$749,138,295<br />
Electrical Equipment, Appliances<br />
& Components<br />
$608,037,198<br />
Food & Kindred Products $578,338,195<br />
Fabricated Metal Products $420,809,142<br />
Primary Metal Manufacturing $328,406,597<br />
Agricultural Products $279,507,518<br />
COMPARISON OF TOP SEVEN COUNTRIES<br />
EXPORTING TO SAUDI ARABIA<br />
United<br />
Kingdom<br />
S. Korea<br />
4.2%<br />
4.7%<br />
Italy<br />
4.9%<br />
Germany<br />
7.5%<br />
Japan<br />
7.8%<br />
U.S.<br />
12.4%<br />
China<br />
10.6%<br />
This chart identifies the market share <strong>of</strong> only the top seven countries<br />
exporting to <strong>Saudi</strong> <strong><strong>Arab</strong>ia</strong>, so the percentages do not equal 100%. For<br />
additional information, please visit www.nusacc.org.<br />
<strong>US</strong>-<strong>Arab</strong> Tradeline • Fall 2009 25