

SCANIA INTERIM REPORT – JANUARY – MARCH 2005
SCANIA INTERIM REPORT – JANUARY – MARCH 2005
SCANIA INTERIM REPORT – JANUARY – MARCH 2005

You also want an ePaper? Increase the reach of your titles
YUMPU automatically turns print PDFs into web optimized ePapers that Google loves.
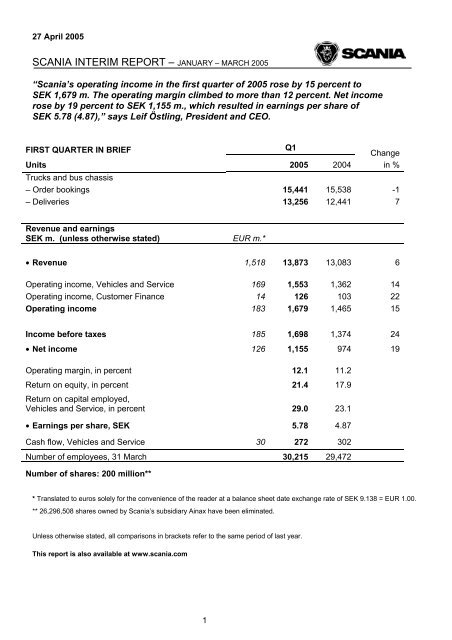
27 April <strong>2005</strong><br />
<strong>SCANIA</strong> <strong>INTERIM</strong> <strong>REPORT</strong> – <strong>JANUARY</strong> – <strong>MARCH</strong> <strong>2005</strong><br />
“Scania’s operating income in the first quarter of <strong>2005</strong> rose by 15 percent to<br />
SEK 1,679 m. The operating margin climbed to more than 12 percent. Net income<br />
rose by 19 percent to SEK 1,155 m., which resulted in earnings per share of<br />
SEK 5.78 (4.87),” says Leif Östling, President and CEO.<br />
FIRST QUARTER IN BRIEF<br />
Q1<br />
Change<br />
Units <strong>2005</strong> 2004 in %<br />
Trucks and bus chassis<br />
– Order bookings 15,441 15,538 -1<br />
– Deliveries 13,256 12,441 7<br />
Revenue and earnings<br />
SEK m. (unless otherwise stated) EUR m.*<br />
• Revenue 1,518 13,873 13,083 6<br />
Operating income, Vehicles and Service 169 1,553 1,362 14<br />
Operating income, Customer Finance 14 126 103 22<br />
Operating income 183 1,679 1,465 15<br />
Income before taxes 185 1,698 1,374 24<br />
• Net income 126 1,155 974 19<br />
Operating margin, in percent 12.1 11.2<br />
Return on equity, in percent 21.4 17.9<br />
Return on capital employed,<br />
Vehicles and Service, in percent 29.0 23.1<br />
• Earnings per share, SEK 5.78 4.87<br />
Cash flow, Vehicles and Service 30 272 302<br />
Number of employees, 31 March 30,215 29,472<br />
Number of shares: 200 million**<br />
* Translated to euros solely for the convenience of the reader at a balance sheet date exchange rate of SEK 9.138 = EUR 1.00.<br />
** 26,296,508 shares owned by Scania’s subsidiary Ainax have been eliminated.<br />
Unless otherwise stated, all comparisons in brackets refer to the same period of last year.<br />
This report is also available at www.scania.com<br />
1
<strong>SCANIA</strong> <strong>INTERIM</strong> <strong>REPORT</strong> – <strong>JANUARY</strong> – <strong>MARCH</strong> <strong>2005</strong><br />
<strong>SCANIA</strong>, FIRST QUARTER OF <strong>2005</strong> – COMMENTS BY THE PRESIDENT AND CEO<br />
Scania’s operating income in the first quarter of <strong>2005</strong> rose by 15 percent to SEK 1,679 m. The<br />
operating margin climbed to more than 12 percent. Net income rose by 19 percent to SEK 1,155 m.,<br />
which resulted in earnings per share of SEK 5.78 (4.87). Order bookings for vehicles fell 1 percent,<br />
while deliveries climbed by 7 percent. Service revenue and Customer Finance showed continued<br />
good development.<br />
Demand for heavy trucks was somewhat subdued in western Europe during the first quarter.<br />
Deliveries rose by 2 percent, while order bookings declined by 5 percent compared to the strong first<br />
quarter of 2004. There were major variations between countries. The Nordic countries continued their<br />
strong development, while the markets in Germany, the Netherlands and Great Britain weakened.<br />
In central and eastern Europe, deliveries climbed while order bookings fell after last year’s strong<br />
growth, which was mainly stimulated by the accession of new member states to the European Union.<br />
Above all, weaker demand in Poland was behind the downturn. In Latin America, order bookings<br />
continued to strengthen. Asia showed lower order bookings, mainly caused by market developments<br />
in Turkey and South Korea.<br />
Demand for buses and coaches rose during the first quarter. Growth was especially good in Brazil,<br />
Sweden and Great Britain. Among other things, Scania received two major orders, one for ethanol<br />
buses in Sweden and the other for tourist coaches in Great Britain.<br />
The strengthening of the euro against the US dollar and fluctuating oil prices are restraining economic<br />
activity in Europe. In a number of markets, for example in Germany, France and Italy, economic<br />
growth is at low levels. This affects private consumption and industrial demand and leads to<br />
uncertainty about the demand for heavy trucks. The current year is thus to be regarded as an off year<br />
for western European growth. In Latin America, we expect to see a continued strong market during<br />
the first half of <strong>2005</strong>. In Asia, we are currently seeing positive signals from South Korea. In Turkey as<br />
well, demand has begun to rebound after a weak patch early in the year.<br />
In light of the large volume of trucks that were registered in the late 1990s, over the next few years<br />
there will be a continued replacement need. Within a few years, the market for heavy trucks in<br />
western Europe is expected to surpass the previous peak achieved in 2000, when 244,000 heavy<br />
trucks were registered. Also contributing to market growth are continued exports of used vehicles to<br />
central and eastern Europe.<br />
The changeover to Scania’s new truck range continued to proceed without disruptions during the first<br />
quarter of <strong>2005</strong>. The changeover in Europe was completed, and production there now consists<br />
100 percent of the new truck range launched in 2004. Increases in material prices affected earnings<br />
in the first quarter. A stable production rate will provide good potential for continued productivity<br />
improvements at Scania’s production units.<br />
During the report period, Scania completed its offer for Ainax, which was accepted by 96.3 percent of<br />
that company’s shareholders. This means that as from 22 February, Ainax is a subsidiary of Scania.<br />
Ainax shares will be de-listed on 29 April. Scania intends to carry out a liquidation of Ainax during<br />
2006. After the offer for Ainax, the number of Scania shareholders has risen from just above 46,000 to<br />
more than 110,000.<br />
2
<strong>SCANIA</strong> <strong>INTERIM</strong> <strong>REPORT</strong> – <strong>JANUARY</strong> – <strong>MARCH</strong> <strong>2005</strong><br />
MARKET OVERVIEW<br />
Trucks<br />
Scania’s order bookings in the first quarter of<br />
<strong>2005</strong> amounted to 13,341 (14,122) trucks, a<br />
decrease of 6 percent.<br />
In western Europe, order bookings fell by<br />
5 percent to 8,196 units. Germany, the<br />
Netherlands and Great Britain were weaker, while<br />
the Nordic countries showed strong growth. The<br />
total market for heavy trucks in western Europe<br />
increased by 6 percent to about 61,700. Scania<br />
registered about 8,600 trucks, equivalent to a<br />
market share of about 13.9 (13.2) percent.<br />
In central and eastern Europe, order bookings in<br />
the first quarter of <strong>2005</strong> decreased by 24 percent<br />
to 1,002 trucks. In Latin America, order bookings<br />
climbed by 18 percent. Order bookings in Asia<br />
decreased by 20 percent. In Scania’s other<br />
markets, order bookings rose by 5 percent.<br />
Buses and coaches<br />
Scania’s order bookings for buses and coaches in<br />
the first quarter of <strong>2005</strong> rose by 48 percent and<br />
amounted to 2,100 units.<br />
In Europe, order bookings rose by 34 percent.<br />
In Latin America, order bookings rose by<br />
174 percent. In Asia, order bookings fell by<br />
35 percent. In other markets, Scania’s order<br />
bookings rose by 55 percent.<br />
Industrial and marine engines<br />
Scania’s deliveries in the first quarter of <strong>2005</strong><br />
decreased by 8 percent and totalled 1,023 units.<br />
Order bookings fell by 16 percent to 1,147 units.<br />
Number of Scania truck registrations,<br />
Scania’s 10 largest markets,<br />
January-March<br />
Change<br />
<strong>2005</strong> 2004 in %<br />
Great Britain 1,418 1,417 0<br />
Brazil 1,365 1,254 9<br />
France 1,210 1,166 4<br />
Germany 1,068 954 12<br />
Italy 775 778 0<br />
Spain 712 878 -19<br />
The Netherlands 703 608 16<br />
Sweden 458 417 10<br />
Belgium 451 415 9<br />
Turkey 364 489 -26<br />
Scania’s market share, heavy trucks,<br />
Scania’s 10 largest markets,<br />
January-March, percent<br />
<strong>2005</strong> 2004<br />
Great Britain 17.3 17.7<br />
Brazil 24.2 22.6<br />
France 9.9 10.4<br />
Germany 8.2 7.2<br />
Italy 14.4 14.5<br />
Spain 9.7 11.8<br />
The Netherlands 19.7 16.9<br />
Sweden 45.6 43.7<br />
Belgium 16.6 16.4<br />
Turkey 6.5 8.1<br />
3
<strong>SCANIA</strong> <strong>INTERIM</strong> <strong>REPORT</strong> – <strong>JANUARY</strong> – <strong>MARCH</strong> <strong>2005</strong><br />
REVENUE<br />
During the first quarter of <strong>2005</strong>, Scania<br />
delivered 12,003 (11,399) trucks, an<br />
increase of 5 percent. Bus chassis deliveries<br />
amounted to 1,253 (1,042) units, an increase<br />
of 20 percent.<br />
Revenue rose by 6 percent to SEK<br />
13,873 m. (13,083), mainly due to increased<br />
volume. Negative currency rate effects<br />
influenced revenue by about SEK 80 m.<br />
New vehicle sales revenue rose by<br />
10 percent. Service revenue amounted to<br />
SEK 2,956 m. (2,869), an increase of<br />
3 percent. In local currencies, service<br />
revenue rose by about 4 percent.<br />
EARNINGS<br />
Scania’s operating income rose by<br />
15 percent to SEK 1,679 m. (1,465) during<br />
the first quarter of <strong>2005</strong>.<br />
Operating income in Vehicles and Service<br />
rose by 14 percent to SEK 1,553 m.<br />
(1,362) during the first quarter of <strong>2005</strong>. The<br />
new truck range and higher vehicle volume<br />
were the main contributors to the earnings<br />
improvement. Increased service revenue<br />
also contributed favourably. The above<br />
positive effects were partly offset by<br />
increased material costs. Scania’s research<br />
and development expenditures totalled SEK<br />
584 m. (536). After adjusting for SEK 85 m.<br />
(145) in capitalised expenditures and<br />
depreciation of SEK 68 m. (1) on previously<br />
capitalised expenditures, reported expenses<br />
rose to SEK 567 m. (392).<br />
Compared to the first quarter of 2004, current<br />
spot rate effects totalled about SEK -80 m.<br />
Currency hedging income was SEK -25 m.<br />
During the first quarter of 2004, the impact of<br />
currency hedging on earnings was SEK<br />
-75 m. Compared to the first quarter of 2004,<br />
the total currency effect was thus SEK<br />
-30 m.<br />
Operating income in Customer Finance<br />
rose by 22 percent and amounted to SEK<br />
126 m. (103). Income was favourably<br />
influenced by increased volume in markets<br />
with higher interest margins. This was<br />
somewhat offset by increased operating<br />
expenses.<br />
Revenue by market (SEK m.),<br />
Scania’s 10 largest markets,<br />
January-March<br />
Change<br />
in %<br />
<strong>2005</strong> 2004<br />
Great Britain 1,813 2,002 -9<br />
Brazil 981 799 23<br />
Germany 957 882 9<br />
Sweden 891 831 7<br />
France 827 877 -6<br />
Italy 807 776 4<br />
Finland 738 583 27<br />
The Netherlands 719 651 10<br />
Spain 698 814 -14<br />
Norway 587 457 28<br />
18,000<br />
16,000<br />
14,000<br />
12,000<br />
10,000<br />
8,000<br />
6,000<br />
4,000<br />
2,000<br />
0<br />
18,000<br />
16,000<br />
14,000<br />
12,000<br />
10,000<br />
8,000<br />
6,000<br />
4,000<br />
2,000<br />
0<br />
2,250<br />
2,000<br />
1,750<br />
1,500<br />
1,250<br />
1,000<br />
750<br />
500<br />
250<br />
0<br />
VEHICLES DELIVERED (units)<br />
Q1 Q2 Q3 Q4<br />
REVENUE (SEK m.)<br />
Q1 Q2 Q3 Q4<br />
OPERATING INCOME (SEK m.)<br />
Q1 Q2 Q3 Q4<br />
2003<br />
2004<br />
<strong>2005</strong><br />
2003<br />
2004*<br />
<strong>2005</strong>*<br />
2003<br />
2004*<br />
<strong>2005</strong>*<br />
* 2004 and <strong>2005</strong> in accordance with IFRS<br />
4
<strong>SCANIA</strong> <strong>INTERIM</strong> <strong>REPORT</strong> – <strong>JANUARY</strong> – <strong>MARCH</strong> <strong>2005</strong><br />
Earnings were also improved by lower expenses for both potential and actual credit losses. At the end<br />
of March, the size of the portfolio totalled about SEK 27,600 m., which represented an increase of<br />
about SEK 1,000 m. since year-end 2004. In local currencies, the portfolio rose by 2 percent.<br />
Scania’s net financial items amounted to SEK 19 m. (-91). Net interest items improved by SEK<br />
19 m. to SEK -49 m. due to lower net debt as well as lower interest expenses in Latin America. Other<br />
financial revenue and expenses totalled SEK 68 m. (-23). This included SEK 20 m. (0) in positive<br />
valuation effects related to financial instruments where hedge accounting was not applied. It also<br />
included the acquisition effect of Ainax, totalling SEK 50 m., in the first quarter of <strong>2005</strong>. Other financial<br />
expenses amounted to SEK 2 m. (23), last year including charges for expenses in connection with<br />
restructuring of funding programme.<br />
The Scania Group’s tax expenses were equivalent to 32.0 (29.1) percent of income after financial<br />
items.<br />
Net income rose by 19 percent and amounted to SEK 1,155 m. (974).<br />
CASH FLOW<br />
Scania’s cash flow, for Vehicles and Service, amounted to SEK 272 m. (302).<br />
Working capital rose by SEK 210 m. (283) during the first quarter of <strong>2005</strong>, mainly due to seasonal<br />
inventory build-up, which was partly offset by decreased receivables.<br />
Net investments totalled SEK 639 m. (615), including SEK 85 m. (145) in capitalisation of<br />
development expenditures. The acquisition of Ainax had a positive effect of SEK 86 m.<br />
MISCELLANEOUS<br />
Number of employees<br />
The number of employees at the end of the first quarter of <strong>2005</strong> was 30,215, compared to 29,993 at<br />
the end of 2004. The increase was mainly attributable to production units in South America as well as<br />
partly to the expansion of the service network.<br />
Accounting principles<br />
In accordance with the IAS regulation adopted by the European Union (EU) in 2002, it is prescribed<br />
that listed companies throughout the EU shall apply International Financial Reporting Standards<br />
(IFRS) when preparing their consolidated financial statements as of <strong>2005</strong>. Scania’s Interim Report for<br />
the first quarter of <strong>2005</strong> is thus designed in accordance with the IFRS standards adopted by the EU,<br />
as well as the interpretations by the International Financial Reporting Interpretations Committee<br />
(IFRIC) adopted by the EU. This report has been designed in accordance with IAS 34, Interim<br />
Financial Reporting. The differences between IFRS and Swedish GAAP are presented on pages<br />
17 and 18.<br />
Scania’s Annual Report for the financial year 2004 presents a description of what accounting<br />
principles were affected by the transition to IFRS. For a description of the accounting principles that<br />
Scania is applying in the Interim Report for the first quarter of <strong>2005</strong>, see the section entitled “Changes<br />
in accounting principles in <strong>2005</strong>” on page 55 of the Annual Report for 2004.<br />
Acquisitions of businesses<br />
Ainax AB, whose business is to manage Scania shares, was acquired during the first quarter of <strong>2005</strong><br />
through a public offer to all shareholders in the company. The offer was accepted by 96.3 percent of<br />
these shareholders, and the acquisition was financed with newly issued Scania shares. Scania<br />
intends to carry out a liquidation of Ainax AB during 2006.<br />
The acquisition of Ainax was completed on 22 February <strong>2005</strong>. A total of 26,296,508 Scania shares<br />
were issued in conjunction with the acquisition. The market value of these shares on the acquisition<br />
date was SEK 7,823 m. The assets acquired were mainly Scania shares, which had a market value<br />
5
<strong>SCANIA</strong> <strong>INTERIM</strong> <strong>REPORT</strong> – <strong>JANUARY</strong> – <strong>MARCH</strong> <strong>2005</strong><br />
equivalent to the newly issued Scania shares, plus liquid assets amounting to SEK 89 m. Since the<br />
acquisition date, Ainax AB has had negative income amounting to SEK 2.2 m.<br />
Södertälje, 27 April <strong>2005</strong><br />
LEIF ÖSTLING<br />
President and CEO<br />
This Interim Report has not been subjected to special review by the company’s auditors.<br />
Financial information from Scania<br />
Scania’s Interim Report for January-June <strong>2005</strong> will be published on 27 July <strong>2005</strong>.<br />
This report contains forward-looking statements that reflect management’s current views with respect to certain future<br />
events and potential financial performance. Such forward-looking statements involve risks and uncertainties that could<br />
significantly alter potential results. These statements are based on certain assumptions, including assumptions related to<br />
general economic and financial conditions in the company’s markets and the level of demand for the company’s products.<br />
This report does not imply that the company has undertaken to revise these forward-looking statements, beyond what is<br />
required under the company’s registration contract with Stockholmsbörsen, if and when circumstances arise that will lead to<br />
changes compared to the date when these statements were issued.<br />
In the Year-end Report for 2004, the following was stated by Leif Östling, President and CEO:<br />
“The demand for heavy vehicles in <strong>2005</strong> looks stable, with continued good development in eastern Europe and elsewhere,<br />
but a weak economic development in Europe may affect the positive trend. There is also uncertainty regarding the<br />
development of raw material prices.”<br />
Contact persons:<br />
Cecilia Edström, Corporate Relations tel. +46 8 5538 3557<br />
mobile tel. +46 70 588 3557<br />
Stina Thorman, Investor Relations tel. +46 8 5538 3716<br />
mobile tel. +46 70 518 3716<br />
Eric Österberg, Corporate Communications tel. +46 8 5538 5883<br />
mobile tel. +46 70 590 0599<br />
Scania AB (publ) SE-151 87 Södertälje tel. +46 8 5538 1000<br />
Corporate ID number Sweden fax. +46 8 5538 1037<br />
556184-8564 www.scania.com<br />
6
<strong>SCANIA</strong> <strong>INTERIM</strong> <strong>REPORT</strong> – <strong>JANUARY</strong> – <strong>MARCH</strong> <strong>2005</strong><br />
Income statement<br />
Amounts in SEK m.<br />
Q1<br />
unless otherwise stated EUR m.* <strong>2005</strong> 2004<br />
Change<br />
in % 2004<br />
Apr 04-<br />
Mar 05<br />
Vehicles and Service<br />
Sales revenue 1,518 13,873 13,083 6 56,788 57,578<br />
Cost of goods sold -1,129 -10,318 -9,907 4 -42,554 -42,965<br />
Gross income 389 3,555 3,176 12 14,234 14,613<br />
Research and development expenses -62 -567 -392 45 -1,987 -2,162<br />
Selling expenses -135 -1,232 -1,253 -2 -5,372 -5,351<br />
Administrative expenses -23 -206 -171 20 -806 -841<br />
Share of income in associated companies 0 3 2 12 13<br />
Operating income, Vehicles and Service 169 1,553 1,362 14 6,081 6,272<br />
Customer Finance<br />
Interest and rental revenue 94 855 859 0 3,427 3,423<br />
Interest and depreciation expenses -69 -633 -652 -3 -2,572 -2,553<br />
Net interest revenue 25 222 207 7 855 870<br />
Other revenue and expenses 1 13 1 2 14<br />
Gross income 26 235 208 13 857 884<br />
Credit losses -2 -20 -33 39 -89 -76<br />
Selling and administrative expenses -10 -89 -72 -24 -318 -335<br />
Operating income, Customer Finance 14 126 103 22 450 473<br />
Operating income 183 1,679 1,465 15 6,531 6,745<br />
Net interest items -5 -49 -68 28 -292 -273<br />
Other financial revenue and expenses 7 68 -23 -31 60<br />
Financial revenue and expenses 2 19 -91 -323 -213<br />
Income before taxes 185 1,698 1,374 24 6,208 6,532<br />
Taxes -59 -543 -400 36 -1,943 -2,086<br />
Net income 126 1,155 974 19 4,265 4,446<br />
Minority interest 0 0 2 2 0<br />
Includes depreciation of -591 -444 -1,990 -2,116<br />
Number of shares: 200 million 1<br />
Operating margin, in percent 12.1 11.2 11.5 11.7<br />
Return on equity, in percent 2 21.4 17.9 21.33 22.23<br />
Earnings per share, SEK 5.78 4.87<br />
1<br />
After the issue of shares when acquiring Ainax, the total number of Scania AB shares issued amounts to 226,296,508.<br />
The total number of Scania shares amounts to 200 million after adjusting for internal holding by the Scania Group.<br />
2 Calculations are based on rolling 12-month income.<br />
* Translated solely for the convenience of the reader at a closing exchange rate of SEK 9.138 = EUR 1.00.<br />
7
<strong>SCANIA</strong> <strong>INTERIM</strong> <strong>REPORT</strong> – <strong>JANUARY</strong> – <strong>MARCH</strong> <strong>2005</strong><br />
Revenue and deliveries, Vehicles and Service<br />
Amounts in SEK m.<br />
Q1<br />
unless otherwise stated EUR m.* <strong>2005</strong> 2004<br />
Change<br />
in % 2004<br />
Apr 04-<br />
Mar 05<br />
Revenue<br />
Trucks 899 8,216 7,420 11 33,407 34,203<br />
Buses** 128 1,174 1,089 8 5,504 5,589<br />
Engines 15 139 141 -1 658 656<br />
Service-related products 324 2,956 2,869 3 11,418 11,505<br />
Used vehicles etc. 191 1,749 1,751 - 6,792 6,790<br />
Revenue deferral 3 -39 -361 -187 -991 -1,165<br />
Total 1,518 13,873 13,083 6 56,788 57,578<br />
Revenue 4<br />
Western Europe 1,054 9,630 9,505 1 38,730 38,855<br />
Central and eastern Europe 125 1,140 847 35 4,941 5,234<br />
Latin America 159 1,456 1,116 30 5,653 5,993<br />
Asia 91 828 932 -11 3,995 3,891<br />
Other markets 89 819 683 20 3,469 3,605<br />
Total 1,518 13,873 13,083 6 56,788 57,578<br />
Total delivery volume, units<br />
Trucks 12,003 11,399 5 50,563 51,167<br />
Buses** 1,253 1,042 20 5,519 5,730<br />
Engines 1,023 1,116 -8 5,014 4,921<br />
3 Refers to the difference between sales recognised as revenue and sales based on deliveries.<br />
4 Revenue from external customers by location of customers.<br />
* Translated solely for the convenience of the reader at a closing exchange rate of SEK 9.138 = EUR 1.00.<br />
** Including body-built buses and coaches.<br />
8
Earnings by quarter<br />
<strong>SCANIA</strong> <strong>INTERIM</strong> <strong>REPORT</strong> – <strong>JANUARY</strong> – <strong>MARCH</strong> <strong>2005</strong><br />
Amounts in SEK m.<br />
<strong>2005</strong> 2004<br />
unless otherwise stated EUR m.* Q1 Full year Q4 Q3 Q2 Q1<br />
Vehicles and Service<br />
Sales revenue 1,518 13,873 56,788 16,264 13,323 14,118 13,083<br />
Cost of goods sold -1,129 -10,318 -42,554 -11,997 -10,116 -10,534 -9,907<br />
Gross income 389 3,555 14,234 4,267 3,207 3,584 3,176<br />
Research and development expenses -62 -567 -1,987 -563 -471 -561 -392<br />
Selling expenses -135 -1,232 -5,372 -1,446 -1,292 -1,381 -1,253<br />
Administrative expenses -23 -206 -806 -251 -190 -194 -171<br />
Share of income in associated companies 0 3 12 1 7 2 2<br />
Operating income, Vehicles and Service 169 1,553 6,081 2,008 1,261 1,450 1,362<br />
Customer Finance<br />
Interest and rental revenue 94 855 3,427 851 881 836 859<br />
Interest and depreciation expenses -69 -633 -2,572 -633 -663 -624 -652<br />
Net interest revenue 25 222 855 218 218 212 207<br />
Other revenue and expenses 1 13 2 -4 2 3 1<br />
Gross income 26 235 857 214 220 215 208<br />
Credit losses -2 -20 -89 -10 -21 -25 -33<br />
Selling and administrative expenses -10 -89 -318 -89 -77 -80 -72<br />
Operating income, Customer Finance 14 126 450 115 122 110 103<br />
Operating income 183 1,679 6,531 2,123 1,383 1,560 1,465<br />
Net interest items -5 -49 -292 -72 -70 -82 -68<br />
Other financial revenue and expenses 7 68 -31 10 -6 -12 -23<br />
Financial revenue and expenses 2 19 -323 -62 -76 -94 -91<br />
Income before taxes 185 1,698 6,208 2,061 1,307 1,466 1,374<br />
Taxes -59 -543 -1, 943 -694 -409 -440 -400<br />
Net income 126 1,155 4,265 1,367 898 1,026 974<br />
Minority interest 0 0 2 -1 1 0 2<br />
Earnings per share, SEK 5.78 21.33 6.84 4.49 5.13 4.87<br />
Operating margin, in percent 12.1 11.5 13.1 10.4 11.0 11.2<br />
* Translated solely for the convenience of the reader at a closing exchange rate of SEK 9.138 = EUR 1.00.<br />
9
<strong>SCANIA</strong> <strong>INTERIM</strong> <strong>REPORT</strong> – <strong>JANUARY</strong> – <strong>MARCH</strong> <strong>2005</strong><br />
Balance sheet<br />
Amounts in SEK m.<br />
<strong>2005</strong> 2004<br />
unless otherwise stated EUR m.* 31 Mar 31 Dec 30 Sep 30 Jun 31 Mar<br />
ASSETS<br />
Intangible non-current assets 293 2,679 2,626 2,610 2,569 2,566<br />
Tangible non-current assets 2,661 24,321 23,910 23,797 24,112 24,498<br />
Shares and participations 11 96 92 105 107 127<br />
Inventories 1,204 10,999 9,487 10,082 10,125 9,725<br />
Other receivables 1,193 10,899 11,458 10,408 10,377 10,214<br />
Interest-bearing receivables 2,359 21,555 20,632 20,051 20,230 19,844<br />
Liquid investments 376 3,437 2,498 1,590 1,310 1,405<br />
Total assets 8,097 73,986 70,703 68,643 68,830 68,379<br />
EQUITY AND LIABILITIES<br />
Equity 2,496 22,810 21,433 20,271 19,374 19,803<br />
Provisions for pensions 281 2,566 2,499 2,290 2,278 2,326<br />
Other provisions 556 5,074 4,907 5,037 5,000 5,039<br />
Other liabilities 1,750 15,990 16,251 15,557 15,512 15,109<br />
Borrowings 3,014 27,546 25,613 25,488 26,666 26,102<br />
Total equity and liabilities 8,097 73,986 70,703 68,643 68,830 68,379<br />
Equity/assets ratio, in percent 30.8 30.3 29.5 28.1 29.0<br />
* Translated solely for the convenience of the reader at a closing exchange rate of SEK 9.138 = EUR 1.00.<br />
10
<strong>SCANIA</strong> <strong>INTERIM</strong> <strong>REPORT</strong> – <strong>JANUARY</strong> – <strong>MARCH</strong> <strong>2005</strong><br />
Statement of changes in equity________<br />
First quarter<br />
Amounts in SEK m.<br />
IFRS Swedish GAAP<br />
unless otherwise stated EUR m.* <strong>2005</strong> 2004<br />
Equity, 1 January 2,346 21,433 18,251<br />
Effect of changes in accounting principles,<br />
opening balance 5 2 22 -<br />
Equity, 1 January, IFRS adjusted 2,348 21,455 -<br />
Effect of changes in accounting principles (RR29) - - 26<br />
Revaluation reserve cash flow hedge -13 -115 -<br />
Exchange rate differences 34 307 350<br />
Net income 126 1,155 921<br />
Total equity attributable to shareholders in<br />
Scania AB, 31 March 2,495 22,802 19,548<br />
Minority interest 1 8 -<br />
Equity, 31 March 2,496 22,810 19,548<br />
Full year 2004<br />
Amounts in SEK m.<br />
IFRS Swedish GAAP<br />
unless otherwise stated EUR m.* 2004 2004<br />
Equity, 1 January 1,997 18,251 18,251<br />
Effect of changes in accounting principles,<br />
opening balance 6 21 190 -<br />
Equity, 1 January, IFRS adjusted 2,018 18,441 -<br />
Effect of changes in accounting principles (RR29) 3 26 26<br />
Exchange rate differences -11 -104 -104<br />
Net income 467 4,265 4,077<br />
Dividend to shareholders -131 -1,200 -1,200<br />
Total equity attributable to shareholders in Scania<br />
AB, 31 December 2,346 21,428 21,050<br />
Minority interest 1 5 -<br />
Equity, 31 December 2,347 21,433 21,050<br />
* Translated solely for the convenience of the reader at a closing exchange rate of SEK 9.138 = EUR 1.00.<br />
5 The transition to IFRS with respect to IAS 32 Financial Instruments: Disclosure and Presentation and IAS 39, Financial<br />
Instruments: Recognition and Measurement occurred as of 1 January <strong>2005</strong>, which means that no recalculation of comparative<br />
figures occurs. According to IAS 39, all derivatives must be valued at market value and be recognised in the balance sheet. As<br />
a result of this, derivatives that were previously outside the balance sheet have been included since the beginning of <strong>2005</strong>.<br />
Beyond this, IAS 32 requires that certain financial instruments previously recognised in a net amount be recognised on a gross<br />
basis. Due to recognition in accordance with IAS 32 and IAS 39 as of 1 January <strong>2005</strong>, total assets rose by SEK 1,189 m. and<br />
long-term and current liabilities rose by SEK 835 m. and SEK 323 m., respectively. Unrestricted reserves were affected in an<br />
amount totalling SEK 22 m., taking the tax effect into account.<br />
6 Scania is presenting comparative figures applying IFRS rules, beginning with 1 January 2004. The transitional effects that<br />
arose in the opening balance for 1 January 2004 were attributable to component depreciation of buildings in accordance with<br />
IAS 16 Property, Plant and Equipment. The transition had an overall impact on tangible assets in the balance sheet of SEK<br />
282 m., of which SEK 190 m. affected equity. Beyond this adjustment of the opening balance, a reclassification of minority<br />
interest, which in accordance with IFRS are recognised as part of equity, also occurred.<br />
11
<strong>SCANIA</strong> <strong>INTERIM</strong> <strong>REPORT</strong> – <strong>JANUARY</strong> – <strong>MARCH</strong> <strong>2005</strong><br />
Statement of cash flow 7 <strong>2005</strong> 2004<br />
Amounts in SEK m.<br />
unless otherwise stated EUR m.* Q1 Q4 Q3 Q2 Q1<br />
Operating activities<br />
Income after financial items 186 1,698 2,061 1,307 1,466 1,374<br />
Items not affecting cash flow 62 572 509 697 666 582<br />
Taxes paid -111 -1,017 -352 -298 -457 -677<br />
Cash flow from operating activities before change in working capital 137 1,253 2,218 1,706 1,675 1,279<br />
Of which: Vehicles and Service 123 1,121 2,325 1,583 1,577 1,200<br />
Customer Finance 14 132 -107 123 98 79<br />
Change in working capital etc., Vehicles and Service -23 -210 -552 -7 -311 -283<br />
Cash flow from operating activities 114 1,043 1,666 1,699 1,364 996<br />
Investing activities<br />
Net investments, Vehicles and Service -70 -639 -817 -669 -746 -615<br />
Net investments in credit portfolio etc., Customer Finance -79 -724 -228 86 -295 -41<br />
Cash flow from investing activities -149 -1,363 -1,045 -583 -1,041 -656<br />
Cash flow from Vehicles and Service 30 272 956 907 520 302<br />
Cash flow from Customer Finance -65 -592 -335 209 -197 38<br />
Financing activities<br />
Change in net debt from financing activities 95 864 -390 -859 866 -881<br />
Dividend to shareholders - - - - -1,200 -<br />
Cash flow from investing activities 95 864 -390 -859 -334 -881<br />
Cash flow for the year 60 544 231 257 -11 -541<br />
Liquid assets at beginning of period 174 1,589 1,385 1,121 1,158 1,663<br />
Effect of exchange rate fluctuations on liquid assets 4 37 -27 7 -26 36<br />
Liquid assets at end of period 238 2,170 1,589 1,385 1,121 1,158<br />
* Translated solely for the convenience of the reader at a closing exchange rate of SEK 9.138 = EUR 1.00.<br />
7 The IFRS transition has not materially affected Scania’s statement of cash flow.<br />
12
Number of employees<br />
<strong>SCANIA</strong> <strong>INTERIM</strong> <strong>REPORT</strong> – <strong>JANUARY</strong> – <strong>MARCH</strong> <strong>2005</strong><br />
<strong>2005</strong> 2004<br />
31 Mar 31 Dec 30 Sep 30 Jun 31 Mar<br />
Production companies etc. 17,982 17,892 18,014 17,760 17,516<br />
Sales and service companies 11,871 11,747 11,747 11,691 11,627<br />
Vehicles and Service 29,853 29,639 29,761 29,451 29,143<br />
Customer Finance 362 354 350 342 329<br />
Total number of employees 30,215 29,993 30,111 29,793 29,472<br />
13
Balance sheet by business segment<br />
<strong>SCANIA</strong> <strong>INTERIM</strong> <strong>REPORT</strong> – <strong>JANUARY</strong> – <strong>MARCH</strong> <strong>2005</strong><br />
Amounts in SEK m.<br />
<strong>2005</strong> 2004<br />
unless otherwise stated EUR m. 31 Mar 31 Dec 30 Sep 30 Jun 31 Mar<br />
Vehicles and Service<br />
ASSETS<br />
Intangible non-current assets 292 2,667 2,613 2,596 2,554 2,551<br />
Tangible non-current assets 2,027 18,520 18,173 17,952 18,002 18,063<br />
Shares and participations 11 96 92 105 107 127<br />
Inventories 1,199 10,957 9,446 10,050 10,082 9,674<br />
Other receivables 1,172 10,711 11,460 10,191 10,117 9,922<br />
Interest-bearing receivables 110 1,010 1,074 1,029 1,156 1,107<br />
Liquid investments 353 3,226 2,196 1,454 1,094 1,239<br />
Total assets 5,164 47,187 45,054 43,377 43,112 42,683<br />
EQUITY AND LIABILITIES<br />
Equity 2,125 19,418 18,336 17,077 16,140 16,546<br />
Provisions for pensions 280 2,557 2,490 2,281 2,269 2,317<br />
Other provisions 488 4,455 4,307 4,400 4,259 4,289<br />
Other liabilities 1,815 16,589 16,871 16,175 16,234 15,789<br />
Borrowings 456 4,168 3,050 3,444 4,210 3,742<br />
Total equity and liabilities 5,164 47,187 45,054 43,377 43,112 42,683<br />
Net debt, excluding provisions for<br />
pensions 103 942 854 1,990 3,116 2,503<br />
Customer Finance<br />
ASSETS<br />
Intangible non-current assets 1 12 13 14 15 15<br />
Lease assets 774 7,075 7,043 7,147 7,438 7,767<br />
Other tangible non-current assets 2 22 22 23 22 21<br />
Inventories 5 42 41 32 43 52<br />
Other receivables 64 585 658 484 561 594<br />
Financial receivables 2,248 20,545 19,558 19,022 19,074 18,737<br />
Liquid investments 23 211 302 136 216 166<br />
Total assets 3,117 28,492 27,637 26,858 27,369 27,352<br />
EQUITY AND LIABILITIES<br />
Equity 371 3,392 3,097 3,194 3,234 3,257<br />
Provisions for pensions 1 9 9 9 9 9<br />
Other provisions 67 619 600 637 741 750<br />
Other liabilities 120 1,094 1,368 974 929 976<br />
Borrowings 2,558 23,378 22,563 22,044 22,456 22,360<br />
Total equity and liabilities 3,117 28,492 27,637 26,858 27,369 27,352<br />
* Translated solely for the convenience of the reader at a closing exchange rate of SEK 9.138 = EUR 1.00.<br />
14
Balance sheet by business segment<br />
<strong>SCANIA</strong> <strong>INTERIM</strong> <strong>REPORT</strong> – <strong>JANUARY</strong> – <strong>MARCH</strong> <strong>2005</strong><br />
Amounts in SEK m.<br />
<strong>2005</strong> 2004<br />
unless otherwise stated EUR m.* 31 Mar 31 Dec 30 Sep 30 Jun 31 Mar<br />
Eliminations<br />
ASSETS<br />
Tangible non-current assets -142 -1,296 -1,328 -1,325 -1,350 -1,353<br />
Other receivables -43 -397 -660 -267 -301 -303<br />
Total assets -185 -1,693 -1,988 -1,592 -1,651 -1,656<br />
EQUITY AND LIABILITIES<br />
Other liabilities -185 -1,693 -1,988 -1,592 -1,651 -1,656<br />
Total equity and liabilities -185 -1,693 -1,988 -1,592 -1,651 -1,656<br />
Scania Group<br />
ASSETS<br />
Intangible non-current assets 293 2,679 2,626 2,610 2,569 2,566<br />
Tangible non-current assets 2,661 24,321 23,910 23,797 24,112 24,498<br />
Shares and participations 11 96 92 105 107 127<br />
Inventories 1,204 10,999 9,487 10,082 10,125 9,726<br />
Other receivables 1,193 10,899 11,458 10,408 10,377 10,213<br />
Interest-bearing receivables 2,359 21,555 20,632 20,051 20,230 19,844<br />
Liquid investments 376 3,437 2,498 1,590 1,310 1,405<br />
Total assets 8,097 73,986 70,703 68,643 68,830 68,379<br />
EQUITY AND LIABILITIES<br />
Equity 2,496 22,810 21,433 20,271 19,374 19,803<br />
Provisions to pensions 281 2,566 2,499 2,290 2,278 2,326<br />
Other provisions 556 5,074 4,907 5,037 5,000 5,039<br />
Other liabilities 1,750 15,990 16,251 15,557 15,512 15,109<br />
Borrowings 3,014 27,546 25,613 25,488 26,666 26,102<br />
Total equity and liabilities 8,097 73,986 70,703 68,643 68,830 68,379<br />
* Translated solely for the convenience of the reader at a closing exchange rate of SEK 9.138 = EUR 1.00.<br />
15
Units by quarter (by geographic area)<br />
<strong>SCANIA</strong> <strong>INTERIM</strong> <strong>REPORT</strong> – <strong>JANUARY</strong> – <strong>MARCH</strong> <strong>2005</strong><br />
<strong>2005</strong> 2004<br />
Q1 Full year Q4 Q3 Q2 Q1<br />
Order bookings, trucks<br />
Western Europe 8,196 32,645 8,899 6,790 8,349 8,607<br />
Central and eastern Europe 1,002 5,727 1,618 1,260 1,532 1,317<br />
Latin America 2,008 7,644 1,863 1,935 2,141 1,705<br />
Asia 1,501 5,816 918 1,232 1,778 1,889<br />
Other markets 634 2,096 640 388 463 604<br />
Total 13,341 53,928 13,938 11,605 14,263 14,122<br />
Trucks delivered<br />
Western Europe 7,435 30,412 9,316 6,215 7,572 7,309<br />
Central and eastern Europe 1,186 5,172 1,638 1,199 1,491 844<br />
Latin America 1,760 7,604 2,095 2,126 1,912 1,471<br />
Asia 1,125 5,464 1,637 1,200 1,248 1,379<br />
Other markets 497 1,911 550 527 438 396<br />
Total 12,003 50,563 15,236 11,267 12,661 11,399<br />
Order bookings, buses**<br />
Western Europe 830 2,333 693 591 505 544<br />
Central and eastern Europe 131 491 101 149 67 174<br />
Latin America 782 1,621 289 535 512 285<br />
Asia 205 955 197 250 193 315<br />
Other markets 152 653 211 181 163 98<br />
Total 2,100 6,053 1,491 1,706 1,440 1,416<br />
Buses delivered**<br />
Western Europe 487 2,226 653 436 555 582<br />
Central and eastern Europe 84 355 124 85 93 53<br />
Latin America 386 1,472 355 524 342 251<br />
Asia 156 947 320 214 325 88<br />
Other markets 140 519 174 142 135 68<br />
Total 1,253 5,519 1,626 1,401 1,450 1,042<br />
** Including body-built buses and coaches.<br />
16
SWE GAAP Summary<br />
Income statement<br />
<strong>SCANIA</strong> <strong>INTERIM</strong> <strong>REPORT</strong> – <strong>JANUARY</strong> – <strong>MARCH</strong> <strong>2005</strong><br />
SWE GAAP IFRS SWE GAAP IFRS<br />
Amounts in SEK m.<br />
Q1 Q1<br />
Full year Full year<br />
unless otherwise stated 2004 2004 Difference<br />
2004 2004 Difference<br />
Vehicles and Service<br />
Sales revenue 13,083 13,083 0 56,788 56,788 0<br />
Cost of goods sold 8 -9,917 -9,907 10 -42,570 -42,554 16<br />
Gross income 3,166 3,176 10 14,218 14,234 16<br />
Research and development expenses -392 -392 0 -1,987 -1,987 0<br />
Selling expenses 8 -1,297 -1,253 44 -5,550 -5,372 178<br />
Administrative expenses 8 -170 -171 -1 -806 -806 0<br />
Share of income in associated companies 2 2 0 12 12 0<br />
Operating income, Vehicles and Service 1,309 1,362 53 5,887 6,081 194<br />
Customer Finance<br />
Interest and rental revenue 859 859 0 3,427 3,427 0<br />
Interest and depreciation expenses -652 -652 0 -2,572 -2,572 0<br />
Net interest revenue 207 207 0 855 855 0<br />
Other revenue and expenses 1 1 0 2 2 0<br />
Gross income 208 208 0 857 857 0<br />
Credit losses -33 -33 0 -89 -89 0<br />
Selling and administrative expenses -72 -72 0 -318 -318 0<br />
Operating income, Customer Finance 103 103 0 450 450 0<br />
Operating income 1 412 1 465 53 6 337 6 531 194<br />
Financial revenue and expenses -91 -91 0 -323 -323 0<br />
Income before taxes 1,321 1,374 53 6,014 6,208 194<br />
Taxes 9 -398 -400 -2 -1,935 -1,943 -8<br />
Minority interest 10 -2 0 2 -2 0 2<br />
Net income 921 974 53 4,077 4,265 188<br />
Minority interest 10 0 2 2 0 2 2<br />
Includes depreciation of -497 -444 -2 184 -1 990<br />
Operating margin, in percent 10.8 11.2 11.2 11.5<br />
Return on equity, in percent 17.6 17.9 20.8 21.5<br />
Earnings per share, SEK 4.61 4.87 20.39 21.33<br />
17
SWE GAAP Summary<br />
Balance sheet<br />
<strong>SCANIA</strong> <strong>INTERIM</strong> <strong>REPORT</strong> – <strong>JANUARY</strong> – <strong>MARCH</strong> <strong>2005</strong><br />
SWE GAAP IFRS SWE GAAP IFRS<br />
Amounts in SEK m.<br />
2004 2004 2004 2004<br />
unless otherwise stated 31 Mar 31 Mar Difference 31 Dec 31 Dec Difference<br />
ASSETS<br />
Intangible non-current assets 11 2,531 2,566 35 2,460 2,626 166<br />
Tangible non-current assets 12 24,185 24,498 313 23,598 23,910 312<br />
Shares and participations 127 127 0 92 92 0<br />
Inventories 9,725 9,725 0 9,487 9,487 0<br />
Other receivables 10,217 10,214 -3 11,458 11,458 0<br />
Interest-bearing receivables 19,844 19,844 0 20,632 20,632 0<br />
Liquid investments 1,405 1,405 0 2,498 2,498 0<br />
Total assets 68,034 68,379 345 70,225 70,703 478<br />
EQUITY AND LIABILITIES<br />
Equity 19,548 19,803 255 21,050 21,433 383<br />
Provisions for pensions 2,326 2,326 0 2,499 2,499 0<br />
Other provisions 13 4,940 5,039 99 4,804 4,907 103<br />
Other liabilities 15,118 15,109 -9 16,259 16,251 -8<br />
Borrowings 26,102 26,102 0 25,613 25,613 0<br />
Total equity and liabilities 68,034 68,379 345 70,225 70,703 478<br />
18
<strong>SCANIA</strong> <strong>INTERIM</strong> <strong>REPORT</strong> – <strong>JANUARY</strong> – <strong>MARCH</strong> <strong>2005</strong><br />
8 The IFRS transition affects operating expenses positively, due to the reversal of goodwill amortisation carried out during 2004 according to Swedish GAAP,<br />
as well as component depreciation, which was adjusted as a consequence of changes in depreciation periods for tangible non-current assets.<br />
9 Taxes are affected by the changes in depreciation periods for tangible non-current assets according to IAS 16.<br />
10<br />
In accordance with IAS 27, Consolidated and Separate Financial Statements, net income for the year is reported without taking minority interest into account. Instead a separate<br />
disclosure is provided of how much of earnings constitute the minority’s interest.<br />
11 In accordance with IFRS 3, Business Combinations, no goodwill amortisation has been carried out in the recalculated balance sheet for 2004 according to IFRS. The total effect on<br />
the full year 2004 was an increase in recognised goodwill value of about SEK 166 m. The effect of reversing the goodwill amortisation for the first quarter of 2004 amounted to SEK 35<br />
m.<br />
12 Scania’s tangible non-current assets have been affected by the IFRS transition, since component depreciation has been applied to Scania’s buildings. IAS 16, Property, Plant and<br />
Equipment, states that the capitalised cost of an asset shall be allocated among the various significant constituent parts of the asset. As a result of this adjustment, depreciation<br />
periods have been affected by the transition to IFRS. The effect as a consequence of the use of component depreciation at Scania during the full year 2004 was that the carrying<br />
amount of tangible non-current assets rose by SEK 312 m.; the effect on the first quarter was an increase of SEK 313 m.<br />
13 Other provisions are influenced by the tax effect attributable to changed depreciation periods for tangible non-current assets according to IAS 16.<br />
19


