Behavior and strength of welded stud shear connectors in composite ...
Behavior and strength of welded stud shear connectors in composite ...
Behavior and strength of welded stud shear connectors in composite ...

Create successful ePaper yourself
Turn your PDF publications into a flip-book with our unique Google optimized e-Paper software.
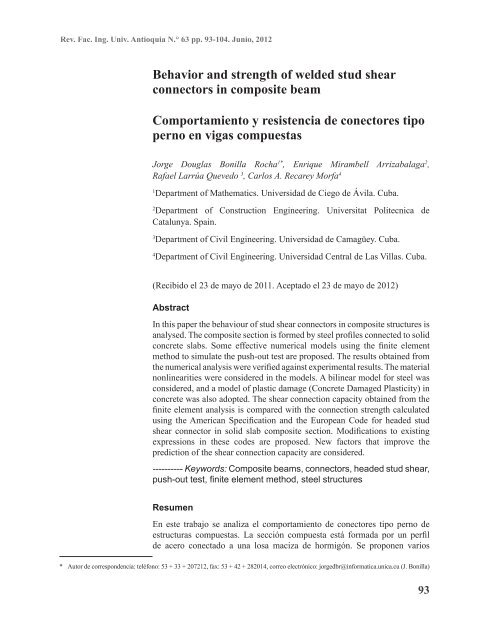
Rev. Fac. Ing. Univ. Antioquia N.° 63 pp. 93-104. Junio, 2012<br />
<strong>Behavior</strong> <strong>and</strong> <strong>strength</strong> <strong>of</strong> <strong>welded</strong> <strong>stud</strong> <strong>shear</strong><br />
<strong>connectors</strong> <strong>in</strong> <strong>composite</strong> beam<br />
Comportamiento y resistencia de conectores tipo<br />
perno en vigas compuestas<br />
Jorge Douglas Bonilla Rocha 1* , Enrique Mirambell Arrizabalaga 2 ,<br />
Rafael Larrúa Quevedo 3 , Carlos A. Recarey Morfa 4<br />
1<br />
Department <strong>of</strong> Mathematics. Universidad de Ciego de Ávila. Cuba.<br />
2<br />
Department <strong>of</strong> Construction Eng<strong>in</strong>eer<strong>in</strong>g. Universitat Politecnica de<br />
Catalunya. Spa<strong>in</strong>.<br />
3<br />
Department <strong>of</strong> Civil Eng<strong>in</strong>eer<strong>in</strong>g. Universidad de Camagüey. Cuba.<br />
4<br />
Department <strong>of</strong> Civil Eng<strong>in</strong>eer<strong>in</strong>g. Universidad Central de Las Villas. Cuba.<br />
(Recibido el 23 de mayo de 2011. Aceptado el 23 de mayo de 2012)<br />
Abstract<br />
In this paper the behaviour <strong>of</strong> <strong>stud</strong> <strong>shear</strong> <strong>connectors</strong> <strong>in</strong> <strong>composite</strong> structures is<br />
analysed. The <strong>composite</strong> section is formed by steel pr<strong>of</strong>iles connected to solid<br />
concrete slabs. Some effective numerical models us<strong>in</strong>g the f<strong>in</strong>ite element<br />
method to simulate the push-out test are proposed. The results obta<strong>in</strong>ed from<br />
the numerical analysis were verified aga<strong>in</strong>st experimental results. The material<br />
nonl<strong>in</strong>earities were considered <strong>in</strong> the models. A bil<strong>in</strong>ear model for steel was<br />
considered, <strong>and</strong> a model <strong>of</strong> plastic damage (Concrete Damaged Plasticity) <strong>in</strong><br />
concrete was also adopted. The <strong>shear</strong> connection capacity obta<strong>in</strong>ed from the<br />
f<strong>in</strong>ite element analysis is compared with the connection <strong>strength</strong> calculated<br />
us<strong>in</strong>g the American Specification <strong>and</strong> the European Code for headed <strong>stud</strong><br />
<strong>shear</strong> connector <strong>in</strong> solid slab <strong>composite</strong> section. Modifications to exist<strong>in</strong>g<br />
expressions <strong>in</strong> these codes are proposed. New factors that improve the<br />
prediction <strong>of</strong> the <strong>shear</strong> connection capacity are considered.<br />
---------- Keywords: Composite beams, <strong>connectors</strong>, headed <strong>stud</strong> <strong>shear</strong>,<br />
push-out test, f<strong>in</strong>ite element method, steel structures<br />
Resumen<br />
En este trabajo se analiza el comportamiento de conectores tipo perno de<br />
estructuras compuestas. La sección compuesta está formada por un perfil<br />
de acero conectado a una losa maciza de hormigón. Se proponen varios<br />
* Autor de correspondencia: teléfono: 53 + 33 + 207212, fax: 53 + 42 + 282014, correo electrónico: jorgedbr@<strong>in</strong>formatica.unica.cu (J. Bonilla)<br />
93
Rev. Fac. Ing. Univ. Antioquia N.° 63. Junio 2012<br />
modelos numéricos de la simulación del ensayo push-out, utiliz<strong>and</strong>o el<br />
método de elementos f<strong>in</strong>itos. Los resultados obtenidos del análisis numérico<br />
son validados contra resultados experimentales. Se considera la no l<strong>in</strong>ealidad<br />
de los materiales, emple<strong>and</strong>o un modelo bil<strong>in</strong>eal para el acero y un modelo<br />
de daño plástico para el hormigón. La capacidad de la conexión obtenida a<br />
partir del análisis por elementos f<strong>in</strong>itos se compara con la calculada us<strong>and</strong>o<br />
la Normativa Americana y el Código Europeo para conectores tipo perno<br />
en sección compuesta de losa maciza. Se proponen varias modificaciones<br />
a las expresiones existentes en dichos códigos, donde se consideran nuevos<br />
factores que mejoran la predicción de la capacidad resistente última de la<br />
conexión.<br />
---------- Palabras clave: Vigas compuestas, conectores, perno, ensayo<br />
push-out, método de los elementos f<strong>in</strong>itos, estructuras de acero<br />
Introduction<br />
This paper describes the structural performance <strong>of</strong><br />
<strong>shear</strong> connection <strong>in</strong> solid slab <strong>composite</strong> beams.<br />
The behaviour <strong>of</strong> headed <strong>stud</strong>s <strong>in</strong> <strong>composite</strong><br />
beams depends on many factors, <strong>in</strong>clud<strong>in</strong>g<br />
<strong>strength</strong> <strong>and</strong> dimensions <strong>of</strong> headed <strong>stud</strong> <strong>shear</strong><br />
<strong>connectors</strong>, compressive <strong>strength</strong> <strong>of</strong> concrete,<br />
spac<strong>in</strong>g <strong>of</strong> the <strong>stud</strong> <strong>shear</strong> <strong>connectors</strong> <strong>and</strong> heightdiameter<br />
ratio <strong>of</strong> the <strong>stud</strong>s. Push-out tests are<br />
commonly used to determ<strong>in</strong>e the capacity <strong>of</strong><br />
<strong>shear</strong> connection.<br />
F<strong>in</strong>ite element modell<strong>in</strong>g <strong>of</strong> <strong>shear</strong> connection<br />
can provide an efficient alternative to costly<br />
<strong>and</strong> time consum<strong>in</strong>g full-scale push-out tests.<br />
Lam <strong>and</strong> Ellobody [1], Ellobody <strong>and</strong> Young [2]<br />
developed an accurate nonl<strong>in</strong>ear f<strong>in</strong>ite element<br />
model to <strong>stud</strong>y the behaviour <strong>of</strong> headed <strong>stud</strong><br />
<strong>shear</strong> <strong>connectors</strong> <strong>in</strong> <strong>composite</strong> sections. In this<br />
paper an accurate nonl<strong>in</strong>ear three-dimensional<br />
f<strong>in</strong>ite element model to <strong>stud</strong>y the behaviour<br />
<strong>of</strong> headed <strong>stud</strong> <strong>shear</strong> <strong>connectors</strong> <strong>in</strong> <strong>composite</strong><br />
beams us<strong>in</strong>g the program ABAQUS/CAE Ver-<br />
6.6-1 is presented. The material nonl<strong>in</strong>earities<br />
are considered <strong>in</strong> the models. A model <strong>of</strong> plastic<br />
damage (Concrete Damaged Plasticity) <strong>in</strong><br />
concrete has been adopted, <strong>and</strong> a elastic-perfectly<br />
plastic model for steel has been considered. The<br />
results obta<strong>in</strong>ed from the f<strong>in</strong>ite element analysis<br />
were verified aga<strong>in</strong>st the experimental results<br />
obta<strong>in</strong>ed by Lam <strong>and</strong> Ellobody [1].<br />
In this work, the results <strong>of</strong> the f<strong>in</strong>ite element<br />
analysis were compared with the American<br />
Specification AISC (2005) [3] <strong>and</strong> the European<br />
Code EC-4 (2004) [4] for steel-concrete<br />
<strong>composite</strong> structures. It was observed that the<br />
AISC [3] overestimates the <strong>stud</strong> <strong>strength</strong>, while<br />
the EC-4 [4] <strong>in</strong> some cases overestimated the <strong>stud</strong><br />
<strong>strength</strong>, but <strong>in</strong> another cases underestimates it.<br />
This paper proposes a new equation that improves<br />
the prediction <strong>of</strong> the <strong>stud</strong> <strong>strength</strong> capacity, where<br />
a reduction factor is <strong>in</strong>troduced <strong>in</strong> order to consider<br />
the effect <strong>of</strong> the longitud<strong>in</strong>al spac<strong>in</strong>g <strong>of</strong> the <strong>stud</strong>s<br />
on the <strong>shear</strong> connection capacity. Besides, a new<br />
reduction factor is proposed to take <strong>in</strong>to account<br />
the effect <strong>of</strong> the height to diameter ratio <strong>of</strong> the<br />
<strong>stud</strong>s. F<strong>in</strong>ally, the results obta<strong>in</strong>ed from the new<br />
equation are compared with AISC [3], EC-4 [4]<br />
<strong>and</strong> the numerical analysis.<br />
A sc<br />
d<br />
E c<br />
E cm<br />
E s<br />
Nomenclature<br />
Cross-section area <strong>of</strong> headed <strong>stud</strong> <strong>shear</strong><br />
connector<br />
Diameter <strong>of</strong> headed <strong>stud</strong> <strong>shear</strong> connector<br />
Initial Young’s modulus <strong>of</strong> concrete<br />
Mean value <strong>of</strong> the secant modulus <strong>of</strong><br />
concrete tabulate <strong>in</strong> EC-4<br />
Initial Young’s modulus <strong>of</strong> headed <strong>stud</strong><br />
<strong>shear</strong> connector<br />
94
<strong>Behavior</strong> <strong>and</strong> <strong>strength</strong> <strong>of</strong> <strong>welded</strong> <strong>stud</strong> <strong>shear</strong> <strong>connectors</strong> <strong>in</strong> <strong>composite</strong> beam<br />
f’ c<br />
Compressive cyl<strong>in</strong>der <strong>strength</strong> <strong>of</strong> concrete<br />
f ck<br />
f y<br />
F u<br />
f u<br />
h c<br />
Compressive cyl<strong>in</strong>der <strong>strength</strong> <strong>of</strong> concrete<br />
Yield stress <strong>of</strong> headed <strong>stud</strong> <strong>shear</strong><br />
connector<br />
Specified m<strong>in</strong>imum ultimate tensile<br />
<strong>strength</strong> <strong>of</strong> the headed <strong>stud</strong> <strong>shear</strong><br />
connector<br />
Ultimate tensile <strong>strength</strong> <strong>of</strong> the headed<br />
<strong>stud</strong> material<br />
Height <strong>of</strong> headed <strong>stud</strong> <strong>shear</strong> connector<br />
Q sc-AISC<br />
Nom<strong>in</strong>al unfactored design <strong>strength</strong><br />
calculated us<strong>in</strong>g AISC<br />
Q sc-EC-4<br />
Nom<strong>in</strong>al unfactored design <strong>strength</strong><br />
calculated us<strong>in</strong>g EC-4<br />
Q sc-FE<br />
Q sc-NE<br />
Q sc-test<br />
R g<br />
R p<br />
α<br />
γ<br />
Capacity <strong>of</strong> <strong>shear</strong> connection per <strong>stud</strong><br />
obta<strong>in</strong>ed from f<strong>in</strong>ite element analysis<br />
Capacity <strong>of</strong> <strong>shear</strong> connection per <strong>stud</strong><br />
obta<strong>in</strong>ed from the new expression (Eq.<br />
6)<br />
Capacity <strong>of</strong> <strong>shear</strong> connection per <strong>stud</strong><br />
obta<strong>in</strong>ed from push-out tests<br />
Reduction factor<br />
Reduction factor<br />
Reduction factor<br />
Reduction factor<br />
Ultimate <strong>strength</strong> <strong>of</strong> headed <strong>shear</strong> <strong>stud</strong><br />
<strong>connectors</strong><br />
The design st<strong>and</strong>ards for <strong>shear</strong> <strong>stud</strong>s <strong>in</strong> <strong>composite</strong><br />
beam are covered by AISC [3] <strong>and</strong> EC-4 [4]. In<br />
AISC, the nom<strong>in</strong>al <strong>shear</strong> <strong>of</strong> a <strong>stud</strong> <strong>shear</strong> connector<br />
is governed by the general equation:<br />
(1)<br />
This equation (1) adopts the follow<strong>in</strong>g form (Eq.<br />
2) for <strong>shear</strong> <strong>stud</strong>s <strong>in</strong> solids concrete slabs:<br />
(2)<br />
EC-4 [4] gives a similar approach for determ<strong>in</strong><strong>in</strong>g<br />
the ultimate resistance <strong>of</strong> <strong>stud</strong> <strong>connectors</strong> (Q sc<br />
)<br />
by present<strong>in</strong>g the formulas below, where Q sc<br />
is<br />
taken as:<br />
where α is determ<strong>in</strong>ed by:<br />
(3)<br />
Description <strong>of</strong> push-out test specimen<br />
This <strong>stud</strong>y is based on the virtual simulation <strong>of</strong> the<br />
push-out test. For the calibration <strong>and</strong> validation <strong>of</strong><br />
the numerical model, the virtual simulation <strong>of</strong> four<br />
push-out tests is made, where only the concrete<br />
<strong>strength</strong> varies (see table 1). The experimental<br />
results have been taken from [1].<br />
Table 1 Results <strong>of</strong> ultimate load <strong>of</strong> the experimental push-out tests (Lam <strong>and</strong> Ellobody [1])<br />
Specimen<br />
Dimensions <strong>of</strong> the <strong>stud</strong><br />
(mm)<br />
Concrete compressive<br />
<strong>strength</strong> (MPa)<br />
Ultimate load <strong>in</strong> push out<br />
test (kN)<br />
SP-1 19 x 100 50 130.4<br />
SP-2 19 x 100 20 71.60<br />
SP-3 19 x 100 30 93.00<br />
SP-4 19 x 100 35 102.00<br />
95
Rev. Fac. Ing. Univ. Antioquia N.° 63. Junio 2012<br />
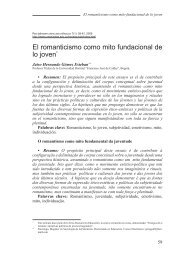
The test specimen is composed by a segment<br />
<strong>of</strong> W10x49 pr<strong>of</strong>ile <strong>and</strong> two rectangular slabs <strong>of</strong><br />
concrete <strong>of</strong> 619 x 469 x 150 mm (length x width x<br />
thickness) dimension, located at each side <strong>of</strong> the<br />
pr<strong>of</strong>ile <strong>in</strong> contact with the flange. The connection<br />
between the slab <strong>and</strong> the pr<strong>of</strong>ile is obta<strong>in</strong>ed by<br />
means <strong>of</strong> a <strong>stud</strong> connector with f y<br />
= 470.8 MPa<br />
<strong>and</strong> E s<br />
= 200000 MPa (see figure 1).<br />
50 209 5 209 5<br />
Load<br />
Connector<br />
150 260 150<br />
619<br />
469<br />
Figure 1 Diagram <strong>of</strong> the test specimen<br />
A<br />
B<br />
F<strong>in</strong>ite element model<br />
General<br />
Generally, for a successful numerical modell<strong>in</strong>g<br />
<strong>of</strong> the connection modell<strong>in</strong>g, all the components<br />
associated with it must be properly represented.<br />
ABAQUS, which is a general purpose f<strong>in</strong>ite<br />
element modell<strong>in</strong>g package, was utilized for this<br />
f<strong>in</strong>ality. With this system, it is possible to consider<br />
the three-dimensional geometry, material<br />
nonl<strong>in</strong>earity, <strong>and</strong> to <strong>in</strong>clude element <strong>in</strong>terface <strong>and</strong><br />
constra<strong>in</strong>t conditions.<br />
Boundary conditions<br />
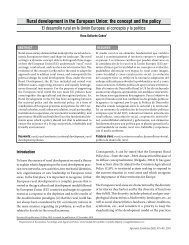
a) Stud: There are two surfaces <strong>of</strong> <strong>in</strong>teraction:<br />
one that guarantees the <strong>stud</strong>-pr<strong>of</strong>ile union,<br />
<strong>and</strong> the <strong>stud</strong>-concrete <strong>in</strong>terface. The <strong>stud</strong>concrete<br />
<strong>in</strong>terface is treated as a rigid<br />
surface, although it is known that there<br />
is not a full cont<strong>in</strong>uity between both<br />
materials. Lam <strong>and</strong> Ellobody [1] use a<br />
rigid contact <strong>in</strong> the <strong>stud</strong>-concrete <strong>in</strong>terface<br />
by disconnect<strong>in</strong>g those nodes which have<br />
been verified that do not participate <strong>in</strong> the<br />
contact (see figure 2).<br />
Stud‐concrete contact<br />
Load<br />
Area without contact<br />
Stud‐concrete contact<br />
Stud‐W Stud‐concrete pr<strong>of</strong>ile contact<br />
Load<br />
Figure 2 Stud-concrete contact surfaces<br />
b) Concrete slab: The<br />
Area<br />
friction<br />
without<br />
force<br />
contact<br />
that is<br />
generated <strong>in</strong> the Stud‐concrete slab-pr<strong>of</strong>ile union contact is not<br />
Stud‐W considered, pr<strong>of</strong>ile contact as usually done <strong>in</strong> push-out<br />
procedures. A normal contact between both<br />
materials was only generated. The support <strong>of</strong><br />
the slab is obta<strong>in</strong>ed <strong>in</strong> the lower part (surface<br />
1 <strong>in</strong> figure<br />
Distributed<br />
3); all nodes<br />
load<br />
<strong>of</strong> the concrete slab <strong>in</strong><br />
the opposite direction <strong>of</strong> load<strong>in</strong>g (surface 1)<br />
are restricted from mov<strong>in</strong>g <strong>in</strong> the Z direction<br />
to resist the compression load.<br />
Distributed load<br />
Po<strong>in</strong>t 1 Surface 1<br />
Surface 1<br />
Fig. 3. Isometric view <strong>of</strong> the virtual specimen geometry<br />
Po<strong>in</strong>t 1 Surface 1<br />
Surface 1<br />
Fig. 3. Isometric view <strong>of</strong> the virtual specimen geometry<br />
Figure 3 Isometric view <strong>of</strong> the virtual specimen<br />
geometry<br />
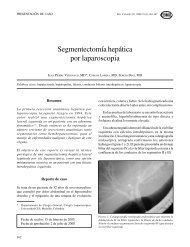
F<strong>in</strong>ite element type <strong>and</strong> mesh density<br />
The results obta<strong>in</strong>ed <strong>in</strong> [5] show that the use <strong>of</strong><br />
C3D6 elements to model the <strong>stud</strong> connector <strong>and</strong> the<br />
concrete slab around the <strong>stud</strong> <strong>and</strong> C3D4 elements<br />
to model other parts <strong>of</strong> the slab is the adequate<br />
configuration, which produces better results,<br />
accord<strong>in</strong>g to real test. For this configuration,<br />
the model for four different mesh densities has<br />
been <strong>stud</strong>ied. This was done by plac<strong>in</strong>g a mesh <strong>of</strong><br />
variable density <strong>in</strong> the slab, <strong>in</strong>creas<strong>in</strong>g the mesh<br />
96
<strong>Behavior</strong> <strong>and</strong> <strong>strength</strong> <strong>of</strong> <strong>welded</strong> <strong>stud</strong> <strong>shear</strong> <strong>connectors</strong> <strong>in</strong> <strong>composite</strong> beam<br />
towards the slab-<strong>stud</strong> contact area. The mesh has<br />
a uniform size <strong>in</strong> the <strong>connectors</strong> (see figure 4).<br />
Fig. 4. Mesh diagram a) Stud, b) Slab c) Pr<strong>of</strong>ile<br />
Figure 4 Mesh diagram a) Stud, b) Slab, c) Pr<strong>of</strong>ile<br />
analysis (Q sc-FE<br />
), as well as the load-slip behaviour<br />
<strong>of</strong> the headed <strong>shear</strong> <strong>stud</strong>, was exam<strong>in</strong>ed. Table<br />
2 shows a comparison <strong>of</strong> the capacities <strong>of</strong><br />
<strong>shear</strong> connection obta<strong>in</strong>ed experimentally <strong>and</strong><br />
numerically. Good agreement between numerical<br />
<strong>and</strong> experimental result is observed. A maximum<br />
difference <strong>of</strong> 4.7 % was observed between<br />
experimental <strong>and</strong> numerical results for push-out<br />
test specimen SP-3.<br />
Table 2 Numerical <strong>and</strong> experimental results <strong>of</strong> load<br />
capacity for the four specimens<br />
)<br />
25 30 35 40<br />
70 mm), F u<br />
(448.18 MPa = 65 ksi)<br />
70<br />
65<br />
100<br />
20 25 30 35 40<br />
d(15.88 mm), F u<br />
(448.18 MPa = 65 ksi)<br />
The load was applied <strong>in</strong>crementally on the steel<br />
60 90 (b)<br />
90<br />
web, as show <strong>in</strong> figure 3, to small <strong>in</strong>tervals,<br />
55<br />
80<br />
80<br />
where the<br />
50<br />
size <strong>of</strong> such <strong>in</strong>tervals was selected<br />
automatically by ABAQUS, based on the<br />
Q sc-FE<br />
(kN)<br />
45 70<br />
70 100<br />
condition 40<strong>of</strong> numerical 90<br />
60<br />
convergence. In this case,<br />
60<br />
35<br />
80<br />
50<br />
EC-4 (2004)<br />
EC-4 (2004) 50<br />
30<br />
70<br />
AISC<br />
algorithm.<br />
(2005)<br />
The basis <strong>of</strong> this algorithm AISC (2005) is Newton’s<br />
FE<br />
25 40<br />
FE<br />
40 60<br />
method. The displacements <strong>of</strong> the pr<strong>of</strong>ile for each<br />
20<br />
50<br />
20 25 30 35 40<br />
25 30 35load 40 <strong>in</strong>tervals are controlled <strong>in</strong> po<strong>in</strong>t 1 (see figure<br />
f' c<br />
(MPa)<br />
f' c<br />
(MPa)<br />
3).<br />
25 30 35 40<br />
20 25 30 35 40<br />
200 260<br />
260<br />
22 mm), F u<br />
(448.18 MPa = 65 ksi)<br />
240<br />
240<br />
180<br />
Material model<strong>in</strong>g <strong>of</strong> concrete<br />
220 (e)<br />
220<br />
160<br />
The concrete 200 material was modelled consider<strong>in</strong>g 200<br />
a model <strong>of</strong> plastic damage developed by Lubl<strong>in</strong>er<br />
Q sc-FE<br />
(kN)<br />
d(25.4 mm), F u<br />
(448.18 MPa = 65 ksi)<br />
Application <strong>of</strong> load<br />
the load was applied us<strong>in</strong>g the modified RIKS<br />
140<br />
180<br />
180<br />
et al. [6], 120 <strong>and</strong><br />
160<br />
available <strong>in</strong> ABAQUS. This model<br />
160<br />
considers the most important phenomena <strong>of</strong><br />
100 140<br />
140<br />
concrete based on the theoretical pr<strong>in</strong>ciples <strong>of</strong> the<br />
EC-4 (2004)<br />
120<br />
EC-4 (2004)<br />
AISC (2005) 80<br />
LRFD (2005)<br />
Mohr-Coulomb’s modified model.<br />
FE<br />
100<br />
FE<br />
60<br />
25 30 35 40<br />
20 25 30 35 40<br />
100<br />
120<br />
100<br />
Q sc-FE<br />
(kN)<br />
150<br />
140<br />
130<br />
120<br />
110<br />
20 25 30 35 40<br />
d(19.05 mm), F u<br />
(448.18 MPa = 65 ksi)<br />
SP-2<br />
(c)<br />
71.60<br />
140<br />
71.85<br />
130<br />
0.996<br />
SP-3 93.00 88.58 120<br />
1.050<br />
Mean -<br />
90- 1.030<br />
80<br />
EC-4 (2004)<br />
AISC (2005)<br />
FE<br />
20 25 30 35 40<br />
f' c<br />
(MPa)<br />
f' c<br />
(MPa)<br />
Modell<strong>in</strong>g<br />
f' c<br />
(MPa)<br />
<strong>of</strong> the steel<br />
Based on Lam <strong>and</strong> Ellobody [1], Ellobody <strong>and</strong><br />
By us<strong>in</strong>g numerical simulation, a <strong>stud</strong>y about the<br />
5. Codes comparison<br />
Young<br />
<strong>of</strong><br />
[2]<br />
<strong>shear</strong><br />
<strong>and</strong><br />
capacity<br />
Nie <strong>and</strong><br />
for<br />
Cai<br />
headed<br />
[7], for<br />
<strong>shear</strong><br />
the<br />
<strong>stud</strong>s:<br />
model<strong>in</strong>g<br />
effect <strong>of</strong> the cross-section area <strong>of</strong> the <strong>stud</strong> shanks<br />
(a) 12.70 x 65 mm, (b) 15.88<br />
<strong>of</strong> concrete-steel <strong>composite</strong> structures a bil<strong>in</strong>ear<br />
mm, (c) 19.05 x behaviour 100 mm, (d) was 22.22 adopted x 130 for mm, the (e) case 25.40 <strong>of</strong> steel, x 130 based mm<br />
on Von Mises’ criterion.<br />
Verification <strong>of</strong> f<strong>in</strong>ite element model<br />
The <strong>shear</strong> connection capacity per <strong>stud</strong> obta<strong>in</strong>ed<br />
from the tests (Q sc-test<br />
) <strong>and</strong> the f<strong>in</strong>ite element<br />
Spec. Q sc-test<br />
(kN) Q sc-FE<br />
(kN) Q sc-test<br />
/Q sc-FE<br />
SP-1 130.4 125.75 1.037<br />
SP-4 102.00 98.50 1.036<br />
150<br />
110<br />
100<br />
Note: The table shows the load capacity per <strong>stud</strong>.<br />
70<br />
60<br />
Effect <strong>of</strong> concrete<br />
50<br />
<strong>strength</strong> on <strong>stud</strong><br />
<strong>strength</strong><br />
An analysis about the effect <strong>of</strong> concrete <strong>strength</strong><br />
on <strong>stud</strong> <strong>strength</strong> by means <strong>of</strong> numerical simulation<br />
was made <strong>in</strong> [5]. It showed that the capacity<br />
<strong>of</strong> <strong>shear</strong> connection <strong>in</strong>creased when concrete<br />
<strong>strength</strong> <strong>in</strong>creased. That fact is also consistent<br />
with [8].<br />
Effect <strong>of</strong> cross-section area <strong>of</strong> the<br />
<strong>stud</strong> shank <strong>and</strong> steel <strong>strength</strong><br />
on <strong>stud</strong> <strong>strength</strong><br />
<strong>and</strong> the steel <strong>strength</strong> on the <strong>stud</strong> <strong>strength</strong> was<br />
carried out <strong>in</strong> [5]. As the cross-section area is<br />
<strong>in</strong>creased, there is an <strong>in</strong>crease <strong>in</strong> the connections<br />
bear<strong>in</strong>g capacity, described by a l<strong>in</strong>ear tendency.<br />
On the other h<strong>and</strong> the variation <strong>of</strong> the ultimate<br />
tensile <strong>strength</strong> <strong>of</strong> the <strong>stud</strong> have little <strong>in</strong>fluence<br />
upon the connection bear<strong>in</strong>g capacity. Therefore,<br />
this is not a very significant parameter.<br />
97
Rev. Fac. Ing. Univ. Antioquia N.° 63. Junio 2012<br />
Effect <strong>of</strong> the height to diameter ratio<br />
<strong>of</strong> the <strong>stud</strong> on the <strong>stud</strong> <strong>strength</strong><br />
A new factor (α) to reduce <strong>stud</strong> <strong>strength</strong><br />
with h c<br />
/d ratio variation is estimated <strong>in</strong> [9]<br />
by the authors <strong>of</strong> this paper, which considers<br />
the <strong>in</strong>fluence <strong>of</strong> concrete <strong>strength</strong> <strong>and</strong> <strong>stud</strong><br />
diameter variation. The reduction factor (α) is<br />
determ<strong>in</strong>ed for each <strong>stud</strong> diameter from 9.52 to<br />
25.40 mm, accord<strong>in</strong>g to concrete <strong>strength</strong> <strong>and</strong><br />
h c<br />
/d ratio. In table 3 the (α) reduction factor is<br />
explicitly represented.<br />
Table 3 Reduction factor (α)<br />
a h c<br />
/d<br />
d<br />
(mm)<br />
f’ c<br />
(MPa)<br />
2.6 2.8 3 3.2 3.4 3.6 3.8 4 4.2 4.4<br />
20 0.795 0.825 0.855 0.885 0.915 0.946 0.976 1 1 1<br />
9.52<br />
30 0.896 0.915 0.933 0.951 0.970 1 1 1 1 1<br />
40 1 1 1 1 1 1 1 1 1 1<br />
20 0.779 0.810 0.840 0.871 0.900 0.930 0.961 0.986 0.995 1<br />
12.70<br />
30 0.877 0.899 0.920 0.941 0.964 0.993 1 1 1 1<br />
40 0.975 0.983 0.992 1 1 1 1 1 1 1<br />
20 0.764 0.795 0.826 0.856 0.886 0.917 0.947 0.974 0.990 1<br />
15.88<br />
30 0.856 0.881 0.906 0.930 0.955 0.986 1 1 1 1<br />
40 0.951 0.967 0.983 1 1 1 1 1 1 1<br />
20 0.752 0.782 0.811 0.841 0.870 0.899 0.929 0.958 0.987 1<br />
19.05<br />
30 0.840 0.868 0.896 0.924 0.952 0.980 1 1 1 1<br />
40 0.924 0.949 0.975 1 1 1 1 1 1 1<br />
20 0.732 0.765 0.796 0.828 0.859 0.889 0.921 0.952 0.981 1<br />
22.22<br />
30 0.815 0.846 0.877 0.908 0.939 0.971 1 1 1 1<br />
40 0.901 0.934 0.967 1 1 1 1 1 1 1<br />
20 0.717 0.749 0.782 0.814 0.847 0.879 0.912 0.944 0.976 1<br />
25.40<br />
30 0.792 0.826 0.860 0.894 0.928 0.963 0.997 1 1 1<br />
40 0.880 0.919 0.958 0.997 1 1 1 1 1 1<br />
EC-4 0.720 0.760 0.800 0.840 0.880 0.920 0.960 1 1 1<br />
If the (α) value obta<strong>in</strong>ed from the expression<br />
<strong>of</strong> EC-4 that appears <strong>in</strong> the last row <strong>of</strong> table 3<br />
is compared with the value obta<strong>in</strong>ed <strong>in</strong> [9] <strong>and</strong><br />
presented <strong>in</strong> table 3, a substantial difference<br />
is observed, which <strong>in</strong> some cases amounts to<br />
25%.<br />
98
<strong>Behavior</strong> <strong>and</strong> <strong>strength</strong> <strong>of</strong> <strong>welded</strong> <strong>stud</strong> <strong>shear</strong> <strong>connectors</strong> <strong>in</strong> <strong>composite</strong> beam<br />
Effect <strong>of</strong> the longitud<strong>in</strong>al spac<strong>in</strong>g<br />
<strong>of</strong> the <strong>stud</strong>s on <strong>stud</strong> <strong>strength</strong><br />
When the <strong>stud</strong> <strong>connectors</strong> are too close to each<br />
other, the stress <strong>in</strong>duced by the <strong>stud</strong>s overlap <strong>and</strong><br />
the connection bear<strong>in</strong>g capacity decreases. The<br />
<strong>stud</strong> <strong>connectors</strong> calculation methods suggested <strong>in</strong><br />
the <strong>in</strong>ternational codes do not take <strong>in</strong>to account<br />
this effect. A reduction factor (γ) <strong>of</strong> the capacity<br />
<strong>of</strong> <strong>shear</strong> connection was determ<strong>in</strong>ed <strong>in</strong> [9] for<br />
cases when the <strong>connectors</strong> were closed to each<br />
other. In table 4 the reduction factor from 9.52 to<br />
25.40 mm <strong>stud</strong>s diameter is observed, accord<strong>in</strong>g<br />
to concrete <strong>strength</strong> <strong>and</strong> longitud<strong>in</strong>al spac<strong>in</strong>g.<br />
Table 4 Reduction factor (γ)<br />
d<br />
(mm)<br />
Gamma<br />
f’ c<br />
(MPa)<br />
Longitud<strong>in</strong>al spac<strong>in</strong>g<br />
5d 7d 9d 11d 13d 15d 17d 19d 21d 25d<br />
20 0.841 0.891 0.941 0.991 1 1 1 1 1 1<br />
9.52<br />
30 0.894 0.944 0.994 1 1 1 1 1 1 1<br />
40 0.955 0.977 1 1 1 1 1 1 1 1<br />
20 0.789 0.838 0.887 0.936 0.947 0.958 0.973 0.998 1 1<br />
12.70<br />
30 0.865 0.914 0.955 0.972 0.998 1 1 1 1 1<br />
40 0.950 0.970 0.999 1 1 1 1 1 1 1<br />
20 0.728 0.777 0.826 0.875 0.893 0.914 0.939 0.984 1 1<br />
15.88<br />
30 0.814 0.863 0.903 0.930 0.993 1 1 1 1 1<br />
40 0.936 0.957 0.993 1 1 1 1 1 1 1<br />
20 0.708 0.744 0.780 0.816 0.852 0.888 0.924 0.960 0.996 1<br />
19.05<br />
30 0.810 0.848 0.886 0.924 0.962 1 1 1 1 1<br />
40 0.902 0.946 0.990 1 1 1 1 1 1 1<br />
20 0.608 0.657 0.706 0.755 0.785 0.825 0.872 0.923 0.971 1<br />
22.22<br />
30 0.712 0.761 0.798 0.840 0.928 0.938 0.961 0.980 1 1<br />
40 0.827 0.872 0.932 0.940 0.969 0.996 1 1 1 1<br />
20 0.540 0.588 0.636 0.684 0.732 0.780 0.828 0.876 0.924 1<br />
25.40<br />
30 0.628 0.676 0.724 0.772 0.820 0.868 0.916 0.964 1 1<br />
40 0.712 0.768 0.824 0.880 0.936 0.992 1 1 1 1<br />
99
Rev. Fac. Ing. Univ. Antioquia N.° 63. Junio 2012<br />
Correction <strong>of</strong> the ultimate <strong>strength</strong><br />
calculation for 22 <strong>and</strong> 25 mm<br />
diameter <strong>stud</strong>s<br />
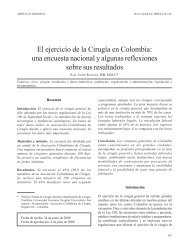
A parametric <strong>stud</strong>y was conducted us<strong>in</strong>g f<strong>in</strong>ite<br />
element models for 12.7 x 65, 15.88 x 80, 19.05<br />
x 100, 22.22 x 130 <strong>and</strong> 25.4 x 130 mm headed<br />
<strong>shear</strong> <strong>stud</strong>s with various concrete <strong>strength</strong> values<br />
<strong>of</strong> 20, 25, 30, 35 <strong>and</strong> 40 MPa. The ultimate tensile<br />
<strong>strength</strong> <strong>of</strong> the <strong>stud</strong>s used was 448.18 MPa. The<br />
results were compared with the calculated values<br />
obta<strong>in</strong>ed from the equations given by AISC [3]<br />
<strong>and</strong> EC-4 [4]. Figure 5 shows graphically the<br />
results <strong>of</strong> this comparison. It is <strong>in</strong>terest<strong>in</strong>g to note<br />
that the result from AISC <strong>in</strong>dicated a much higher<br />
Fig. 4. Mesh diagram a) Stud, b) Slab c) Pr<strong>of</strong>ile<br />
<strong>shear</strong> capacity than the those results obta<strong>in</strong>ed<br />
us<strong>in</strong>g both EC-4 [4] <strong>and</strong> the f<strong>in</strong>ite element<br />
solution analyzed <strong>in</strong> this paper. The equations<br />
given by AISC [3] overestimates the <strong>stud</strong> <strong>strength</strong><br />
<strong>in</strong> all analyzed <strong>stud</strong> <strong>and</strong> concrete <strong>strength</strong> values.<br />
For example, there are differences rang<strong>in</strong>g from<br />
30 % to 60 % for 22.22 mm <strong>and</strong> 25.4 mm <strong>stud</strong>s<br />
<strong>in</strong> all the analyzed concrete <strong>strength</strong> values. On<br />
the other h<strong>and</strong>, the expression given <strong>in</strong> EC-4 [4]<br />
gave a good correlation with the FE solutions<br />
for 12.7, 15.88 <strong>and</strong> 19.05 mm <strong>stud</strong>s; however,<br />
the expression overestimates the <strong>stud</strong> <strong>strength</strong><br />
for 22.22 <strong>and</strong> 25.4 mm diameter <strong>stud</strong>s. These<br />
considerations are <strong>in</strong> accordance with the work <strong>of</strong><br />
Lam <strong>and</strong> Ellobody [1].<br />
70<br />
65<br />
60<br />
20 25 30 35 40<br />
d(12.70 mm), F u<br />
(448.18 MPa = 65 ksi)<br />
(a)<br />
70<br />
65<br />
60<br />
100<br />
90<br />
20 25 30 35 40<br />
d(15.88 mm), F u<br />
(448.18 MPa = 65 ksi)<br />
(b)<br />
100<br />
90<br />
150<br />
140<br />
130<br />
20 25 30 35 40<br />
d(19.05 mm), F u<br />
(448.18 MPa = 65 ksi)<br />
(c)<br />
150<br />
140<br />
130<br />
Q sc-FE<br />
(kN)<br />
Q sc-FE<br />
(kN)<br />
55<br />
50<br />
45<br />
40<br />
35<br />
30<br />
25<br />
20<br />
200<br />
180<br />
160<br />
140<br />
120<br />
EC-4 (2004)<br />
AISC (2005)<br />
FE<br />
20 25 30 35 40<br />
f' c<br />
(MPa)<br />
20 25 30 35 40<br />
d(22.22 mm), F u<br />
(448.18 MPa = 65 ksi)<br />
(d)<br />
55<br />
50<br />
45<br />
40<br />
35<br />
30<br />
25<br />
20<br />
200<br />
180<br />
160<br />
140<br />
120<br />
Q sc-FE<br />
(kN)<br />
Q sc-FE<br />
(kN)<br />
80<br />
70<br />
60<br />
50<br />
40<br />
260<br />
240<br />
220<br />
200<br />
180<br />
160<br />
EC-4 (2004)<br />
AISC (2005)<br />
FE<br />
20 25 30 35 40<br />
f' c<br />
(MPa)<br />
20 25 30 35 40<br />
d(25.4 mm), F u<br />
(448.18 MPa = 65 ksi)<br />
(e)<br />
80<br />
70<br />
60<br />
50<br />
40<br />
260<br />
240<br />
220<br />
200<br />
180<br />
160<br />
Q sc-FE<br />
(kN)<br />
120<br />
110<br />
100<br />
90<br />
80<br />
70<br />
60<br />
50<br />
EC-4 (2004)<br />
AISC (2005)<br />
FE<br />
20 25 30 35 40<br />
f' c<br />
(MPa)<br />
120<br />
110<br />
100<br />
90<br />
80<br />
70<br />
60<br />
50<br />
100<br />
100<br />
140<br />
140<br />
80<br />
60<br />
EC-4 (2004)<br />
AISC (2005)<br />
FE<br />
20 25 30 35 40<br />
f' c<br />
(MPa)<br />
80<br />
60<br />
120<br />
100<br />
EC-4 (2004)<br />
LRFD (2005)<br />
FE<br />
20 25 30 35 40<br />
f' c<br />
(MPa)<br />
120<br />
100<br />
Figure 5 Codes comparison <strong>of</strong> <strong>shear</strong> capacity for headed <strong>shear</strong> <strong>stud</strong>s: (a) 12.70 x 65 mm, (b) 15.88 x 80 mm,<br />
(c) 19.05 Fig. x 5. 100 Codes mm, comparison (d) 22.22 x <strong>of</strong> 130 <strong>shear</strong> mm, capacity (e) 25.40 for x headed 130 mm<strong>shear</strong> <strong>stud</strong>s: (a) 12.70 x 65 mm, (b) 15.88<br />
100<br />
x 80 mm, (c) 19.05 x 100 mm, (d) 22.22 x 130 mm, (e) 25.40 x 130 mm<br />
In order to improve the prediction <strong>of</strong> the <strong>shear</strong><br />
connection capacity <strong>in</strong> 22.22 <strong>and</strong> 25.4 mm <strong>stud</strong>s,<br />
an experimental design [3 x 3 x 3 (3 3 )] was carried<br />
out to determ<strong>in</strong>e which variable comb<strong>in</strong>ations<br />
had greater <strong>in</strong>fluence on the connection bear<strong>in</strong>g<br />
capacity as well as to assess how these variables<br />
affect this property. The factors considered<br />
were: ultimate tensile <strong>strength</strong> <strong>of</strong> steel (F u<br />
), <strong>stud</strong><br />
diameter (d) <strong>and</strong> concrete <strong>strength</strong> (f’ c<br />
). Three<br />
levels were considered for each factor: two
<strong>Behavior</strong> <strong>and</strong> <strong>strength</strong> <strong>of</strong> <strong>welded</strong> <strong>stud</strong> <strong>shear</strong> <strong>connectors</strong> <strong>in</strong> <strong>composite</strong> beam<br />
extreme levels <strong>and</strong> an <strong>in</strong>termediate level. In the<br />
case <strong>of</strong> the diameter, a fictitious <strong>in</strong>termediate level<br />
(fl) was considered even though this diameter is<br />
not commercially available. In order to establish<br />
the range <strong>of</strong> variation <strong>of</strong> the levels <strong>of</strong> the ultimate<br />
tensile <strong>strength</strong> <strong>of</strong> steel, the experimental <strong>stud</strong>ies<br />
<strong>of</strong> Rambo-Roddenberry [10] have been taken as<br />
a reference (see table 5).<br />
Table 5 Variables <strong>and</strong> levels <strong>of</strong> experimental design<br />
Factorial design (3 3 )<br />
Factor<br />
Levels<br />
Ultimate tensile <strong>strength</strong> <strong>of</strong> steel (F u<br />
)<br />
448.18(65) , 499.80, 551.60(80) MPa (ksi)<br />
Stud diameter (d)<br />
22.22(7/8), 23.80 [fl], 25.40(1) mm (<strong>in</strong>)<br />
Concrete <strong>strength</strong> (f’ c<br />
)<br />
20(2900), 30, 40(5800) MPa (psi)<br />
With a configuration similar to the specimen<br />
presented by [1], a simulation, with a previous<br />
calibration, was performed <strong>in</strong> order to determ<strong>in</strong>e<br />
the connection <strong>strength</strong> for each one <strong>of</strong> the<br />
comb<strong>in</strong>ations <strong>in</strong> the experimental design. In<br />
table 6 several comb<strong>in</strong>ations as well as outputs<br />
<strong>of</strong> the numerical simulation are shown. Several<br />
regression analyses were carried out with these<br />
comb<strong>in</strong>ations <strong>and</strong> outputs, us<strong>in</strong>g the statistical<br />
s<strong>of</strong>tware SPSS v-11.5.1. A total <strong>of</strong> 15 statistical<br />
models were analyzed. The models that better<br />
predicted the connection bear<strong>in</strong>g capacity were<br />
selected after analyz<strong>in</strong>g the R 2 coefficient. F<strong>in</strong>ally,<br />
the selected model was the follow<strong>in</strong>g (Eq. 4):<br />
(4)<br />
For design purposes <strong>and</strong> <strong>in</strong> accordance with<br />
current codes <strong>of</strong> practice, the previous expression<br />
is simplified <strong>and</strong> the follow<strong>in</strong>g equation is<br />
obta<strong>in</strong>ed (Eq. 5):<br />
(5)<br />
Table 6 Results <strong>of</strong> each comb<strong>in</strong>ation <strong>in</strong> the experimental design<br />
Specimen<br />
d<br />
(mm)<br />
f’ c<br />
MPa<br />
F u<br />
MPa<br />
Q sc-FE<br />
(kN)<br />
Specimen<br />
d<br />
(mm)<br />
f’ c<br />
MPa<br />
F u<br />
MPa<br />
Q sc- FE<br />
(kN)<br />
P-LM-1 22,2 20 448,18 95,69 P-LM-15 25,4 30 551,60 151,12<br />
P-LM-2 22,2 40 448,18 125,19 P-LM-16 25,4 30 448,18 141,37<br />
P-LM-3 22,2 40 551,60 145,36 P-LM-17 22,2 30 448,18 113,86<br />
P-LM-4 22,2 20 551,60 101,77 P-LM-18 22,2 30 551,60 131,28<br />
P-LM-5 25,4 20 448,18 110,55 P-LM-19 22,2 40 499,80 135,39<br />
P-LM-6 25,4 20 551,60 120,26 P-LM-20 22,2 20 499,80 99,14<br />
P-LM-7 25,4 40 551,60 180,50 P-LM-21 25,4 30 499,80 147,14<br />
P-LM-8 25,4 40 448,18 162,83 P-LM-22 23,8 40 499,80 152,02<br />
P-LM-9 23,8 40 551,60 161,49 P-LM-23 22,2 30 499,80 119,24<br />
P-LM-10 23,8 40 448,18 139,94 P-LM-24 23,8 20 499,80 105,30<br />
P-LM-11 23,8 20 448,18 102,44 P-LM-25 23,8 30 551,60 142,08<br />
101
Rev. Fac. Ing. Univ. Antioquia N.° 63. Junio 2012<br />
Specimen<br />
d<br />
(mm)<br />
f’ c<br />
MPa<br />
F u<br />
MPa<br />
Q sc-FE<br />
(kN)<br />
Specimen<br />
d<br />
(mm)<br />
f’ c<br />
MPa<br />
F u<br />
MPa<br />
Q sc- FE<br />
(kN)<br />
P-LM-12 23,8 20 551,60 107,57 P-LM-26 23,8 30 448,18 127,10<br />
P-LM-13 25,4 40 499,80 174,48 P-LM-27 23,8 30 499,80 132,24<br />
P-LM-14 25,4 20 499,80 115,50 Note: E c<br />
is estimated accord<strong>in</strong>g to ACI-318 (2005)<br />
Figure 6 shows the results <strong>of</strong> the predictions us<strong>in</strong>g<br />
the <strong>stud</strong>ied codes, Eq. 5 <strong>and</strong> the FE solution. It is<br />
possible to see how Eq. (5) <strong>of</strong>fers <strong>stud</strong> <strong>strength</strong><br />
values which are more conservative than those<br />
<strong>of</strong> the American Specification <strong>and</strong> the European<br />
Code.<br />
300<br />
280<br />
260<br />
240<br />
220<br />
200<br />
180<br />
160<br />
140<br />
120<br />
100<br />
80<br />
80 100 120 140 160 180 200 220 240 260 280 300<br />
300<br />
280<br />
260<br />
240<br />
220<br />
conservative<br />
200<br />
180<br />
160<br />
140<br />
120<br />
unconservative<br />
100<br />
80<br />
80 100 120 140 160 180 200 220 240 260 280 300<br />
Figure 6 Prediction by the <strong>stud</strong>ied codes <strong>and</strong> the Eq.<br />
(5) aga<strong>in</strong>st FE solution<br />
New expression for calculat<strong>in</strong>g the <strong>shear</strong><br />
connection capacity<br />
By <strong>in</strong>troduc<strong>in</strong>g the α <strong>and</strong> γ reduction factors <strong>in</strong><br />
Eq. 5, as well as a new β factor for 22.22 mm<br />
<strong>and</strong> 25.4 mm <strong>stud</strong>s, the follow<strong>in</strong>g expression is<br />
obta<strong>in</strong>ed:<br />
(6)<br />
where α is <strong>in</strong> function <strong>of</strong> the (h c<br />
/d) ratio (see<br />
tab. 3), β is 0.37 for d 19.05 mm, <strong>and</strong> 0.32 for<br />
19.05 ˂ d 25.40 mm, γ is <strong>in</strong> function <strong>of</strong> the<br />
longitud<strong>in</strong>al spac<strong>in</strong>g (see tab. 4); A sc<br />
is expressed<br />
<strong>in</strong> m 2 ; f’ c<br />
, E c<br />
<strong>and</strong> F u<br />
are expressed <strong>in</strong> MPa.<br />
Table 7 shows a comparison <strong>of</strong> the capacities <strong>of</strong><br />
<strong>shear</strong> connection obta<strong>in</strong>ed from the f<strong>in</strong>ite element<br />
solution, the EC-4 [4] <strong>and</strong> the new expression (Eq.<br />
6). The effect <strong>of</strong> the h c<br />
/d ratio on the prediction<br />
<strong>of</strong> the <strong>stud</strong> <strong>strength</strong> is taken <strong>in</strong>to account. It is<br />
possible to see that the new expression <strong>of</strong>fers the<br />
better predictions with a Q sc-FE<br />
/Q sc-NE<br />
ratio mean<br />
value <strong>of</strong> 1.086 <strong>and</strong> the correspond<strong>in</strong>g coefficient<br />
<strong>of</strong> variation <strong>of</strong> 0.088. In this analysis the effect <strong>of</strong><br />
the longitud<strong>in</strong>al spac<strong>in</strong>g between <strong>connectors</strong> on<br />
<strong>stud</strong> <strong>strength</strong> is not considered, therefore γ = 1.<br />
Table 7 Effect <strong>of</strong> the hc/d ratio on the <strong>stud</strong> <strong>strength</strong><br />
102<br />
F u<br />
(MPa)<br />
f’ c<br />
(MPa)<br />
d<br />
(mm)<br />
h c<br />
/d<br />
Q sc-FE<br />
(kN)<br />
Q sc-EC-4<br />
(kN)<br />
Q sc-NE<br />
(kN)<br />
Q sc-FE<br />
/ Q sc-FE<br />
/<br />
Q sc-EC-4<br />
Q sc-NE<br />
448.18 30 19.05 2.62 84.84 67.80 78.94 1.251 1.075<br />
448.18 30 19.05 3.00 88.68 74.92 83.91 1.184 1.057<br />
500.00 40 19.05 3.20 112.50 97.62 116.21 1.152 0.968<br />
500.00 20 9.52 2.60 17.50 12.43 13.73 1.408 1.274<br />
551.60 40 9.52 2.60 28.78 20.92 29.05 1.376 0.991
<strong>Behavior</strong> <strong>and</strong> <strong>strength</strong> <strong>of</strong> <strong>welded</strong> <strong>stud</strong> <strong>shear</strong> <strong>connectors</strong> <strong>in</strong> <strong>composite</strong> beam<br />
F u<br />
(MPa)<br />
f’ c<br />
(MPa)<br />
d<br />
(mm)<br />
h c<br />
/d<br />
Q sc-FE<br />
(kN)<br />
Q sc-EC-4<br />
(kN)<br />
Q sc-NE<br />
(kN)<br />
Q sc-FE<br />
/ Q sc-FE<br />
/<br />
Q sc-EC-4<br />
Q sc-NE<br />
551.60 30 9.52 2.80 23.51 17.79 21.42 1.322 1.098<br />
551.60 35 25.40 3.20 164.01 157.00 152.84 1.045 1.073<br />
500.00 20 25.40 4.00 116.25 122.84 100.51 0.946 1.156<br />
Mean - - - - - - 1.211 1.086<br />
COV - - - - - - 0.133 0.088<br />
It is worth po<strong>in</strong>t<strong>in</strong>g out that <strong>in</strong> the new expression<br />
a new reduction factor was <strong>in</strong>troduced so as to<br />
take <strong>in</strong>to account the effect <strong>of</strong> the longitud<strong>in</strong>al<br />
spac<strong>in</strong>g on the connection bear<strong>in</strong>g capacity,<br />
which causes the calculation procedure to be<br />
iterative. In the first iteration, the longitud<strong>in</strong>al<br />
spac<strong>in</strong>g is not known, <strong>and</strong> γ=1 should be<br />
considered. The iterative process is stopped<br />
when <strong>in</strong> the last iteration there is not observable<br />
difference between the longitud<strong>in</strong>al spac<strong>in</strong>g<br />
obta<strong>in</strong>ed <strong>in</strong> the previous iteration <strong>and</strong> the current<br />
iteration. Accord<strong>in</strong>gly, the amount <strong>of</strong> <strong>connectors</strong><br />
calculated <strong>in</strong> each iteration should be distributed<br />
<strong>in</strong> the <strong>composite</strong> beam.<br />
Table 8 shows a comparison <strong>of</strong> the connection<br />
bear<strong>in</strong>g capacity obta<strong>in</strong>ed from the f<strong>in</strong>ite element<br />
solution, the AISC [3], the EC-4 [4] <strong>and</strong> the<br />
new expression (Eq. 6). In this case the effect<br />
<strong>of</strong> the longitud<strong>in</strong>al spac<strong>in</strong>g on the <strong>stud</strong> <strong>strength</strong><br />
prediction is taken <strong>in</strong>to account. In this analysis,<br />
the new expression also <strong>of</strong>fers better predictions<br />
with a Q sc-FE<br />
/Q sc-NE<br />
ratio mean value <strong>of</strong> 1.101 <strong>and</strong><br />
the correspond<strong>in</strong>g coefficient <strong>of</strong> variation <strong>of</strong> 0.066.<br />
Table 8 Effect <strong>of</strong> the longitud<strong>in</strong>al spac<strong>in</strong>g on the <strong>stud</strong> <strong>strength</strong><br />
F u<br />
(MPa)<br />
f’ c<br />
(MPa)<br />
d x h c<br />
(mm)<br />
Sp.<br />
Q sc-FE<br />
(kN)<br />
Q sc-FE<br />
/ Q sc-FE<br />
/ Q sc-FE<br />
/<br />
Q sc-EC-4<br />
Q sc-AISC<br />
Q sc-NE<br />
448.18 20 19.05x100 7d 60.41 0.874 0.647 1.175<br />
448.18 30 19.05x100 7d 84.19 0.899 0.665 1.060<br />
500.00 20 19.05x100 5d 56.38 0.816 0.604 1.152<br />
448.18 30 9.52x50 9d 25.03 1.070 0.792 1.077<br />
551.60 40 9.52x50 7d 28.43 0.979 0.724 1.002<br />
500.00 20 25.40x125 9d 81.15 0.661 0.489 1.201<br />
551.60 30 25.40x125 9d 116.35 0.699 0.517 1.116<br />
500.00 40 25.40x125 11d 160.50 0.792 0.633 1.021<br />
Mean - - - - 0.849 0.634 1.101<br />
COV - - - - 0.161 0.158 0.066<br />
103
Rev. Fac. Ing. Univ. Antioquia N.° 63. Junio 2012<br />
Conclusions<br />
Accurate nonl<strong>in</strong>ear f<strong>in</strong>ite element models have<br />
been developed to <strong>in</strong>vestigate the behaviour <strong>of</strong><br />
<strong>shear</strong> connection <strong>in</strong> solid slab <strong>composite</strong> beams.<br />
The models take <strong>in</strong>to account the nonl<strong>in</strong>ear<br />
material properties <strong>of</strong> concrete, steel beams<br />
<strong>and</strong> headed <strong>stud</strong> <strong>shear</strong> <strong>connectors</strong>. The <strong>shear</strong><br />
connection capacity <strong>and</strong> the load-slip behaviour<br />
<strong>of</strong> headed <strong>stud</strong> were predicted from the f<strong>in</strong>ite<br />
element analysis, <strong>and</strong> the results were compared<br />
with experimental results. The parametric <strong>stud</strong>y<br />
showed that the expression given <strong>in</strong> EC-4 [4]<br />
produced better results when compared with FE<br />
results, while it would appear that the AISC [3]<br />
might have overestimated the <strong>shear</strong> connection<br />
capacity. Furthermore, all the codes seem to<br />
overestimate the <strong>shear</strong> capacity <strong>of</strong> the 22.22 <strong>and</strong><br />
25.4 mm diameter headed <strong>stud</strong>s.<br />
A modification <strong>of</strong> the expression given <strong>in</strong> EC-4<br />
is proposed <strong>in</strong> this work. The constant 0.37 <strong>of</strong><br />
the equation was changed to 0.32 for 22.22 <strong>and</strong><br />
25.4 mm diameter headed <strong>stud</strong>s. A new reduction<br />
factor (γ) was <strong>in</strong>troduced <strong>in</strong> order to consider the<br />
effect <strong>of</strong> the proximity <strong>of</strong> the <strong>stud</strong> <strong>connectors</strong>,<br />
<strong>and</strong> the reduction factor proposed by the EC-4 to<br />
consider the h c<br />
/d ratio was also modified.<br />
The comparison <strong>of</strong> the <strong>shear</strong> connection capacity<br />
obta<strong>in</strong>ed from the f<strong>in</strong>ite element analysis, the<br />
new expression <strong>and</strong> the design rules specified<br />
by the American Specification <strong>and</strong> the European<br />
Code have shown that the new expression (Eq.<br />
6) produced better results with a good correlation<br />
with the f<strong>in</strong>ite element analysis.<br />
References<br />
1. D. Lam, E. Ellobody. “<strong>Behavior</strong> <strong>of</strong> Headed Stud<br />
Shear Connectors <strong>in</strong> Composite Beam”. Journal <strong>of</strong><br />
Structural Eng<strong>in</strong>eer<strong>in</strong>g, ASCE. Vol. 131. 1. 2005. pp.<br />
96-107.<br />
2. E. Ellobody, B. Young. “Performance <strong>of</strong> <strong>shear</strong><br />
connection <strong>in</strong> <strong>composite</strong> beams with pr<strong>of</strong>iled steel<br />
sheet<strong>in</strong>g”. Journal <strong>of</strong> Constructional Steel Research.<br />
Vol. 62. 2006. pp. 682-694.<br />
3. AISC. Load <strong>and</strong> resistance factor design specification<br />
for structural steel build<strong>in</strong>g. American Institute <strong>of</strong><br />
Steel Construction. Chicago (USA). 2005. pp. 20-80.<br />
4. Eurocode 4 (EN 1994-1-1). Des<strong>in</strong>g <strong>of</strong> Composite Steel<br />
<strong>and</strong> Concrete Structures. European Committee for<br />
St<strong>and</strong>ardization. Part 1.1(2004). Brussels, Belgium.<br />
2004. pp. 14-89.<br />
5. J. Bonilla. E<strong>stud</strong>io del comportamiento de<br />
conectadores tipo perno de estructuras compuestas<br />
de hormigón y acero mediante modelación numérica.<br />
Tesis de Doctorado. Universidad Central de Las Villas.<br />
Sta Clara, Cuba. 2008. pp. 46-125.<br />
6. J. Lubl<strong>in</strong>er, J. Oliver, S. Oller, E. Oñate. “A Plastic-<br />
Damage Model for Concrete”. International Journal<br />
<strong>of</strong> Solids <strong>and</strong> Structures. Vol. 25. 1989. pp. 229-326.<br />
7. J. Nie, C. Cai. “Steel-Make specific Composite Beams<br />
Consider<strong>in</strong>g Shear Slip Effects”. Journal <strong>of</strong> Structural<br />
Eng<strong>in</strong>eer<strong>in</strong>g. Vol. 129. 2004. pp. 495-506.<br />
8. J. Ollgaard, R. Slutter, J. Fisher. “Shear Strength <strong>of</strong><br />
Stud Connectors <strong>in</strong> Lightweight <strong>and</strong> Normal-Weight<br />
Concrete”. Eng<strong>in</strong>eer<strong>in</strong>g Journal, AISC. Vol. 8. 1971.<br />
pp. 55-64.<br />
9. J. Bonilla, R. Larrúa, C. Recarey, E. Mirambell.<br />
“Corrección del cálculo de la capacidad resistente<br />
última de conectadores tipo perno de estructuras<br />
mixtas en la tipología de viga-losa maciza”. Revista<br />
Ingeniería Civil, CEDEX. No. 155. 2009. pp. 127-142.<br />
10. M. Rambo. <strong>Behavior</strong> <strong>and</strong> Strength <strong>of</strong> Welded Stud<br />
Shear Connectors. Ph. D. Thesis. University <strong>of</strong><br />
Blacksburg. Virg<strong>in</strong>ia, EE.UU. 2002. pp. 75-120.<br />
104