Where Is It Windy? - KidWind
Where Is It Windy? - KidWind
Where Is It Windy? - KidWind

You also want an ePaper? Increase the reach of your titles
YUMPU automatically turns print PDFs into web optimized ePapers that Google loves.
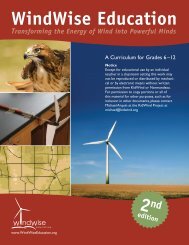
WindWise Education<br />
Transforming the Energy of Wind into Powerful Minds<br />
A Curriculum for Grades 6 –12<br />
Notice<br />
Except for educational use by an individual<br />
teacher in a classroom setting this work may<br />
not be reproduced or distributed by mechanical<br />
or by electronic means without written<br />
permission from <strong>KidWind</strong> or Normandeau.<br />
For permission to copy portions or all of<br />
this material for other purposes, such as for<br />
inclusion in other documents, please contact<br />
Michael Arquin at the <strong>KidWind</strong> Project at<br />
michael@kidwind.org<br />
2 nd<br />
edition<br />
www.WindWiseEducation.org
WindWise Education was developed with<br />
funding from the New York State Energy<br />
Research & Development Authority<br />
Updates to Lessons 3 & 5 and the addition of<br />
Lesson 16 were funded by the Department<br />
of Energy: subcontract No. AFT-1-40657-01 V2.0
LESSON<br />
5<br />
WHERE IS<br />
IT WINDY?<br />
WIND<br />
KEY CONCEPT<br />
Students learn how<br />
topography and elevation<br />
affect wind speeds and<br />
will identify optimal<br />
locations for wind farms<br />
based on wind speed.<br />
TIME REQUIRED<br />
1–2 class periods<br />
GRADES<br />
6–8<br />
9–12<br />
BACKGROUND<br />
Wind turbines produce more power at higher wind speeds than at lower wind<br />
speeds. This lesson helps students understand how topography and elevation<br />
affect wind speed. Students analyze maps and make predictions on where wind<br />
farms may be located based on regional topography.<br />
OBJECTIVES<br />
At the end of the lesson, students will:<br />
n understand how topography and elevation affect wind speed<br />
n be able to identify optimal locations for wind farms based on wind speed<br />
n know how to interpret topographic and wind speed maps<br />
METHOD<br />
Students will create a three-dimensional landscape and identify where it is windy<br />
in relation to the topography, using a box fan and wind flags. Students will then<br />
examine a topographic map of the US and predict the optimal locations for wind<br />
farms. Students will compare their predictions with the actual wind speeds and<br />
wind farm locations.<br />
SUBJECTS<br />
Earth Science<br />
Social Studies<br />
MATERIALS<br />
❑ Box fan (more than one is better)<br />
❑ Objects of different sizes that will not blow away<br />
❑ 20 wind flags for the model. (Tape some string or tissue paper to a popsicle<br />
stick and place it in a piece of clay to hold it up.)<br />
❑ US Elevation and Shaded Relief Map*<br />
❑ US Wind Resource Map*<br />
❑ Utility Scale Wind Turbines in United States Map*<br />
❑ Overhead projector (if available)<br />
❑ Student Worksheets*<br />
*included with this activity<br />
www.WindWiseEducation.org<br />
107
WHERE IS IT WINDY?<br />
WIND FLAGS<br />
GETTING READY<br />
n<br />
n<br />
n<br />
n<br />
n<br />
Collect materials for creating the topography. For example, books,<br />
backpacks, blankets or weighted boxes can be stacked to create mountains<br />
and valleys.<br />
Make 20 “wind flags.” (You could have students do this, as well.)<br />
Make a copy of the US Elevation and Shaded Relief Map and worksheet for<br />
each student.<br />
Make a transparency of all maps or prepare to project them from a<br />
computer to use for class discussion. Maps can also be found on the<br />
“<strong>Where</strong> is it <strong>Windy</strong>?” activity page of the WindWise website.<br />
If you have access to a color copier, print wind maps.<br />
ACTIVITY<br />
Tie tissue or string to a<br />
popsicle stick and stick it in a<br />
piece of clay to make a simple<br />
wind flag.<br />
Step 1: Beginning questions for students<br />
n <strong>Where</strong> do you typically find wind?<br />
n <strong>Where</strong> is it often calm?<br />
n <strong>Where</strong> would you go to fly a kite?<br />
n What geographical features influence the speed of the wind?<br />
n Do we have wind farms in our state? If so, where are they located?<br />
n <strong>Is</strong> it windier in a forest or a field? On a hill or in a valley?<br />
n What parts of the US have the “best” wind for energy production?<br />
Guide students to consider how beaches or open areas such as fields may have<br />
more wind than an area with many buildings or trees. Help them extrapolate<br />
their local understanding of where it is windy to a regional or national level<br />
where larger topographical features come into play, such as mountains or<br />
coastlines.<br />
Step 2: Create a model landscape and wind farm<br />
Using various objects around the classroom, tell students to create a model<br />
landscape. Students can use notebooks, textbooks, backpacks, weighted boxes,<br />
etc. Help students think about creating a variety of landscape features, such as<br />
a mountain range, rolling hills, valleys, plateaus, and open areas.<br />
WindWiseEducation.org<br />
Tell students to create a wind farm by placing the wind flags where they think<br />
they will get the most wind. Number the flags so you can easily track them on<br />
your worksheet. Place the box fan next to the landscape and turn it on. Ask<br />
students to record which wind flags are blowing and at what height they are<br />
blowing.. Reposition the fan and again record which flags are blowing. Are<br />
there some flags that always move and others that never move? Discuss the<br />
role that landscape plays in wind patterns.<br />
Step 3: Analyze a state elevation map<br />
Give each student a topographic map of the US and discuss how to read it by<br />
showing high and low points on a projected version of the map. Ask students<br />
to predict where they feel there is the most wind by shading in these areas.<br />
108 Lesson 5
WHERE IS IT WINDY?<br />
Step 4: Compare predictions to data<br />
Using a computer or overhead, project the US Wind Resource Map for<br />
students and ask them to compare their predictions with this map. Pass out<br />
maps if you can. Were students’ predictions similar to the actual wind speeds?<br />
Step 5: <strong>Where</strong> are the wind farms in the US?<br />
Overlay a transparency of Utility Scale Wind Turbines in United States Map<br />
with the US Wind Resource Map. Distribute copies of the maps if you can. Ask<br />
students to look for relationships among this map and the topographical and<br />
wind speed maps and answer the questions on the worksheet.<br />
Step 6: Wrap up<br />
Use the following questions to discuss the relationships among wind speed,<br />
elevation, and wind energy.<br />
n <strong>Where</strong> are the windiest areas?<br />
n Are there any trends? If so, what trends do you notice?<br />
n How do wind speeds change as elevation increases?<br />
n Why do you think this is the case?<br />
n <strong>Where</strong> do you think the most desirable areas for wind farms are?<br />
n Why do you think utility scale wind farms are located where they are?<br />
n What role do you think elevation plays in the height of turbines? <strong>Where</strong><br />
are the wind farms in the US?<br />
n Are turbines always in the windiest spots? Why or why not?<br />
Another way to visualize<br />
wind flow in a miniature<br />
landscape is to use a bubble<br />
gun and blow the bubbles<br />
through the landscape. If<br />
you watch closely, you will<br />
see eddys where bubbles get<br />
caught and where the flow is<br />
the fastest. Give it a try! <strong>It</strong><br />
can be lots of fun!<br />
EXTENSION<br />
n<br />
n<br />
Ask students to examine a topographic map of the US and make<br />
predictions about wind speed and wind farm locations. Compare their<br />
predictions to real data. Use some of the web resources from the end of<br />
this lesson.<br />
Tell students to create a scale drawing of their topography.<br />
WindWiseEducation.org<br />
Lesson 5<br />
109
WHERE IS IT WINDY?<br />
VOCABULARY<br />
anemometer – An instrument that measures wind speed<br />
convection – Air movement due to density differences as heated air rises and<br />
is replaced by cooler air.<br />
Coriolis effect – The Earth’s rotation causes the wind to flow in a curved path<br />
rather than a straight line.<br />
pressure gradient force – The difference in air pressure that causes air<br />
molecules to move causing wind<br />
surface roughness – A measure of surface texture. Trees, houses and other<br />
obstacles increase roughness, causing the wind to become more turbulent.<br />
topography – The study and mapping of the shape of surface features of the<br />
Earth such as mountains, valleys, rivers, and lakes<br />
turbulence – An irregular or unstable movement of a gas or liquid<br />
wind speed – The rate at which air is moving horizontally past a given point<br />
wind speed units – Wind speed is measured in meters/second (m/s) or miles<br />
per hour (mph). 1 m/s = 2.24 mph.<br />
RELATED ACTIVITIES<br />
n<br />
Lesson 4: What Causes Wind?<br />
ADDITIONAL RESOURCES<br />
FIRSTLOOK—http://kwind.me/g6n—Useful tool with free registration<br />
NCDC—http://kwind.me/u8b—NOAA Satellite website has a list of the<br />
windiest locations in the US.<br />
US DEPARTMENT OF ENERGY— http://kwind.me/n2z—Wind resource<br />
maps for some states as well as the entire US.<br />
WIND ENERGY RESOURCE ATLAS—http://kwind.me/c2o<br />
WindWiseEducation.org<br />
WIND POWERING AMERICA STATE MAPS—http://kwind.me/x2p— 80 m<br />
wind maps and wind resource potential<br />
WINDPOWERMAPS.ORG—http://kwind.me/g8u—This site has maps of wind<br />
energy potential for some states.<br />
110 Lesson 5
<strong>Where</strong> is it <strong>Windy</strong>?<br />
US WIND RESOURCE MAP<br />
111 WindWiseEducation.org<br />
Lesson 5
<strong>Where</strong> is it <strong>Windy</strong>?<br />
US ELEVATION AND SHADED RELIEF MAP<br />
112 WindWiseEducation.org<br />
Lesson 5
<strong>Where</strong> is it <strong>Windy</strong>?<br />
MAP OF UTILITY SCALE WIND TURBINES IN UNITED STATES<br />
0 500 1000 km<br />
wind turbine<br />
county boundaries<br />
0 turbines<br />
1 − 55 turbines<br />
55 − 101 turbines<br />
101 − 160 turbines<br />
160 − 601 turbines<br />
601 − 1398 turbines<br />
0 100 200 km<br />
0 200 400 km<br />
Map projection: Albers Equal Area<br />
Data source: Turbine location data derived by<br />
<strong>KidWind</strong> from DOF data from the FAA.<br />
7/2011<br />
113 WindWiseEducation.org<br />
Lesson 5
<strong>Where</strong> is it <strong>Windy</strong>?<br />
Student sheets<br />
READING PASSAGE<br />
Wind is the result of air moving from areas<br />
of high pressure to areas of low pressure. Air<br />
pressure changes are created by the uneven<br />
heating of the Earth. As parts of the Earth heat<br />
up, the air heats up, becomes less dense, and<br />
rises. As the hot air rises (convection), cooler<br />
air moves in, creating a breeze. This pressure<br />
difference, which causes wind, is called the<br />
pressure gradient force.<br />
A number of factors determine the speed<br />
and direction of wind. Some factors, like the<br />
rotation of the Earth, create large-scale wind<br />
patterns, while other factors, such as the<br />
30.3 30.1<br />
type of landscape, only affect local wind speeds. Wind developers may look at large-scale wind patterns<br />
to determine in what region to place a wind farm. When determining an exact location for the turbines,<br />
however, the wind developer collects years of wind data from proposed turbine locations.<br />
Earth’s Rotation<br />
While wind is the movement of air from high to low pressure areas, the wind does not actually move in a<br />
straight line. Why not? The Earth’s rotation actually causes the wind to flow in a curved path rather than<br />
a straight line. This is known as the Coriolis effect. The winds in the Northern Hemisphere turn to the<br />
right and the winds in the Southern Hemisphere turn to the left. The effect is zero at the equator. Find an<br />
animation of how the Coriolis effect impacts wind direction at: http://kwind.me/w9o<br />
Surface Roughness<br />
Rough landscape surfaces tend to slow wind speeds, while smooth surfaces allow for higher wind speeds.<br />
For instance, a forested area creates more friction for moving air, resulting in slower wind speeds than<br />
a prairie. This is called surface roughness and can be defined according to different classes. An open sea<br />
provides very little friction for air<br />
and would be a class 0, whereas<br />
a large city with skyscrapers is a<br />
class 4. When siting a wind farm,<br />
it’s important to look at the<br />
surrounding area to determine<br />
how the surface roughness will<br />
alter the local wind speeds.<br />
30.0<br />
30.3<br />
30.1<br />
30.5<br />
30.0<br />
30.1<br />
H<br />
30.3<br />
Obstruction of the Wind by a Building<br />
or Tree of Height (H)<br />
30.3<br />
30.129.9<br />
29.7 29.7<br />
29.6<br />
L<br />
29.9<br />
29.9<br />
30.1<br />
30.1<br />
Wind<br />
H<br />
Region of<br />
highly<br />
turbulent<br />
flow<br />
2 H<br />
Lesson 5<br />
2 H 20 H<br />
WindWiseEducation.org<br />
115
<strong>Where</strong> is it <strong>Windy</strong>?<br />
Student sheets<br />
Topography<br />
Topography can impact wind speeds in two ways. First, land masses tend to heat up more quickly than<br />
oceans during the day. This results in warm air above the land rising and cooler air from the water<br />
blowing toward the land, creating “ocean breezes.” A second impact of topography is natural or manmade<br />
obstacles that can block air movement. For example, a mountain range is an obstacle that winds have to<br />
move around. This can increase the wind speed in some areas while reducing it in others. Obstacles can<br />
also create turbulence in the air movement. Turbulence happens when the air moves irregularly, which<br />
creates the bumps you sometimes experience on an airplane flying over a thunderstorm or mountain.<br />
Elevation<br />
Wind speeds generally increase with elevation. As elevation increases, there are typically fewer obstacles,<br />
allowing wind to blow at faster speeds. Also, the friction with the Earth is reduced higher above the<br />
ground, so wind moves faster. Over time, engineers have designed turbines to be taller so that they can<br />
capture these faster winds.<br />
CAREER PROFILE: ROLF MILLER, TECHNICAL CONSULTING SERVICES<br />
MANAGER<br />
I am a Technical Consulting Services Manager for a wind resource assessment<br />
and wind energy forecasting company. We provide wind farm developers,<br />
financiers, and utilities with highly accurate estimates of how much clean,<br />
renewable energy a wind farm will produce. In my current role, I work with a<br />
team of meteorologists and analysts to gather data from a variety of sources and<br />
help our customers understand how the weather will affect their wind farm.<br />
As with many in the wind industry, I did not start out here. My undergraduate<br />
degree is in geology. At school, I wanted to meld the power of computers<br />
with studying natural systems. Geology had the irresistible appeal of working<br />
outdoors and a wide variety of things to study—fossils, plate tectonics, and<br />
mineral structures. For my senior thesis, I compiled a database of rock samples<br />
and mapped them with some of the earliest versions of geographic information<br />
system (GIS) software. I still use GIS software on a regular basis.<br />
After school, I worked as a groundwater scientist for a consulting company, where I compiled one of the<br />
largest groundwater chemistry databases of its kind at the time. I also became interested in groundwater<br />
modeling, which uses computers to simulate the flow of water in the ground. <strong>It</strong> can predict where<br />
contaminants in the groundwater are likely to flow. I liked it so much that I enrolled in graduate school,<br />
where I studied groundwater flow.<br />
Over time, I have held many jobs for the company, including research scientist, software designer,<br />
programmer, manager, and salesperson. My current job is exciting because I can help our customers solve<br />
challenging problems that also have significant financial impacts. My motivation is providing customers with<br />
valuable information that results in well-designed and efficient wind farms.<br />
116 WindWiseEducation.org<br />
Lesson 5
<strong>Where</strong> is it <strong>Windy</strong>?<br />
Student sheets<br />
Name Date Class<br />
WHERE IS IT WINDY?<br />
Model Landscape and Wind Farm<br />
1. Place a check under the appropriate angle for each flag in the model landscape.<br />
FLAG<br />
1<br />
2<br />
3<br />
4<br />
5<br />
6<br />
7<br />
8<br />
9<br />
10<br />
11<br />
12<br />
13<br />
14<br />
15<br />
16<br />
17<br />
18<br />
19<br />
20<br />
TRIAL 1 TRIAL 2<br />
2. Were there some flags that never received any wind? If so, where were they located in the landscape?<br />
3. Were there some flags that always received a lot of wind? If so, where were they located in the<br />
landscape?<br />
Lesson 5<br />
WindWiseEducation.org<br />
117
<strong>Where</strong> is it <strong>Windy</strong>?<br />
Student sheets<br />
4. Why do you think some flags received a lot of wind and others not as much?<br />
WIND IN THE UNITED STATES<br />
<strong>Where</strong> are the highest wind speeds in the United States?<br />
Using the elevation map of the US, shade the areas that you believe might have the highest wind speeds.<br />
Were your predictions correct?<br />
Compare your predictions to the US Wind Resource Map.<br />
1. Are your predictions similar to the actual wind speeds?<br />
What happens to the wind speed as you go higher in the atmosphere?<br />
2. How do wind speeds change as elevation increases?<br />
3. Why do you think this happens?<br />
118 WindWiseEducation.org<br />
Lesson 5
<strong>Where</strong> is it <strong>Windy</strong>?<br />
Student sheets<br />
4. What role do you think elevation plays in the engineering design of turbines?<br />
<strong>Where</strong> are the wind farms in the United States?<br />
Compare elevation and wind speed maps with the map of Utility Scale Wind Turbines in United States.<br />
1. What is the wind speed and topography of the wind farm locations in the US?<br />
2. Why do you think these locations were selected as opposed to areas where wind speed is the highest?<br />
Lesson 5<br />
WindWiseEducation.org<br />
119
<strong>Where</strong> is it <strong>Windy</strong>?<br />
Answer sheets<br />
1. Place a check under the appropriate angle for each flag in the model landscape.<br />
Student observation<br />
2. Were there some flags that never received any wind? If so, where were they located in the landscape?<br />
Student observation<br />
3. Were there some flags that always received a lot of wind? If so, where were they located in the<br />
landscape?<br />
Student observation<br />
4. Why do you think some flags received a lot of wind and others not as much?<br />
Landscape features can get in the way of the path of wind. In nature, wind speeds increase as elevation<br />
increases.<br />
WIND IN THE UNITED STATES<br />
<strong>Where</strong> are the highest wind speeds in the United States?<br />
Using the elevation map of the United States, shade the areas that you think might have the most wind.<br />
Were your predictions correct?<br />
Compare your predictions to the US Wind Resource Map.<br />
1. Are your predictions similar to the actual wind speeds?<br />
Answers will vary depending on student’s predictions.<br />
What happens to the wind speed as you go higher in the atmosphere?<br />
2. How do wind speeds change as elevation increases?<br />
The wind speed increases with elevation.<br />
3. Why do you think this happens?<br />
There are fewer obstructions as elevation increases.<br />
5. What role do you think elevation plays in the engineering design of turbines?<br />
Over time, engineers have increased the height of turbines to access the higher wind speeds. With this<br />
increase in elevation, engineers have had to consider other issues, such as transportation of the wind<br />
turbine parts and the potential impacts on wildlife.<br />
<strong>Where</strong> are the wind farms in the United States?<br />
Compare topography and wind speed maps with the map of Utility Scale Wind Turbines in United States.<br />
1. What is the wind speed and topography of the wind farm locations in the US?<br />
See the map.<br />
2. Why do you think these locations were selected as opposed to areas where wind speed is the highest.<br />
Sites are typically selected for a number of reasons: proximity to population centers (closer proximity means<br />
less loss due to transmission), land availability, and ability to get the project approved in a cost-effective way.<br />
120 WindWiseEducation.org<br />
Lesson 5