Evaluating Potential Rice Varieties from University and Industry ...
Evaluating Potential Rice Varieties from University and Industry ...
Evaluating Potential Rice Varieties from University and Industry ...

You also want an ePaper? Increase the reach of your titles
YUMPU automatically turns print PDFs into web optimized ePapers that Google loves.
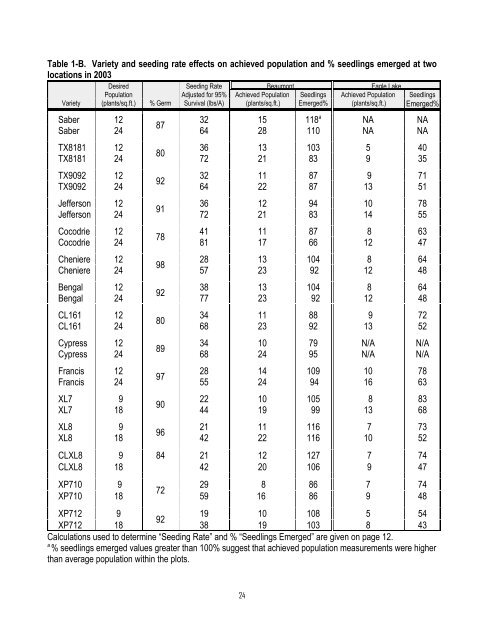
Table 1-B. Variety <strong>and</strong> seeding rate effects on achieved population <strong>and</strong> % seedlings emerged at two<br />
locations in 2003<br />
Desired Seeding Rate Beaumont Eagle Lake<br />
Population Adjusted for 95% Achieved Population Seedlings Achieved Population Seedlings<br />
Variety (plants/sq.ft.) % Germ Survival (lbs/A) (plants/sq.ft.) Emerged% (plants/sq.ft.) Emerged%<br />
Saber 12<br />
32 15 118<br />
87<br />
a NA NA<br />
Saber 24 64 28 110 NA NA<br />
TX8181 12<br />
36 13 103 5 40<br />
80<br />
TX8181 24 72 21 83 9 35<br />
TX9092 12<br />
32 11 87 9 71<br />
92<br />
TX9092 24 64 22 87 13 51<br />
Jefferson 12<br />
36 12 94 10 78<br />
91<br />
Jefferson 24 72 21 83 14 55<br />
Cocodrie 12<br />
41 11 87 8 63<br />
78<br />
Cocodrie 24 81 17 66 12 47<br />
Cheniere 12<br />
28 13 104 8 64<br />
98<br />
Cheniere 24 57 23 92 12 48<br />
Bengal 12<br />
38 13 104 8 64<br />
92<br />
Bengal 24 77 23 92 12 48<br />
CL161 12<br />
34 11 88 9 72<br />
80<br />
CL161 24 68 23 92 13 52<br />
Cypress 12<br />
34 10 79 N/A N/A<br />
89<br />
Cypress 24 68 24 95 N/A N/A<br />
Francis 12<br />
28 14 109 10 78<br />
97<br />
Francis 24 55 24 94 16 63<br />
XL7 9<br />
22 10 105 8 83<br />
90<br />
XL7 18 44 19 99 13 68<br />
XL8 9<br />
21 11 116 7 73<br />
96<br />
XL8 18 42 22 116 10 52<br />
CLXL8 9 84 21 12 127 7 74<br />
CLXL8 18 42 20 106 9 47<br />
XP710 9<br />
29 8 86 7 74<br />
72<br />
XP710 18 59 16 86 9 48<br />
XP712 9<br />
19 10 108 5 54<br />
92<br />
XP712 18 38 19 103 8 43<br />
Calculations used to determine “Seeding Rate” <strong>and</strong> % “Seedlings Emerged” are given on page 12.<br />
a % seedlings emerged values greater than 100% suggest that achieved population measurements were higher<br />
than average population within the plots.<br />
24