Evaluating Potential Rice Varieties from University and Industry ...
Evaluating Potential Rice Varieties from University and Industry ...
Evaluating Potential Rice Varieties from University and Industry ...

Create successful ePaper yourself
Turn your PDF publications into a flip-book with our unique Google optimized e-Paper software.
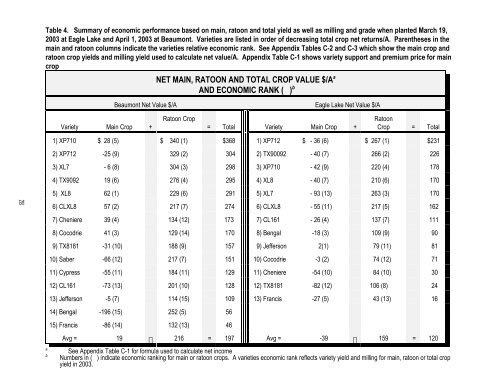
Table 4. Summary of economic performance based on main, ratoon <strong>and</strong> total yield as well as milling <strong>and</strong> grade when planted March 19,<br />
2003 at Eagle Lake <strong>and</strong> April 1, 2003 at Beaumont. <strong>Varieties</strong> are listed in order of decreasing total crop net returns/A. Parentheses in the<br />
main <strong>and</strong> ratoon columns indicate the varieties relative economic rank. See Appendix Tables C-2 <strong>and</strong> C-3 which show the main crop <strong>and</strong><br />
ratoon crop yields <strong>and</strong> milling yield used to calculate net value/A. Appendix Table C-1 shows variety support <strong>and</strong> premium price for main<br />
crop<br />
NET MAIN, RATOON AND TOTAL CROP VALUE $/A a<br />
AND ECONOMIC RANK ( ) b<br />
Beaumont Net Value $/A<br />
Eagle Lake Net Value $/A<br />
Variety Main Crop +<br />
Ratoon Crop<br />
= Total Variety Main Crop +<br />
Ratoon<br />
Crop = Total<br />
1) XP710 $ 28 (5) $ 340 (1) $368 1) XP712 $ - 36 (6) $ 267 (1) $231<br />
2) XP712 -25 (9) 329 (2) 304 2) TX90092 - 40 (7) 266 (2) 226<br />
3) XL7 - 6 (8) 304 (3) 298 3) XP710 - 42 (9) 220 (4) 178<br />
4) TX9092 19 (6) 276 (4) 295 4) XL8 - 40 (7) 210 (6) 170<br />
5) XL8 62 (1) 229 (6) 291 5) XL7 - 93 (13) 263 (3) 170<br />
28<br />
a<br />
b<br />
6) CLXL8 57 (2) 217 (7) 274 6) CLXL8 - 55 (11) 217 (5) 162<br />
7) Cheniere 39 (4) 134 (12) 173 7) CL161 - 26 (4) 137 (7) 111<br />
8) Cocodrie 41 (3) 129 (14) 170 8) Bengal -18 (3) 109 (9) 90<br />
9) TX8181 -31 (10) 188 (9) 157 9) Jefferson 2(1) 79 (11) 81<br />
10) Saber -66 (12) 217 (7) 151 10) Cocodrie -3 (2) 74 (12) 71<br />
11) Cypress -55 (11) 184 (11) 129 11) Cheniere -54 (10) 84 (10) 30<br />
12) CL161 -73 (13) 201 (10) 128 12) TX8181 -82 (12) 106 (8) 24<br />
13) Jefferson -5 (7) 114 (15) 109 13) Francis -27 (5) 43 (13) 16<br />
14) Bengal -196 (15) 252 (5) 56<br />
15) Francis -86 (14) 132 (13) 46<br />
Avg = 19 216 = 197 Avg = -39 159 = 120<br />
See Appendix Table C-1 for formula used to calculate net income<br />
Numbers in ( ) indicate economic ranking for main or ratoon crops. A varieties economic rank reflects variety yield <strong>and</strong> milling for main, ratoon or total crop<br />
yield in 2003.