CANADA: GRAINS AND OILSEEDS OUTLOOK - SeedQuest
CANADA: GRAINS AND OILSEEDS OUTLOOK - SeedQuest
CANADA: GRAINS AND OILSEEDS OUTLOOK - SeedQuest
Create successful ePaper yourself
Turn your PDF publications into a flip-book with our unique Google optimized e-Paper software.
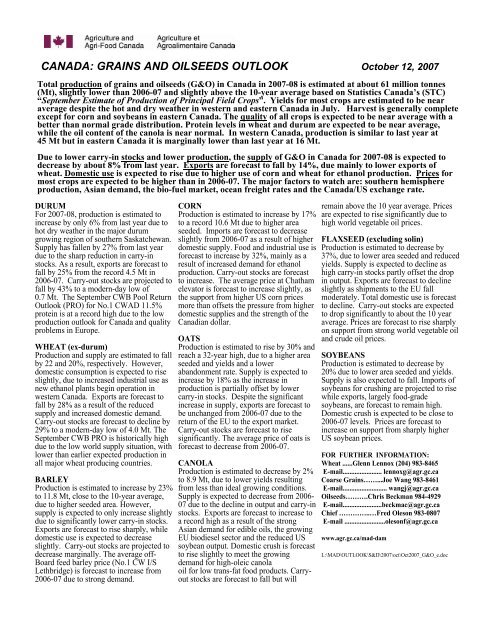
<strong>CANADA</strong>: <strong>GRAINS</strong> <strong>AND</strong> <strong>OILSEEDS</strong> <strong>OUTLOOK</strong> October 12, 2007<br />
Total production of grains and oilseeds (G&O) in Canada in 2007-08 is estimated at about 61 million tonnes<br />
(Mt), slightly lower than 2006-07 and slightly above the 10-year average based on Statistics Canada’s (STC)<br />
“September Estimate of Production of Principal Field Crops”. Yields for most crops are estimated to be near<br />
average despite the hot and dry weather in western and eastern Canada in July. Harvest is generally complete<br />
except for corn and soybeans in eastern Canada. The quality of all crops is expected to be near average with a<br />
better than normal grade distribution. Protein levels in wheat and durum are expected to be near average,<br />
while the oil content of the canola is near normal. In western Canada, production is similar to last year at<br />
45 Mt but in eastern Canada it is marginally lower than last year at 16 Mt.<br />
Due to lower carry-in stocks and lower production, the supply of G&O in Canada for 2007-08 is expected to<br />
decrease by about 8% from last year. Exports are forecast to fall by 14%, due mainly to lower exports of<br />
wheat. Domestic use is expected to rise due to higher use of corn and wheat for ethanol production. Prices for<br />
most crops are expected to be higher than in 2006-07. The major factors to watch are: southern hemisphere<br />
production, Asian demand, the bio-fuel market, ocean freight rates and the Canada/US exchange rate.<br />
DURUM<br />
For 2007-08, production is estimated to<br />
increase by only 6% from last year due to<br />
hot dry weather in the major durum<br />
growing region of southern Saskatchewan.<br />
Supply has fallen by 27% from last year<br />
due to the sharp reduction in carry-in<br />
stocks. As a result, exports are forecast to<br />
fall by 25% from the record 4.5 Mt in<br />
2006-07. Carry-out stocks are projected to<br />
fall by 43% to a modern-day low of<br />
0.7 Mt. The September CWB Pool Return<br />
Outlook (PRO) for No.1 CWAD 11.5%<br />
protein is at a record high due to the low<br />
production outlook for Canada and quality<br />
problems in Europe.<br />
WHEAT (ex-durum)<br />
Production and supply are estimated to fall<br />
by 22 and 20%, respectively. However,<br />
domestic consumption is expected to rise<br />
slightly, due to increased industrial use as<br />
new ethanol plants begin operation in<br />
western Canada. Exports are forecast to<br />
fall by 28% as a result of the reduced<br />
supply and increased domestic demand.<br />
Carry-out stocks are forecast to decline by<br />
29% to a modern-day low of 4.0 Mt. The<br />
September CWB PRO is historically high<br />
due to the low world supply situation, with<br />
lower than earlier expected production in<br />
all major wheat producing countries.<br />
BARLEY<br />
Production is estimated to increase by 23%<br />
to 11.8 Mt, close to the 10-year average,<br />
due to higher seeded area. However,<br />
supply is expected to only increase slightly<br />
due to significantly lower carry-in stocks.<br />
Exports are forecast to rise sharply, while<br />
domestic use is expected to decrease<br />
slightly. Carry-out stocks are projected to<br />
decrease marginally. The average off-<br />
Board feed barley price (No.1 CW I/S<br />
Lethbridge) is forecast to increase from<br />
2006-07 due to strong demand.<br />
CORN<br />
Production is estimated to increase by 17%<br />
to a record 10.6 Mt due to higher area<br />
seeded. Imports are forecast to decrease<br />
slightly from 2006-07 as a result of higher<br />
domestic supply. Food and industrial use is<br />
forecast to increase by 32%, mainly as a<br />
result of increased demand for ethanol<br />
production. Carry-out stocks are forecast<br />
to increase. The average price at Chatham<br />
elevator is forecast to increase slightly, as<br />
the support from higher US corn prices<br />
more than offsets the pressure from higher<br />
domestic supplies and the strength of the<br />
Canadian dollar.<br />
OATS<br />
Production is estimated to rise by 30% and<br />
reach a 32-year high, due to a higher area<br />
seeded and yields and a lower<br />
abandonment rate. Supply is expected to<br />
increase by 18% as the increase in<br />
production is partially offset by lower<br />
carry-in stocks. Despite the significant<br />
increase in supply, exports are forecast to<br />
be unchanged from 2006-07 due to the<br />
return of the EU to the export market.<br />
Carry-out stocks are forecast to rise<br />
significantly. The average price of oats is<br />
forecast to decrease from 2006-07.<br />
CANOLA<br />
Production is estimated to decrease by 2%<br />
to 8.9 Mt, due to lower yields resulting<br />
from less than ideal growing conditions.<br />
Supply is expected to decrease from 2006-<br />
07 due to the decline in output and carry-in<br />
stocks. Exports are forecast to increase to<br />
a record high as a result of the strong<br />
Asian demand for edible oils, the growing<br />
EU biodiesel sector and the reduced US<br />
soybean output. Domestic crush is forecast<br />
to rise slightly to meet the growing<br />
demand for high-oleic canola<br />
oil for low trans-fat food products. Carryout<br />
stocks are forecast to fall but will<br />
remain above the 10 year average. Prices<br />
are expected to rise significantly due to<br />
high world vegetable oil prices.<br />
FLAXSEED (excluding solin)<br />
Production is estimated to decrease by<br />
37%, due to lower area seeded and reduced<br />
yields. Supply is expected to decline as<br />
high carry-in stocks partly offset the drop<br />
in output. Exports are forecast to decline<br />
slightly as shipments to the EU fall<br />
moderately. Total domestic use is forecast<br />
to decline. Carry-out stocks are expected<br />
to drop significantly to about the 10 year<br />
average. Prices are forecast to rise sharply<br />
on support from strong world vegetable oil<br />
and crude oil prices.<br />
SOYBEANS<br />
Production is estimated to decrease by<br />
20% due to lower area seeded and yields.<br />
Supply is also expected to fall. Imports of<br />
soybeans for crushing are projected to rise<br />
while exports, largely food-grade<br />
soybeans, are forecast to remain high.<br />
Domestic crush is expected to be close to<br />
2006-07 levels. Prices are forecast to<br />
increase on support from sharply higher<br />
US soybean prices.<br />
FOR FURTHER INFORMATION:<br />
Wheat ......Glenn Lennox (204) 983-8465<br />
E-mail....................... lennoxg@agr.gc.ca<br />
Coarse Grains……...Joe Wang 983-8461<br />
E-mail.......................... wangj@agr.gc.ca<br />
Oilseeds……….Chris Beckman 984-4929<br />
E-mail.......................beckmac@agr.gc.ca<br />
Chief …………..…Fred Oleson 983-0807<br />
E-mail ........................olesonf@agr.gc.ca<br />
www.agr.gc.ca/mad-dam<br />
L:\MAD\<strong>OUTLOOK</strong>\S&D\2007\oct\Oct2007_G&O_e.doc
<strong>CANADA</strong>: <strong>GRAINS</strong> <strong>AND</strong> <strong>OILSEEDS</strong> SUPPLY <strong>AND</strong> DISPOSITION October 12, 2007<br />
Grain and Crop<br />
Year (a)<br />
Area<br />
Seeded<br />
Area<br />
Harvested Yield Production<br />
Imports<br />
(b)<br />
Total<br />
Supply Exports (c)<br />
Food &<br />
Industrial<br />
Use (e)<br />
Feed,<br />
Waste &<br />
Dockage<br />
Total<br />
Domestic<br />
Use (d)<br />
Carry-out<br />
Stocks<br />
thousand ha t/ha ---------------------------------------thousand metric tonnes------------------------------------------------------------<br />
Average<br />
Price (f)<br />
$/t<br />
Durum<br />
2005-2006 2,307 2,278 2.60 5,915 4 8,405 4,273 248 482 877 3,256 179<br />
2006-2007 1,536 1,518 2.21 3,346 1 6,603 4,478 257 451 893 1,232 219*<br />
2007-2008f 1,949 1,934 1.87 3,614 1 4,847 3,350 260 317 797 700 437*<br />
Wheat Except Durum<br />
2005-2006 7,347 7,125 2.78 19,834 23 25,291 11,499 2,905 3,670 7,411 6,382 180<br />
2006-2007 8,316 8,164 2.68 21,919 25 28,326 15,019 3,361 3,656 7,712 5,595 206*<br />
2007-2008f 6,900 6,717 2.53 17,027 24 22,646 10,800 3,550 3,515 7,846 4,000 294*<br />
All Wheat<br />
2005-2006 9,654 9,404 2.74 25,748 26 33,696 15,771 3,153 4,152 8,287 9,638<br />
2006-2007 9,852 9,682 2.61 25,265 26 34,929 19,497 3,617 4,107 8,605 6,827<br />
2007-2008f 8,849 8,651 2.39 20,641 25 27,494 14,150 3,810 3,832 8,644 4,700<br />
Barley<br />
2005-2006 4,143 3,634 3.21 11,678 46 15,159 2,975 167 8,404 8,894 3,289 110<br />
2006-2007 3,690 3,223 2.97 9,573 43 12,905 1,975 166 8,889 9,438 1,492 165<br />
2007-2008f 4,398 4,051 2.92 11,822 35 13,349 2,700 180 8,669 9,249 1,400 180-200<br />
Corn<br />
2005-2006 1,113 1,085 8.60 9,332 1,903 13,036 254 2,280 8,489 10,781 2,001 96<br />
2006-2007 1,093 1,061 8.47 8,990 2,000 12,991 314 2,965 8,353 11,333 1,343 138<br />
2007-2008f 1,387 1,361 7.75 10,555 1,900 13,798 200 3,900 8,183 12,098 1,500 140-160<br />
Oats<br />
2005-2006 1,768 1,271 2.58 3,283 20 4,277 1,877 79 1,278 1,529 872 144<br />
2006-2007 2,064 1,537 2.51 3,852 18 4,741 2,307 87 1,610 1,879 556 193<br />
2007-2008f 2,189 1,853 2.70 5,009 10 5,575 2,300 80 1,825 2,075 1,200 170-190<br />
Rye<br />
2005-2006 208 136 2.43 330 1 461 132 48 114 179 150 81<br />
2006-2007 276 164 2.34 383 1 534 160 48 179 244 130 97<br />
2007-2008f 176 115 2.17 250 1 381 140 48 116 181 60 100-120<br />
Mixed Grains<br />
2005-2006 214 114 2.78 316 0 316 0 0 316 316 0<br />
2006-2007 336 130 2.67 347 0 347 0 0 347 347 0<br />
2007-2008f 170 106 2.80 297 0 297 0 0 297 297 0<br />
Total Coarse Grains<br />
2005-2006 7,445 6,240 4.00 24,939 1,970 33,250 5,239 2,573 18,601 21,700 6,311<br />
2006-2007 7,458 6,114 3.79 23,145 2,062 31,517 4,756 3,266 19,378 23,240 3,521<br />
2007-2008f 8,319 7,486 3.73 27,932 1,946 33,399 5,340 4,208 19,089 23,899 4,160<br />
Canola<br />
2005-2006 5,370 5,175 1.83 9,483 140 11,209 5,409 3,423 330 3,794 2,007 278<br />
2006-2007 5,283 5,238 1.72 9,000 203 11,211 5,435 3,579 332 3,956 1,820 370<br />
2007-2008f 5,905 5,819 1.52 8,864 225 10,910 5,700 3,550 315 3,910 1,300 425-465<br />
Flaxseed<br />
2005-2006 761 733 1.35 991 38 1,053 537 n/a n/a 180 336 276<br />
2006-2007 805 785 1.26 989 8 1,333 681 n/a n/a 279 373 302<br />
2007-2008f 528 524 1.19 625 10 1,008 650 n/a n/a 183 175 390-430<br />
Soybeans<br />
2005-2006 1,172 1,165 2.71 3,156 339 3,765 1,316 1,493 334 1,954 495 220<br />
2006-2007 1,214 1,201 2.89 3,466 225 4,186 1,700 1,513 380 2,016 470 263<br />
2007-2008f 1,180 1,169 2.38 2,785 400 3,656 1,600 1,500 281 1,881 175 305-345<br />
Total Oilseeds<br />
2005-2006 7,303 7,073 1.93 13,630 517 16,027 7,262 4,916 665 5,928 2,838<br />
2006-2007 7,302 7,225 1.86 13,455 437 16,729 7,816 5,092 712 6,250 2,664<br />
2007-2008f 7,613 7,512 1.63 12,275 635 15,574 7,950 5,050 596 5,974 1,650<br />
Total Grains And Oilseeds<br />
2005-2006 24,402 22,717 2.83 64,317 2,512 82,974 28,271 10,642 23,418 35,915 18,787<br />
2006-2007 24,612 23,021 2.69 61,865 2,524 83,176 32,069 11,975 24,198 38,095 13,012<br />
2007-2008f 24,781 23,650 2.57 60,848 2,606 76,467 27,440 13,068 23,517 38,517 10,510<br />
(a) Crop year is August-July except corn and soybeans which are September-August.<br />
(b) Excludes imports of products. (c) Includes exports of products for wheat, oats, barley, and rye. Excludes exports of oilseed products.<br />
(d) Total Domestic Use = Food and Industrial Use + Feed Waste & Dockage + Seed Use<br />
(e) Soybean food and industrial use is based on data from the Canadian Oilseed Processors Association. Totals excludes flaxseed due to data confidentiality.<br />
(f) Crop year average prices: No.1 CWRS 11.5% protein and No.1 CWAD 11.5% (CWB final price I/S St. Lawrence/Vancouver), Barley (No. 1 feed, WCE, cash, I/S<br />
Lethbridge), Corn (No.2 CE, cash, I/S Chatham), Oats (US No. 2 Heavy, CBoT nearby futures); Rye (No.1 CW, I/S Saskatoon); Canola (No. 1 Canada, WCE, cash, I/S<br />
Vancouver); Flaxseed (No. 1 CW, WCE, cash, I/S Thunder Bay); Soybeans (No. 2, I/S Chatham).<br />
* Canadian Wheat Board September Pool Return Outlook (PRO)<br />
f: forecast; Agriculture and Agri-Food Canada: October 12, 2007<br />
Source: Statistics Canada, Cereals and Oilseeds Review Series, Cat. No. 22-007


