SQUARE Project: Cost/Benefit Analysis Framework for Information ...
SQUARE Project: Cost/Benefit Analysis Framework for Information ...
SQUARE Project: Cost/Benefit Analysis Framework for Information ...

Create successful ePaper yourself
Turn your PDF publications into a flip-book with our unique Google optimized e-Paper software.
<strong>SQUARE</strong> <strong>Project</strong>:<br />
<strong>Cost</strong>/<strong>Benefit</strong> <strong>Analysis</strong><br />
<strong>Framework</strong> <strong>for</strong> In<strong>for</strong>mation<br />
Security Improvement <strong>Project</strong>s<br />
in Small Companies<br />
System Quality Requirements<br />
Engineering (<strong>SQUARE</strong>) Team<br />
Nick (Ning) Xie<br />
Nancy R. Mead, Advisor<br />
Contributors:<br />
Peter Chen<br />
Marjon Dean<br />
Lilian Lopez<br />
Don Ojoko-Adams<br />
Hasan Osman<br />
November 2004<br />
Technical Note<br />
CMU/SEI-2004-TN-045<br />
Networked Systems Survivability Program<br />
Unlimited distribution subject to the copyright.
This work is sponsored by the U.S. Department of Defense.<br />
The Software Engineering Institute is a federally funded research and development center sponsored by the U.S.<br />
Department of Defense.<br />
Copyright 2004 Carnegie Mellon University.<br />
NO WARRANTY<br />
THIS CARNEGIE MELLON UNIVERSITY AND SOFTWARE ENGINEERING INSTITUTE MATERIAL IS<br />
FURNISHED ON AN "AS-IS" BASIS. CARNEGIE MELLON UNIVERSITY MAKES NO WARRANTIES OF ANY<br />
KIND, EITHER EXPRESSED OR IMPLIED, AS TO ANY MATTER INCLUDING, BUT NOT LIMITED TO,<br />
WARRANTY OF FITNESS FOR PURPOSE OR MERCHANTABILITY, EXCLUSIVITY, OR RESULTS OBTAINED<br />
FROM USE OF THE MATERIAL. CARNEGIE MELLON UNIVERSITY DOES NOT MAKE ANY WARRANTY OF<br />
ANY KIND WITH RESPECT TO FREEDOM FROM PATENT, TRADEMARK, OR COPYRIGHT INFRINGEMENT.<br />
Use of any trademarks in this report is not intended in any way to infringe on the rights of the trademark holder.<br />
Internal use. Permission to reproduce this document and to prepare derivative works from this document <strong>for</strong> internal use is<br />
granted, provided the copyright and “No Warranty” statements are included with all reproductions and derivative works.<br />
External use. Requests <strong>for</strong> permission to reproduce this document or prepare derivative works of this document <strong>for</strong> external<br />
and commercial use should be addressed to the SEI Licensing Agent.<br />
This work was created in the per<strong>for</strong>mance of Federal Government Contract Number F19628-00-C-0003 with Carnegie<br />
Mellon University <strong>for</strong> the operation of the Software Engineering Institute, a federally funded research and development<br />
center. The Government of the United States has a royalty-free government-purpose license to use, duplicate, or disclose the<br />
work, in whole or in part and in any manner, and to have or permit others to do so, <strong>for</strong> government purposes pursuant to the<br />
copyright license under the clause at 252.227-7013.<br />
For in<strong>for</strong>mation about purchasing paper copies of SEI reports, please visit the publications portion of our Web site<br />
(http://www.sei.cmu.edu/publications/pubweb.html).
Contents<br />
Abstract .............................................................................................................vii<br />
1 Introduction..................................................................................................1<br />
1.1 The Problem .........................................................................................1<br />
1.2 A <strong>Framework</strong> <strong>for</strong> <strong>Cost</strong>/<strong>Benefit</strong> <strong>Analysis</strong>..................................................1<br />
1.3 The Acme Company..............................................................................2<br />
1.3.1 System Overview.......................................................................2<br />
1.3.2 Business Goals..........................................................................2<br />
1.3.3 Security Objectives....................................................................2<br />
2 <strong>Cost</strong>/<strong>Benefit</strong> <strong>Analysis</strong> <strong>Framework</strong>...............................................................4<br />
2.1 Terms and Concepts .............................................................................4<br />
2.2 Methodology .........................................................................................4<br />
2.3 Stakeholder Involvement .....................................................................10<br />
2.4 Evaluation Criteria...............................................................................10<br />
2.5 Maximizing System Value Within Real-Life Budget Constraints...........12<br />
3 <strong>Cost</strong>/<strong>Benefit</strong> <strong>Analysis</strong> <strong>Framework</strong> in Practice..........................................15<br />
3.1 Misuse Cases .....................................................................................15<br />
3.2 Categories of Threats..........................................................................16<br />
3.3 Risk Exposures ...................................................................................17<br />
3.4 Architectural Recommendations..........................................................17<br />
3.5 Policy Recommendations....................................................................17<br />
3.6 Total System Value Versus Total Implementation <strong>Cost</strong>s.......................18<br />
3.7 <strong>Benefit</strong>/<strong>Cost</strong> Ratio Versus Total Implementation <strong>Cost</strong>s ........................19<br />
3.8 Total Implementation <strong>Cost</strong>s Versus Risk Exposures ............................20<br />
3.9 Values Versus Risk Exposures............................................................21<br />
4 Lessons Learned........................................................................................23<br />
4.1 Misuse Cases .....................................................................................23<br />
4.2 Estimation of Losses ...........................................................................23<br />
4.3 Estimation of <strong>Cost</strong>s .............................................................................23<br />
4.4 <strong>Cost</strong> Structures of Security Improvement <strong>Project</strong>s...............................24<br />
CMU/SEI-2004-TN-045<br />
i
4.5 Values of Security Improvement <strong>Project</strong>s............................................ 24<br />
5 Conclusions............................................................................................... 25<br />
6 Future Work ............................................................................................... 26<br />
References ........................................................................................................ 27<br />
ii<br />
CMU/SEI-2004-TN-045
List of Figures<br />
Figure 1: Categorization of Threats, Misuse Cases, and Incidents......................... 6<br />
Figure 2: Total System Value vs. Total Implementation <strong>Cost</strong>s............................... 19<br />
Figure 3: <strong>Benefit</strong>/<strong>Cost</strong> Ratio vs. Total Implementation <strong>Cost</strong>s ................................ 20<br />
Figure 4: Total Implementation <strong>Cost</strong>s vs. Risk Exposures.................................... 21<br />
Figure 5: Values vs. Risk Exposures.................................................................... 22<br />
CMU/SEI-2004-TN-045<br />
iii
iv<br />
CMU/SEI-2004-TN-045
List of Tables<br />
Table 1: Terms and Concepts Used in the <strong>Framework</strong>.......................................... 4<br />
Table 2: Example Misuse Case .......................................................................... 15<br />
Table 3: <strong>Cost</strong> Estimates <strong>for</strong> Architectural Recommendations.............................. 17<br />
Table 4: <strong>Cost</strong> Estimates <strong>for</strong> Policy Recommendations........................................ 18<br />
CMU/SEI-2004-TN-045<br />
v
vi<br />
CMU/SEI-2004-TN-045
Abstract<br />
Many companies rely on historical data to build predictability models <strong>for</strong> cost/benefit<br />
justification of future projects. Un<strong>for</strong>tunately, <strong>for</strong> small companies, which generally do not<br />
have a process <strong>for</strong> collecting security data, the costs and the benefits of in<strong>for</strong>mation security<br />
improvement projects have been very difficult to estimate and justify. In addition, detailed<br />
attack data are simply not available to be used as references in cost estimations. Given these<br />
difficulties, many small companies choose to ignore entirely the security vulnerabilities in<br />
their systems, and many suffer the consequences of security breaches and significant<br />
financial loss. Small companies that do implement security improvement projects often have<br />
problems understanding the cost structures of their improvement initiatives and how to<br />
translate risk exposures into costs that can be passed on to their customers.<br />
To deal with the a<strong>for</strong>ementioned problems, this report describes a general framework <strong>for</strong><br />
hierarchical cost/benefit analysis aimed at providing acceptable estimations <strong>for</strong> small<br />
companies in their in<strong>for</strong>mation security improvement projects. The framework classifies<br />
misuse cases into categories of threats <strong>for</strong> which nationally surveyed risks and financial data<br />
are publicly available. For each category of threats, costs, benefits, baseline risks, and<br />
residual risks are estimated. The framework then generates all permutations of possible<br />
solutions and analyzes the most optimal approach to maximize the value of security<br />
improvement projects. The framework analyzes the problems from five dimensions: Total<br />
Implementation <strong>Cost</strong>s, Total System Value, Net <strong>Project</strong> Value, <strong>Benefit</strong>/<strong>Cost</strong> Ratio, and Risk<br />
Exposures. The final proposed system will be derived from the comparisons of these<br />
dimensions, taking into consideration each company’s specific situation.<br />
This report is one of a series of reports resulting from research conducted by the System<br />
Quality Requirements Engineering (<strong>SQUARE</strong>) Team as part of an independent research and<br />
development project of the Software Engineering Institute.<br />
CMU/SEI-2004-TN-045<br />
vii
viii<br />
CMU/SEI-2004-TN-045
1 Introduction<br />
The purpose of a cost/benefit analysis is to provide a set of quantitative metrics to assist<br />
companies in their decision making. In in<strong>for</strong>mation security improvement projects, such<br />
analysis can provide insights about which vulnerabilities and/or design flaws to fix, in what<br />
order of importance, and <strong>for</strong> how much investment. By associating a calibrated monetary<br />
amount with each risk, vulnerability, cost item, and recommendation, a cost/benefit analysis<br />
enables companies to compare and contrast available alternatives and to arrive at a sound<br />
decision with financial justification.<br />
1.1 The Problem<br />
In<strong>for</strong>mation security data has traditionally been very difficult to collect. In small companies,<br />
where human resources are especially scarce, the process of collecting data on the annual<br />
number of security breaches and their resulting financial losses is typically non-existent.<br />
This creates the problem that, on one hand, small companies need reliable data to make good<br />
decisions, and on the other hand, they cannot have data when no one has time to collect data.<br />
In addition, security risk is often an unknown quantity, because no one can predict the exact<br />
time and methods of future security incidents. Businesses can only hope to reduce risk and<br />
potential loss by implementing security solutions. At a detailed level, there is often a manyto-many<br />
relationship between risks and security improvement measures, and it is difficult to<br />
compute the actual risk versus the cost <strong>for</strong> each specific misuse and attack.<br />
Without reliable historical data and/or comparable third-party data, small companies are<br />
usually at a loss about whether to implement their security improvement projects. Many<br />
small companies choose to ignore entirely the security vulnerabilities in their systems, and<br />
many suffer the consequences of security breaches and significant financial loss when attacks<br />
occur. Small companies that do implement the security improvement projects often have<br />
problems understanding the cost structures of their improvement initiatives and how to<br />
translate risk reduction into costs that can be passed on to their customers.<br />
1.2 A <strong>Framework</strong> <strong>for</strong> <strong>Cost</strong>/<strong>Benefit</strong> <strong>Analysis</strong><br />
To deal with the a<strong>for</strong>ementioned problems, we have devised the <strong>Cost</strong>/<strong>Benefit</strong> <strong>Analysis</strong><br />
<strong>Framework</strong>, a general framework <strong>for</strong> hierarchical cost/benefit analysis aimed at providing<br />
acceptable estimations <strong>for</strong> small companies in their in<strong>for</strong>mation security improvement<br />
projects. The framework classifies misuse cases into categories of threats <strong>for</strong> which<br />
nationally surveyed risks and financial data are publicly available. For each category of<br />
threats, costs, benefits, baseline risks, and residual risks are estimated. The framework then<br />
CMU/SEI-2004-TN-045 1
generates all permutations of possible solutions and analyzes the most optimal approach to<br />
maximize the value of security improvement projects. The framework is described in detail in<br />
Section 2.<br />
1.3 The Acme Company<br />
Throughout this report we will use the Acme Company as the alias of our real-life client. The<br />
Acme Company is a small start-up software company. Its core product has attracted interests<br />
from several large prospects. However, be<strong>for</strong>e deals can be signed, these prospect companies<br />
demand that the Acme Company show them that the product is reasonably secure when<br />
deployed in large, heterogeneous enterprise environments. Because of customer demands,<br />
the Acme Company is planning to initiate a project to improve the security of its product.<br />
Be<strong>for</strong>e the project is undertaken, however, its costs must be justified relative to its benefits.<br />
An application of the framework to the Acme Company example is discussed in Section 3.<br />
1.3.1 System Overview<br />
The Acme Company’s core product is a web-based n-tier asset management system with<br />
browser clients, web servers, application servers, and database components. It has an<br />
existing client installation base. Currently it is undergoing a major migration to a new<br />
version. It remains to be shown whether the system can be reasonably secure when deployed<br />
in a large, heterogeneous enterprise environment.<br />
1.3.2 Business Goals<br />
As with any business, one of the Acme Company’s main objectives is to make a profit. In<br />
addition to the security objectives presented in this document, Acme wants to keep focus on<br />
its business goals of increasing profits and market share in the industry. Hence, incorporating<br />
security improvements should work in parallel with the original objectives rather than against<br />
them.<br />
1.3.3 Security Objectives<br />
The following are Acme’s security objectives <strong>for</strong> its asset management system. They are<br />
listed alphabetically.<br />
Availability: The business purpose of the system can be met, and the system is accessible to<br />
those who need to use it [SANS 03].<br />
Confidentiality: In<strong>for</strong>mation is not made available or disclosed to unauthorized individuals,<br />
entities, or processes (i.e., to any unauthorized system entity) [SANS 03].<br />
2 CMU/SEI-2004-TN-045
Integrity: The system per<strong>for</strong>ms its intended function in an unimpaired manner, free from<br />
deliberate or inadvertent unauthorized manipulation. Data in the system are not changed,<br />
destroyed, or lost in an unauthorized or accidental manner [Allen 99].<br />
CMU/SEI-2004-TN-045 3
2 <strong>Cost</strong>/<strong>Benefit</strong> <strong>Analysis</strong> <strong>Framework</strong><br />
2.1 Terms and Concepts<br />
Terms and concepts used in the <strong>Cost</strong>/<strong>Benefit</strong> <strong>Analysis</strong> <strong>Framework</strong> are defined in Table 1.<br />
Table 1:<br />
Terms and Concepts Used in the <strong>Framework</strong><br />
Category of Threats<br />
Category of<br />
Preventions<br />
Baseline Risk<br />
Bypass Rate<br />
Residual Risk<br />
Net Present Value<br />
(NPV)<br />
a set of related misuses and attacks that pose threats to the<br />
organization<br />
a set of recommendations that sufficiently mitigate a Category of<br />
Threats. A Category of Preventions has a one-to-one relationship<br />
with a Category of Threats.<br />
incident risk to the organization if no security solutions are in<br />
place<br />
probability that an attack will penetrate a given security solution<br />
and result in observable damage. A 100% bypass rate means the<br />
security solution does not stop any incidents; a 0% bypass rate<br />
means the security solution stops all incidents. 1<br />
incident risk to the organization if security solutions are properly<br />
installed, utilized, and monitored. Residual Risk = Baseline Risks<br />
x Bypass Rate.<br />
the present value of an investment’s future net cash flow minus<br />
the initial investment<br />
2.2 Methodology<br />
The <strong>Cost</strong>/<strong>Benefit</strong> <strong>Analysis</strong> <strong>Framework</strong> derives its cost and benefit figures from misuse cases<br />
and the architectural and policy recommendations needed to mitigate these misuse cases. We<br />
1<br />
The authors gratefully acknowledge the ideas expressed by Arora et al. that all security solutions<br />
are subject to rate of failures (bypass), which needs to be accounted <strong>for</strong> in the risk reduction<br />
analysis. (Arora, Ashish; Hall, Dennis; Pinto, C. Ariel; Ramsey, Dwayne; & Telang, Rahul. “An<br />
Ounce of Prevention vs. a Pound of Cure: How Can We Measure the Value of IT Security<br />
Solutions?” Carnegie Mellon CyLab, 2004.)<br />
4 CMU/SEI-2004-TN-045
will not explain in depth how to generate misuse cases and recommendations, since they are<br />
very company and project specific. To illustrate our points, we will show examples of misuse<br />
cases and recommendations in Section 3.<br />
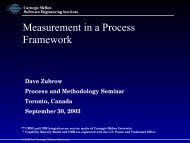
The framework categorizes related misuses into Categories of Threats, which are sets of<br />
related misuses and attacks that pose threats to the organization. Examples of Categories of<br />
Threats include denial of service, system penetration, and sabotage of data. Categorization<br />
has several benefits. First, categories are high level and easy to understand by business users.<br />
Second, categorization reduces the scope and the dimensions of the problem by aggregating<br />
on top of related misuse cases, which themselves are aggregates of incidents. Third,<br />
categories are relatively distinct from each other. We are assuming that the effects of<br />
mitigating risks in one Category of Threats are negligible to other Categories of Threats.<br />
This assumption allows us to compute independently costs of implementations <strong>for</strong> each<br />
Category of Preventions without worrying about overlapping cardinalities. Finally, attack and<br />
loss data <strong>for</strong> Categories of Threats can be found in national surveys, which provide<br />
reasonable estimates <strong>for</strong> small companies without <strong>for</strong>cing them to invest large amounts of<br />
human resources in data collection or research.<br />
The most difficult problem <strong>for</strong> any small company is the lack of historical data or comparable<br />
external data to base its analysis on. There<strong>for</strong>e, reasonable assumptions need to be made in<br />
the areas of expected probabilities and consequences when the company is subject to misuses<br />
and attacks. In most cases, even <strong>for</strong> large companies, we cannot accurately predict when and<br />
how an attack will happen. However, these challenges can be overcome with threat<br />
categorization. Annual national surveys have shown that over the period of a year,<br />
Categories of Threats have average probabilities of occurrences and ranges of financial losses<br />
due to exposures to these Categories of Threats. Because these Categories of Threats are<br />
general and encompassing, they can be assumed to include most of the misuses and attacks<br />
that a small company is likely to face. By not concentrating on each specific misuse or attack<br />
that a company may face, small companies can avoid getting consumed by over-detailed risk<br />
modeling that they have no resources or reliable data to do. Instead, by focusing on<br />
mitigating Categories of Threats, small companies will have reasonable estimations of their<br />
expected loss if they were to take no actions against a set of probable misuse cases. From<br />
Categories of Threats they can quantify and prioritize sets of security improvement measures<br />
with respect to their high-level security and business goals. We call these security<br />
improvement measures Categories of Preventions. They have one-to-one relationships with<br />
Categories of Threats.<br />
CMU/SEI-2004-TN-045 5
Enterprise Security<br />
Legend<br />
Entity<br />
Connector<br />
And<br />
Category of Threats 1<br />
Category of Threats N<br />
Or<br />
Misuse Case 1<br />
Misuse Case S<br />
Misuse Case 1<br />
Misuse Case T<br />
Incident 1 Incident i Incident 1 Incident j<br />
Incident 1 Incident k Incident 1 Incident l<br />
Figure 1: Categorization of Threats, Misuse Cases, and Incidents<br />
The framework takes financial and probabilistic data from annual national surveys <strong>for</strong> each<br />
Category of Threats. The principal assumption is that a small company is subject to attacks<br />
and misuses at probabilities at or near national average. If the company cannot provide an<br />
estimate <strong>for</strong> the expected loss when misuses happen, lower ends of nationally surveyed loss<br />
are used as cost avoidance items <strong>for</strong> implementing security improvement measures. We use<br />
the lower end because small companies typically do not have as many assets to lose as larger<br />
companies.<br />
The goal of the framework is to support better decision-making to ensure that resources are<br />
effectively allocated in the lifetime of the project. Typically,<br />
• a security improvement project runs <strong>for</strong> M number of years and<br />
• there are N possible Categories of Preventions to implement.<br />
If and only if all the architectural and policy recommendations in a Category of Preventions<br />
are implemented do we consider the risks in its corresponding Category of Threats mitigated;<br />
otherwise Category of Threats is considered not to have been mitigated. Let’s define the<br />
following:<br />
X<br />
i<br />
= 1 if we are going to implement a Category of Prevention (i = 1, 2…N)<br />
= 0 if we are not going to implement a Category of Prevention (i = 1, 2 …N)<br />
6 CMU/SEI-2004-TN-045
Using the a<strong>for</strong>ementioned probabilities from the surveys, Margin of Safety and Risk<br />
Exposures of a company’s existing system can be calculated. Margin of Safety is the<br />
probability that none of the categories of threats happen at all within a year. There<strong>for</strong>e, it is<br />
the accumulative product of (1 – probabilities of a Category of Threats happening). The<br />
probability of a Category of Threats happening will differ depending on whether the given<br />
Category of Threats has been mitigated. When unmitigated, a particular Category of Threats<br />
will have Baseline Risk (incident risk to the organization if no security solutions are in place)<br />
assumed at national average; when mitigated, the same Category of Threats will have only<br />
Residual Risk, which is the incident risk to the organization even if security solutions are<br />
properly installed, utilized, and monitored. However, even with proper security solutions in<br />
place, an attack still might penetrate the security solutions and result in observable damage.<br />
The rate of such occurrence is thus defined as the Bypass Rate. A 100% Bypass Rate means<br />
the security solution does not stop any incidents; a 0% Bypass Rate means the security<br />
solution stops all incidents. For small companies, which typically do not have voluminous<br />
data on their in<strong>for</strong>mation security, a reasonable estimate of Bypass Rate can be used. This is<br />
the case in the Acme Company example in Section 3.<br />
For i = 1, 2….N number of possible Categories of Preventions:<br />
Residual Risk i = Baseline Risk i x Bypass Rate i<br />
Margin of Safety ≅ (1 − P{<br />
attacked } )<br />
≅<br />
N<br />
∏<br />
i=<br />
1<br />
N<br />
∏<br />
i=<br />
1<br />
( 1−<br />
P i<br />
)<br />
i<br />
P<br />
i<br />
=<br />
Baseline_R iski<br />
if X<br />
i<br />
= 0<br />
Residual_R isk i<br />
if X<br />
i<br />
= 1<br />
Example 1:<br />
Risk Exposure = 1 – Margin of Safety<br />
If a company currently has a 60% likelihood of encountering misuse incidents in Category A<br />
and a 30% likelihood of encountering misuse incidents in Category B, then:<br />
Baseline Risk (A) = 60%<br />
Baseline Risk (B) = 30%<br />
Margin of Safety = (1-60%) x (1 – 30%) = 28%<br />
Risk Exposure = 1 – 28% = 72%<br />
when no action is taken.<br />
CMU/SEI-2004-TN-045 7
Example 1, continued:<br />
The company can take steps to mitigate Category A and/or Category B. The available<br />
solution <strong>for</strong> A is highly effective (Bypass Rate of 5%), but the available solution <strong>for</strong> B is not<br />
effective (Bypass Rate of 70%), so:<br />
Residual Risk (A) = 60% * 5% = 3%<br />
Residual Risk (B) = 30% * 70% = 21%<br />
When steps to address both A & B are implemented:<br />
Margin of Safety = ( 1 – 3% ) x (1 – 21%) = 77%<br />
Risk Exposure = 1 – 77% = 23%<br />
The <strong>Cost</strong>/<strong>Benefit</strong> <strong>Analysis</strong> <strong>Framework</strong> employs the <strong>for</strong>mula of Annualized Loss in each<br />
category multiplied by Baseline Risk in each category to calculate the Baseline <strong>Cost</strong> in each<br />
category. The Baseline <strong>Cost</strong> is the amount in dollars that an organization is expected to lose<br />
by taking no action against a Category of Threats. The Annualized Loss is then used to derive<br />
the Tangible <strong>Benefit</strong>s in the <strong>Benefit</strong>s section (cost avoidance) of the recommendations <strong>for</strong><br />
each category, if the recommendations were to be implemented. The cost avoided by<br />
implementing the security solutions is the amount in dollars reduced from the total possible<br />
loss by the effectiveness of the security solutions. The effectiveness of a security solution is<br />
essentially the amount of risk reduction a Category of Preventions can achieve.<br />
Annualized Loss (AL) i<br />
= Surveyed_Average i<br />
if no data available<br />
Avg_Incide nt_lossi × Est_Frequency i<br />
if data or estimation available<br />
Baseline <strong>Cost</strong> i<br />
Residual <strong>Cost</strong> i<br />
= Baseline_R isk i<br />
× ALi<br />
= Residual_R isk i<br />
× ALi<br />
= Baseline_R isk × Bypass_Rate ×<br />
i<br />
Tangible <strong>Benefit</strong> i = 0 if X<br />
i<br />
= 0<br />
Baseline_<strong>Cost</strong>i − Residual_<strong>Cost</strong> i<br />
if X<br />
i<br />
= 1<br />
Intangible <strong>Benefit</strong> i = 0 if X<br />
i<br />
= 0<br />
Custom_Ben efit i<br />
if X<br />
i<br />
= 1<br />
i<br />
AL<br />
i<br />
8 CMU/SEI-2004-TN-045
Total <strong>Benefit</strong>s<br />
=<br />
=<br />
N<br />
∑<br />
i=<br />
1<br />
N<br />
∑<br />
i=<br />
1<br />
Tangible_B enefit<br />
i<br />
+<br />
N<br />
∑<br />
i=<br />
1<br />
(AL × Baseline_Risk × X<br />
i<br />
i<br />
Intangible_<strong>Benefit</strong><br />
i<br />
× (1 − Bypass_Rate )) +<br />
i<br />
i<br />
N<br />
∑<br />
i=<br />
1<br />
(X<br />
i<br />
× Custom_<strong>Benefit</strong><br />
i<br />
)<br />
Example 2:<br />
If the company loses $50,000 <strong>for</strong> each misuse incident in Category A and there are 10<br />
incidents per year in Category A, and the company loses $100,000 <strong>for</strong> each misuse incident<br />
in Category B and there are 2 incidents per year in Category B:<br />
Annualized Loss (A) = $50,000 x 10 = $500,000<br />
Annualized Loss (B) = $100,000 x 2 = $200,000<br />
Using figures from Example 1:<br />
Baseline <strong>Cost</strong> (A) = $500,000 x 60% = $300,000<br />
Residual <strong>Cost</strong> (A) = $500,000 x 3% = $15,000<br />
Baseline <strong>Cost</strong> (B) = $200,000 x 30% = $60,000<br />
Residual <strong>Cost</strong> (B) = $200,000 x 21% = $42,000<br />
Tangible <strong>Benefit</strong> (<strong>for</strong> mitigating A) = $300,000 - $15,000 = $285,000<br />
Tangible <strong>Benefit</strong> (<strong>for</strong> mitigating B) = $60,000 - $42,000 = $18,000<br />
Suppose that the company can get a $50,000 government award <strong>for</strong> having effectively<br />
guarded against misuses in Category A, then:<br />
Intangible <strong>Benefit</strong> (<strong>for</strong> mitigating A) = $50,000<br />
Intangible <strong>Benefit</strong> (<strong>for</strong> mitigating B) = $0<br />
Total <strong>Benefit</strong>s = ($285,000 + $18,000 ) + ($50,000 + $0) = $353,000<br />
With stakeholders’ feedback, misuse cases in each Category of Threats can be identified as<br />
high, medium, or low in priority. We found that small companies typically will only have the<br />
resources to mitigate high-priority misuse cases. Given such constraints, it is important to<br />
note that misuses and attacks with low to medium risk can still occur. There<strong>for</strong>e, the Bypass<br />
Rate shall not be too low when medium- and low-priority risks have not been mitigated. The<br />
recommendations that correspond to high-priority misuse cases are used in the calculations of<br />
the <strong>Cost</strong>/<strong>Benefit</strong> <strong>Analysis</strong> <strong>Framework</strong>. <strong>Cost</strong> Avoidance is used as the benefit <strong>for</strong> each<br />
Category of Preventions. If there are any other intangible benefits, they should be included<br />
as well.<br />
<strong>Cost</strong>s of implementation <strong>for</strong> each recommendation need to be estimated, checked with<br />
stakeholders, and then adjusted based on their feedback. Total System Value, Total<br />
CMU/SEI-2004-TN-045 9
Implementation <strong>Cost</strong>s, Net <strong>Project</strong> Value, and <strong>Benefit</strong>/<strong>Cost</strong> Ratio (B/C) are then calculated.<br />
For more details, see Section 2.4, “Evaluation Criteria.”<br />
2.3 Stakeholder Involvement<br />
Stakeholders must be regularly involved in this <strong>Cost</strong>/<strong>Benefit</strong> <strong>Analysis</strong> <strong>Framework</strong> to ensure<br />
reasonably accurate results, especially during the misuse case identification phase and the<br />
cost estimation phase <strong>for</strong> implementing recommendations. After the stakeholders reply with<br />
their feedback and suggestions <strong>for</strong> change, cost/benefit calculations should be updated and<br />
improved on in a reiterative process over a span of several weeks. Small companies probably<br />
do not have months of time to analyze a project. There<strong>for</strong>e, we recommend that the<br />
<strong>Cost</strong>/<strong>Benefit</strong> <strong>Analysis</strong> be done with an existing set of templates instead of reinventing the<br />
wheel. Also, it is important to keep in mind that the proposed system and alternatives may<br />
change, depending on a company’s internal assessment of its assets, vulnerabilities,<br />
development timeframes, and risks and their associated costs, among other variables.<br />
2.4 Evaluation Criteria<br />
The criteria <strong>for</strong> evaluating alternatives are based on five key metrics: Total Implementation<br />
<strong>Cost</strong>s, Net <strong>Project</strong> Value, Total System Value, <strong>Benefit</strong>/<strong>Cost</strong> Ratio, and Risk Exposures. These<br />
five criteria serve different purposes. Total Implementation <strong>Cost</strong>s can help small companies<br />
make decisions as to how much money they can spend without jeopardizing growth in other<br />
areas of need. Net <strong>Project</strong> Value demonstrates the extent to which a particular security<br />
solution can contribute to the overall system. Total System Value takes into consideration the<br />
fact that unmitigated threats still cost a company some amount of money in risks. It accounts<br />
<strong>for</strong> scenarios where the Net <strong>Project</strong> Value is high while the overall value of the system is low<br />
because the solution did not address costly threats. A positive Net <strong>Project</strong> Value is a strong<br />
key indicator that the solution is worthwhile to implement; a large Total System Value<br />
suggests that the system will be improved by implementing the project; and a large B/C Ratio<br />
relative to other solutions indicates that the solution should be implemented first because it is<br />
more cost effective. Combined with Risk Exposures after implementing the proposed system<br />
versus implementing alternatives, these five criteria <strong>for</strong>m the basis of correlation between<br />
benefits of desired security improvement, costs within available fiscal budget, and tolerance<br />
of acceptable Risk Exposures. The proposed system and the alternatives will be chosen from<br />
a finite set of possible solutions that small companies may wish to implement or ignore,<br />
based on comparing and analyzing present values of these metrics.<br />
Let’s assume that Categories of Preventions have the following characteristics, which we can<br />
calculate by doing a cost/benefit spreadsheet on each category. All values are NPV.<br />
10 CMU/SEI-2004-TN-045
Category of<br />
Preventions ( P )<br />
i<br />
Baseline <strong>Cost</strong><br />
A ) if X = 0<br />
(<br />
i<br />
i<br />
Residual <strong>Cost</strong><br />
R ) if X = 1<br />
(<br />
i<br />
i<br />
Implementation <strong>Cost</strong><br />
C ) if X = 1<br />
(<br />
i<br />
i<br />
1 A<br />
1<br />
R<br />
1<br />
C<br />
1<br />
2 A<br />
2<br />
R<br />
2<br />
C<br />
2<br />
…<br />
N<br />
A<br />
N<br />
R<br />
N<br />
C<br />
N<br />
Total Implementation <strong>Cost</strong>s<br />
Total Implementation <strong>Cost</strong>s are the present value costs calculated over the length of the<br />
project. Because there might be overlapping in costs of implementing architectural and<br />
policy recommendations when some recommendations (e.g., good password management)<br />
may be necessary to mitigate multiple Categories of Threats, total implementation costs are<br />
the sum of all present value costs of implementation minus any overlapping costs.<br />
Total Implementation <strong>Cost</strong>s<br />
N<br />
= ∑ ∑∑<br />
i i<br />
i= 1<br />
j= 1 k=<br />
j+<br />
1<br />
N<br />
N<br />
( C × X ) − Overlap _ <strong>Cost</strong> × X × X<br />
jk<br />
j<br />
k<br />
Net <strong>Project</strong> Value<br />
Net <strong>Project</strong> Value is the present value of savings (loss) from the total benefits of<br />
implementing recommendations minus total costs of implementing recommendations. It<br />
demonstrates the value that the project can deliver to the overall system. The higher the Net<br />
<strong>Project</strong> Value is, the better.<br />
Net <strong>Project</strong> Value (NV) = Total <strong>Benefit</strong>s – Total Implementation <strong>Cost</strong>s<br />
Total System Value<br />
Total System Value is the present value of Net <strong>Project</strong> Value minus the present value of<br />
expected loss from unmitigated threats. It takes into consideration that unmitigated threats<br />
still cost companies some amount of money in risks. If a Category of Threats is mitigated,<br />
then its Residual <strong>Cost</strong> is used; otherwise its Baseline <strong>Cost</strong> is used. Total System Value<br />
accounts <strong>for</strong> scenarios where the Net <strong>Project</strong> Value is high while the overall value of the<br />
system is low because the solution did not address costly threats. It evaluates the system’s<br />
overall value after implementing the project and provides high-level guidance to the business<br />
objective beyond the project itself. The higher the Total System Value is, the better.<br />
Total System Value (TV)<br />
= Net <strong>Project</strong> Value - costs of unmitigated risks<br />
N<br />
N<br />
= Net <strong>Project</strong> Value – ( ∑ X<br />
i<br />
× Ri<br />
× + ∑( 1−<br />
X<br />
i<br />
) × Ai<br />
)<br />
Theoretically the higher TV is, the better; but it needs to be taken into consideration with Risk<br />
Exposures and other company-specific factors. Because X is either 0 or 1 (2 choices) and<br />
i=<br />
1<br />
i<br />
i=<br />
1<br />
CMU/SEI-2004-TN-045 11
there are N categories, there are 2 N possible solutions. For small N this can be easily<br />
calculated via a computer program (e.g., Microsoft Excel), which is the case in the Acme<br />
Company example. In fact, this is where categorization helps out small companies in terms<br />
of estimation ef<strong>for</strong>ts because it reduces the size of N.<br />
<strong>Benefit</strong>/<strong>Cost</strong> Ratio (B/C)<br />
<strong>Benefit</strong>/<strong>Cost</strong> Ratio pertains to the ratio between the net benefit in implementing a security<br />
solution and the costs of implementation. It demonstrates the capability <strong>for</strong> the organization<br />
to profit (cost savings) from its security investments. The higher the B/C Ratio, the better an<br />
investment is.<br />
BC<br />
=<br />
Total_<strong>Benefit</strong>s<br />
Total_Implementation_<strong>Cost</strong>s<br />
Example 3:<br />
If it costs $200,000 to implement solutions <strong>for</strong> A and $150,000 to implement solutions <strong>for</strong><br />
B, with $40,000 of overlapping hardware costs, then:<br />
Total <strong>Benefit</strong>s = $335,000 (from Example 2)<br />
Residual <strong>Cost</strong>s (A) = $15,000 (from Example 1)<br />
Residual <strong>Cost</strong>s (B) = $42,000 (from Example 1)<br />
Total Implementation <strong>Cost</strong>s = $200,000 + $150,000 - $40,000 = $310,000<br />
Net <strong>Project</strong> Value = $335,000 - $310,000 = $25,000<br />
Total System Value = $25,000 – ($15,000 + $42,000) = -$32,000<br />
<strong>Benefit</strong>/<strong>Cost</strong> Ratio = $335,000/$310,000 = 108%<br />
2.5 Maximizing System Value Within Real-Life Budget Constraints<br />
We have until now presented a framework that analyzes the proposed system versus the<br />
alternatives assuming that there are no limits and no variations to yearly budgets. For the<br />
sake of convenience, we assumed that the budget is going to be so large that these variables<br />
could be ignored. However, we know from real-life experience that this is often not the case,<br />
especially in small companies where capital is at a premium. Companies with little initial<br />
budgets and large future budgets will make their decisions significantly different from<br />
companies that have large initial budgets but little future budgets. In such cases, to deal with<br />
real-life budget constraints, we must find a linear solution in which all constraints are linear<br />
functions of the decision variables. Some or all of the decision variables must have integer<br />
values (0 or 1, do or not do). In mathematics terms, the model to solve these kinds of<br />
problems is called Integer Model [Camm 00]. We are able to do so because decisions to<br />
implement Categories of Preventions are essentially concrete (yes/no), and the options come<br />
from a finite set of Categories of Preventions that are sufficiently distinct from each other.<br />
12 CMU/SEI-2004-TN-045
Back to the problem, there are N possible Categories of Preventions to implement, each of<br />
which runs <strong>for</strong> M number of years, with the following Total System Values and yearly<br />
implementation costs.<br />
Category of<br />
Preventions<br />
( P<br />
i<br />
)<br />
1<br />
2<br />
…<br />
N<br />
Implementation <strong>Cost</strong> ( C<br />
it<br />
)<br />
if X<br />
i<br />
= 1<br />
Y<br />
0<br />
Y<br />
1<br />
C<br />
C<br />
10 11<br />
C<br />
20 21<br />
…<br />
Y<br />
M<br />
C 1 M<br />
C C 2 M<br />
C<br />
N 0<br />
C<br />
N1<br />
C<br />
NM<br />
And we have available budget <strong>for</strong> each year: B<br />
0 , B<br />
1<br />
, …<br />
budget.<br />
B<br />
M<br />
, with B<br />
0<br />
being the initial<br />
Now we have to decide which set of Categories of Preventions to implement in order to<br />
maximize our returns within the budget constraints. We know that yearly costs <strong>for</strong><br />
implementations must also be within the yearly budget. The constraints <strong>for</strong> the Linear Model<br />
problem are then the linear sum of implementation costs <strong>for</strong> each category. If a Category of<br />
Preventions was implemented, then it would contribute its cost against the budget; otherwise<br />
it will count as 0.<br />
N<br />
∑<br />
i=1<br />
C<br />
it<br />
× X<br />
i<br />
≤ B<br />
t<br />
or<br />
(t=0, 1, 2…M)<br />
C<br />
10<br />
X<br />
1<br />
+ C20<br />
× X<br />
2<br />
+ ... + C<br />
N 0<br />
× X<br />
N<br />
≤ B0<br />
11<br />
X<br />
1<br />
+ C21<br />
× X<br />
2<br />
+ ... + CN1<br />
× X<br />
N<br />
≤ B1<br />
× (year 0)<br />
C × (year 1)<br />
…….<br />
……<br />
C1 × X<br />
1<br />
+ C2<br />
× X<br />
2<br />
+ ... + C × X ≤ B (year M)<br />
M<br />
M<br />
NM<br />
N<br />
There could be Z number of solutions to this set of equations, where Z is less than or equal to<br />
2 N .<br />
We can exhaustively apply every set of possible ( X<br />
1, X<br />
2<br />
…<br />
M<br />
X N<br />
) values to calculate<br />
financially feasible solutions under the budget constraint. In fact, in most cases we expect the<br />
exhaustive method to be used because it is easy to understand and easy to calculate when N is<br />
not too large. However, should there be a situation where N is very large, the Branch and<br />
Bound method may be used. Brand and Bound is an algorithmic technique to find the<br />
optimal solution by keeping the best solution found so far [NIST 04]. In the Brand and<br />
Bound method, if a partial solution cannot improve on the best value, it is abandoned. The<br />
method systematically enumerates a fraction of feasible solutions, while still guaranteeing<br />
CMU/SEI-2004-TN-045 13
that the most optimal integer solution is found. Several commercially available software<br />
packages support the Brand and Bound method, including Microsoft Excel.<br />
In the end, we should get a set of TV values and a set of ( X<br />
1, X<br />
2<br />
…<br />
X N<br />
), from which we<br />
derive the proposed system and possible alternatives. When we analyze them with their<br />
associated <strong>Benefit</strong>/<strong>Cost</strong> Ratio and Risk Exposures, we can find the best paths to take <strong>for</strong><br />
in<strong>for</strong>mation security improvement projects in small companies.<br />
14 CMU/SEI-2004-TN-045
3 <strong>Cost</strong>/<strong>Benefit</strong> <strong>Analysis</strong> <strong>Framework</strong> in Practice<br />
The <strong>Cost</strong>/<strong>Benefit</strong> <strong>Analysis</strong> <strong>Framework</strong> is applied on the Acme Company to help it determine<br />
how to meet its security and business objectives at the same time within reasonable costs.<br />
3.1 Misuse Cases<br />
Be<strong>for</strong>e the cost/benefit analysis can be done, misuse cases must be identified in order to<br />
accurately access the impact of misuses when they happen. This report will not go into detail<br />
about how these misuse cases are generated. The misuse case documentation shown in Table<br />
2 is provided as an example of the level of detail misuse cases need in order to derive<br />
comprehensive architectural recommendations and policy recommendations. Attack trees <strong>for</strong><br />
misuse cases may also be used to ensure that the list of architectural and policy<br />
recommendations is complete.<br />
Table 2:<br />
Example Misuse Case<br />
Number: MC-xx<br />
Name:<br />
Users gain sys admin rights on the server (elevation of privileges).<br />
Scope:<br />
User Authorization Concerns<br />
Priority: Low Medium x High<br />
Deployment<br />
Environment:<br />
Mis-actors:<br />
Access Right<br />
Levels:<br />
x Intranet<br />
Extranet/Internet<br />
Users<br />
Low-Level System User<br />
x Medium-Level System User<br />
x High-Level System User<br />
Sys-Admin-Level System User<br />
x Other Network User<br />
Point of Entry: Network x Host Application<br />
Security<br />
Attributes<br />
affected:<br />
Description:<br />
Sophistication:<br />
Pre-conditions:<br />
Assumptions:<br />
Post-conditions:<br />
x Confidentiality<br />
x Integrity<br />
Availability<br />
A user attempts to gain sys admin rights on the server and succeeds.<br />
Low<br />
Medium<br />
x High<br />
• The user has unintended logon rights to the Windows 2003 server.<br />
• The user is not already a sys admin.<br />
• The user does not have expressed permission to gain sys admin rights.<br />
Worst Case Threat:<br />
Wanted Prevention<br />
Guarantee:<br />
• The user gains sys admin rights on the server and then<br />
tampers with system and/or user data. His/her actions are<br />
never caught.<br />
• En<strong>for</strong>ce machine access control list (ACL) security policy<br />
(role-based user authentication).<br />
CMU/SEI-2004-TN-045 15
Potential Misactor<br />
Profiles:<br />
Stakeholders and<br />
Threats:<br />
Related Use<br />
Cases:<br />
Related Threats:<br />
Architectural<br />
Recommendation:<br />
Policy<br />
Recommendation:<br />
Wanted Detection<br />
Guarantee:<br />
Wanted Recovery<br />
Guarantee:<br />
Highly skilled users with high criminal intent.<br />
• Logon attempts are logged and viewed by system<br />
administrators.<br />
• Remove users’ unauthorized logon rights on the server.<br />
• Acme Company’s client: loss of data integrity and/or confidentiality<br />
• Acme Company: loss of reputation, loss of current and potential clients<br />
UC-06, UC-07, UC-08<br />
Elevation of privileges, unauthorized access to administration interfaces, unauthorized<br />
access to configuration stores<br />
• Store audit in<strong>for</strong>mation in a separate location from the servers and the workstations.<br />
• Implement a strong role-based authentication control.<br />
• Patch applications and operating systems routinely (bimonthly).<br />
• Ensure that users do not have rights or access levels beyond those prescribed by their job<br />
responsibilities.<br />
• Review audit in<strong>for</strong>mation routinely (monthly).<br />
• Store and cross-review configuration changes (monthly).<br />
• En<strong>for</strong>ce strong password policies.<br />
• Password protect any necessary shared documents.<br />
• Require users to change their passwords periodically (monthly).<br />
• Periodically review user activities (bimonthly).<br />
• Require users to log out of the system or close their browser as soon as their activities<br />
are done.<br />
• Require users never to reveal their account names and passwords.<br />
• Per<strong>for</strong>m routine system and data backup (weekly).<br />
3.2 Categories of Threats<br />
The <strong>Cost</strong>/<strong>Benefit</strong> <strong>Analysis</strong> <strong>Framework</strong> categorizes all misuse cases into seven Categories of<br />
Threats:<br />
• Denial of Service<br />
• System Penetration<br />
• Sabotage of Data<br />
• Theft of Proprietary Info<br />
• Unauthorized Access by Insiders<br />
• Virus<br />
• Active Wiretapping [Richardson 03]<br />
Financial and probabilistic data are available <strong>for</strong> these categories from the 2003 CSI/FBI<br />
Computer Crime and Security Survey [Richardson 03]. Given that the Acme Company had<br />
not paid much attention to its own security ef<strong>for</strong>ts up to this point in time, we assumed that<br />
Acme will have Baseline Risks at or near national average within each Category of Threats.<br />
The lower end of reported losses is initially used as the estimate of Annualized Loss if attacks<br />
were successful in achieving observable damages. Later the Acme Company per<strong>for</strong>ms an<br />
internal estimation and determines a more precise set of financial numbers that get<br />
incorporated in the analysis instead.<br />
16 CMU/SEI-2004-TN-045
3.3 Risk Exposures<br />
The cost/benefit analysis assumes that the Bypass Rate is approximately 10%. Subsequent<br />
calculations show that when none of the seven Categories of Threats are mitigated, the Acme<br />
Company’s core product’s Risk Exposures to some combination of misuses are above 90%.<br />
Because the probability of misuses/attacks is very high, the cost/benefit analysis is needed in<br />
order to manage and mitigate the company’s Risk Exposures <strong>for</strong> its core product.<br />
3.4 Architectural Recommendations<br />
From our work, we have discovered that architectural recommendations tend to have costs<br />
that are heavily front-loaded (e.g., initial implementation costs). It intuitively makes sense<br />
because architectural improvements need to be implemented, tested, and deployed be<strong>for</strong>e<br />
benefits can be realized over the lifetime of a project. The Acme Company prefers to view<br />
the costs of implementation in terms of man-hours of ef<strong>for</strong>t. We have no objections to this<br />
method of evaluation. In fact, we would recommend the man-hour estimation method to our<br />
future clients because it is a standard way of making engineering estimates. We can then<br />
multiply man-hours with average hourly wage rates to arrive at a good estimation of total<br />
costs. Other than costs of salaries, there are maintenance costs (also calculated via manhours),<br />
third-party software costs, and hardware costs. Table 3 shows the <strong>for</strong>mat we used to<br />
break down the types of costs that architectural recommendations have.<br />
Table 3:<br />
<strong>Cost</strong> Estimates <strong>for</strong> Architectural Recommendations<br />
Architectural<br />
No. Recommendation<br />
AR-01 All shared drives on the<br />
network should en<strong>for</strong>ce<br />
authentication policies.<br />
AR-02 Antivirus software is<br />
installed on the server.<br />
Related<br />
Misuse<br />
Cases<br />
Maint.<br />
<strong>Cost</strong><br />
($/ year)<br />
Software<br />
<strong>Cost</strong><br />
[Type]/($)<br />
Hardware<br />
<strong>Cost</strong><br />
[Type]/ ($)<br />
Category of Implementation<br />
Priority Threat <strong>Cost</strong> ($/ year)<br />
MC-01 High U $xxx $xxx $xxx $xxx<br />
MC-17 High V $xxx $xxx $xxx $xxx<br />
3.5 Policy Recommendations<br />
Policy recommendations tend to recur over the lifetime of the project. The cost of training<br />
and the cost of en<strong>for</strong>cement are difficult to quantify on the macro level. However, the<br />
feedback we gained from the Acme Company is that it is much easier to visualize the ef<strong>for</strong>ts<br />
in terms of man-hours per user per year. The total costs can then be calculated by<br />
multiplying man-hours per user per year with an estimated number of users and with average<br />
hourly wage rates. Table 4 shows the <strong>for</strong>mat we used to break down the types of costs that<br />
policy recommendations have.<br />
CMU/SEI-2004-TN-045 17
Table 4:<br />
<strong>Cost</strong> Estimates <strong>for</strong> Policy Recommendations<br />
No.<br />
Policy Recommendation<br />
PR-01 All installation must be approved<br />
and reviewed by managers.<br />
PR-02 Applications and operating systems<br />
must be patched routinely (bimonthly).<br />
Related<br />
Misuse<br />
Cases<br />
MC-13,<br />
MC-15<br />
MC-01,<br />
MC-03,<br />
MC-13,<br />
MC-15,<br />
MC-16,<br />
MC-17,<br />
MC-18,<br />
MC-19,<br />
MC-20,<br />
MC-21,<br />
MC-22<br />
Priority<br />
Category of<br />
Threat<br />
Training<br />
<strong>Cost</strong> ($)<br />
En<strong>for</strong>cement <strong>Cost</strong><br />
($)<br />
Other <strong>Cost</strong>s<br />
[Type]/ ($)<br />
High U, W $xxx $xxx Name/$xxx<br />
High U, P $xxx $xxx Name/$xxx<br />
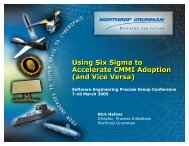
3.6 Total System Value Versus Total Implementation <strong>Cost</strong>s<br />
The Total System Value vs. Total Implementation <strong>Cost</strong>s graph in Figure 2 shows us there are<br />
optimal and non-optimal solutions among the security solutions that the Acme Company may<br />
choose to implement. The solutions with higher Total System Value are better solutions. The<br />
four colored boxes (solutions) are better solutions within their respective cost ranges because<br />
they have the highest Total System Value compared to other solutions on the same vertical<br />
lines in the graph. The pink solution represents the Total System Value of the current system.<br />
It has zero total implementation costs. The Blue solution (Alternative 2) represents the total<br />
value of the system when every architectural and policy recommendation has been<br />
implemented. The brown solution (Alternative 1) and the red solution (Proposed System)<br />
have the highest Total System Value, meaning that by implementing either one the Acme<br />
Company can obtain the best value <strong>for</strong> its system over the next three years of project lifetime.<br />
From a strictly financial perspective, solutions with higher Total System Value and lower<br />
Total Implementation <strong>Cost</strong>s are preferred. There<strong>for</strong>e, the graph suggests that Alternative 1 is<br />
a better solution than the Proposed System or Alternative 2. However, it is not immediately<br />
apparent from this view the extent to which Risk Exposures are reduced. We shall examine<br />
Risk Exposures in later sections. It is worth noting, however, that Alternative 1 is a subset of<br />
the Proposed System.<br />
18 CMU/SEI-2004-TN-045
Total System Value vs. Total Implementation <strong>Cost</strong>s<br />
$0<br />
A1 PS<br />
$0 $50,000 $100,000 $150,000 $200,000 $250,000<br />
($50,000)<br />
($100,000)<br />
CS<br />
($150,000)<br />
A2<br />
Total Value of<br />
System<br />
Poly. (Total Value<br />
of System)<br />
($200,000)<br />
Legend<br />
Proposed System<br />
($250,000)<br />
Alternative 1<br />
Alternative 2<br />
($300,000)<br />
Current System<br />
($350,000)<br />
Total Implementation <strong>Cost</strong>s<br />
Figure 2: Total System Value vs. Total Implementation <strong>Cost</strong>s<br />
3.7 <strong>Benefit</strong>/<strong>Cost</strong> Ratio Versus Total Implementation <strong>Cost</strong>s<br />
How effective are the solutions in delivering results? <strong>Benefit</strong>/<strong>Cost</strong> Ratio gives us the trend<br />
pattern when compared against the Total Implementation <strong>Cost</strong>s. From the graph, B/C Ratio<br />
briefly increases be<strong>for</strong>e dropping as costs of implementing security recommendations go up.<br />
Small companies often gain significant benefits by implementing a small set of selected<br />
security improvement recommendations but then lose the benefits when they start to<br />
implement additional security solutions.<br />
The <strong>Benefit</strong>/<strong>Cost</strong> Ratio vs. Total Implementation <strong>Cost</strong>s graph in Figure 3 suggests that there<br />
are highly cost-effective security solutions that should be implemented first. The Current<br />
System is not present on this graph because there is no implementation cost involved with<br />
taking no action. Similar to the Total System Value vs. Total Implementation <strong>Cost</strong>s graph, the<br />
three solutions with higher Total System Value are more cost effective when compared<br />
against other security solutions that have the same implementation cost. Alternative 1<br />
appears to be more cost effective than the red or blue solution. However, when compared to<br />
the previous graph, we note that Alternative 1 and the Recommendation have the same total<br />
value. This suggests that the additional investment with the Recommendation mitigates the<br />
cost of additional risk at or near 100% <strong>Benefit</strong>/<strong>Cost</strong> Ratio, which is the case when we see that<br />
the Recommendation has approximately 100% <strong>Benefit</strong>/<strong>Cost</strong> Ratio. The trend line also<br />
suggests that if the Acme Company invests more resources to become more secure, its return<br />
on the investment will decline precipitously. Without intangible benefits such as new<br />
CMU/SEI-2004-TN-045 19
evenue opportunities, large investments associated with making many security<br />
improvements are probably difficult to justify beyond an acceptable level of risk tolerance.<br />
<strong>Benefit</strong>/<strong>Cost</strong> Ratio vs. Total Implementation <strong>Cost</strong>s<br />
120.00%<br />
A1<br />
100.00%<br />
PS<br />
80.00%<br />
A2<br />
BC Ratio<br />
Poly. (BC Ratio)<br />
60.00%<br />
Legend<br />
40.00%<br />
Proposed System<br />
Alternative 1<br />
20.00%<br />
Alternative 2<br />
Current System<br />
0.00%<br />
$0 $50,000 $100,000 $150,000 $200,000 $250,000 $300,000<br />
Total Implementation <strong>Cost</strong>s<br />
Figure 3: <strong>Benefit</strong>/<strong>Cost</strong> Ratio vs. Total Implementation <strong>Cost</strong>s<br />
3.8 Total Implementation <strong>Cost</strong>s Versus Risk Exposures<br />
The Total Implementation <strong>Cost</strong>s vs. Risk Exposures graph in Figure 4 shows us that initially<br />
security improvements can be costly. Security improvements may be best when done<br />
together with implementing multiple Categories of Preventions. The solutions that mitigate<br />
more risks with lower costs are better solutions.<br />
There are several things to be noticed with the graph. First, costs go up when Risk Exposures<br />
go down, which is to be expected. Second, the smallest Risk Exposure is not near zero. This<br />
is due to the fact that a small company such as the Acme Company may not have the<br />
resources to implement and en<strong>for</strong>ce every single recommendation. There<strong>for</strong>e, its Bypass<br />
Rates and Residual Risks <strong>for</strong> security breaches are still high, which causes its Risk Exposures<br />
to be high. More detailed studies are warranted if the Acme Company needs to reduce its risk<br />
exposures further. However, from the trend projection, we can see that the cost goes up<br />
significantly as Risk Exposures become smaller and smaller. It is an indication that the costs<br />
needed to cover edge scenarios may be very expensive and may only be justified with large<br />
increases in the benefits (such as new revenue opportunities) that additional security<br />
improvements would bring.<br />
20 CMU/SEI-2004-TN-045
The variance around the trend line is extremely high when risks are not mitigated. This<br />
suggests a few possible scenarios. First, there are Categories of Threats with low rates of<br />
return and high costs to fix. There<strong>for</strong>e, they should only be implemented after other<br />
categories with higher <strong>Benefit</strong>/<strong>Cost</strong> Ratio. Second, strategies that focus on mitigating only<br />
very small number of Categories of Threats may be neither cost effective nor risk averse.<br />
$600,000<br />
Total Implementation <strong>Cost</strong>s vs. Risk Exposures<br />
$500,000<br />
$400,000<br />
Total<br />
Implementation<br />
<strong>Cost</strong>s<br />
Log. (Total<br />
Implementation<br />
<strong>Cost</strong>s)<br />
$300,000<br />
Legend<br />
Proposed System<br />
$200,000<br />
A2<br />
Alternative 1<br />
Alternative 2<br />
$100,000<br />
PS<br />
A1<br />
Current System<br />
$0<br />
CS<br />
0.00% 20.00% 40.00% 60.00% 80.00% 100.00% 120.00%<br />
Risk Exposures<br />
Figure 4: Total Implementation <strong>Cost</strong>s vs. Risk Exposures<br />
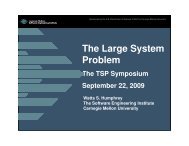
3.9 Values Versus Risk Exposures<br />
The Values vs. Risk Exposures graph in Figure 5 shows us what happens when Risk<br />
Exposures are taken into consideration. The graph shows the relationships between Net<br />
<strong>Project</strong> Value, Total System Value, and Risk Exposures. The gap between Total System Value<br />
and Net <strong>Project</strong> Value represents the amount of costs in unmitigated risks the Acme Company<br />
is subject to with respect to each possible solution. Because costs of unmitigated risks are the<br />
product of multiplying probabilities of occurrence by Annualized Loss (when misuses<br />
happen), they are essentially approximations of costs of uncertainty. The higher Risk<br />
Exposures are, the higher the uncertainty and volatility is. As Risk Exposures decrease, gaps<br />
become smaller and Total System Value becomes more predictable. There<strong>for</strong>e, the Proposed<br />
System is a much more risk-averse solution that delivers the same results when compared to<br />
Alternative 1. So it is a better solution, with same Total System Value, less volatility, higher<br />
predictability, and smaller Risk Exposures.<br />
Furthermore, the dotted line of Total System Value w/o Residual <strong>Cost</strong>s is shown to<br />
demonstrate the extent to which Residual Risks can have an affect on the Total System Value.<br />
CMU/SEI-2004-TN-045 21
When security solutions are highly effective (i.e., Bypass Rate is small), the gap between the<br />
two Total System Values will be small; otherwise the gap will be large. The gap between the<br />
two Total System Values represents the costs of the Residual Risks that the project’s available<br />
security solutions cannot mitigate. In order to reduce the Residual <strong>Cost</strong>s, the Acme Company<br />
needs to consider implementing medium- and low-priority recommendations.<br />
Values vs. Risk Exposures<br />
$40,000<br />
$20,000<br />
A1<br />
PS<br />
CS<br />
$0<br />
0.00% 20.00% 40.00% 60.00% 80.00% 100.00% 120.00%<br />
($20,000)<br />
PS<br />
A1<br />
"Total System Value"<br />
($40,000)<br />
($60,000)<br />
($80,000)<br />
($100,000)<br />
($120,000)<br />
($140,000)<br />
($160,000)<br />
A2<br />
CS<br />
Legend<br />
"Net Present Value of<br />
<strong>Project</strong>"<br />
Total System Value w/o<br />
Residual <strong>Cost</strong>s<br />
Proposed System<br />
Alternative 1<br />
Alternative 2<br />
Current System<br />
($180,000)<br />
Risk Exposures<br />
Figure 5: Values vs. Risk Exposures<br />
22 CMU/SEI-2004-TN-045
4 Lessons Learned<br />
4.1 Misuse Cases<br />
The <strong>Cost</strong>/<strong>Benefit</strong> <strong>Analysis</strong> <strong>Framework</strong> is built on misuse cases. Even though the generation<br />
and validation of misuse cases are not discussed in this report, the comprehensiveness of<br />
misuse cases will directly impact the accuracy of the results in the cost/benefit analysis. We<br />
have discovered that a cost/benefit analysis contributes to more clarification and better<br />
understanding of the project’s misuse cases. The average probabilities of occurrence and<br />
expected loss give insights into the prioritization of misuse cases when costs of risks are<br />
ranked. In addition, it provides quantifiable mapping from descriptions to implementation<br />
choices <strong>for</strong> architectural and policy recommendations. Understanding man-hour and capital<br />
expenditure requirements helps stakeholders plan the project with respect to their situations.<br />
4.2 Estimation of Losses<br />
The framework initially used estimated cost figures from the lower end of nationally<br />
surveyed losses <strong>for</strong> each Category of Threats. Later on, we worked with the Acme Company<br />
to come up with a set of loss figures <strong>for</strong> each misuse case per incident. We multiplied<br />
estimated frequencies (per year) by estimated incident losses (<strong>for</strong> all misuse cases in a<br />
category) to derive the Annualized Loss <strong>for</strong> each Category of Threats. Through this process<br />
we found that<br />
• Lower ends of nationally surveyed losses may be used as estimations <strong>for</strong> tangible losses<br />
(productivity loss, fixing cost, etc.).<br />
• Surveyed losses cannot sufficiently account <strong>for</strong> intangible losses (loss of reputation, loss<br />
of confidential data, etc.), since these values are highly company and project specific.<br />
• Intangible losses often exceed tangible losses <strong>for</strong> many Categories of Threats.<br />
• For small companies, loss of reputation may be a very important item of interest, and it<br />
can contribute significantly to intangible losses.<br />
There<strong>for</strong>e, <strong>for</strong> better accuracy, we highly recommend that losses are estimated <strong>for</strong> each<br />
misuse case.<br />
4.3 Estimation of <strong>Cost</strong>s<br />
Our experience is that the Acme Company strongly prefers the use of man-hours to estimate<br />
costs of implementation. Its senior technical and project leads make ef<strong>for</strong>t estimations in<br />
man-hours. The company provides average cost figures <strong>for</strong> employees in different roles.<br />
CMU/SEI-2004-TN-045 23
<strong>Cost</strong>s are then calculated on the number of man-hours multiplied by average hourly wage<br />
rates. We found this process of cost estimation to be very effective. We will strongly<br />
recommend this process in our future work.<br />
4.4 <strong>Cost</strong> Structures of Security Improvement <strong>Project</strong>s<br />
We found that the costs of ensuring policy compliance heavily dominate in the costs of<br />
implementation <strong>for</strong> virtually every Category of Threats. This suggests that security<br />
improvement projects are very human-ef<strong>for</strong>t intensive in their cost structures. The costs will<br />
be spread over the lifetime of these projects. Such costs are often seen as “hidden costs” that<br />
many companies traditionally have difficulties in quantifying. The framework can provide<br />
significant insight into the hidden costs of policy compliance by examining and then<br />
summing up the ef<strong>for</strong>ts <strong>for</strong> every recommendation. However, because costs are accumulated<br />
over multiple years, companies that take on security improvement projects need to look at<br />
their investments from a long-term perspective. The cost structures of security improvement<br />
projects will be determined primarily by the companies’ willingness to invest in their<br />
employees on security awareness and policy en<strong>for</strong>cement.<br />
4.5 Values of Security Improvement <strong>Project</strong>s<br />
The Acme Company’s most optimal Total System Value is still negative. There are two<br />
possible explanations <strong>for</strong> this phenomenon. First, Residual Risks still cost companies a<br />
certain amount. Real-life experiences have shown us that no security solution is 100%<br />
secure. There<strong>for</strong>e, even the best ef<strong>for</strong>t of security improvement may not reduce risks to zero.<br />
Second, security improvement may need to be viewed from a lose-less perspective rather<br />
than the profit-more perspective that typical IT projects are judged on. Lose-less is another<br />
way of profiting by minimizing the risks of having misuses and attacks.<br />
24 CMU/SEI-2004-TN-045
5 Conclusions<br />
The objective of the <strong>Cost</strong>/<strong>Benefit</strong> <strong>Analysis</strong> <strong>Framework</strong> is to provide a quantifiable financial<br />
analysis framework that small companies can apply on their security improvement projects.<br />
Within this scope, we show that unmitigated risks can be translated into costs, and we<br />
demonstrate the estimation methods <strong>for</strong> calculating costs of implementation <strong>for</strong> architectural<br />
and policy recommendations. Most importantly, we show through the example of the Acme<br />
Company that small companies can obtain optimal results <strong>for</strong> improving the security of their<br />
systems and the optimal results can be achieved with reasonable reductions in Risk<br />
Exposures. The reductions in Risk Exposures in turn enable small companies to have less<br />
volatility in their Total System Value. The increase in predictability of results by<br />
implementing optimal security solutions will enable small companies to profit from security<br />
improvements and to plan <strong>for</strong> future growth.<br />
CMU/SEI-2004-TN-045 25
6 Future Work<br />
There are several questions that drive future work on the <strong>Cost</strong>/<strong>Benefit</strong> <strong>Analysis</strong> <strong>Framework</strong>:<br />
• Can the Acme Company’s trend patterns be witnessed in other small companies and their<br />
security improvement projects?<br />
• How would the estimate values compare to empirical data if we were to follow through<br />
with the Acme Company over the lifetime of its project?<br />
• Are there any other variables that we have not accounted <strong>for</strong> in the framework? If so,<br />
why do they exist and how can we account <strong>for</strong> them?<br />
• What if Categories of Threats cannot be assumed to be independent from each other? So<br />
far we have assumed that the effects of mitigating threats in one category are negligible<br />
to the risks in other categories. If this assumption no longer holds, how do the resulting<br />
interdependencies affect the framework?<br />
• Can the framework be applied to larger companies?<br />
The overall goal of the framework is to provide a way <strong>for</strong> small companies to be able to<br />
accurately estimate the cost of their security improvement projects. By incorporating lessons<br />
learned from the Acme Company, we will strive in the future to<br />
• refine the estimation methods to facilitate further analysis<br />
• use the estimation methods with other companies to see if similar trend patterns exist<br />
• develop a general set of cost/benefit profiles and metrics <strong>for</strong> projects with different types<br />
of system architectures<br />
• design a spreadsheet to automate the cost/benefit calculations and to select the most<br />
optimal solution<br />
• <strong>for</strong>malize the relationship between the five metrics we proposed in Section 2.4<br />
26 CMU/SEI-2004-TN-045
References<br />
URLs are valid as of the publication date of this document.<br />
[Allen 99]<br />
[Camm 00]<br />
[NIST 04]<br />
[Richardson 03]<br />
[SANS 03]<br />
Allen, J.; Christie, A.; Fithen, W.; McHugh, J.; Pickel, J.; & Stoner,<br />
E. State of the Practice of Intrusion Detection Technologies<br />
(CMU/SEI-99-TR-028, ADA375846). Pittsburgh, PA: Software<br />
Engineering Institute, Carnegie Mellon University, 1999.<br />
http://www.sei.cmu.edu/publications/documents/99.reports/99tr028/<br />
99tr028app-a.html.<br />
Camm, Jeffrey D. & Evans, James R. Management Science &<br />
Decision Technology. South-Western College Publishing, 2000.<br />
National Institute of Standards and Technology. branch and bound.<br />
http://www.nist.gov/dads/HTML/branchNbound.html (2004).<br />
Richardson, Robert. 2003 CSI/FBI Computer Crime and Security<br />
Survey. Computer Security Institute.<br />
http://i.cmpnet.com/gocsi/db_area/pdfs/fbi/FBI2003.pdf (2003).<br />
SANS Institute. SANS Glossary of Terms Used in Security and<br />
Intrusion Detection.<br />
http://www.sans.org/resources/glossary.php#top (2003).<br />
CMU/SEI-2004-TN-045 27
28 CMU/SEI-2004-TN-045
REPORT DOCUMENTATION PAGE<br />
Form Approved<br />
OMB No. 0704-0188<br />
Public reporting burden <strong>for</strong> this collection of in<strong>for</strong>mation is estimated to average 1 hour per response, including the time <strong>for</strong> reviewing instructions, searching<br />
existing data sources, gathering and maintaining the data needed, and completing and reviewing the collection of in<strong>for</strong>mation. Send comments regarding<br />
this burden estimate or any other aspect of this collection of in<strong>for</strong>mation, including suggestions <strong>for</strong> reducing this burden, to Washington Headquarters<br />
Services, Directorate <strong>for</strong> in<strong>for</strong>mation Operations and Reports, 1215 Jefferson Davis Highway, Suite 1204, Arlington, VA 22202-4302, and to the Office of<br />
Management and Budget, Paperwork Reduction <strong>Project</strong> (0704-0188), Washington, DC 20503.<br />
1. AGENCY USE ONLY<br />
(Leave Blank)<br />
2. REPORT DATE<br />
November 2004<br />
3. REPORT TYPE AND DATES COVERED<br />
Final<br />
4. TITLE AND SUBTITLE<br />
5. FUNDING NUMBERS<br />
<strong>SQUARE</strong> <strong>Project</strong>: <strong>Cost</strong>/<strong>Benefit</strong> <strong>Analysis</strong> <strong>Framework</strong> <strong>for</strong> In<strong>for</strong>mation F19628-00-C-0003<br />
Security Improvement <strong>Project</strong>s in Small Companies<br />
6. AUTHOR(S)<br />
Nick (Ning) Xie<br />
7. PERFORMING ORGANIZATION NAME(S) AND ADDRESS(ES)<br />
Software Engineering Institute<br />
Carnegie Mellon University<br />
Pittsburgh, PA 15213<br />
9. SPONSORING/MONITORING AGENCY NAME(S) AND ADDRESS(ES)<br />
HQ ESC/XPK<br />
5 Eglin Street<br />
Hanscom AFB, MA 01731-2116<br />
11. SUPPLEMENTARY NOTES<br />
8. PERFORMING ORGANIZATION<br />
REPORT NUMBER<br />
CMU/SEI-2004-TN-045<br />
10. SPONSORING/MONITORING AGENCY<br />
REPORT NUMBER<br />
12A DISTRIBUTION/AVAILABILITY STATEMENT<br />
Unclassified/Unlimited, DTIC, NTIS<br />
13. ABSTRACT (MAXIMUM 200 WORDS)<br />
12B DISTRIBUTION CODE<br />
Many companies rely on historical data to build predictability models <strong>for</strong> cost/benefit justification of future<br />
projects. Un<strong>for</strong>tunately, <strong>for</strong> small companies, which generally do not have a process <strong>for</strong> collecting security<br />
data, the costs and the benefits of in<strong>for</strong>mation security improvement projects have been very difficult to<br />
estimate and justify. In addition, detailed attack data are simply not available to be used as references in cost<br />
estimations. Given these difficulties, many small companies choose to ignore entirely the security<br />
vulnerabilities in their systems, and many suffer the consequences of security breaches and significant<br />
financial loss. Small companies that do implement security improvement projects often have problems<br />
understanding the cost structures of their improvement initiatives and how to translate risk exposures into<br />
costs that can be passed on to their customers.<br />
To deal with the a<strong>for</strong>ementioned problems, this paper describes a general framework <strong>for</strong> hierarchical<br />
cost/benefit analysis aimed at providing acceptable estimations <strong>for</strong> small companies in their in<strong>for</strong>mation<br />
security improvement projects. The framework classifies misuse cases into categories of threats <strong>for</strong> which<br />
nationally surveyed risks and financial data are publicly available. For each category of threats, costs,<br />
benefits, baseline risks, and residual risks are estimated. The framework then generates all permutations of<br />
possible solutions and analyzes the most optimal approach to maximize the value of security improvement<br />
projects. The framework analyzes the problems from five dimensions: Total Implementation <strong>Cost</strong>s, Total<br />
System Value, Net <strong>Project</strong> Value, <strong>Benefit</strong>/<strong>Cost</strong> Ratio, and Risk Exposures. The final proposed system will be<br />
derived from the comparisons of these dimensions, taking into consideration each company’s specific<br />
situation.<br />
This report is one of a series of reports resulting from research conducted by the System Quality<br />
Requirements Engineering (<strong>SQUARE</strong>) Team as part of an independent research and development project of<br />
the Software Engineering Institute.
14. SUBJECT TERMS<br />
cost/benefit analysis, in<strong>for</strong>mation security improvement, in<strong>for</strong>mation<br />
security costs, misuse cases<br />
15. NUMBER OF PAGES<br />
40<br />
16. PRICE CODE<br />
17. SECURITY CLASSIFICATION<br />
OF REPORT<br />
Unclassified<br />
18. SECURITY CLASSIFICATION OF<br />
THIS PAGE<br />
Unclassified<br />
19. SECURITY CLASSIFICATION OF<br />
ABSTRACT<br />
Unclassified<br />
20. LIMITATION OF ABSTRACT<br />
NSN 7540-01-280-5500 Standard Form 298 (Rev. 2-89) Prescribed by ANSI Std. Z39-18 298-102<br />
UL