Stop, look, listen-Time to take a breather - French Chamber of ...
Stop, look, listen-Time to take a breather - French Chamber of ...
Stop, look, listen-Time to take a breather - French Chamber of ...

Create successful ePaper yourself
Turn your PDF publications into a flip-book with our unique Google optimized e-Paper software.
Consumer Brands & Retail<br />
Global luxury goods – Equity<br />
March 2012<br />
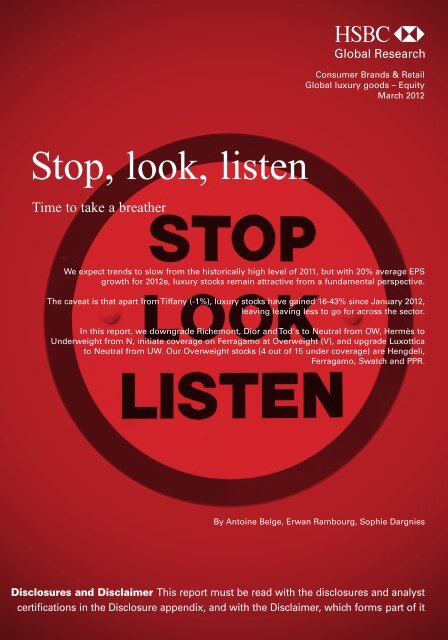
<strong>S<strong>to</strong>p</strong>, <strong>look</strong>, <strong>listen</strong><br />
<strong>Time</strong> <strong>to</strong> <strong>take</strong> a <strong>breather</strong><br />
We expect trends <strong>to</strong> slow from the his<strong>to</strong>rically high level <strong>of</strong> 2011, but with 20% average EPS<br />
growth for 2012e, luxury s<strong>to</strong>cks remain attractive from a fundamental perspective.<br />
The caveat is that apart from Tiffany (-1%), luxury s<strong>to</strong>cks have gained 16-43% since January 2012,<br />
leaving leaving less <strong>to</strong> go for across the sec<strong>to</strong>r.<br />
In this report, we downgrade Richemont, Dior and Tod's <strong>to</strong> Neutral from OW, Hermès <strong>to</strong><br />
Underweight from N, initiate coverage on Ferragamo at Overweight (V), and upgrade Luxottica<br />
<strong>to</strong> Neutral from UW. Our Overweight s<strong>to</strong>cks (4 out <strong>of</strong> 15 under coverage) are Hengdeli,<br />
Ferragamo, Swatch and PPR.<br />
By An<strong>to</strong>ine Belge, Erwan Rambourg, Sophie Dargnies<br />
Disclosures and Disclaimer This report must be read with the disclosures and analyst<br />
certifications in the Disclosure appendix, and with the Disclaimer, which forms part <strong>of</strong> it
Consumer Brands & Retail<br />
Global luxury goods<br />
March 2012<br />
abc<br />
Summary<br />
Our caution on luxury s<strong>to</strong>cks is linked <strong>to</strong> the sec<strong>to</strong>r’s strong run<br />
rather than fears about fundamentals (we forecast 20% average<br />
EPS growth for 2012e). Although the FTSE Eur<strong>of</strong>irst 300 has barely<br />
recovered its January 2010 level, the luxury goods sec<strong>to</strong>r has<br />
gained 60% in two years<br />
In terms <strong>of</strong> fundamentals, we are not concerned about the three main themes that the bears seem <strong>to</strong> be<br />
focusing on:<br />
1 China: Yes, China still is weighing on sentiment but we continue <strong>to</strong> believe this is a "red herring";<br />
2 Capex/opex/inven<strong>to</strong>ry levels have increased: this seems <strong>to</strong> be an accident waiting <strong>to</strong> happen for<br />
some, but is a sign <strong>of</strong> confidence for us<br />
3 M&A, with cash piling up, is seen as a risk <strong>to</strong> some investment cases, but we think that apart<br />
perhaps from LVMH, this should not be true.<br />
Although we think other consumer sub-sec<strong>to</strong>rs could suffer from macro threats (especially in Europe), strong<br />
barriers <strong>to</strong> entry and <strong>to</strong>urism flows should support the luxury goods industry. We forecast 20% average EPS<br />
growth for 2012e for our coverage (vs the Bloomberg consensus <strong>of</strong> 16%), driven by 10% average organic<br />
sales growth, favourable FX for the <strong>French</strong>, Italian and Swiss players, and modest operating leverage.<br />
Key data - Luxury Goods ratings and target prices<br />
S<strong>to</strong>ck<br />
_______ Rating ________<br />
Current<br />
share price __ Target price ___<br />
Potential<br />
return _________ PE (x)___________<br />
Implied 2013e<br />
PE (x)<br />
RIC New Old Currency (01/03/2012) New Old 2011e 2012e 2013e (based on<br />
target price)<br />
Hengdeli 3389.HK Overweight (V) unchanged HKD 3.42 4.75 4.20 38.9% 16.4 13.9 11.7 16.3<br />
Ferrragamo SFER.MI Overweight (V) initiation EUR 14.36 18.00 na 25.3% 28.0 21.3 15.2 19.0<br />
The Swatch Group UHR.VX Overweight unchanged CHF 408.90 500.00 465.00 22.3% 17.4 14.6 13.1 16.0<br />
PPR PRTP.PA Overweight unchanged EUR 128.60 150.00 142.00 16.6% 15.4 12.4 10.5 12.3<br />
Richemont* CFR.VX Neutral Overweight CHF 55.75 62.00 66.00 11.2% 21.2 16.6 14.6 16.2<br />
Burberry* BRBY.L Neutral unchanged GBP (p) 1,446.00 1,600.00 1,325.00 10.7% 24.6 20.5 17.8 19.7<br />
Christian Dior DIOR.PA Neutral Overweight EUR 118.25 130.00 122.00 9.9% 15.6 13.1 11.7 12.8<br />
Hugo Boss BOSGP.DE Neutral unchanged EUR 81.48 87.00 82.00 6.8% 19.8 16.5 14.5 15.5<br />
Luxottica LUX.MI Neutral Underweight EUR 26.89 28.50 19.50 6.0% 24.7 19.9 17.3 18.4<br />
Prada 1913.HK Neutral (V) unchanged HKD 43.80 48.00 39.00 9.6% 23.5 18.2 15.6 17.1<br />
LVMH LVMH.PA Neutral unchanged EUR 128.80 135.00 127.00 4.8% 20.7 17.8 15.9 16.7<br />
Coach* COH.N Neutral unchanged USD 76.74 80.00 59.00 4.2% 23.7 20.0 17.6 18.3<br />
Tod's TOD.MI Neutral Overweight EUR 77.80 81.00 80.00 4.1% 18.2 16.8 15.5 16.1<br />
Tiffany TIF.N Neutral unchanged USD 66.53 69.00 69.00 3.7% 18.2 17.8 15.2 15.7<br />
Hermès HRMS.PA Underweight Neutral EUR 283.55 272.00 240.00 -4.1% 50.8 42.9 38.3 36.7<br />
Average 20.5 17.1 14.7 16.4<br />
*Based on calendar data, **Averages do not include Hermès. Potential return equals the percentage difference between the current share price and the target price, including the forecast dividend yield when indicated.<br />
Source: Company data, HSBC estimates<br />
1
Consumer Brands & Retail<br />
Global luxury goods<br />
March 2012<br />
abc<br />
In this report, we downgrade Richemont, Christian Dior and Tod's <strong>to</strong> Neutral from Overweight, Hermès<br />
<strong>to</strong> Underweight from Neutral, initiate coverage on Ferragamo at Overweight (V), and upgrade Luxottica<br />
<strong>to</strong> Neutral from Underweight. Our Overweight s<strong>to</strong>cks (4 out <strong>of</strong> 15 under coverage) are Hengdeli,<br />
Ferragamo, Swatch and PPR. We change our target prices for all our s<strong>to</strong>cks (except Tiffany).<br />
Luxury goods calendar <strong>of</strong> events<br />
Company Type <strong>of</strong> event Date<br />
Burberry FY March 2012 sales 17-Apr-12<br />
Burberry FY March 2012 results 23-May-12<br />
Coach Q3 2012 results 23-Apr-12<br />
Hengdeli FY 2011 results 20-Mar-12<br />
Hermès FY 2011 results 22-Mar-12<br />
Hermès Q1 2012 sales 03-May-12<br />
Hugo Boss FY 2011 results 14-Mar-12<br />
Hugo Boss Q1 2012 results 26-Apr-12<br />
Luxottica Q1 2012 results 07-May-12<br />
LVMH Q1 2012 sales Mid April 12<br />
PPR Q1 2012 sales 26-Apr-12<br />
Prada FY 2011 results 29-Mar-12<br />
Richemont FY March 2012 results 16-May-12<br />
Salva<strong>to</strong>re Ferragamo FY 2011 results 15-Mar-12<br />
Salva<strong>to</strong>re Ferragamo Q1 2012 results 14-May-12<br />
Tiffany FY 2011 results 20-Mar-12<br />
Tiffany Q1 2012 results 21-May-12<br />
Tod’s FY 2011 results 13-Mar-12<br />
Tod’s Q1 2012 results 10-May-12<br />
FHS Data February 2012 period 22-Mar-12<br />
FHS Data March 2012/Q1 2012 period 24-Apr-12<br />
FHS Data April 2012 period 24-May-12<br />
FHS Data May period 21-Jun-12<br />
Source: Company data<br />
2
Consumer Brands & Retail<br />
Global luxury goods<br />
March 2012<br />
abc<br />
Contents<br />
<strong>Time</strong> <strong>to</strong> <strong>take</strong> a <strong>breather</strong> 5<br />
Initiation <strong>of</strong> coverage 13<br />
Ferragamo 14<br />
Investment cases 25<br />
Burberry 26<br />
Christian Dior 30<br />
Coach 34<br />
Hengdeli Holdings Ltd 38<br />
Hermès 42<br />
Hugo Boss 46<br />
Luxottica 50<br />
LVMH 54<br />
PPR 58<br />
Prada 62<br />
Richemont 66<br />
Swatch 70<br />
Tiffany 74<br />
Tod’s 78<br />
Disclosure appendix 85<br />
Disclaimer 88<br />
3
Consumer Brands & Retail<br />
Global luxury goods<br />
March 2012<br />
abc<br />
Summary <strong>of</strong> HSBC sales estimate changes and comparison with Bloomberg consensus<br />
____________ 2012e Sales _____________<br />
_____________2013e Sales ______________<br />
_____ HSBC ______ HSBC vs ______HSBC ______ HSBC vs<br />
(m) Curr. New Old Chg. Cons. consensus New Old Chg. Cons. consensus<br />
Burberry* GBP 2,080 1,940 7% 2,105 -1% 2,327 2,116 10% 2,387 -3%<br />
Christian Dior EUR 28,245 26,280 7% 26,966 5% 30,504 28,275 8% 28,879 6%<br />
Coach** USD 5,400 4,800 12% 5,394 0% 6,000 5,200 15% 5,973 0%<br />
Ferragamo*** EUR 1,170 nm nm 1,107 6% 1,300 nm nm 1,238 5%<br />
Hengdeli CNY 13,400 13,300 1% 13,281 1% 15,700 15,750 0% 15,754 0%<br />
Hermès EUR 3,300 3,082 7% 3,200 3% 3,628 3,456 5% 3,505 4%<br />
Hugo Boss EUR 2,300 2,219 4% 2,220 4% 2,500 2,422 3% 2,422 3%<br />
Luxottica EUR 7,084 6,432 10% 6,893 3% 7,689 6,803 13% 7,438 3%<br />
LVMH EUR 27,125 26,400 3% 26,423 3% 29,300 28,420 3% 28,569 3%<br />
PPR EUR 13,525 13,330 1% 13,220 2% 14,410 14,200 1% 14,087 2%<br />
Prada EUR 3,096 2,893 7% 3,028 2% 3,451 3,267 6% 3,535 -2%<br />
Richemont* EUR 9,325 9,400 -1% 9,367 0% 10,000 10,350 -3% 10,300 -3%<br />
The Swatch Group CHF 7,700 7,250 6% 7,480 3% 8,350 7,750 8% 8,128 3%<br />
Tiffany USD 3,760 3,760 0% 3,915 -4% 4,120 4,120 0% 4,282 -4%<br />
Tod's EUR 953 936 2% 949 0% 1,020 1,005 1% 1,020 0%<br />
* FY March n+1; ** FY June n+1; *** Initiated in this report Source: HSBC estimates, Bloomberg consensus<br />
Summary <strong>of</strong> HSBC EBIT estimate changes and comparison with Bloomberg consensus<br />
____________ 2012e EBIT _____________<br />
_____________ 2013e EBIT ______________<br />
_____ HSBC ______ HSBC vs ______HSBC ______ HSBC vs<br />
(m) Curr. New Old Chg. Cons. consensus New Old Chg. Cons. consensus<br />
Burberry* GBP 440 410 7% 427 3% 502 459 9% 489 3%<br />
Christian Dior EUR 6,167 5,683 9% 5,706 8% 6,807 6,297 8% 6,297 8%<br />
Coach** USD 1,780 1,480 20% 1,783 0% 2,000 1,600 25% 1,999 0%<br />
Ferragamo*** EUR 200 nm nm 182 10% 235 nm nm 216 9%<br />
Hengdeli CNY 1,472 1,482 -1% 1,470 0% 1,735 1,802 -4% 1,816 -4%<br />
Hermès EUR 1,023 915 12% 959 7% 1,143 1,050 9% 1,047 9%<br />
Hugo Boss EUR 466 424 10% 432 8% 524 482 9% 485 8%<br />
Luxottica EUR 990 885 12% 963 3% 1,120 970 15% 1,067 5%<br />
LVMH EUR 6,055 5,950 2% 5,890 3% 6,680 6,575 2% 6,458 3%<br />
PPR EUR 1,880 1,835 2% 1,788 5% 2,160 2,100 3% 2,010 7%<br />
Prada EUR 836 712 17% 737 13% 970 819 18% 904 7%<br />
Richemont* EUR 1,985 2,073 -4% 2,017 -2% 2,175 2,354 -8% 2,224 -2%<br />
The Swatch Group CHF 1,900 1,840 3% 1,812 5% 2,115 2,020 5% 2,022 5%<br />
Tiffany USD 748 748 0% 813 -8% 855 855 0% 894 -4%<br />
Tod's EUR 208 203 2% 204 2% 225 222 1% 225 0%<br />
* FY March n+1; ** FY June n+1; *** Initiated in this report Source: HSBC estimates, Bloomberg consensus<br />
Summary <strong>of</strong> HSBC EPS estimate changes and comparison with Bloomberg consensus<br />
____________ 2012e EPS _____________ _____________ 2013e EPS_______________<br />
_____ HSBC ______ HSBC vs ______HSBC ______ HSBC vs<br />
(m) Curr. New Old Chg. Cons. consensus New Old Chg. Cons. consensus<br />
Burberry* GBP 73.17 68.23 7% 71.24 3% 84.17 77.12 9% 80.25 5%<br />
Christian Dior EUR 9.01 8.11 11% 8.10 11% 10.13 9.25 10% 9.16 11%<br />
Coach** USD 4.10 3.32 24% 4.09 0% 4.64 3.61 28% 4.80 -3%<br />
Ferragamo*** EUR 0.67 nm nm 0.56 20% 0.95 nm nm 0.76 24%<br />
Hengdeli CNY 0.20 0.20 0% 0.20 0% 0.24 0.25 -5% 0.25 -5%<br />
Hermès EUR 6.62 5.90 12% 5.97 11% 7.41 6.79 9% 6.68 11%<br />
Hugo Boss EUR 4.94 4.35 14% 4.56 8% 5.62 5.00 12% 5.13 10%<br />
Luxottica EUR 1.35 1.21 12% 1.20 13% 1.55 1.35 15% 1.36 14%<br />
LVMH EUR 7.22 7.26 -1% 7.07 2% 8.08 8.18 -1% 7.95 2%<br />
PPR EUR 10.33 9.76 6% 9.28 11% 12.20 11.47 6% 10.86 12%<br />
Prada EUR 0.23 0.20 17% 0.20 17% 0.27 0.23 18% 0.26 5%<br />
Richemont* EUR 2.95 3.08 -4% 2.91 1% 3.24 3.50 -7% 3.25 0%<br />
The Swatch Group CHF 27.95 26.86 4% 26.55 5% 31.21 29.55 6% 29.61 5%<br />
Tiffany USD 3.74 3.74 0% 3.92 -5% 4.39 4.39 0% 4.56 -4%<br />
Tod's EUR 4.63 4.54 2% 4.57 1% 5.03 4.99 1% 5.15 -2%<br />
* FY March n+1; ** FY June n+1; *** Initiated in this report **** HSBC EPS for PPR include discontinued business ***** HSBC EPS for Luxottica is before trade-mark amortisation Source: HSBC estimates, Bloomberg consensus<br />
4
Consumer Brands & Retail<br />
Global luxury goods<br />
March 2012<br />
abc<br />
<strong>Time</strong> <strong>to</strong> <strong>take</strong> a <strong>breather</strong><br />
2012-13e organic sales growth rates <strong>to</strong> slow <strong>to</strong> 10% from the<br />
his<strong>to</strong>rically high level <strong>of</strong> 2011 (20%), but <strong>to</strong> remain above the<br />
7-8% long-term industry average<br />
High-end luxury more at risk, in our view (this is a potential risk<br />
for Richemont)<br />
The sec<strong>to</strong>r should deliver 20% average EPS growth in 2012e;<br />
after a c20% run in two months, we believe there is less <strong>to</strong> go for<br />
with most luxury s<strong>to</strong>cks<br />
2012-13e sales growth <strong>to</strong> be<br />
above-average, in our view<br />
2011 a his<strong>to</strong>rically high level<br />
The luxury goods s<strong>to</strong>cks in our universe posted<br />
organic sales growth <strong>of</strong> 20% in 2011 – an<br />
his<strong>to</strong>rically high level. Only 1999 and 2000 saw<br />
similar growth rates.<br />
Growth rates in Asia ex-Japan remained strong<br />
(35%), the US (24%) and Europe (12%) benefited<br />
from polarisation between high- and low-end<br />
goods, and <strong>to</strong>urism flows, and Japan (4%)<br />
stabilised despite the earthquake last March.<br />
Some signs <strong>of</strong> slowdown were witnessed in<br />
Q4 2011, but the organic sales growth average<br />
remained at a strong 16%.<br />
Our 2012 (10%) and 2013 (9%)<br />
organic growth forecasts still imply<br />
above-average rise<br />
For 2012, we expect a slowdown rather than a<br />
collapse in sales growth, as we <strong>take</strong> the view that<br />
Asian consumption, both local and travel-related,<br />
could put a floor under growth. We forecast the<br />
sec<strong>to</strong>r’s average organic sales growth rate <strong>to</strong> slow<br />
<strong>to</strong> 10% in 2012e and 9% in 2013e from the<br />
his<strong>to</strong>rically high level <strong>of</strong> 2011 (c20%), but <strong>to</strong><br />
remain above the 7-8% long-term industry average.<br />
On <strong>to</strong>p <strong>of</strong> this, FX effects should be favourable for<br />
European companies (apart from Burberry due <strong>to</strong><br />
the stronger GBP), adding on average c3% sales<br />
growth (based on current spot rates).<br />
Asia ex-Japan should start ‘normalising’<br />
For Asia ex-Japan, we expect growth <strong>to</strong> slow from<br />
c35% in 2011 <strong>to</strong> 20% in 2012; in other words, we<br />
do not foresee a collapse, rather the start <strong>of</strong> a<br />
‘normalisation’ now that the base is bigger.<br />
Given HSBC economists’ expectation <strong>of</strong><br />
continued robust growth in China in 2012 (8.6%<br />
GDP forecast), we believe the addressable market<br />
(ie people who can afford luxury goods) will grow<br />
at a slower pace, but that penetration <strong>of</strong> this<br />
addressable market (ie the number <strong>of</strong> people<br />
actually buying) will continue <strong>to</strong> increase thanks <strong>to</strong><br />
the expansion in distribution. Indeed, first-time<br />
buyers still account for c65% <strong>of</strong> sales <strong>of</strong> luxury<br />
brands in China (which should account for c30%<br />
<strong>of</strong> Asia ex-Japan sales in 2012e).<br />
5
Consumer Brands & Retail<br />
Global luxury goods<br />
March 2012<br />
abc<br />
Sales growth at constant forex and perimeter<br />
% FY98a FY99a FY00a FY01a FY02a FY03a FY04a FY05a FY06a FY07a FY08a FY09a FY10a Q111a Q211a Q311a Q411e FY11e FY12e FY13e<br />
Hermès 6 15 14 8 6 8 12 7 8 11 9 4 19 21 22 18 14 18 13 10<br />
LVMH -9 10 8 4 4 4 11 11 12 13 7 -3 14 14 15 15 12 14 9 8<br />
o/w Louis Vuit<strong>to</strong>n 2 25 20 12 7 14 13 12 11 14 12 7 15 12 14 17 15 15 8 8<br />
Richemont** 8 14 13 0 0 0 13 17 16 16 2 -5 19 13 35 37 24 27 5 7<br />
Swatch Group 9 7 12 1 1 1 6 8 12 17 4 -8 22 23 25 21 19 22 12 8<br />
Burberry** na na 40 14 12 15 10 3 15 19 7 1 15 10 24 26 21 21 13 12<br />
Gucci brand 7 14 24 1 -8 4 13 18 17 11 4 -1 11 20 23 21 12 19 9 8<br />
Hengdeli na na na na na na na na na na 20 7 39 na 46* na 30* 37 19 17<br />
Prada na na na na na na na na na na na -6 24 na 24* na 29* 27 16 12<br />
Tod's na na 15 27 13 8 15 20 14 17 9 0 9 16 17 14 8 14 5 7<br />
Luxottica na na na na 3 -2 11 11 14 10 -1 -4 7 9 10 10 11 10 10 9<br />
Tiffany na na 13 0 4 14 8 9 11 13 -4 -5 12 16 24 17 6 15 4 10<br />
Coach*** na na 12 21 32 37 29 26 29 20 -1 9 15 15 11 15 15 15 12 11<br />
Hugo Boss na na na na na na 13 12 14 12 6 -8 5 19 29 16 17 19 10 9<br />
Ferragamo na na na na na na na na na na na -10 17 26 34 19 20 24 14 11<br />
*half-year **year ending March n+1 ***year ending June n+1<br />
Source : Company data, HSBC estimates<br />
Luxury goods: contribution <strong>of</strong> each geographic region <strong>to</strong> organic sales growth<br />
2007a 2008a 2009a 2010a 2011a 2012e 2013e<br />
Geographic breakdown<br />
Europe 42% 42% 39% 36% 34% 33% 31%<br />
Japan 12% 12% 11% 9% 8% 8% 7%<br />
US 20% 19% 18% 18% 18% 17% 16%<br />
China 3% 5% 6% 8% 10% 12% 13%<br />
Rest <strong>of</strong> Asia & other 22% 23% 25% 28% 29% 31% 32%<br />
Total 100% 100% 100% 100% 100% 100% 100%<br />
Organic sales growth rate<br />
Europe 13% 5% -7% 9% 12% 5% 4%<br />
Japan 6% -9% -15% -4% 4% 2% 1%<br />
US 16% 2% -14% 14% 24% 4% 6%<br />
China 40% 45% 30% 45% 47% 33% 25%<br />
Rest <strong>of</strong> Asia & other 22% 13% 8% 23% 27% 16% 12%<br />
Total 15% 6% -4% 15% 20% 10% 9%<br />
Contribution <strong>to</strong> growth<br />
Europe 5.1% 1.9% -2.8% 3.1% 4.4% 1.6% 1.3%<br />
Japan 0.9% -1.1% -1.8% -0.5% 0.4% 0.2% 0.1%<br />
US 3.5% 0.3% -2.7% 2.4% 4.3% 0.7% 1.0%<br />
China 1.2% 1.5% 1.4% 3.4% 3.6% 3.2% 2.9%<br />
Rest <strong>of</strong> Asia & other 4.7% 2.9% 1.8% 6.4% 7.8% 4.7% 3.7%<br />
Total 15% 6% -4% 15% 20% 10% 9%<br />
Source: Company data, HSBC estimates<br />
6
Consumer Brands & Retail<br />
Global luxury goods<br />
March 2012<br />
abc<br />
Less pessimistic on the US than before<br />
In the US, we believe the psychological aspect <strong>of</strong><br />
the ‘feel-good fac<strong>to</strong>r’ influences purchasing<br />
patterns more than the financial aspect.<br />
So far, there has not been any psychological shock<br />
equivalent <strong>to</strong> the collapse <strong>of</strong> Lehman in September<br />
2008, which explains why trends in luxury<br />
consumption in the US have continued <strong>to</strong><br />
outperform overall consumer trends. However, we<br />
expect that high-end consumers are likely <strong>to</strong> prove<br />
less psychologically resilient in 2012 than in 2011<br />
unless economic conditions improve. The<br />
magnitude <strong>of</strong> the slowdown we forecast in the US<br />
(4% organic growth in 2012 after a 24% increase in<br />
2011) is less severe than we expected back in<br />
Oc<strong>to</strong>ber 2011 (-5%) when we thought that the<br />
August 2011 market slump would <strong>take</strong> a heavier <strong>to</strong>ll<br />
on luxury goods demand. We expect this slowdown<br />
<strong>to</strong> be more pronounced in Q2 and Q3 2012.<br />
Europe: cautious on local demand, still<br />
confident that <strong>to</strong>urist demand will hold up<br />
Europe is the only region where some luxury<br />
companies were already reporting slowing trends<br />
in Q3 2011. In 2012, we think the fragile debt<br />
situation and weaker GDP performance are likely<br />
<strong>to</strong> <strong>take</strong> a more severe <strong>to</strong>ll on local consumption.<br />
However, we expect some protection <strong>to</strong> come from<br />
<strong>to</strong>urism inflows (notably from Asia), which could<br />
account for between 35% and 60% <strong>of</strong> sales,<br />
depending on the company. We are fac<strong>to</strong>ring in<br />
5% organic sales growth for our coverage in<br />
Europe for 2012 (vs 12% in 2011), implying a mid<br />
single-digit decline in sales for local consumers<br />
and a mid-teens increase in <strong>to</strong>urist-related sales.<br />
Japan: stabilisation <strong>to</strong> hold up<br />
In spite <strong>of</strong> the March 2011 disaster, Japanese<br />
trends were slightly positive for most players in<br />
our coverage last year. We expect this<br />
stabilisation <strong>to</strong> continue in 2012 (2% average<br />
organic growth vs 4% in 2011).<br />
High-end luxury more at risk,<br />
in our view<br />
Note that we have become cautious on high-end<br />
luxury consumption (notably for watches), which<br />
we believe will be more vulnerable <strong>to</strong> changes in<br />
the psychological aspect <strong>of</strong> the ‘feel-good fac<strong>to</strong>r’<br />
(as was the case in the 2008-2009 downturn).<br />
Swatch recently mentioned it had witnessed lower<br />
growth rates for the higher-end <strong>of</strong> its portfolio in<br />
mainland China, but we believe the company most<br />
at risk is Richemont (48% <strong>of</strong> sales in watches,<br />
c80% high-end), which is the main reason behind<br />
our rating downgrade <strong>to</strong> Neutral from Overweight.<br />
Exposure <strong>to</strong> high-end watches: Richemont vs Swatch (2011)<br />
as a % <strong>of</strong> <strong>to</strong>tal sales Richemont Swatch<br />
High-end watches* 39% 30%<br />
Mid & low-end watches 9% 44%<br />
Other businesses 51% 26%<br />
Total 100% 100%<br />
* Includes:<br />
For Richemont: specialist watchmakers excl. Baume & Mercier, 80% <strong>of</strong> Cartier watch sales<br />
For Swatch: Breguet, Blancpain, Glasshütte, Léon Ha<strong>to</strong>t, Jacquet Droz, 50% <strong>of</strong> Omega sales<br />
Source: HSBC estimates<br />
7
Consumer Brands & Retail<br />
Global luxury goods<br />
March 2012<br />
abc<br />
Luxury Goods companies - 2011 geographical sales breakdown<br />
Europe Americas Japan Asia & others Mainland China HK + Taiwan + Macau Rest <strong>of</strong> Asia & Others<br />
Hermès 37% 16% 17% 30% 7% 13% 10%<br />
Richemont* 35% 14% 10% 41% 12% 17% 12%<br />
LVMH 33% 22% 8% 37% 10% 9% 18%<br />
<strong>of</strong> which Louis Vuit<strong>to</strong>n 25% 19% 16% 40% 11% 13% 16%<br />
PPR 32% 19% 12% 36% 7% 7% 22%<br />
<strong>of</strong> which Gucci Brand 25% 21% 14% 40% 12% 11% 17%<br />
Burberry* 34% 25% 4% 37% 10% 9% 18%<br />
Tod's 70% 7% 4% 19% 5% 7% 7%<br />
The Swatch Group 34% 8% 2% 56% 19% 19% 18%<br />
Luxottica 23% 61% 2% 14% 2% 1% 11%<br />
Ferragamo 24% 27% 13% 36% 10% 10% 16%<br />
Hugo Boss 60% 22% 2% 16% 9% 2% 5%<br />
European average 38% 22% 7% 32% 9% 9% 14%<br />
Coach** 1% 72% 17% 10% 3% 3% 4%<br />
Tiffany*** 11% 49% 17% 22% 5% 8% 9%<br />
Hengdeli 0% 0% 0% 100% 69% 31% 0%<br />
Prada*** 37% 14% 10% 39% 11% 11% 17%<br />
Total average 31% 25% 8% 35% 12% 11% 12%<br />
Note: this average including PPR (rather than the Gucci Group) *FY March 12 **FY June 12 ***FY Jan 2012<br />
Source: company data, HSBC estimates<br />
Sales by nationality <strong>of</strong> consumer (2011)<br />
Louis Vuit<strong>to</strong>n brand Gucci Group Burberry* Richemont Swatch Prada<br />
Western Europe 10% 14% 10% 10% 13% 14%<br />
East Europe 4% 3% 4% 4% 3% 3%<br />
Middle East 7% 5% 6% 10% 9% 4%<br />
Japan 19% 15% 24% 12% 4% 13%<br />
Asia ex Japan 43% 44% 35% 52% 63% 52%<br />
North America 14% 17% 18% 9% 4% 12%<br />
Latam 4% 3% 3% 4% 3% 2%<br />
Total 100% 100% 100% 100% 100% 100%<br />
*For Burberry, figures are based on sales at retail equivalent<br />
Source: companies, HSBC estimate<br />
EBIT margin evolution by group 1995a-2013e<br />
% FY95a FY96a FY97a FY98a FY99a FY00a FY01a FY02a FY03a FY04a FY05a FY06a FY07a FY08a FY09a FY10a FY11e FY12e FY13e<br />
Hermès 17.9 18.0 20.6 20.7 20.7 25.0 25.0 25.8 27.1 26.8 26.9 26.5 25.5 25.5 24.2 27.8 30.4 31.0 31.5<br />
Luxottica na na na na na 17.1 16.7 18.9 15.3 15.1 14.1 16.2 16.8 14.4 11.4 12.3 13.0 14.0 14.6<br />
Tiffany*** na 11.9 13.7 13.7 18.1 20.0 19.3 18.7 17.8 13.4 16.0 15.7 14.5 16.5 16.3 19.8 20.8 19.9 20.8<br />
Burberry* na na na na 8.2 16.1 18.1 19.7 21.1 22.5 20.8 21.8 20.7 15.0 17.2 20.1 20.7 21.2 21.6<br />
Tod's na na na na na 14.1 17.6 17.7 11.8 15.9 17.9 19.8 19.3 17.8 17.7 20.3 21.5 21.8 22.0<br />
LVMH 24.5 22.6 17.3 17.1 18.1 16.9 12.8 15.8 18.2 19.0 19.7 20.7 21.6 21.1 19.7 21.3 22.2 22.3 22.8<br />
Gucci brand 24.2 27.2 24.3 23.0 24.4 27.0 30.5 28.9 27.9 26.6 26.9 29.1 29.7 28.3 27.3 28.7 30.2 31.0 31.8<br />
Hugo Boss na na na na na na na na na 11.6 12.4 12.3 13.5 11.3 10.1 15.3 19.4 20.3 21.0<br />
Ferragamo na na na na na na na na na na na na 11.3 9.2 5.9 11.1 15.7 17.1 18.1<br />
Swatch Group 10.3 9.6 13.4 13.5 14.1 16.0 15.4 15.6 14.9 16.6 17.1 20.2 21.9 21.2 17.6 23.5 23.9 24.7 25.3<br />
Richemont* 16.5 16.6 16.1 16.9 18.3 19.3 13.3 9.6 9.1 13.2 16.6 18.6 20.9 17.9 16.0 19.7 21.5 21.3 21.8<br />
Coach** na na na na 10.4 16.9 18.6 25.6 33.6 33.5 35.1 38.0 37.1 31.0 31.9 31.4 32.3 33.0 33.3<br />
Hengdeli na na na na na na na 2.9 7.2 11.0 14.5 13.1 12.6 9.9 9.8 10.0 11.1 11.0 11.1<br />
Prada*** na na na na na na na na na na na 7.4 42.6 11.6 12.0 20.2 25.1 27.0 28.1<br />
Average 18.7 17.7 17.6 17.5 16.5 18.8 18.7 19.6 19.7 19.5 20.3 21.7 21.1 19.1 17.9 20.9 22.6 23.1 23.7<br />
*year ending March n+1 **year ending June n+1 *** year ending January n+1<br />
Source : Company data, HSBC estimates<br />
8
Consumer Brands & Retail<br />
Global luxury goods<br />
March 2012<br />
abc<br />
Cost <strong>of</strong> doing business and<br />
M&A fears: two bear<br />
arguments we don’t agree with<br />
On <strong>to</strong>p <strong>of</strong> China fears, there are two other bears<br />
arguments that we do not agree with: we see the<br />
rise in capex/opex/inven<strong>to</strong>ry as a sign <strong>of</strong><br />
confidence rather than a threat, and we believe<br />
M&A fears are overstated for would-be preda<strong>to</strong>rs,<br />
apart perhaps from LVMH.<br />
We see the rise in<br />
capex/opex/inven<strong>to</strong>ry as a sign <strong>of</strong><br />
confidence rather than a threat<br />
On 24 June 2011, we wrote a report titled A <strong>to</strong>pline<br />
rather than a leverage s<strong>to</strong>ry, in which we<br />
cautioned inves<strong>to</strong>rs that the theoretical operating<br />
leverage <strong>of</strong> the above-average <strong>to</strong>p-line growth we<br />
were forecasting for 2011 might not be reflected<br />
in EBIT margins as companies seemed willing <strong>to</strong><br />
reinvest for the long term.<br />
Indeed, <strong>look</strong>ing at the companies that have<br />
already reported 2011 margins, the his<strong>to</strong>rically<br />
high <strong>to</strong>p-line growth did not translate in<strong>to</strong><br />
spectacular EBIT margin expansion apart<br />
from Hugo Boss.<br />
Operating leverage <strong>of</strong> luxury companies*<br />
Sales grth (%) EBIT grth (%) EBIT marg. evol. (bps)<br />
LVMH 16% 22% 98<br />
PPR luxury division 23% 34% 214<br />
The Swatch Group 11% 12% 35<br />
Luxottica 7% 13% 70<br />
Hugo Boss 19% 51% 412<br />
*Those that have already reported 2011 earnings<br />
Source: Company data<br />
A bearish reaction <strong>to</strong> these announcements would<br />
be <strong>to</strong> assume that the cost <strong>of</strong> doing business in the<br />
luxury industry is rising. We disagree since we<br />
believe the current strong trends enjoyed by the<br />
luxury industry are driven by genuine demand<br />
from consumers rather than by a marketing push<br />
led by brands. In all markets except Japan,<br />
demand exceeded supply in spite <strong>of</strong> the significant<br />
price increases (c10% on average) in 2011. This<br />
means that luxury companies could easily, in our<br />
view, generate much higher EBIT margin over<br />
2011-2014 by investing less, and this without<br />
damaging their <strong>to</strong>p-line growth during the period.<br />
However, as has <strong>of</strong>ten been the case in previous<br />
bull phases <strong>of</strong> the luxury industry, when this has<br />
translated in<strong>to</strong> above-average <strong>to</strong>p-line growth,<br />
luxury companies (most <strong>of</strong> which are familycontrolled)<br />
are moni<strong>to</strong>ring their earnings<br />
growth rates rather than the pace <strong>of</strong> the<br />
EBIT margin expansion.<br />
Luxury companies: ranking by 2012e operating leverage<br />
Reported sales growth EBIT growth Operating leverage (x) EBIT margin gain (bp) EPS growth<br />
Luxottica 14% 23% 1.6 100 24%<br />
PPR 11% 17% 1.6 80 24%<br />
Ferragamo 19% 29% 1.6 138 31%<br />
Prada*** 19% 28% 1.5 189 29%<br />
Hugo Boss 12% 17% 1.4 86 20%<br />
The Swatch Group 14% 18% 1.3 81 19%<br />
Tod's 7% 8% 1.2 28 8%<br />
Burberry* 13% 16% 1.2 48 18%<br />
Coach** 13% 15% 1.2 67 15%<br />
Hermès 16% 18% 1.1 60 19%<br />
Christian Dior 15% 15% 1.1 15 19%<br />
LVMH 15% 15% 1.0 8 16%<br />
Hengdeli 19% 18% 1.0 -8 19%<br />
Richemont* 9% 8% 0.9 -20 23%<br />
Tiffany*** 3% -1% -0.3 -86 2%<br />
Average 14% 17% 1.2 52 20%<br />
*year ending March n+1 **year ending June n+1 *** year ending January n+1<br />
Source : Company data, HSBC estimates<br />
9
Consumer Brands & Retail<br />
Global luxury goods<br />
March 2012<br />
abc<br />
We thus anticipate operating leverage (EBIT<br />
growth divided by sales growth) <strong>of</strong> 1.2x on<br />
average in 2012e. This would not prevent EBIT<br />
and EPS from rising by 17% and 20% on average,<br />
respectively, as per our estimates.<br />
Nevertheless, we continue <strong>to</strong> believe that<br />
inves<strong>to</strong>rs should put higher valuation multiples on<br />
consumer goods companies whose earnings<br />
growth is driven by a strong <strong>to</strong>p line rather than<br />
cost savings.<br />
Apart from Tiffany, Richemont and Hengdeli, we<br />
expect all the luxury companies we cover <strong>to</strong> post<br />
higher margins in 2012e compared <strong>to</strong> 2011.<br />
M&A fears overstated (apart maybe<br />
from LVMH)<br />
Use <strong>of</strong> cash recurring theme<br />
Cash is piling up as a result <strong>of</strong> robust earnings<br />
growth and continued low capital intensity.<br />
Returning cash <strong>to</strong> shareholders is unlikely <strong>to</strong><br />
resolve the excess cash issue as buy-back<br />
programmes are limited since most luxury<br />
companies have a narrow free float.<br />
We thus believe that recurring M&A speculation<br />
in the press relating <strong>to</strong> the few companies with an<br />
almost 100% free float (Burberry, Tiffany, Coach)<br />
or the smaller-sized players (Tod’s, Ferragamo) is<br />
unlikely <strong>to</strong> go away.<br />
Following LVMH’s bid for Bulgari on 7 March<br />
2011, should we expect a new M&A phase in the<br />
sec<strong>to</strong>r after a decade <strong>of</strong> inaction? Probably not, as<br />
in our view:<br />
Potential acquirers are not the ones deciding<br />
the timing <strong>of</strong> acquisitions. Indeed, controlling<br />
shareholders have limited incentive <strong>to</strong> sell<br />
(unless there are succession or management<br />
issues) as they generate enough cash flow <strong>to</strong><br />
finance their development, and <strong>of</strong>ten enjoy<br />
managing the company.<br />
Synergies are limited, and can by no means<br />
be a significant fac<strong>to</strong>r driving an acquisition<br />
Targets which are available, sizeable and <strong>of</strong><br />
potential interest are scarce. Most recent deals<br />
have involved small-sized companies (sales <strong>of</strong><br />
less than EUR200m), which had limited interest<br />
for the listed companies under our coverage.<br />
Bulgari and Hermès may weigh on LVMH<br />
For LVMH, the M&A theme may weigh, not so<br />
much in terms <strong>of</strong> future deals, rather because <strong>of</strong><br />
the integration <strong>of</strong> Bulgari (acquired in 2011) and<br />
the future <strong>of</strong> the 22.4% s<strong>take</strong> in Hermès.<br />
In three years, Bulgari may be <strong>look</strong>ed upon as a<br />
fantastic addition if LVMH manages <strong>to</strong> make the<br />
brand a threat <strong>to</strong> Cartier, as it once was. In the<br />
meantime, we think the new management team<br />
will have <strong>to</strong> review strategy (eg distribution,<br />
product) very thoroughly <strong>to</strong> put the brand back on<br />
the high-end consumer’s radar. This, <strong>to</strong>gether<br />
with the fact that Bulgari has his<strong>to</strong>rically been<br />
more vulnerable than peers <strong>to</strong> economic<br />
downturns (the brand is not considered a reference<br />
in watches by retailers and consumers), is likely <strong>to</strong><br />
weigh on pr<strong>of</strong>itability short term. On the Hermès<br />
investment, while the interest <strong>of</strong> buying shares on<br />
a (very) long-term patrimonial view is clear (we<br />
can’t think <strong>of</strong> a brand in the space with higher<br />
differentiation and barriers <strong>to</strong> entry), on any<br />
shorter term view, returns on that investment are<br />
likely <strong>to</strong> be limited.<br />
Luxottica the only M&A winner<br />
Luxottica is, in our view, the only M&A winner.<br />
On <strong>to</strong>p <strong>of</strong> adding new licensing deals such as<br />
Coach or Armani (which can be considered the<br />
equivalent <strong>of</strong> an acquisition at zero cost),<br />
Luxottica has built a strong track record <strong>of</strong><br />
creating value via acquisitions. Although the days<br />
<strong>of</strong> transforming deals like Oakley in 2007 are<br />
probably behind us, smaller deals like Tecnol in<br />
Brazil or the acquisition <strong>of</strong> retail chains in<br />
emerging markets are still successful add-ons.<br />
10
Consumer Brands & Retail<br />
Global luxury goods<br />
March 2012<br />
abc<br />
After 25% run in two months,<br />
main issue for luxury is lack <strong>of</strong><br />
significant upside<br />
The caveat is that, apart from Tiffany (-1%), the<br />
luxury s<strong>to</strong>cks we cover have gained 16-43% since<br />
January 2012, outperforming regional indices.<br />
We are not <strong>to</strong>o concerned about absolute<br />
valuations, because the sec<strong>to</strong>r’s average 12-month<br />
rolling PE <strong>of</strong> c16x remains below the c17-18x<br />
his<strong>to</strong>rical average, or by relative valuation (which<br />
has been high for quite a while now without<br />
preventing luxury s<strong>to</strong>cks from outperforming).<br />
Our word <strong>of</strong> caution relates <strong>to</strong> the sec<strong>to</strong>r’s strong<br />
run rather than fears about fundamentals (we<br />
forecast 20% average EPS growth for 2012e).<br />
Although the FTSE Eur<strong>of</strong>irst 300 has barely<br />
recovered its January 2010 level, the luxury goods<br />
sec<strong>to</strong>r has gained 60% in two years.<br />
This leaves less room for possible short-term<br />
disappointments (bearing in mind that the basis <strong>of</strong><br />
comparison is especially high for Q2 and Q3).<br />
In Oc<strong>to</strong>ber 2011, we saw potential returns <strong>of</strong> at least<br />
25% based on our target prices for our Overweights.<br />
We now see more modest returns for our four<br />
Overweights (out <strong>of</strong> 15 s<strong>to</strong>cks): Hendgdeli (38.9%),<br />
Ferragamo (25.3%), Swatch (22.3%) and PPR<br />
(16.6%). Note: Potential return equals the<br />
percentage difference between the current share<br />
price and the target price, including the forecast<br />
dividend yield when indicated.<br />
Luxury goods sec<strong>to</strong>r performance vs FTSE Eur<strong>of</strong>irst 300<br />
280<br />
240<br />
200<br />
160<br />
120<br />
80<br />
40<br />
J an-02 Jan-04 Jan-06 J an-08 Jan-10 Jan-12<br />
Lux ury Goods Index<br />
Source: Thomson Reuters Datastream<br />
FT SE 300 Pric e Index<br />
Luxury goods sec<strong>to</strong>r absolute 12m forward PE<br />
25.0<br />
20.0<br />
15.0<br />
10.0<br />
5.0<br />
0.0<br />
2002 2003 2004 2005 2006 2007 2008 2009 2010 2011 2012<br />
Source: Thomson Reuters Datastream<br />
Average PE Luxury s<strong>to</strong>cks<br />
Luxury goods sec<strong>to</strong>r 12m forward PE relative <strong>to</strong> FTSE<br />
Eur<strong>of</strong>irst 300 index<br />
1.90<br />
1.70<br />
1.50<br />
1.30<br />
1.10<br />
0.90<br />
0.70<br />
0.50<br />
2002 2003 2004 2005 2006 2007 2008 2009 2010 2011 2012<br />
Average PE Luxury rel FTSE Eur<strong>of</strong>irst300 index<br />
Source: Thomson Reuters Datastream<br />
11
Consumer Brands & Retail<br />
Global luxury goods<br />
March 2012<br />
abc<br />
Share price performances – Luxury goods<br />
FY01 FY02 FY03 FY04 FY05 FY06 FY07 FY08 FY09 FY10 Q1 11 Q2 11 Q3 11 Q4 11 FY11 Q1 12TD*<br />
LVMH -35 -14 47 -2 33 7 3 -42 64 57 -9 11 -20 10 -11 18<br />
Hermes 15 -24 17 -4 44 35 -9 16 -7 68 -1 32 11 2 47 23<br />
Richemont -29 -16 15 27 52 24 10 -74 71 58 -3 4 -26 15 -14 18<br />
The Swatch Group -26 -23 29 12 17 37 27 -57 80 59 -3 4 -29 15 -17 18<br />
Christian Dior -32 -7 50 4 50 8 11 -55 78 49 -7 9 -22 8 -14 29<br />
Burberry nm -2 63 10 5 54 -12 -61 170 88 4 24 -19 1 6 22<br />
Tod's 6 -34 13 1 63 7 -22 -37 72 42 13 11 -31 -1 -15 23<br />
PPR -37 -52 9 -4 29 19 -3 -58 81 41 -9 13 -21 14 -7 16<br />
Luxottica 20 -32 9 9 43 9 -7 -42 42 26 1 -4 -13 13 -5 24<br />
Hugo Boss 90 -58 59 54 21 31 0 -58 70 130 4 19 -14 -6 1 43<br />
Ferragamo** nm nm nm nm nm nm nm nm nm nm 0 14 -3 2 13 41<br />
Average excluding Hermès -5 -26 33 12 35 22 1 -54 81 61 -1 11 -20 7 -6 25<br />
Euro<strong>to</strong>p 300 -18 -32 12 9 22 16 2 -45 26 7 0 -1 -17 8 -11 9<br />
Prada** nm nm nm nm nm nm nm nm nm nm nm 19 -30 5 -12 31<br />
Hengdeli nm nm nm nm nm 220 37 -73 268 57 -11 0 -34 -7 -46 39<br />
Hang Seng Index -24 -18 35 13 5 34 39 -48 52 5 2 -5 -21 5 -20 16<br />
Tiffany -1 -24 89 -29 20 2 17 -42 61 45 -1 28 -23 11 8 -1<br />
Coach 36 69 129 49 18 29 -29 -32 76 52 -6 23 -19 19 11 25<br />
S&P 500 -13 -23 26 9 3 14 4 -38 23 13 5 0 -14 11 0 9<br />
*Share prices at 1 March 2012 ** Prada's IPO on 23 June 2011, Ferragamo's IPO on the 18 June 2011<br />
Source: Thomson Reuters Datastream<br />
12
Consumer Brands & Retail<br />
Global luxury goods<br />
March 2012<br />
abc<br />
Initiation <strong>of</strong> coverage<br />
Ferragamo<br />
13
Consumer Brands & Retail<br />
Global luxury goods<br />
March 2012<br />
abc<br />
Ferragamo<br />
The strongest earnings growth pr<strong>of</strong>ile in our universe after Prada,<br />
driven by improvement in sub-par EBIT margin<br />
Valuation (15.2x 2013e PE) in line with peers despite higher<br />
earnings growth prospects in 2014e and beyond<br />
Initiate with Overweight (V) rating and target price <strong>of</strong> EUR18<br />
A margin catch-up s<strong>to</strong>ry<br />
Investment summary<br />
The Ferragamo investment case is relatively<br />
simple: this is a margin catch-up s<strong>to</strong>ry for a<br />
medium-sized mono brand (EUR1bn in sales in<br />
2011). Indeed, in spite <strong>of</strong> attractive products and<br />
geographic and distribution mixes, Ferragamo's<br />
EBIT margins lag those <strong>of</strong> 's<strong>of</strong>t' luxury peers<br />
(companies primarily involved in leather goods,<br />
apparel and shoes). Even if Ferragamo meets our<br />
2011 EBIT margin forecast <strong>of</strong> 15.7% when it<br />
reports on 15 March, this level <strong>of</strong> margin will<br />
remain well below peers (28.5% on average).<br />
We are confident that Ferragamo can narrow the<br />
gap with peers and register a 330bp EBIT margin<br />
enhancement over 2011-2014e (vs c200bp for<br />
peers) <strong>to</strong> reach 19% in 2014.<br />
We believe the analysis <strong>of</strong> the 330bp 2011-2014e<br />
EBIT margin improvement must be broken down<br />
in two parts:<br />
The improvement common <strong>to</strong> most luxury<br />
players, driven by geographic mix (faster than<br />
average growth in Asia where margins are<br />
higher) and distribution mix (faster than<br />
average growth <strong>of</strong> retail)<br />
The improvement specific <strong>to</strong> Ferragamo,<br />
driven by better execution. In 2011 there was<br />
evidence <strong>of</strong> the ongoing changes at the<br />
company: the EBIT margin gained 550bp in<br />
9M11 and we forecast a 460bp gain <strong>to</strong> 15.7%<br />
over the FY11 (consensus is at 15.4%).<br />
We initiate coverage <strong>of</strong> Ferragamo with an<br />
Overweight (V) rating. We like the ‘self-help’<br />
aspects <strong>of</strong> the fundamentals. In addition, based<br />
on our 2013 estimates, which are 9% above<br />
consensus at the EBIT level, Ferragamo is<br />
trading at 15.2x 2013e PE, in line with European<br />
peers excluding Hermès, in spite <strong>of</strong> superior<br />
earnings growth prospects in 2014e (EPS up 17%)<br />
and beyond. The 18 June 2011 IPO price was<br />
EUR9 per share, and since then the shares have<br />
risen 60% <strong>to</strong> EUR14.36 (as <strong>of</strong> 1 March 2012). In<br />
2012 y-t-d alone, the s<strong>to</strong>ck is up 41%. We believe<br />
this strong share price performance merely<br />
reflects what Ferragamo has been able <strong>to</strong> deliver<br />
in 2011, but still fails <strong>to</strong> reflect its catch-up<br />
potential, in our view.<br />
14
Consumer Brands & Retail<br />
Global luxury goods<br />
March 2012<br />
abc<br />
Attractive mixes already<br />
Strong Asian and US exposure<br />
Compared <strong>to</strong> peers, Ferragamo already has a high<br />
exposure <strong>to</strong> Asia (36% vs 31%), where pr<strong>of</strong>itability<br />
is above average for most players. In terms <strong>of</strong><br />
geographic exposure, the main difference is<br />
Ferragamo’s lower exposure <strong>to</strong> Europe (and <strong>to</strong><br />
Europe ex-Italy in particular, which only accounted<br />
for 15% <strong>of</strong> sales in 2011), which is compensated by<br />
a higher exposure <strong>to</strong> the Americas.<br />
We consider that Ferragamo’s growth rates in<br />
Asia should not differ materially from peers since<br />
the brand was one <strong>of</strong> the pioneers in the region<br />
(notably entering mainland China in 1994). The<br />
main specific growth opportunity for us lies in<br />
Western Europe ex-Italy, where the brand<br />
awareness is high but the brand image is<br />
somewhat dusty (Ferragamo cus<strong>to</strong>mers are on<br />
average much older in Western Europe than in<br />
Asia ex-Japan and the Americas). We believe<br />
current initiatives aimed at improving the in-s<strong>to</strong>re<br />
experience should enable Ferragamo <strong>to</strong> improve<br />
its brand image amongst Western European<br />
cus<strong>to</strong>mers (especially younger ones) and <strong>to</strong><br />
capitalise on its already strong image with<br />
emerging cus<strong>to</strong>mers when they travel <strong>to</strong> Europe.<br />
We believe that Ferragamo can also continue <strong>to</strong><br />
register above-average growth rates in the US,<br />
where it enjoys a high-end ‘red carpet’ image (cf<br />
the Oscars ceremony) and benefits from Latam<br />
<strong>to</strong>urist-related sales (we believe Ferragamo is<br />
ahead <strong>of</strong> European competi<strong>to</strong>rs in terms <strong>of</strong> brand<br />
awareness and desirability with Latam luxury<br />
consumers, since the brand entered the region at<br />
an earlier stage).<br />
Limited exposure <strong>to</strong> apparel, but below par<br />
pr<strong>of</strong>itability in retailing shoes and leather goods<br />
Ferragamo’s product mix already compares<br />
relatively well with the peer group average, with<br />
notably a lower exposure <strong>to</strong> apparel (10% <strong>of</strong><br />
sales), traditionally the least pr<strong>of</strong>itable product<br />
category for luxury players. Having said that, its<br />
exposure <strong>to</strong> the most pr<strong>of</strong>itable category – leather<br />
goods – is below the peer average (31% vs 53%)<br />
and its exposure <strong>to</strong> shoes (43% <strong>of</strong> sales) is the<br />
second largest in the industry behind Tod’s Group.<br />
Ferragamo vs peers FY11<br />
Ferragamo<br />
Average<br />
peer group<br />
Gucci<br />
brand<br />
Prada<br />
brand<br />
Tod's<br />
Group<br />
Hermès<br />
LV<br />
brand<br />
Bottega<br />
Veneta<br />
Burberry*<br />
Sales FY 2011 (EURm) 987 2,556 3,143 2,014 894 2,841 6,482 683 1,838<br />
Sales by product<br />
Footwear 43% 18% 13% 24% 72% 5% 3% 5% 5%<br />
Leather goods 31% 53% 56% 55% 16% 47% 85% 84% 25%<br />
Apparel 10% 19% 12% 20% 11% 27% 7% 7% 47%<br />
Other 15% 10% 19% 1% 0% 20% 5% 4% 23%<br />
Sales by region<br />
Europe 24% 38% 28% 40% 71% 37% 30% 27% 31%<br />
Americas 27% 16% 21% 14% 7% 16% 19% 16% 18%<br />
Japan 13% 15% 12% 10% 8% 17% 16% 20% 24%<br />
Asia-Pacific 36% 31% 39% 36% 14% 30% 35% 37% 27%<br />
Sales by distribution<br />
Wholesale 32% 23% 25% 23% 47% 19% 5% 22% 22%<br />
Retail 67% 75% 70% 77% 53% 81% 95% 75% 72%<br />
Licences & others 2% 2% 5% 0% 0% 0% 0% 3% 5%<br />
EBIT margin 2010 11.1% 26.1% 28.4% 22.3% 20.3% 27.8% 42.8% 25.5% 15.6%<br />
EBIT margin 2011e 15.7% 28.5% 30.2% 27.0% 21.5% 30.4% 43.9% 30.0% 16.8%<br />
EBIT margin 2012e 17.1% 29.3% 31.0% 28.9% 21.8% 31.0% 44.0% 31.0% 17.6%<br />
EBIT margin 2013e 18.1% 30.0% 31.8% 30.0% 22.0% 31.5% 44.2% 32.0% 18.4%<br />
EBIT margin 2014e 19.0% 30.5% 32.5% 30.5% 22.5% 31.8% 44.4% 32.8% 18.9%<br />
EBIT margin gain 2011-2014e (bp) 331 196 237 350 102 136 55 283 211<br />
*Burberry: in GPB, geographic breakdown based on sales at retail equivalent and EBIT margin excludes Licence<br />
Source: Company data, HSBC estimates<br />
15
Consumer Brands & Retail<br />
Global luxury goods<br />
March 2012<br />
abc<br />
Shoes is not an easy category in term <strong>of</strong><br />
pr<strong>of</strong>itability due <strong>to</strong> the need for different sizes for<br />
each SKU. Even for Tod’s Group, which we<br />
believe is achieving the highest pr<strong>of</strong>itability in<br />
shoes among the peer group, we estimate the<br />
EBIT margin was c19% in 2010 (vs 20.3% for the<br />
group as a whole). The higher level <strong>of</strong><br />
sophistication <strong>of</strong> Ferragamo’s shoes is a cost<br />
constraint, notably the fact that it is one <strong>of</strong> the<br />
very few brands <strong>of</strong>fering different widths for each<br />
whole and half size (4 for women’s and 3 for<br />
men’s), unless the brand is able <strong>to</strong> charge a<br />
premium for it. We believe this is the case when<br />
shoes are sold at full price, but far less so when<br />
they are on sale at 50%, which brings us <strong>to</strong> the<br />
issue <strong>of</strong> markdowns level.<br />
Ferragamo’s issues <strong>of</strong> lower pr<strong>of</strong>itability by<br />
product line and lower pr<strong>of</strong>itability in its retail<br />
s<strong>to</strong>re network are linked. In the luxury industry,<br />
EBIT margins in retail are usually 15-20<br />
percentage points higher than EBIT margins in<br />
wholesale, but Ferragamo – which already<br />
generates 67% <strong>of</strong> its sales in retail – does not<br />
seem <strong>to</strong> benefit from that yet.<br />
Ferragamo – s<strong>to</strong>re network<br />
Own Third party Total s<strong>to</strong>res<br />
2007a 252 251 503<br />
2008a 273 278 551<br />
2009a 299 268 567<br />
2010a 312 266 578<br />
2011e 323 270 593<br />
2012e 338 280 618<br />
2013e 353 290 643<br />
2014e 368 300 668<br />
Source: Company data, HSBC estimates<br />
In our view, the key way <strong>to</strong> improve s<strong>to</strong>re<br />
productivity will be <strong>to</strong> reduce the average level <strong>of</strong><br />
markdowns. This data is not disclosed by<br />
Ferragamo, but we believe it remains high<br />
compared <strong>to</strong> peers – even after two years <strong>of</strong><br />
improvement in 2010 and 2011.<br />
We believe achieving a higher share <strong>of</strong> sales at<br />
full price will require:<br />
A higher share <strong>of</strong> permanent (‘evergreen’)<br />
products, notably in handbags and shoes, or at<br />
least iconic styles that can be adapted from<br />
one season <strong>to</strong> another<br />
More high margin entry-level products<br />
(notably more small leather goods)<br />
Increased cross-selling opportunities through<br />
greater coherence between collections guided<br />
by a single design direction since June 2010<br />
Increased product continuity and availability<br />
in s<strong>to</strong>res via a s<strong>to</strong>ck replenishment<br />
programme aimed at au<strong>to</strong>matically managing<br />
the procurement and distribution <strong>of</strong> products.<br />
Better in-s<strong>to</strong>re merchandising<br />
Increasing the average size <strong>of</strong> s<strong>to</strong>res – which<br />
is well below that <strong>of</strong> peers – in order <strong>to</strong> better<br />
display the brand’s full range <strong>of</strong> products.<br />
Some <strong>of</strong> these requirements will be implemented<br />
through the roll-out <strong>of</strong> the next phases <strong>of</strong> project<br />
‘Marlin” initiated three years ago, which also<br />
aims <strong>to</strong> increase supply-chain efficiencies.<br />
We believe the management team is fully aware<br />
<strong>of</strong> these requirements. Some inves<strong>to</strong>rs argue that<br />
more positive changes should have already been<br />
visible since Michele Norsa (CEO) and Ernes<strong>to</strong><br />
Greco (CFO) joined Ferragamo in 2006 and 2007<br />
respectively. The 2008-2009 crisis – which hurt<br />
Ferragamo earnings much more than the peer<br />
group – was probably part <strong>of</strong> the explanation for<br />
the delay. Looking at it from a positive<br />
standpoint, this delay implies there is potential<br />
for improvement.<br />
2011 provided strong evidence <strong>of</strong> the ongoing<br />
changes at Ferragamo: we forecast a significant<br />
increase (460bp) in EBIT margin in 2011. In<br />
2012-2014, Ferragamo should benefit from the<br />
drivers common <strong>to</strong> the overall luxury industry<br />
(notably the Asian growth s<strong>to</strong>ry outlined in<br />
16
Consumer Brands & Retail<br />
Global luxury goods<br />
March 2012<br />
abc<br />
several <strong>of</strong> our reports: China Red Bull, dated<br />
10 January 2010 and Around the world, dated<br />
13 Oc<strong>to</strong>ber 2011). The specific elements<br />
described above will require consistently strong<br />
management execution.<br />
Shareholders’ structure<br />
As outlined on page 10 <strong>of</strong> this report, cash is piling<br />
up on the balance sheet <strong>of</strong> larger groups, which<br />
leads <strong>to</strong> smaller players being regularly put in play<br />
in the press. With six separate family groups<br />
involved in the shareholding <strong>of</strong> the company and<br />
25 members <strong>of</strong> the third generation in <strong>to</strong>tal,<br />
Ferragamo could in theory be seen as a potential<br />
M&A target. However, less than 12 months after<br />
the IPO, we do not believe a disposal <strong>of</strong> the<br />
family’s controlling s<strong>take</strong> is on the agenda (even<br />
though the 180-day lock-up period has now ended).<br />
Ferragamo – shareholding structure as <strong>of</strong> 1 March 2012<br />
Peter Woo<br />
6%<br />
Ferragamo<br />
Free Float<br />
Finanziaria<br />
25%<br />
58%<br />
Individual<br />
Family members<br />
11%<br />
Source: Company data<br />
Earnings, valuation and risks<br />
2011 results due 15 March 2012<br />
2011 sales were disclosed on 26 January 2012.<br />
They increased 26% <strong>to</strong> EUR987m, a 24% organic<br />
increase, boosted by a 2% FX impact. In Q4 2011<br />
alone, organic sales growth was 20%.<br />
Performances in Asia (22%) and Latam (37%)<br />
were strong, but growth rates in Europe (35%)<br />
and the US (21%) were even more remarkable in<br />
light <strong>of</strong> the macro-economic background. Japan<br />
remained sluggish (-8%).<br />
It is worth noting that 2011 was an atypical year<br />
in terms <strong>of</strong> sales growth by distribution network.<br />
Although retail outpaced wholesale in 2008-2010,<br />
this was the opposite in 2011 (organic sales<br />
growth was 38% in wholesale vs 19% in retail).<br />
This was a result <strong>of</strong>:<br />
Stellar growth in EM markets where<br />
Ferragamo is selling via the wholesale channel<br />
The late cyclicality <strong>of</strong> the wholesale<br />
channel, which <strong>to</strong>ok longer <strong>to</strong> recover from<br />
the 2009 slump<br />
Advanced deliveries in Q4 2011 ahead <strong>of</strong><br />
Chinese New Year, which occurred 12 days<br />
earlier this year than in 2011.<br />
In 2012 and beyond, management expects the<br />
retail/wholesale balance <strong>to</strong> remain broadly stable.<br />
On 15 March, we expect Ferragamo <strong>to</strong> report a<br />
79% increase in EBIT <strong>to</strong> EUR155m, a 460bp<br />
improvement <strong>to</strong> a 15.7% margin, driven by:<br />
A 130bp gross margin enhancement <strong>to</strong> 64.3%<br />
driven by positive geographic mix and a<br />
lower level <strong>of</strong> markdowns.<br />
A 230bp decline in the SG&A ratio (in spite<br />
<strong>of</strong> a EUR5m IPO charge penalising the ratio<br />
by 50bp), mostly coming from leverage on<br />
the fixed portion <strong>of</strong> sales and distribution<br />
costs (marketing & communication costs<br />
should have increased in line with sales).<br />
2011-2014e EBIT growth CAGR <strong>of</strong> 21%<br />
Our 2012-2014 forecasts call for organic sales<br />
growth <strong>of</strong> 14%, 11% and 10%, respectively and<br />
330bp EBIT margin gains over the period (the EBIT<br />
margin reaching 19% in 2014). The improvement in<br />
s<strong>to</strong>re pr<strong>of</strong>itability should, in our view, translate in<strong>to</strong><br />
a 150bp gross margin enhancement and 180bp<br />
SG&A leverage over the period.<br />
17
Consumer Brands & Retail<br />
Global luxury goods<br />
March 2012<br />
abc<br />
Franchise buy-back opportunities<br />
Like many <strong>of</strong> its luxury peers in the past,<br />
Ferragamo plans <strong>to</strong> buy back some <strong>of</strong> its thirdparty<br />
operated s<strong>to</strong>res (TPOP) over the medium<br />
term, as well as some <strong>of</strong> its minority interests.<br />
Ferragamo agreed <strong>to</strong> purchase on 1 January 2013<br />
25% <strong>of</strong> its China distribution JV with Imaginex<br />
for EUR41m, thereby increasing its ownership<br />
from 50% <strong>to</strong> 75%. The value <strong>of</strong> this future<br />
purchase obligation was recorded on the group’s<br />
net financial position for EUR39m. Note that<br />
Ferragamo has an option <strong>to</strong> buy the remaining<br />
25% in 2018. This JV manages c28 s<strong>to</strong>res out <strong>of</strong><br />
the 60 Ferragamo mono-brands s<strong>to</strong>res in mainland<br />
China, and operates as a wholesaler. The<br />
remaining c32 s<strong>to</strong>res are classified in wholesale<br />
(c11 airport locations and c21 s<strong>to</strong>res operated by<br />
third parties).<br />
Ferragamo has a call option <strong>to</strong> buy in December<br />
2012 the other 50% <strong>of</strong> its distribution JV with Li<br />
& Fung (0494.HK, HKD17.84, Overweight (V)<br />
rating) for Korea, Singapore, Malaysia and<br />
Thailand at book value plus the price <strong>of</strong> the<br />
building <strong>of</strong> the Seoul s<strong>to</strong>re. Our forecasts assume<br />
that Ferragamo will exercise its option for a <strong>to</strong>tal<br />
<strong>of</strong> EUR30m.<br />
As a consequence <strong>of</strong> these buy-backs, we<br />
forecast the share <strong>of</strong> minorities <strong>of</strong> <strong>to</strong>tal net pr<strong>of</strong>it<br />
<strong>to</strong> drop from 20% in 2011 and 2012 <strong>to</strong> 5% in 2013<br />
and beyond.<br />
Initiating at Overweight (V) – target price<br />
EUR18<br />
Like all the other s<strong>to</strong>cks under our coverage in<br />
luxury goods, we value Ferragamo based on a<br />
DCF. Our assumptions are detailed on page 23.<br />
We use a specific beta <strong>of</strong> 1.00 and a sec<strong>to</strong>r beta <strong>of</strong><br />
1.20, as with other s<strong>to</strong>cks under our coverage.<br />
Under our research model, for s<strong>to</strong>cks with a<br />
volatility indica<strong>to</strong>r, the Neutral band is 10<br />
percentage points above and below the hurdle rate<br />
for Europe ex-UK s<strong>to</strong>cks <strong>of</strong> 9.0%. Our target<br />
price <strong>of</strong> EUR18 provides a potential return <strong>of</strong><br />
25.3%, above the Neutral band <strong>of</strong> our model;<br />
therefore, we are initiating coverage <strong>of</strong> Ferragamo<br />
with an Overweight (V) rating. Potential return<br />
equals the percentage difference between the<br />
current share price and the target price, including<br />
the forecast dividend yield when indicated. Note<br />
that all s<strong>to</strong>cks with less than 12 months <strong>of</strong> trading<br />
his<strong>to</strong>ry are considered volatile by HSBC.<br />
Risks<br />
Risks include those common <strong>to</strong> most luxury s<strong>to</strong>cks,<br />
ie macro-economic conditions and the USD/EUR<br />
rate. Company-specific downside risks include<br />
failure <strong>to</strong> execute initiatives aiming at increasing<br />
s<strong>to</strong>re sales productivity and a placement <strong>of</strong> shares<br />
from Ferragamo family members.<br />
These buy-backs explain why we forecast EPS<br />
will grow much faster than EBIT in 2013<br />
(40% vs 17%).<br />
18
Consumer Brands & Retail<br />
Global luxury goods<br />
March 2012<br />
abc<br />
Ferragamo – P&L<br />
(EURm) 2007a 2008a 2009a 2010a 9M 2011a Q4 2011e 2011e 2012e 2013e 2014e<br />
Revenues 687.4 690.8 619.6 781.6 701.3 285.2 986.5 1,170.0 1,300.0 1,435.0<br />
COGS 260.6 271.9 256.1 289.4 252.4 99.8 352.2 411.9 451.1 490.8<br />
% <strong>of</strong> sales 37.9% 39.4% 41.3% 37.0% 36.0% 35.0% 35.7% 35.2% 34.7% 34.2%<br />
Gross pr<strong>of</strong>it 426.8 419.0 363.5 492.2 448.9 185.4 634.3 758.2 848.9 944.2<br />
Gross margin 62.1% 60.6% 58.7% 63.0% 64.0% 65.0% 64.3% 64.8% 65.3% 65.8%<br />
Operating expenses -349.4 -355.2 -327.1 -405.8 -335.8 -143.5 -479.4 -558.2 -613.9 -671.3<br />
% <strong>of</strong> sales -50.8% -51.4% -52.8% -51.9% -47.9% -50.3% -48.6% -47.7% -47.2% -46.8%<br />
Operating pr<strong>of</strong>it (EBIT) 77.4 63.8 36.5 86.4 113.1 41.9 155.0 200.0 235.0 273.0<br />
EBIT margin 11.3% 9.2% 5.9% 11.1% 16.1% 14.7% 15.7% 17.1% 18.1% 19.0%<br />
EBITDA 100.0 86.0 61.9 113.1 132.4 48.9 181.3 228.9 266.8 308.0<br />
EBITDA margin 14.5% 12.4% 10.0% 14.5% 18.9% 17.1% 18.4% 19.6% 20.5% 21.5%<br />
Net financial result -9.7 -0.4 -2.1 2.4 -3.8 1.0 -2.8 0.0 1.0 2.0<br />
Associates 0.3 0.8 0.4 0.5 0.6<br />
Pr<strong>of</strong>it before tax 67.9 64.2 34.8 89.3 110.0 42.9 152.2 200.0 236.0 275.0<br />
Income tax expense 20.8 25.3 49.5 28.5 31.6 12.4 44.1 58.0 68.4 79.7<br />
Effective tax rate 30.6% 39.5% 142.1% 31.9% 28.8% 29.0% 29.0% 29.0% 29.0% 29.0%<br />
Net pr<strong>of</strong>it for the period 47.1 38.9 -14.7 60.8 78.3 30.4 108.1 142.0 167.5 195.2<br />
o/w group 38.5 29.8 -20.9 48.9 62.7 24.3 86.4 113.6 159.2 185.5<br />
o/w minority interests* 8.7 9.1 6.2 11.9 15.6 6.1 21.6 28.4 8.4 9.8<br />
Diluted EPS (EUR) 0.22 0.22 -0.12 0.29 0.37 0.14 0.51 0.67 0.95 1.10<br />
Y-o-y change<br />
Net sales na 1% -10% 26% 28% 23% 26% 19% 11% 10%<br />
Operating expenses na 2% -8% 24% 18% 19% 18% 16% 10% 9%<br />
EBIT na -18% -43% 137% 93% 50% 79% 29% 17% 16%<br />
PBT na -5% -46% 157% 84% 45% 70% 31% 18% 17%<br />
Net income na -23% -170% -334% 78% 80% 77% 31% 40% 17%<br />
* As from 2013, we forecast share <strong>of</strong> minority interest <strong>to</strong> 5% from 20% <strong>of</strong> net pr<strong>of</strong>it<br />
Source: Company data, HSBC estimates<br />
19
Consumer Brands & Retail<br />
Global luxury goods<br />
March 2012<br />
abc<br />
Ferragamo - Split <strong>of</strong> sales<br />
(EURm) 2007a 2008a 2009a 2010a 9M 2011a Q4 2011e 2011e 2012e 2013e 2014e<br />
By region<br />
Europe 168 178 151 182 181 58 238 267 288 305<br />
North America 177 160 136 174 154 67 221 256 274 287<br />
Japan 134 124 111 127 92 36 128 140 143 146<br />
Asia-Pacific 176 202 194 268 249 109 358 457 535 626<br />
Central and South America 23 26 28 31 27 14 41 50 60 70<br />
Total 678 691 620 782 701 285 987 1,170 1,300 1,435<br />
Europe 25% 26% 24% 23% 26% 20% 24% 23% 22% 21%<br />
North America 26% 23% 22% 22% 22% 24% 22% 22% 21% 20%<br />
Japan 20% 18% 18% 16% 13% 13% 13% 12% 11% 10%<br />
Asia-Pacific 26% 29% 31% 34% 35% 38% 36% 39% 41% 44%<br />
Central and South America 3% 4% 4% 4% 4% 5% 4% 4% 5% 5%<br />
Total 100% 100% 100% 100% 100% 100% 100% 100% 100% 100%<br />
By distribution network<br />
Wholesale na 237 185 224 228 85 313 367 404 440<br />
Retail na 436 420 543 462 196 658 786 879 976<br />
Licenses and services na 11 7 7 6 2 8 9 10 11<br />
Property leases na 7 8 8 6 2 7 8 8 8<br />
Total na 691 620 782 701 285 987 1,170 1,300 1,435<br />
Wholesale na 34% 30% 29% 33% 30% 32% 31% 31% 31%<br />
Retail na 63% 68% 69% 66% 69% 67% 67% 68% 68%<br />
Licenses and services na 2% 1% 1% 1% 1% 1% 1% 1% 1%<br />
Property leases na 1% 1% 1% 1% 1% 1% 1% 1% 1%<br />
Total na 100% 100% 100% 100% 100% 100% 100% 100% 100%<br />
By product category<br />
Footwear na 252 241 319 302 121 423 496 544 593<br />
Leather goods na 223 196 244 216 93 309 378 431 487<br />
Apparel na 83 77 90 72 31 103 115 122 129<br />
Accessories na 68 58 67 53 26 78 96 109 123<br />
Perfumes na 46 35 46 47 11 58 69 77 84<br />
Licenses and services na 11 7 7 6 2 8 9 10 11<br />
Property leases na 7 8 8 6 2 7 8 8 8<br />
Total na 691 620 782 701 285 987 1,170 1,300 1,435<br />
Footwear na 37% 39% 41% 43% 42% 43% 42% 42% 41%<br />
Leather goods na 32% 32% 31% 31% 33% 31% 32% 33% 34%<br />
Apparel na 12% 12% 12% 10% 11% 10% 10% 9% 9%<br />
Accessories na 10% 9% 9% 8% 9% 8% 8% 8% 9%<br />
Perfumes na 7% 6% 6% 7% 4% 6% 6% 6% 6%<br />
Licenses and services na 2% 1% 1% 1% 1% 1% 1% 1% 1%<br />
Property leases na 1% 1% 1% 1% 1% 1% 1% 1% 1%<br />
Total na 100% 100% 100% 100% 100% 100% 100% 100% 100%<br />
Source: Company data, HSBC estimates<br />
20
Consumer Brands & Retail<br />
Global luxury goods<br />
March 2012<br />
abc<br />
Ferragamo - Balance sheet<br />
Year ending December (EURm) 2007a 2008a 2009a 2010a 2011e 2012e 2013e 2014e<br />
Property, plant and equipment 105 112 106 108 160 205 222 240<br />
Investment property 8 8 7 8 8 8 8 8<br />
Intangible assets with a finite useful life 12 14 14 15 15 15 15 15<br />
Investments in associated and jointly controlled companies 1 1 1 1 1 1 1 1<br />
Other non current assets 8 7 5 5 5 5 5 5<br />
Other financial assets 4 7 6 7 7 7 7 7<br />
Deferred tax assets 38 51 55 62 62 62 62 62<br />
Total non-current assets 175 200 194 205 258 303 319 337<br />
Inven<strong>to</strong>ries 148 192 162 183 231 274 304 336<br />
as a % <strong>of</strong> sales 21.5% 27.8% 26.2% 23.4% 23.4% 23.4% 23.4% 23.4%<br />
Trade receivables 62 66 57 75 106 123 138 152<br />
as a % <strong>of</strong> sales 9.0% 9.6% 9.3% 9.6% 10.7% 10.6% 10.6% 10.6%<br />
Tax receivables 7 11 5 6 6 6 6 6<br />
Other current assets 26 28 33 23 23 23 23 23<br />
Other current financial assets 0 3 1 1 1 1 1 1<br />
Cash and cash equivalents 65 78 77 133 107 107 157 207<br />
Total current assets 309 380 336 421 474 535 630 725<br />
Total assets 484 580 531 626 731 837 949 1062<br />
Total shareholders' equity 178 196 193 240 309 391 483 578<br />
Provisions for risks and charges 12 23 4 5 5 5 5 5<br />
Employee benefit liabilities 9 10 9 9 9 9 9 9<br />
Other non-current liabilities 22 27 41 34 34 34 34 34<br />
Non current financial liabilities 0 0 0 0 0 0<br />
Deferred tax liabilities 7 6 6 6 6 6 6 6<br />
Total non current liabilities 49 66 61 54 54 54 54 54<br />
Trade payables 100 94 77 104 140 164 183 202<br />
as a % <strong>of</strong> sales 14.5% 13.7% 12.5% 13.3% 14.2% 14.0% 14.1% 14.0%<br />
Interest-bearing loans & borrowings 118 165 158 151 151 151 151 151<br />
Provisions for risks and charges - current portion 0<br />
Tax payables 10 9 17 27 27 27 27 27<br />
Other current liabilities 27 49 24 49 49 49 49 49<br />
Other current financial liabilities 1 0 1 1 1 1 1 1<br />
Total current liabilities 257 318 277 332 368 392 412 430<br />
Total liabilities 306 384 337 386 422 446 466 484<br />
Total liabilities and shareholders’ equity 484 580 531 626 731 837 949 1062<br />
Source: Company data, HSBC estimates<br />
21
Consumer Brands & Retail<br />
Global luxury goods<br />
March 2012<br />
abc<br />
Cash flow statement<br />
Year ending Dec (EURm) 2007a 2008a 2009a 2010a 2011e 2012e 2013e 2014e<br />
EBIT 77.4 63.8 36.5 86.4 155.0 200.0 235.0 273.0<br />
Depreciation & amortisation 22.6 22.2 25.4 26.7 26.3 28.9 31.8 35.0<br />
Provision/Other 12.8 17.1 6.2 0.4 0.0 0.0 0.0 0.0<br />
Working capital change -29.6 -54.4 11.4 11.8 -41.8 -37.1 -25.6 -27.1<br />
Operational cash flow 83.2 48.6 79.4 125.4 139.5 191.8 241.2 280.9<br />
Interest paid -9.7 -0.4 -2.1 2.4 -2.8 0.0 1.0 2.0<br />
Interest received 0.0 0.0 0.0 0.0 0.0 0.0 0.0 0.0<br />
Taxation paid -20.8 -25.3 -49.5 -28.5 -44.1 -58.0 -68.4 -79.7<br />
HSBC cash flow 52.7 22.9 27.8 99.3 92.6 133.9 173.8 203.2<br />
Dividends paid -18.8 -8.0 -3.1 -25.9 -39.5 -59.6 -75.4 -100.3<br />
Capital expenditure -21.7 -28.1 -20.9 -21.8 -40.0 -44.0 -48.4 -53.2<br />
Fixed assets divested 0.6 2.8 0.2 0.3 0.0 0.0 0.0 0.0<br />
Acquisitions 0.0 0.1 0.0 0.0 -39.0 -30.0 0.0 0.0<br />
Shares issued 0.0 0.0 0.0 0.0 0.0 0.0 0.0 0.0<br />
Own shares purchased 0.0 0.0 0.0 0.0 0.0 0.0 0.0 0.0<br />
TOTAL cash flow 12.8 -10.4 4.0 51.9 -26.0 0.2 50.0 49.6<br />
Translation differences & other -66.7 -19.7 0.3 10.5 -0.6 0.0 0.0 0.0<br />
Change in net cash (debt) -53.9 -30.1 4.3 62.4 -26.6 0.2 50.0 49.6<br />
Source: Company data, HSBC estimates<br />
22
2<br />
5<br />
.<br />
3<br />
Consumer Brands & Retail<br />
Global luxury goods<br />
March 2012<br />
abc<br />
Financials & valuation: Salva<strong>to</strong>re Ferragamo<br />
Overweight (V)<br />
Financial statements<br />
Year <strong>to</strong> 12/2010a 12/2011e 12/2012e 12/2013e<br />
DCF analysis<br />
HSBC assumptions<br />
DCF, comprising<br />
Pr<strong>of</strong>it & loss summary (EURm)<br />
Revenue 782 987 1,170 1,300<br />
EBITDA 113 181 229 267<br />
Depreciation & amortisation -27 -26 -29 -32<br />
Operating pr<strong>of</strong>it/EBIT 86 155 200 235<br />
Net interest 2 -3 0 1<br />
PBT 89 152 200 236<br />
HSBC PBT 89 152 200 236<br />
Taxation -29 -44 -58 -68<br />
Net pr<strong>of</strong>it 48 86 114 159<br />
HSBC net pr<strong>of</strong>it 48 86 114 159<br />
Cash flow summary (EURm)<br />
Cash flow from operations 99 93 134 174<br />
Capex -22 -40 -44 -48<br />
Cash flow from investment -21 -79 -74 -48<br />
Dividends -26 -40 -60 -75<br />
Change in net debt -62 27 0 -50<br />
FCF equity 77 53 90 125<br />
Balance sheet summary (EURm)<br />
Intangible fixed assets 90 90 90 90<br />
Tangible fixed assets 115 168 213 229<br />
Current assets 420 472 533 629<br />
Cash & others 133 107 107 157<br />
Total assets 626 731 837 949<br />
Operating liabilities 224 260 284 304<br />
Gross debt 150 150 150 150<br />
Net debt 17 44 44 -6<br />
Shareholders funds 193 309 391 483<br />
Invested capital 268 363 445 487<br />
Ratio, growth and per share analysis<br />
Year <strong>to</strong> 12/2010a 12/2011e 12/2012e 12/2013e<br />
Y-o-y % change<br />
Revenue 26.1 26.2 18.6 11.1<br />
EBITDA 82.7 60.2 26.3 16.5<br />
Operating pr<strong>of</strong>it 137.0 79.3 29.1 17.5<br />
PBT 156.6 70.4 31.4 18.0<br />
HSBC EPS 78.3 31.4 40.1<br />
Ratios (%)<br />
Revenue/IC (x) 2.8 3.1 2.9 2.8<br />
ROIC 21.4 34.9 35.2 35.8<br />
ROE 28.5 34.4 32.4 36.4<br />
ROA 12.1 17.4 18.1 18.8<br />
EBITDA margin 14.5 18.4 19.6 20.5<br />
Operating pr<strong>of</strong>it margin 11.1 15.7 17.1 18.1<br />
EBITDA/net interest (x) 65.2<br />
Net debt/equity 7.2 14.2 11.2 -1.3<br />
Net debt/EBITDA (x) 0.2 0.2 0.2 0.0<br />
CF from operations/net debt 571.9 210.6 306.0<br />
Per share data (EUR)<br />
EPS Rep (fully diluted) 0.29 0.51 0.67 0.95<br />
HSBC EPS (fully diluted) 0.29 0.51 0.67 0.95<br />
DPS 0.14 0.25 0.32 0.45<br />
Book value 1.15 1.83 2.32 2.87<br />
Risk free rate (%) 3.00 EBIT growth 2011-21e CAGR (%) 13.7<br />
Equity Premium (%) 6.00 EBIT growth 2021-41e CAGR (%) 4.0<br />
Sec<strong>to</strong>r beta 1.20 Fading period 2041-47e<br />
Specific beta 1.00 WACC (%) 10.09<br />
Sensitivity and valuation range<br />
Cost <strong>of</strong> capital vs fade period 4 years 8 years 12 years<br />
9.1% 20.3 20.8 21.2<br />
9.6% 18.9 19.3 19.7<br />
10.1% 17.6 18.0 18.3<br />
10.6% 16.5 16.8 17.1<br />
11.1% 15.5 15.7 16.0<br />
Valuation data<br />
Year <strong>to</strong> 12/2010a 12/2011e 12/2012e 12/2013e<br />
EV/sales 3.2 2.5 2.1 1.9<br />
EV/EBITDA 21.9 13.6 10.8 9.0<br />
EV/IC 9.3 6.8 5.5 5.0<br />
PE* 49.9 28.0 21.3 15.2<br />
P/Book value 12.5 7.8 6.2 5.0<br />
FCF yield (%) 3.1 2.2 3.7 5.2<br />
Dividend yield (%) 1.0 1.7 2.2 3.1<br />
Note: * = Based on HSBC EPS (fully diluted)<br />
Issuer information<br />
Share price (EUR) 14.36 Target price (EUR) 18.00<br />
Reuters (Equity) SFER.MI Bloomberg (Equity) SFER IM<br />
Market cap (USDm) 3,224 Market cap (EURm) 2,418<br />
Free float (%) 25 Enterprise value (EURm) 2462<br />
Country Italy Sec<strong>to</strong>r Textiles, Apparel & Luxury<br />
Goods<br />
Analysts Sophie Dargnies Contact 331 5652 4348<br />
An<strong>to</strong>ine Belge Contact 331 5652 4347<br />
Erwan Rambourg Contact 852 2996 6572<br />
Price relative<br />
19<br />
17<br />
15<br />
13<br />
11<br />
9<br />
7<br />
Jun-11<br />
Salva<strong>to</strong>re Ferragam<br />
Source: HSBC<br />
Note: price at close <strong>of</strong> 01 Mar 2012<br />
Dec-11<br />
Rel <strong>to</strong> BCI ALL-SHARE INDEX<br />
19<br />
17<br />
15<br />
13<br />
11<br />
9<br />
7<br />
23
Consumer Brands & Retail<br />
Global luxury goods<br />
March 2012<br />
abc<br />
This page has been left blank intentionally<br />
24
Consumer Brands & Retail<br />
Global luxury goods<br />
March 2012<br />
abc<br />
Investment cases<br />
Burberry<br />
Christian Dior<br />
Coach<br />
Hengdeli Holdings Ltd<br />
Hermès<br />
Hugo Boss<br />
Luxottica<br />
LVMH<br />
PPR<br />
Prada<br />
Richemont<br />
Swatch<br />
Tiffany<br />
Tod's<br />
25
Consumer Brands & Retail<br />
Global luxury goods<br />
March 2012<br />
abc<br />
Burberry<br />
Organic sales growth s<strong>to</strong>ry intact, but GBP strength and continued<br />
investments may weigh<br />
Valuation (17% premium <strong>to</strong> European peers) not compelling, in our view<br />
Remain Neutral; increase target price <strong>to</strong> 1,600p (from 1,325p) on higher<br />
earnings estimates<br />
Neutral mostly on valuation<br />
Solid Q3 (Oct-Dec) trading statement<br />
Burberry reported 21% organic sales growth in<br />
Q3, which was one <strong>of</strong> the best organic sales<br />
growth rates in our universe. Retail outperformed<br />
wholesale (23% underlying vs 15%) as the brand<br />
continues <strong>to</strong> rationalise its wholesale distribution,<br />
notably in the US. The same s<strong>to</strong>re sales growth<br />
rate (13%) was only slightly below the H1<br />
performance (16%).<br />
Top line <strong>to</strong> be strong but hampered<br />
by GBP<br />
13% organic growth in FY March 13e (vs 10%<br />
for peers on average)<br />
We believe the group may <strong>of</strong>fer <strong>to</strong>p-line<br />
expansion at the high end <strong>of</strong> the range for the<br />
industry (13% organically in FY March 2013e vs<br />
10% for peers) thanks especially <strong>to</strong> China.<br />
We have been positively surprised by the speed at<br />
which China was integrated and started <strong>to</strong> benefit<br />
from accelerated expansion, better management,<br />
training, merchandising, planning, refurbishment<br />
and s<strong>to</strong>re locations. Burberry reported that<br />
comparable s<strong>to</strong>re sales in China were up by c30%<br />
in 9M 2011. The target is <strong>to</strong> add c10 s<strong>to</strong>res pa <strong>to</strong><br />
reach 100 by 2015e (vs 60 s<strong>to</strong>res <strong>to</strong>day) in<br />
mainland China.<br />
EUR/GBP down 3% in FY March 2013e<br />
Burberry is likely <strong>to</strong> suffer from GBP strength<br />
(lower sales translation, pr<strong>of</strong>its from subsidiaries<br />
and yen-related licences, lower <strong>to</strong>urism traffic in<br />
London s<strong>to</strong>res). We forecast no impact from FX<br />
for Burberry whereas <strong>French</strong>, Italian and Swiss<br />
luxury goods companies will benefit from the<br />
EUR weakness and should see a positive 3% FX<br />
impact on sales on average in FY March 2013e.<br />
18% EPS growth in FY13e (vs 20%<br />
on average for our universe) but not a<br />
compelling valuation, in our view<br />
Continued investments may weigh on EBIT<br />
margin increase<br />
However, in a context <strong>of</strong> weaker growth in<br />
Europe and in the US, different investments in<br />
cus<strong>to</strong>mer service, planning, supply chain, digital<br />
warehousing and investments on China, Japan<br />
non-apparel JVs, Brazil and India, etc may weigh<br />
on the EBIT margin. Therefore we believe<br />
Burberry’s EBIT margin potential expansion may<br />
be limited in the next three years.<br />
We nonetheless continue <strong>to</strong> argue Burberry may<br />
have an interesting pr<strong>of</strong>itability s<strong>to</strong>ry in the longer<br />
term. Unlike most other luxury brands, the brand<br />
generates lower pr<strong>of</strong>itability in retail than in<br />
wholesale. In 2009, management mentioned an<br />
26
Consumer Brands & Retail<br />
Global luxury goods<br />
March 2012<br />
abc<br />
EBIT margin differential <strong>of</strong> more than 500bp<br />
between the two distribution channels, which we<br />
believe could be narrowed thanks <strong>to</strong> improved s<strong>to</strong>re<br />
productivity. This should be driven by a better<br />
product mix (outperformance <strong>of</strong> non-apparel),<br />
lower markdowns (fewer lef<strong>to</strong>vers) and stronger<br />
sales <strong>of</strong> bestsellers (more frequent replenishments<br />
as a result <strong>of</strong> improved supply chain and systems).<br />
Burberry is trading at a 17% premium <strong>to</strong><br />
European peers<br />
After a pretty good 2011 compared <strong>to</strong> peers (up<br />
6% vs a 6% fall overall for our European luxury<br />
universe excluding Hermès), the shares are up<br />
22% year-<strong>to</strong>-date. The s<strong>to</strong>ck is currently trading at<br />
20.6x 2012e and 17.9x 2013e calendar PE (17%<br />
premium on 2013e <strong>to</strong> European peers). But with<br />
lower EPS growth compared <strong>to</strong> peers (18% vs<br />
20% on average in 2012e), we believe this<br />
valuation is not compelling.<br />
We continue <strong>to</strong> believe that Burberry’s s<strong>to</strong>ry is good<br />
(the five strategic themes – leveraging the franchise,<br />
intensifying non-apparel development, accelerating<br />
retail-led growth, investing in under-penetrated<br />
markets, operational excellence – have been rolled<br />
out successfully), and the way it is presented <strong>to</strong> the<br />
market is also very compelling: having ambitious<br />
managers leading a 100% free float company helps.<br />
Earnings, valuation and risks<br />
Company guidance for FY March 2012 includes:<br />
Retail space (average) increase <strong>of</strong> 13-14% in<br />
H2. We fac<strong>to</strong>r in 24% retail sales growth at<br />
constant FX with 11% comps in H2<br />
Wholesale revenue <strong>to</strong> be up mid-single digits<br />
at constant FX in H2, negatively impacted<br />
over the short term by further rationalisation<br />
in Europe and US distribution. We fac<strong>to</strong>r in<br />
9% at constant FX<br />
Licence revenues over the full year should be<br />
up by a mid single-digit percentage at constant<br />
FX, and by c10% on a reported basis. We fac<strong>to</strong>r<br />
in 8% at constant FX.<br />
We have increased our FY March 2012e EBIT<br />
estimate by 4% thanks <strong>to</strong> a stronger-than-expected<br />
holiday season, and have increased our FY March<br />
2013e-14e EBIT estimates by 7% and 9%,<br />
respectively, on the back <strong>of</strong> our higher US and <strong>to</strong> a<br />
lesser extent Europe sales forecasts. For 2012e,<br />
2013e and 2014e, we forecast organic sales growth<br />
<strong>of</strong> 22% (18% previously), 13% (9% previously) and<br />
12%, respectively. In terms <strong>of</strong> EBIT margins, we<br />
expect 20.7% (vs 20.6% previously), 21.2% (vs<br />
21.1% previously) and 21.6%, respectively for FY<br />
March 2012-14e.<br />
We increase our DCF-based target price <strong>to</strong> 1,600p<br />
from 1,325p on the back <strong>of</strong> our earnings estimate<br />
increases (see above) and changes <strong>to</strong> the RFR<br />
(3.0% from 3.5%), ERP (4.5% from 3.5%) and<br />
WACC (8.40% vs 8.30%). The assumptions used<br />
<strong>to</strong> generate our target price are detailed on page<br />
29. Under our research model the Neutral band for<br />
UK s<strong>to</strong>cks is 5 percentage points above and below<br />
the hurdle rate <strong>of</strong> 7.5%. Our 1,600p target price<br />
provides a 10.7% potential return, which is within<br />
the Neutral range; therefore we reiterate our<br />
Neutral rating. Potential return equals the<br />
percentage difference between the current share<br />
price and the target price, including the forecast<br />
dividend yield when indicated.<br />
The main downside risks <strong>to</strong> our rating include a<br />
failure <strong>to</strong> expand the cus<strong>to</strong>mer base, and despite<br />
the retail roll-out, that the company fails <strong>to</strong> shift<br />
sales <strong>to</strong>wards more non-apparel. In addition, as<br />
the brand has attracted outside talent in recent<br />
years, there is a risk that this talent may prove<br />
difficult <strong>to</strong> retain. Risks <strong>to</strong> the upside include a<br />
potential <strong>take</strong>over bid (Burberry remains a 100%<br />
free float company), and the possibility that<br />
market share gains translate in<strong>to</strong> much greater<br />
sales growth than we have fac<strong>to</strong>red in.<br />
27
Consumer Brands & Retail<br />
Global luxury goods<br />
March 2012<br />
abc<br />
Burberry P&L<br />
YE March (GBPm) 2007a % 2008a % 2009a % 2010a % 2011a % 2012e % 2013e % 2014e %<br />
Sales 850 14 995 17 1,202 21 1,280 7 1,501 17 1,838 22 2,080 13 2,327 12<br />
Gross pr<strong>of</strong>it 521 17 618 18 666 8 804 21 1,010 26 1,267 25 1,438 14 1,609 12<br />
Gross pr<strong>of</strong>it margin 61.3% 62.1% 55.4% 62.8% 67.3% 68.9% 69.1% 69.2%<br />
Operating expenses 364 25 416 14 485 17 584 20 709 21 887 25 998 13 1,108 11<br />
As a % <strong>of</strong> sales 42.8% 41.8% 40.4% 45.6% 47.2% 48.2% 48.0% 47.6%<br />
Adjusted EBIT 185 206 11 181 -12 220 22 301 37 380 26 440 16 502 14<br />
EBIT margin 21.8% 20.7% 15.0% 17.2% 20.1% 20.7% 21.2% 21.6%<br />
Reported EBIT 157 2 202 28 -10 -105 171 -1,828 302 77 380 26 440 16 502 14<br />
EBIT margin 18.5% 20.3% -0.8% 13.4% 20.1% 20.7% 21.2% 21.6%<br />
Pre-tax pr<strong>of</strong>it 156 0 196 25 -16 -108 166 -1,131 296 78 378 28 445 18 512 15<br />
Reported net pr<strong>of</strong>it 110 4 135 23 -6 -104 81 -1,456 208 156 276 33 325 18 374 15<br />
Clean net pr<strong>of</strong>it 110 4 140 27 132 -6 155 17 217 40 276 27 325 18 374 15<br />
EPS (clean diluted) (p) 24.7 11 31.6 28 30.2 -5 35.1 16 48.8 39 62.2 27 73.2 18 84.2 15<br />
Source: Company data, HSBC estimates<br />
Burberry sales and EBIT by network and geography<br />
YE March (GBPm) 2007a Yoy (%) 2008a Yoy (%) 2009a Yoy (%) 2010a Yoy (%) 2011a Yoy (%) 2012e Yoy (%) 2013e Yoy (%) 2014e Yoy (%)<br />
Retail sales 410 29 484 18 630 30 749 19 962 29 1256 30 1448 15 1651 14<br />
Wholesale sales 354 3 426 20 489 15 434 -11 441 2 474 8 519 10 561 8<br />
License Sales 86 6 85 -2 83 -3 97 18 98 1 109 10 113 4 115 2<br />
Total sales 850 14 995 17 1,202 21 1,280 7 1,501 17 1,838 22 2,080 13 2,327 12<br />
Retail & Wholesale EBIT 112 31 136 21 110 -19 138 25 220 59 290 32 346 19 406 17<br />
Retail & Wholesale EBIT margin 14.6% 14.9% 9.8% 11.6% 15.6% 16.8% 17.6% 18.4%<br />
License EBIT 73 6 71 -4 71 0 82 16 82 -1 90 11 94 4 96 2<br />
License EBIT margin 85.2% 83.3% 85.6% 84.3% 82.9% 83.0% 83.0% 83.1%<br />
Source: Company data, HSBC estimates<br />
Burberry sales by geography<br />
YE March (GBPm) 2007a Yoy (%) 2008a Yoy (%) 2009a Yoy (%) 2010a Yoy (%) 2011a Yoy (%) 2012e Yoy (%) 2013e Yoy (%) 2014e Yoy (%)<br />
Europe 382 17 453 19 524 16 515 -2 475 8 557 17 598 7 643 7<br />
North America 197 10 235 19 305 30 321 5 387 33 428 11 453 6 473 4<br />
Asia Pacific 168 16 189 13 240 27 283 18 457 124 634 39 797 26 964 21<br />
Rest <strong>of</strong> the world 19 33 79 50 50 64 28 85 72 110 30 119 8 131 10<br />
Licensing 86 85 -2 83 -3 97 18 98 12 109 10 113 4 115 2<br />
Total sales 850 31 995 17 1,202 21 1,280 7 1,501 44 1,839 22 2,080 13 2,327 12<br />
Source: Company data, HSBC estimates<br />
28
1<br />
0<br />
.<br />
7<br />
Consumer Brands & Retail<br />
Global luxury goods<br />
March 2012<br />
abc<br />
Financials & valuation: Burberry Group<br />
Financial statements<br />
Year <strong>to</strong> 03/2011a 03/2012e 03/2013e 03/2014e<br />
Pr<strong>of</strong>it & loss summary (GBPm)<br />
Revenue 1,501 1,838 2,080 2,327<br />
EBITDA 365 452 521 591<br />
Depreciation & amortisation -63 -72 -81 -89<br />
Operating pr<strong>of</strong>it/EBIT 301 380 440 502<br />
Net interest -6 -2 5 10<br />
PBT 296 378 445 512<br />
HSBC PBT 296 378 445 512<br />
Taxation -83 -102 -120 -138<br />
Net pr<strong>of</strong>it 215 276 325 374<br />
HSBC net pr<strong>of</strong>it 217 276 325 374<br />
Cash flow summary (GBPm)<br />
Cash flow from operations 273 329 394 452<br />
Capex -108 -180 -160 -130<br />
Cash flow from investment -158 -180 -160 -130<br />
Dividends -69 -85 -108 -127<br />
Change in net debt -36 -64 -126 -195<br />
FCF equity 148 149 234 322<br />
Balance sheet summary (GBPm)<br />
Intangible fixed assets 115 115 115 115<br />
Tangible fixed assets 282 390 469 510<br />
Current assets 847 973 1,142 1,376<br />
Cash & others 466 530 656 851<br />
Total assets 1,364 1,598 1,847 2,122<br />
Operating liabilities 450 493 525 554<br />
Gross debt 168 168 168 168<br />
Net debt -298 -362 -487 -682<br />
Shareholders funds 714 905 1,121 1,368<br />
Invested capital 327 454 545 597<br />
Ratio, growth and per share analysis<br />
Year <strong>to</strong> 03/2011a 03/2012e 03/2013e 03/2014e<br />
Y-o-y % change<br />
Revenue 17.3 22.4 13.2 11.9<br />
EBITDA 63.3 23.9 15.2 13.4<br />
Operating pr<strong>of</strong>it 36.9 26.2 15.8 14.1<br />
PBT 78.2 28.0 17.6 15.0<br />
HSBC EPS 39.2 27.4 17.6 15.0<br />
Ratios (%)<br />
Revenue/IC (x) 5.0 4.7 4.2 4.1<br />
ROIC 72.4 71.1 64.3 64.2<br />
ROE 33.8 34.1 32.1 30.0<br />
ROA 17.0 18.7 18.9 18.8<br />
EBITDA margin 24.3 24.6 25.0 25.4<br />
Operating pr<strong>of</strong>it margin 20.1 20.7 21.2 21.6<br />
EBITDA/net interest (x) 57.0 301.3<br />
Net debt/equity -40.6 -39.1 -42.7 -49.1<br />
Net debt/EBITDA (x) -0.8 -0.8 -0.9 -1.2<br />
CF from operations/net debt<br />
Per share data (GBPp)<br />
EPS Rep (fully diluted) 48.33 62.22 73.17 84.17<br />
HSBC EPS (fully diluted) 48.83 62.22 73.17 84.17<br />
DPS 19.53 24.89 29.27 33.67<br />
NAV 163.90 207.84 257.59 314.18<br />
DCF analysis<br />
HSBC assumptions<br />
DCF, comprising<br />
Neutral<br />
Risk-free rate (%) 3.00 EBIT growth 2011-21e CAGR (%) 8.6<br />
Equity premium (%) 4.50 EBIT growth 2021-41e CAGR (%) 4.0<br />
Sec<strong>to</strong>r beta 1.20 Fade period 2041-47e<br />
Specific beta 1.00 WACC (%) 8.40<br />
Sensitivity and valuation range (GBP/share)<br />
Cost <strong>of</strong> capital vs fade period 4 years 8 years 12 years<br />
7.4% 17.84 18.32 18.69<br />
7.9% 16.69 17.09 17.44<br />
8.4% 15.66 16.00 16.31<br />
8.9% 14.73 15.02 15.29<br />
9.4% 13.89 14.13 14.38<br />
Valuation data<br />
Year <strong>to</strong> 03/2011a 03/2012e 03/2013e 03/2014e<br />
EV/sales 4.0 3.2 2.8 2.4<br />
EV/EBITDA 16.3 13.0 11.1 9.4<br />
EV/IC 18.2 13.0 10.6 9.3<br />
PE* 29.6 23.2 19.8 17.2<br />
P/NAV 8.8 7.0 5.6 4.6<br />
FCF yield (%) 2.4 2.4 3.7 5.2<br />
Dividend yield (%) 1.4 1.7 2.0 2.3<br />
Note: * = Based on HSBC EPS (fully diluted)<br />
Issuer information<br />
Share price (GBPp) 1,446 Target price (GBPp) 1,600<br />
Reuters (Equity) BRBY.L Bloomberg (Equity) BRBY LN<br />
Market cap (USDm) 10,124 Market cap (GBPm) 6,344<br />
Free float (%) 100 Enterprise value (GBPm) 5,885<br />
Country United Kingdom Sec<strong>to</strong>r Textiles, Apparel & Luxury<br />
Goods<br />
Analysts Sophie Dargnies Contact 33 1 5652 4348<br />
An<strong>to</strong>ine Belge Contact 33 1 5652 4347<br />
Erwan Rambourg Contact 852 2996 6572<br />
Price relative<br />
1689<br />
1489<br />
1289<br />
1089<br />
889<br />
689<br />
489<br />
489<br />
Mar-10 Sep-10 Mar-11 Sep-11 Mar-12<br />
Burberry Group Rel <strong>to</strong> FTSE ALL-SHARE<br />
Source: HSBC<br />
Note: price at close <strong>of</strong> 01 Mar 2012<br />
1689<br />
1489<br />
1289<br />
1089<br />
889<br />
689<br />
29
Consumer Brands & Retail<br />
Global luxury goods<br />
March 2012<br />
abc<br />
Christian Dior<br />
Dior’s discount <strong>to</strong> our estimated restated net asset value (RNAV)<br />
is now 24%, a level we consider close <strong>to</strong> fair value (by his<strong>to</strong>rical<br />
standards)<br />
Increasing target price <strong>to</strong> EUR130 from EUR122 on the back <strong>of</strong><br />
the increase in our LVMH target price <strong>to</strong> EUR135 (from EUR127)<br />
Downgrading Dior <strong>to</strong> Neutral (from Overweight) as the potential<br />
return is limited (9.9% based on our target price)<br />
Downgrading <strong>to</strong> Neutral<br />
(from Overweight)<br />
24% discount <strong>to</strong> RNAV<br />
Christian Dior is the main holding company for<br />
LVMH, controlling 40.9% <strong>of</strong> the shares and c57%<br />
<strong>of</strong> the voting rights. Besides its s<strong>take</strong> in LVMH<br />
(92% <strong>of</strong> assets), Dior’s only operational entity is<br />
the Dior Couture brand (7%). Christian Dior’s<br />
holding in LVMH has changed slightly since the<br />
dilution linked <strong>to</strong> the Bulgari deal last year. After<br />
this deal, Christian Dior held a 40.9% s<strong>take</strong> (vs<br />
42.4% previously) and c57% <strong>of</strong> voting rights<br />
(c58%, previously).<br />
Since the beginning <strong>of</strong> 2012, Dior shares have<br />
gained 29% vs 18% for LVMH shares. Dior’s<br />
discount <strong>to</strong> our estimated restated net asset value<br />
(RNAV) is thus now 24% (vs 32% on 5 Oc<strong>to</strong>ber<br />
2011). There is nothing surprising here as<br />
conglomerate/holding discounts <strong>to</strong> RNAV tends <strong>to</strong><br />
fall during bull market phases and vice versa. As<br />
evidenced by the chart on the next page, the discount<br />
<strong>to</strong> RNAV has moved within a 6%-34% range<br />
(average 20%) since 2005. Note that higher levels <strong>of</strong><br />
discounts were witnessed in the 1995-2005 period,<br />
but we would discard them from the analysis since<br />
the LVMH control structure was much more<br />
complicated and moreover the <strong>French</strong> tax regime<br />
back then (taxation on capital gains) implied a higher<br />
discount for most <strong>French</strong> conglomerates.<br />
We remain Neutral on LVMH with a new<br />
EUR135 target price – see our detailed LVMH<br />
investment case on page 57. As we base our sum<strong>of</strong>-the-parts<br />
target price for Dior on LVMH<br />
reaching our new target price <strong>of</strong> EUR135 (vs<br />
EUR127 previously) and a Dior-targeted discount<br />
<strong>to</strong> RNAV <strong>of</strong> 20%, our new Dior target price is<br />
EUR130 (vs EUR122, previously) – see our<br />
detailed assumptions on page 33.<br />
Under our research model, for s<strong>to</strong>cks without a<br />
volatility indica<strong>to</strong>r, the Neutral band is 5<br />
percentage points above and below the hurdle rate<br />
for Europe ex-UK s<strong>to</strong>cks <strong>of</strong> 9.0%. Our target price<br />
<strong>of</strong> EUR130 provides a potential return <strong>of</strong> 9.9%,<br />
within the Neutral band <strong>of</strong> our model; therefore,<br />
we are downgrading our rating on Christian Dior<br />
s<strong>to</strong>ck <strong>to</strong> Neutral from Overweight. Potential return<br />
equals the percentage difference between the<br />
current share price and the target price, including<br />
the forecast dividend yield when indicated.<br />
30
Consumer Brands & Retail<br />
Global luxury goods<br />
March 2012<br />
abc<br />
Strong performance for Dior Couture<br />
in 2011, recovery <strong>to</strong> continue in 2012<br />
Dior Couture registered stellar growth (22%<br />
organic sales growth in 2011 vs 10% in 2010)<br />
with retail (c82% in 2011) up 28%. Wholesale<br />
continued <strong>to</strong> underperform but Dior’s target is <strong>to</strong><br />
reduce its wholesale footprint (representing 14%<br />
<strong>of</strong> sales in 2010 from 19% in 2009).<br />
FY 2011 EBIT margin strongly improved and<br />
gained 430bp <strong>to</strong> 8.5% thanks <strong>to</strong> (i) a higher<br />
operating leverage; (ii) a better mix; and (iii) a<br />
higher share <strong>of</strong> products being sold at full price.<br />
Dior Couture's own s<strong>to</strong>res sales by region, 2010<br />
Europe and<br />
Middle East<br />
50%<br />
Source: Company data<br />
Americas<br />
10%<br />
Asia<br />
40%<br />
For 2012e, we forecast 9% organic sales growth<br />
and a 150bp EBIT margin improvement <strong>to</strong> 10%<br />
on the back <strong>of</strong> a higher proportion <strong>of</strong> its own<br />
s<strong>to</strong>res sales, higher gross margin and better<br />
SG&A leverage (including improved s<strong>to</strong>re<br />
productivity). For 2013e, we forecast 7.5%<br />
organic sales growth and a 50bp EBIT margin<br />
improvement <strong>to</strong> 10.5%.<br />
We consider the value <strong>of</strong> the Dior Couture brand<br />
<strong>to</strong> be a limited driver, as it is <strong>to</strong>o marginal (only<br />
7% <strong>of</strong> Dior’s RNAV <strong>to</strong>day) relative <strong>to</strong> Dior’s<br />
40.9% s<strong>take</strong> in LVMH (92% <strong>of</strong> RNAV).<br />
Risks<br />
The main downside/(upside) risk <strong>to</strong> our rating on<br />
Dior would be a negative/(positive) development<br />
in LVMH’s share price. Another risk would be a<br />
change in the market’s view <strong>of</strong> the discount <strong>to</strong><br />
apply <strong>to</strong> holding companies (positive or negative).<br />
Since Dior’s IPO in 1995, there has been press<br />
speculation about a potential streamlining <strong>of</strong> the<br />
current LVMH control structure. In theory,<br />
expectations or announcements about such a<br />
simplification (eg an LVMH/Dior merger or a<br />
Dior minority buy-out) – provided it benefited<br />
Dior’s minority shareholders – should trigger a<br />
sharp narrowing in the company’s discount <strong>to</strong><br />
RNAV. We think this could be a potential upside<br />
catalyst for Dior.<br />
Dior discount <strong>to</strong> our estimated net asset value<br />
0%<br />
Jan-98 Jan-99 Jan-00 Jan-01 Jan-02 Jan-03 Jan-04 Jan-05 Jan-06 Jan-07 Jan-08 Jan-09 Jan-10 Jan-11 Jan-12<br />
-10%<br />
-20%<br />
-30%<br />
-40%<br />
-50%<br />
-60%<br />
Source: Thomson Reuters Datastream, using share price close at 1 March 2012<br />
31
Consumer Brands & Retail<br />
Global luxury goods<br />
March 2012<br />
abc<br />
Dior Couture sales & EBIT evolution<br />
EURm<br />
1993a 1994a 1995a 1996a 1997a 1998a 1999a 2000a 2001a 2002a 2003a 2004a 2005a 2006a 2007a 2008a 2009a 2010a 2011a 2012e 2013e 2014e<br />
Sales 124 137 157 187 200 200 220 296 350 492 523 595 663 731 787 765 717 826 1,000 1,120 1,204 1,295<br />
EBIT 19 22 24 24 11 -1 9 14 -5 33 40 50 53 56 74 9 13 35 85 112 126 142<br />
EBIT margin 15.3 16.1 15.1 13.1 5.6 -0.3 3.9 4.7 -1.5 6.7 7.7 8.4 8.0 7.7 9.4 1.2 1.8 4.2 8.5 10.0 10.5 11.0<br />
y-o-y change (%)<br />
Sales 10 15 19 7 0 10 35 18 41 6 14 11 10 8 -3 -6 15 21 12 8 8<br />
EBIT 16 8 3 -54 nm nm 64 nm nm 21 25 6 6 32 -88 44 nm 143 32 13 13<br />
Source: Company data, HSBC estimates<br />
Dior restated net asset value<br />
EURm % s<strong>take</strong> Restated NAV Method % <strong>of</strong> RNAV<br />
LVMH 40.89% 26,767 Share price EUR128.80 91.3%<br />
Dior Couture 100.00% 2,120 2x 2012e sales 7.2%<br />
Property 100.00% 108 90,000m2 at EUR12,000/m2 0.4%<br />
Treasury s<strong>to</strong>cks 1.54% 332 Share price EUR118.25 1.1%<br />
Restated NAV 29,327 100%<br />
Parent company debt -1,178<br />
RNAV (EURm) 28,149<br />
RNAV per share (EUR) 154.90<br />
Share price (EUR) 118.25<br />
Discount (%) -24%<br />
Source: HSBC estimates<br />
Dior target price calculation based on HSBC's LVMH target price<br />
EURm % s<strong>take</strong> Restated NAV Method % <strong>of</strong> RNAV<br />
LVMH 40.89% 28,056 HSBC target price EUR135 92%<br />
Dior Couture 100.00% 2,120 2x 2012e sales 7%<br />
Property 100.00% 108 90,000m2 at EUR12,000/m2 0%<br />
Treasury s<strong>to</strong>cks 1.54% 332 Share price EUR118.25 1%<br />
Restated NAV 30,615 100%<br />
Parent company debt -1,178<br />
RNAV (EURm) 29,437<br />
Targeted discount <strong>to</strong> RNAV (%) -20%<br />
HSBC Dior target price (EUR per share) 130<br />
Source: HSBC estimates<br />
32
9<br />
.<br />
9<br />
Consumer Brands & Retail<br />
Global luxury goods<br />
March 2012<br />
abc<br />
Financials & valuation: Christian Dior<br />
Financial statements<br />
Year <strong>to</strong> 12/2010a 12/2011e 12/2012e 12/2013e<br />
Pr<strong>of</strong>it & loss summary (EURm)<br />
Revenue 21,123 24,659 28,245 30,504<br />
EBITDA 5,175 6,270 6,982 7,670<br />
Depreciation & amortisation -837 -922 -815 -864<br />
Operating pr<strong>of</strong>it/EBIT 4,338 5,348 6,167 6,807<br />
Net interest 566 -283 -199 -125<br />
PBT 4,745 4,962 5,876 6,592<br />
HSBC PBT 4,745 4,962 5,876 6,592<br />
Taxation -1,476 -1,466 -1,818 -2,039<br />
Net pr<strong>of</strong>it 1,261 1,356 1,608 1,808<br />
HSBC net pr<strong>of</strong>it 1,261 1,356 1,608 1,809<br />
Cash flow summary (EURm)<br />
Cash flow from operations 4,512 3,987 4,302 5,090<br />
Capex -1,002 -1,749 -1,400 -1,500<br />
Cash flow from investment -2,876 -6,309 -1,400 -1,500<br />
Dividends -362 -416 -479 -551<br />
Change in net debt -356 1,988 -1,239 -1,755<br />
FCF equity 3,510 2,238 2,902 3,590<br />
Balance sheet summary (EURm)<br />
Intangible fixed assets 17,432 21,740 21,740 21,740<br />
Tangible fixed assets 7,060 8,344 8,927 9,560<br />
Current assets 11,551 13,626 15,214 16,212<br />
Cash & others 2,408 2,426 2,426 2,426<br />
Total assets 41,197 51,109 53,477 55,307<br />
Operating liabilities 5,407 6,648 7,574 8,155<br />
Gross debt 6,846 8,852 7,613 5,858<br />
Net debt 4,438 6,426 5,187 3,432<br />
Shareholders funds 7,703 12,956 15,229 17,774<br />
Invested capital 28,228 34,636 35,881 36,931<br />
Ratio, growth and per share analysis<br />
Year <strong>to</strong> 12/2010a 12/2011e 12/2012e 12/2013e<br />
Y-o-y % change<br />
Revenue 19.0 16.7 14.5 8.0<br />
EBITDA 22.7 21.2 11.4 9.9<br />
Operating pr<strong>of</strong>it 29.3 23.3 15.3 10.4<br />
PBT 71.4 4.6 18.4 12.2<br />
HSBC EPS 81.4 7.5 18.6 12.5<br />
Ratios (%)<br />
Revenue/IC (x) 0.8 0.8 0.8 0.8<br />
ROIC 10.8 12.0 12.1 12.9<br />
ROE 18.1 13.1 11.4 11.0<br />
ROA 7.5 8.0 8.0 8.5<br />
EBITDA margin 24.5 25.4 24.7 25.1<br />
Operating pr<strong>of</strong>it margin 20.5 21.7 21.8 22.3<br />
EBITDA/net interest (x) 22.2 35.1 61.6<br />
Net debt/equity 22.7 25.8 18.8 11.2<br />
Net debt/EBITDA (x) 0.9 1.0 0.7 0.4<br />
CF from operations/net debt 101.7 62.0 82.9 148.3<br />
Per share data (EUR)<br />
EPS Rep (fully diluted) 7.06 7.60 9.01 10.13<br />
HSBC EPS (fully diluted) 7.06 7.60 9.01 10.13<br />
DPS 2.11 2.43 2.79 3.21<br />
NAV 43.15 72.57 85.30 99.56<br />
Dior restated net asset value (target price)<br />
EURm<br />
Neutral<br />
RNAV<br />
LVMH (40.89% s<strong>take</strong>) @ EUR135 per share 28,056<br />
Dior Couture (2x 2012e sales) 2,120<br />
Property (90,000m2 at EUR12,000/m2) 108<br />
Treasury s<strong>to</strong>cks 332<br />
Restated NAV 30,615<br />
Parent company debt -1,178<br />
RNAV (EURm) 29,437<br />
Target discount (%) -20%<br />
Target price Dior (EUR per share) 130<br />
Issuer information<br />
Share price (EUR) 118.25 Target price (EUR) 130.00<br />
Reuters (Equity) DIOR.PA Bloomberg (Equity) CDI FP<br />
Market cap (USDm) 28,651 Market cap (EURm) 21,489<br />
Free float (%) 29 Enterprise value (EURm) 58,125<br />
Country France Sec<strong>to</strong>r Textiles, Apparel & Luxury<br />
Goods<br />
Analysts Sophie Dargnies Contact 33 1 5652 4348<br />
An<strong>to</strong>ine Belge Contact 33 1 5652 4347<br />
Erwan Rambourg Contact 852 2996 6572<br />
Price relative<br />
126<br />
116<br />
106<br />
96<br />
86<br />
76<br />
66<br />
66<br />
Mar-10 Sep-10 Mar-11 Sep-11 Mar-12<br />
Christian Dior Rel <strong>to</strong> SBF-120<br />
Source: HSBC<br />
Note: price at close <strong>of</strong> 01 Mar 2012<br />
126<br />
116<br />
106<br />
96<br />
86<br />
76<br />
33
Consumer Brands & Retail<br />
Global luxury goods<br />
March 2012<br />
abc<br />
Coach<br />
Opportunity in Men’s a strong company specific, in our view<br />
Valuation not compelling (13% premium <strong>to</strong> European peers) after<br />
25% share price increase y-t-d<br />
Remain Neutral, increase target price <strong>to</strong> USD80 (from USD59) on<br />
higher estimates<br />
Opportunity in Men’s a strong<br />
company specific<br />
Less cautious view on Coach US<br />
In September last year, we <strong>to</strong>ok a cautious view<br />
on the US affluent consumer and forecast a<br />
marked slowdown in Coach’s North American<br />
comps (2.2% in FY12e and 4.3% in FY13e). After<br />
two quarters <strong>of</strong> stronger-than-expected comps<br />
(9.2% in Q1 ended September 2011 and 8.8% in<br />
Q2 ended December 2011), we now forecast a<br />
more modest rate <strong>of</strong> slowdown: 6% for H2 ending<br />
June 2012 and 4.5% in FY13e. We believe<br />
Coach’s ‘affordable luxury’ positioning (more<br />
than 80% <strong>of</strong> products sold are priced below<br />
USD400) places the brand in a sweet spot and,<br />
unlike Tiffany, it is not facing the heavy<br />
discounting <strong>of</strong> local brands.<br />
Moreover, we now fac<strong>to</strong>r in a much higher<br />
contribution from new s<strong>to</strong>res. The company<br />
intends <strong>to</strong> increase its North American square<br />
footage by 10-11% in FY12e, driven by Men’s. In<br />
<strong>to</strong>tal, 40 s<strong>to</strong>res should be opened this year in<br />
North America (about 15 full price and 25<br />
fac<strong>to</strong>ry), <strong>of</strong> which about half is dedicated Men’s<br />
locations. Coach is on track <strong>to</strong> double again the<br />
size <strong>of</strong> its Men’s business <strong>to</strong> over USD400m<br />
globally in FY12e (ie c8% <strong>of</strong> <strong>to</strong>tal sales) and<br />
USD1bn in the next three <strong>to</strong> five years (c15% <strong>of</strong><br />
<strong>to</strong>tal sales).<br />
We believe Men’s opportunity:<br />
<strong>of</strong>fsets the traditional bear issue regarding<br />
Coach’s maturity in North America (Coach<br />
already has 350 full-price and 157 fac<strong>to</strong>ry<br />
s<strong>to</strong>res there), with the prospect <strong>of</strong> openings <strong>of</strong><br />
dedicated s<strong>to</strong>res, shop-in-shops and dualgender<br />
locations;<br />
allows productivity gains in existing s<strong>to</strong>res<br />
via expanded assortments (concept s<strong>to</strong>re<br />
within existing s<strong>to</strong>res);<br />
provides an opportunity <strong>to</strong> address the<br />
sluggishness <strong>of</strong> the Japanese market,<br />
allowing for 15 net s<strong>to</strong>re openings in FY12,<br />
the vast majority <strong>of</strong> them Men’s s<strong>to</strong>res<br />
(currently, most <strong>of</strong> Coach’s distribution in<br />
Japan is within department s<strong>to</strong>res in the<br />
Women’s handbag floor);<br />
will contribute <strong>to</strong> the China s<strong>to</strong>ry due <strong>to</strong> the<br />
strong prospects for dual-gender s<strong>to</strong>res in a<br />
country where Men’s accounts for a bit more<br />
than half <strong>of</strong> sales <strong>of</strong> the leather and<br />
accessories segment.<br />
34
Consumer Brands & Retail<br />
Global luxury goods<br />
March 2012<br />
abc<br />
International distribution (% <strong>of</strong> FY June 11 sales)<br />
Japan<br />
China<br />
17%<br />
6%<br />
North<br />
American<br />
S<strong>to</strong>res<br />
62%<br />
Source: HSBC estimates<br />
Other Intl<br />
5%<br />
US Department<br />
s<strong>to</strong>res<br />
6%<br />
NA Internet<br />
4%<br />
Asia ex-Japan small, but growing fast<br />
Looking at growth rates in Asia over the past<br />
three years, consumers there clearly love Coach.<br />
The brand’s “New York” positioning is unique in<br />
China, the accessible luxury positioning will<br />
recruit many aspirational consumers, in our view,<br />
and the potential for s<strong>to</strong>re openings in the 1m+<br />
population cities seems almost limitless (the brand<br />
plans <strong>to</strong> add c60% space in FY12).<br />
In FY June 2011, Coach exceeded its guidance for<br />
revenues in Greater China (USD185m vs<br />
USD100m in FY 2010), which had been raised<br />
during the year. The company is targeting <strong>to</strong> reach<br />
more than USD300m by FY12 and USD500m by<br />
FY14, ie a c10% market share vs 6% <strong>to</strong>day). At the<br />
end <strong>of</strong> Q2, Coach had 65 s<strong>to</strong>res in the mainland (<strong>of</strong><br />
which 28 dual-gender locations) in 28 cities, 12 in<br />
HK and 3 in Macau. Coach’s unaided awareness in<br />
China is now 16% (vs 8% last year).<br />
Other Asian markets also <strong>look</strong> promising, notably<br />
Singapore where Coach has just acquired<br />
operations from its distribu<strong>to</strong>r (Malaysia should<br />
follow). Vietnam, Brazil and Kuwait will be new<br />
markets in FY June 2012.<br />
Earnings, valuation and risks<br />
On 24 January, Coach reported an 18 % EPS<br />
increase for Q2 ended December 2011, driven by<br />
a 15% sales increase and a 10bp EBIT margin<br />
improvement <strong>to</strong> 36% (the reported margin was<br />
34.6% due <strong>to</strong> a USD20m pre-tax one-<strong>of</strong>f<br />
contribution <strong>to</strong> the Coach foundation, <strong>of</strong>fsetting a<br />
USD12m one-<strong>of</strong>f tax gain at the EPS level).<br />
We have increased our FY2012e and 2013e EPS<br />
2014e EPS estimates by 8% and 11% on the back<br />
<strong>of</strong> higher North American comps (we now<br />
forecast 8% in FY12e and 4.5% in FY13e).<br />
We forecast flat gross margin over the next three<br />
years, with counter-sourcing helping <strong>to</strong> <strong>of</strong>fset<br />
input cost inflation in China. All incremental<br />
production needs will be sourced outside China<br />
(Vietnam/India), leading China <strong>to</strong> account for<br />
c75% <strong>of</strong> <strong>to</strong>tal production in FY12e (vs 86% in<br />
FY11 and 93% in FY10).<br />
We raise our DCF-based target price <strong>to</strong> USD80<br />
(from USD59) on the back <strong>of</strong> our abovementioned<br />
earnings estimate increases as well as<br />
our higher medium-term assumptions for Asia in<br />
general and for the US Men’s business. The<br />
assumptions used <strong>to</strong> generate our DCF-derived<br />
target price are detailed on page 37, with a revised<br />
RFR <strong>of</strong> 3.0% vs 3.5%, ERP <strong>of</strong> 4.5% vs 3.5% and<br />
a WACC <strong>of</strong> 8.52% vs 8.33% previously. Under<br />
our research model, for US s<strong>to</strong>cks without a<br />
volatility indica<strong>to</strong>r, the Neutral band is 5<br />
percentage points above and below the hurdle rate<br />
for US s<strong>to</strong>cks <strong>of</strong> 7.0%. Our new target price<br />
implies a 4.2% potential return, which is within<br />
the Neutral band <strong>of</strong> our model, therefore we<br />
maintain our Neutral rating. Potential return<br />
equals the percentage difference between the<br />
current share price and the target price, including<br />
the forecast dividend yield when indicated.<br />
Coach shares are up 25% y-t-d. On our updated<br />
figures, the s<strong>to</strong>ck is trading at a 20.0x calendar<br />
2012e and 17.6x 2013e PE, a 13% premium <strong>to</strong><br />
European luxury s<strong>to</strong>cks.<br />
Upside risks <strong>to</strong> our Coach rating include strongerthan-expected<br />
sales growth in North America and<br />
greater SG&A leverage than fac<strong>to</strong>red in<strong>to</strong> our<br />
estimates. Downside risks <strong>to</strong> our rating include the<br />
brand’s different positioning in its two channels<br />
(full-price retail and outlets), which could pose a<br />
threat <strong>to</strong> its image, potential disruption from noncore<br />
projects (Reed Krak<strong>of</strong>f) and lack <strong>of</strong> success in<br />
entering the European market.<br />
35
Consumer Brands & Retail<br />
Global luxury goods<br />
March 2012<br />
abc<br />
Coach simplified P&L<br />
USDm FY06/07a FY07/08e FY08/09 FY09/10a Q111a Q211a Q311a Q411a FY10/11a Q112a Q212a FY11/12e FY12/13e FY12/13e<br />
Net sales 2,612 3,181 3,230 3,608 912 1,264 951 1,032 4,159 1,050 1,449 4,800 5,400 6,000<br />
Cost <strong>of</strong> sales 589 774 908 974 236 349 259 291 1,135 286 403 1,311 1,474 1,637<br />
Gross pr<strong>of</strong>it 2,023 2,407 2,323 2,634 676 915 692 740 3,024 765 1,045 3,489 3,926 4,363<br />
Gross margin 77.4% 75.7% 71.9% 73.0% 74.2% 72.4% 72.8% 71.8% 72.7% 72.8% 72.2% 72.7% 72.7% 72.7%<br />
Selling, G&A 1,030 1,228 1,322 1,484 391 462 438 428 1,719 443 544 1,939 2,146 2,363<br />
SG&A as % <strong>of</strong> sales 39.4% 38.6% 40.9% 41.1% 42.8% 36.5% 46.1% 41.5% 41.3% 42.1% 37.6% 40.4% 39.7% 39.4%<br />
Operating income 993 1,179 1,000 1,150 286 453 254 312 1,305 322 501 1,550 1,780 2,000<br />
Operating margin 38.0% 37.1% 31.0% 31.9% 31.3% 35.9% 26.7% 30.2% 31.4% 30.7% 34.6% 32.3% 33.0% 33.3%<br />
Interest income 41.3 37.1 3.2 1.8 -0.6 -0.9 -0.8 -1.4 -3.7 -1.4 -1.8 0.0 20.0 35.0<br />
PBT 1,035 1,216 1,003 1,152 285 452 253 311 1,301 321 499 1,550 1,800 2,035<br />
Income taxes 398 474 381 417 96 149 67 108 420 106 152 501 594 672<br />
Tax rate 38.5% 39.0% 38.0% 36.2% 33.7% 32.9% 26.5% 34.8% 32.3% 32.9% 30.4% 32.3% 33.0% 33.0%<br />
Minority interest<br />
Net income 637 742 622 735 189 303 186 202 881 215 347 1,049 1,206 1,363<br />
Net EPS common (diluted) (USD) 1.69 2.06 1.91 2.33 0.63 1.00 0.62 0.68 2.92 0.73 1.18 3.56 4.10 4.64<br />
Weighted avg com share 377.4 360.3 325.6 315.8 301.3 304.7 301.6 298.7 301.6 296.1 295.5 294.9 294.0 294.0<br />
outst. (diluted) (m)<br />
Net sales 28% 22% 2% 12% 20% 19% 14% 9% 15% 15% 15% 15% 13% 11%<br />
Cost <strong>of</strong> sales 30% 31% 17% 7% 11% 19% 20% 15% 17% 21% 15% 16% 12% 11%<br />
Gross pr<strong>of</strong>it 28% 19% -4% 13% 23% 19% 12% 6% 15% 13% 14% 15% 13% 11%<br />
Operating expenses 19% 19% 8% 12% 19% 18% 19% 7% 16% 13% 18% 13% 11% 10%<br />
Income before tax &<br />
39% 19% -15% 15% 28% 19% 2% 5% 13% 13% 10% 19% 15% 12%<br />
minority interest<br />
Diluted EPS 41% 22% -7% 22% 43% 33% 23% 9% 25% 16% 18% 22% 15% 13%<br />
North America retail comps 22% 10% -7% 4% 9% 13% 10% 10% 11% 9% 9% 8% 5% 5%<br />
Direct-<strong>to</strong>-consumer 2,102 2,544 2,727 3,156 776 1,096 832 919 3,622 910 1,283 4,261 4,829 5,394<br />
Indirect 511 637 504 452 136 168 119 113 537 140 166 539 571 606<br />
Total sales 2,612 3,181 3,231 3,608 912 1,264 951 1,032 4,159 1,050 1,449 4,800 5,400 6,000<br />
Source: Company data, HSBC estimates<br />
36
4<br />
.<br />
2<br />
Consumer Brands & Retail<br />
Global luxury goods<br />
March 2012<br />
abc<br />
Financials & valuation: Coach<br />
Financial statements<br />
Year <strong>to</strong> 06/2011a 06/2012e 06/2013e 06/2014e<br />
Pr<strong>of</strong>it & loss summary (USDm)<br />
Revenue 4,159 4,800 5,400 6,000<br />
EBITDA 1,430 1,688 1,934 2,170<br />
Depreciation & amortisation -125 -138 -154 -170<br />
Operating pr<strong>of</strong>it/EBIT 1,305 1,550 1,780 2,000<br />
Net interest -4 0 20 35<br />
PBT 1,301 1,550 1,800 2,035<br />
HSBC PBT 1,301 1,550 1,800 2,035<br />
Taxation -420 -501 -594 -672<br />
Net pr<strong>of</strong>it 881 1,049 1,206 1,363<br />
HSBC net pr<strong>of</strong>it 881 1,049 1,206 1,363<br />
Cash flow summary (USDm)<br />
Cash flow from operations 1,040 1,207 1,393 1,570<br />
Capex -148 -200 -224 -246<br />
Cash flow from investment -157 -200 -224 -246<br />
Dividends -178 -284 -311 -343<br />
Change in net debt -6 -363 -858 -981<br />
FCF equity 796 911 1,074 1,228<br />
Balance sheet summary (USDm)<br />
Intangible fixed assets 444 444 444 444<br />
Tangible fixed assets 738 801 871 947<br />
Current assets 1,267 1,726 2,663 3,718<br />
Cash & others 702 1,065 1,923 2,904<br />
Total assets 2,635 3,156 4,163 5,296<br />
Operating liabilities 998 1,019 1,035 1,051<br />
Gross debt 23 23 23 23<br />
Net debt -679 -1,042 -1,899 -2,881<br />
Shareholders funds 1,613 2,114 3,104 4,221<br />
Invested capital 749 887 1,020 1,155<br />
Ratio, growth and per share analysis<br />
Year <strong>to</strong> 06/2011a 06/2012e 06/2013e 06/2014e<br />
Y-o-y % change<br />
Revenue 15.3 15.4 12.5 11.1<br />
EBITDA 12.0 18.0 14.6 12.2<br />
Operating pr<strong>of</strong>it 13.5 18.8 14.8 12.4<br />
PBT 13.0 19.1 16.1 13.1<br />
HSBC EPS 25.5 21.8 15.3 13.1<br />
Ratios (%)<br />
Revenue/IC (x) 5.8 5.9 5.7 5.5<br />
ROIC 122.4 128.3 125.1 123.2<br />
ROE 56.5 56.3 46.2 37.2<br />
ROA 34.5 36.2 33.0 28.8<br />
EBITDA margin 34.4 35.2 35.8 36.2<br />
Operating pr<strong>of</strong>it margin 31.4 32.3 33.0 33.3<br />
EBITDA/net interest (x) 386.0<br />
Net debt/equity -42.1 -49.3 -61.2 -68.3<br />
Net debt/EBITDA (x) -0.5 -0.6 -1.0 -1.3<br />
CF from operations/net debt<br />
Per share data (USD)<br />
EPS Rep (fully diluted) 2.92 3.56 4.10 4.64<br />
HSBC EPS (fully diluted) 2.92 3.56 4.10 4.64<br />
DPS 0.90 0.99 1.09 1.20<br />
NAV 5.49 7.37 10.85 14.76<br />
DCF analysis<br />
HSBC assumptions<br />
DCF, comprising<br />
Neutral<br />
Risk-free rate (%) 3.00 EBIT growth 2011-21e CAGR (%) 7.4<br />
Equity premium (%) 4.50 EBIT growth 2021-41e CAGR (%) 4.0<br />
Sec<strong>to</strong>r beta 1.20 Fade period 2041-46e<br />
Specific beta 1.15 WACC (%) 8.52<br />
Sensitivity and valuation range (USD/share)<br />
Cost <strong>of</strong> capital vs fade period 4 years 8 years 12 years<br />
7.5% 88.5 90.8 92.7<br />
8.0% 83.2 85.1 86.8<br />
8.5% 78.3 80.0 81.5<br />
9.0% 74.0 75.4 76.7<br />
9.5% 70.0 71.2 72.3<br />
Valuation data<br />
Year <strong>to</strong> 06/2011a 06/2012e 06/2013e 06/2014e<br />
EV/sales 5.1 4.4 3.7 3.2<br />
EV/EBITDA 15.0 12.5 10.4 8.9<br />
EV/IC 28.6 23.7 19.8 16.6<br />
PE* 26.3 21.6 18.7 16.5<br />
P/NAV 14.0 10.4 7.1 5.2<br />
FCF yield (%) 3.6 4.1 4.9 5.6<br />
Dividend yield (%) 1.2 1.3 1.4 1.6<br />
Note: * = Based on HSBC EPS (fully diluted)<br />
Issuer information<br />
Share price (USD) 76.74 Target price (USD) 80.00<br />
Reuters (Equity) COH.N Bloomberg (Equity) COH US<br />
Market cap (USDm) 22,083 Market cap (USDm) 22,083<br />
Free float (%) 100 Enterprise value (USDm) 21,042<br />
Country United States Sec<strong>to</strong>r Textiles, Apparel & Luxury<br />
Goods<br />
Analysts Erwan Rambourg Contact 852 2996 6572<br />
An<strong>to</strong>ine Belge Contact 33 1 5652 4348<br />
Sophie Dargnies Contact 33 1 5652 4347<br />
Price relative<br />
79<br />
69<br />
59<br />
49<br />
39<br />
29<br />
29<br />
mars-10 sept-10 mars-11 sept-11 mars-12<br />
Coach Rel <strong>to</strong> S&P 500<br />
Source: HSBC<br />
Note: price at close <strong>of</strong> 01 Mar 2012<br />
79<br />
69<br />
59<br />
49<br />
39<br />
37
Consumer Brands & Retail<br />
Global luxury goods<br />
March 2012<br />
abc<br />
Hengdeli Holdings Ltd<br />
Despite the recent rebound, we see further scope for the shares and<br />
no need for the company <strong>to</strong> go <strong>to</strong> the market <strong>to</strong> finance its growth<br />
Chairman’s use <strong>of</strong> shares as collateral for a loan and the Ming Fung<br />
deal have <strong>take</strong>n Hengdeli <strong>of</strong>f inves<strong>to</strong>rs’ radar screen<br />
Still compelling, increase target price <strong>to</strong> HKD4.75 (HKD4.20<br />
previously) on DCF roll-over and slightly higher estimates; remain<br />
Overweight (V)<br />
Fundamentals still strong<br />
Why buy after s<strong>to</strong>ck rises 50%?<br />
Mean reversion<br />
What is more important: that the s<strong>to</strong>ck has risen<br />
50% since early January or that it had more than<br />
halved the year before? We are not trying <strong>to</strong> play<br />
“chicken or egg” here but our view is that Hengdeli<br />
is only starting <strong>to</strong> recover from an unfair de-rating,<br />
partly linked <strong>to</strong> micro issues (Chairman’s loan,<br />
Ming Fung venture, impression the company<br />
needed the market <strong>to</strong> finance its growth; see our<br />
previous reports on Hengdeli for details), partly<br />
linked <strong>to</strong> macro issues (a hard landing scenario for<br />
China was the s<strong>to</strong>ry last autumn).<br />
We note that while global s<strong>to</strong>cks in the watch space<br />
(Richemont, Swatch) are not that far from their<br />
his<strong>to</strong>rical highs, Hengdeli is still c40% below the<br />
HKD5.07 high reached in November 2010.<br />
The market has considered it fair that Asia-driven<br />
watch retailers should trade at a discount <strong>to</strong> the global<br />
hard luxury companies they distribute for (after all, a<br />
high barrier-<strong>to</strong>-entry brand should trade at a premium<br />
<strong>to</strong> a retailer) but the chart on the right may also point<br />
<strong>to</strong> an exaggerated de-rating <strong>of</strong> the former.<br />
Hengdeli/Emperor vs Swatch/Richemont<br />
30%<br />
5%<br />
-20% '05 '06 '07 '08 '09 '10 '11<br />
-45%<br />
-70%<br />
Prem/Disc<br />
Average<br />
Avg=-27.1%<br />
Source: Thomson Reuters Datastream, I/B/E/S estimates for Emperor, HSBC estimates<br />
Market still waiting for trends <strong>to</strong> collapse; we<br />
still think it will not happen<br />
Swiss watch exports for January 2012 showed<br />
no signs <strong>of</strong> a slowdown for Hong Kong and<br />
China while the rest <strong>of</strong> the world (ex-US),<br />
logically, is slowing.<br />
Hengdeli has a c50% market share in China so<br />
this data is very relevant and shows the post-<br />
Chinese New Year orders were strong. Exports<br />
were up a third in HK and China in January 2012<br />
(but up "only" 16% globally).<br />
What does this tell us? This was the first set <strong>of</strong><br />
figures post Chinese New Year and they show that<br />
inven<strong>to</strong>ry overload fears were probably overdone<br />
and that sell-in and sell-through figures are now<br />
probably well aligned. The first two months <strong>of</strong><br />
38
Consumer Brands & Retail<br />
Global luxury goods<br />
March 2012<br />
abc<br />
trading should undoubtedly prove <strong>to</strong> be higher than<br />
our 18% sales growth projected for this year.<br />
Our biggest fear for the brands at Richemont and<br />
Swatch in the past few months was the theoretical<br />
risk that retailers would load up s<strong>to</strong>ck in anticipation<br />
<strong>of</strong> a strong Chinese New Year and then de-s<strong>to</strong>ck if<br />
they realised they had <strong>to</strong>o much. We believe this has<br />
remained theoretical and that the Chinese New Year<br />
“hurdle” was successfully passed.<br />
“Cheap and cheerful” vs “high and dry”<br />
could be the next debate<br />
This part is common <strong>to</strong> the investment cases <strong>of</strong><br />
Hengdeli, Richemont and the Swatch Group and<br />
concerns all three. As explained, we believe trends<br />
in China will slow but not see a steep step down and<br />
the recent Swiss watch exports data point <strong>to</strong> very<br />
decent orders that will support February/March<br />
sales. We think, however, that price points will<br />
matter more this year than last, with higher-end<br />
products probably seeing sales slow more than the<br />
average <strong>of</strong> the watch space. There are several<br />
reasons we think this will be the case:<br />
We estimate that up <strong>to</strong> two-thirds <strong>of</strong> consumers<br />
purchasing luxury products in China are new <strong>to</strong><br />
the brands they buy (ie not “repeat purchasers”)<br />
and are taking the view that the proportion <strong>of</strong><br />
clients “new <strong>to</strong> a brand” is greater at the lower<br />
price points (Rado, Mido, Longines, Tissot)<br />
than for Omega and above type <strong>of</strong> price points.<br />
We believe consumers able <strong>to</strong> afford higher<br />
price points are more “travelled” and exposed <strong>to</strong><br />
negative headline news weighing on sentiment<br />
and will <strong>take</strong> the view that they can postpone a<br />
EUR10k purchase, waiting for a better<br />
psychological environment.<br />
We are convinced that corporate gift giving (or<br />
Guanxi) drives high-end purchases more than it<br />
drives sales <strong>of</strong> the likes <strong>of</strong> Rado, Longines,<br />
Tissot, etc and if real estate deals are scarce and<br />
government <strong>of</strong>ficials change at year-end, we<br />
see gifting slowing, at least temporarily.<br />
Our estimate for Greater China is that sales growth<br />
for Omega and above price points will be in the high<br />
single digits/low double digits only while lowerpriced<br />
brands could still grow comfortably in the<br />
high 20s, if not more on the back <strong>of</strong> middle-class<br />
expansion and higher wages. We think Hengdeli is a<br />
good proxy for the space in Greater China and we<br />
see it increasing <strong>to</strong>tal sales in 2012e by 19% (vs 37%<br />
in 2011e), or 20% at retail (vs 36%), with mainland<br />
China up 26% (vs 38%) and Hong Kong up 10%<br />
only (vs 32%). Note there is a correlation between<br />
regional exposure and price points (the mainland is<br />
far more volume-driven than Hong Kong).<br />
Earnings, valuation and risks<br />
The next catalyst is the full-year 2011 results on 20<br />
March. We would keep riding the positive wave<br />
ahead <strong>of</strong> the release. As a low-teen PE s<strong>to</strong>ck for<br />
2012 delivering high-teen EPS growth on our<br />
estimates, this is still reasonable, in our view. We are<br />
no longer higher than consensus, but it is a question<br />
<strong>of</strong> the market starting <strong>to</strong> consider whether consensus<br />
is realistic (if not low).We have not <strong>to</strong>uched our<br />
sales forecast for 2011e and have only increased our<br />
2012e estimates by 5% on 2011e EBIT, and<br />
decreased by 1% for 2012e EBIT as we have<br />
increased wholesale growth since wholesale sales<br />
are very much driven by entry-level brands. We<br />
believe the results should show good inven<strong>to</strong>ry<br />
management (ie 180 days or less), cash generation<br />
(addressing market fears that this company may be a<br />
cash burner rather than a cash genera<strong>to</strong>r) and<br />
continued strong trends.<br />
Valuation<br />
We increase our DCF-based target price <strong>to</strong><br />
HKD4.75 (from HKD4.20) after rolling over our<br />
DCF basis by a year (now starting 2012). Our key<br />
assumption changes are a RFR <strong>of</strong> 3.0% vs 3.5%,<br />
ERP <strong>of</strong> 7.0% vs 6.5% and a WACC <strong>of</strong> 10.50% vs<br />
10.28% (see table on page 41). Under our research<br />
model, for s<strong>to</strong>cks with a volatility indica<strong>to</strong>r, the<br />
Neutral band is 10 ppts above and below the hurdle<br />
rate for Chinese s<strong>to</strong>cks <strong>of</strong> 10%. Our HKD4.75<br />
target price implies a 39% potential return, which is<br />
above the Neutral band; therefore, we reiterate our<br />
39
Consumer Brands & Retail<br />
Global luxury goods<br />
March 2012<br />
abc<br />
Overweight (V) rating on Hengdeli s<strong>to</strong>ck. Potential<br />
return equals the percentage difference between the<br />
current share price and the target price, including<br />
the forecast dividend yield when indicated.<br />
Hengdeli remains the highest potential return<br />
s<strong>to</strong>ck in our coverage. At the current price, and on<br />
our EPS estimates, Hengdeli is trading at 13.9x<br />
2012e and 11.7x 2013e earnings. On our target<br />
price, the s<strong>to</strong>ck would be trading at 19.3x 2012e<br />
earnings for 19% EPS growth.<br />
Risks<br />
Downside risks <strong>to</strong> our thesis include execution<br />
risk in managing the s<strong>to</strong>re expansion plans,<br />
higher-than-expected rent and staff cost inflation,<br />
and any macro threat in China affecting watch<br />
sales (or making inves<strong>to</strong>rs think that watch sales<br />
are at risk). M&A activity (eg buyout <strong>of</strong> retail<br />
s<strong>to</strong>res, further investment in Ming Fung) could<br />
well be negatively viewed by the market as well.<br />
Hengdeli - P&L statement<br />
Year <strong>to</strong> Dec (RMBm) 2009a H1 2010a H2 2010a 2010a H1 2011a H2 2011e 2011e 2012e 2013e<br />
Total number <strong>of</strong> s<strong>to</strong>res 270 302 350 350 380 400 400 440 480<br />
PRC retail (RMBm) 2,722 1,774 1,996 3,770 2,596 2,621 5,217 6,574 7,974<br />
- No. <strong>of</strong> s<strong>to</strong>res 224 252 286 286 311 326 326 362 400<br />
Same-s<strong>to</strong>re sales growth 12% 34% 32% 33% 38% 22% 30% 13% 15%<br />
% change y-o-y 17% 40% 37% 38% 46% 31% 38% 26% 21%<br />
HK retail (RMBm) 1,705 1,046 1,366 2,412 1,449 1,734 3,183 3,506 3,927<br />
- No. <strong>of</strong> s<strong>to</strong>res 13 15 16 16 16 19 19 20 21<br />
Same-s<strong>to</strong>re sales growth -37% 38% 34.4% 9% 21% 7% 9%<br />
% change y-o-y 20% 45% 33% 41% 39% 27% 32% 10% 12%<br />
Taiwan retail (RMBm) 8 68 125 193 103 155 258 305 345<br />
- No. <strong>of</strong> s<strong>to</strong>res 33 35 48 48 50 5 55 58 59<br />
Same-s<strong>to</strong>re sales growth 42% 25% 15% 12%<br />
% change y-o-y 51% 24% 34% 18% 13%<br />
Retailing (RMBm) 4,428 2,888 3,487 6,375 4,148 4,510 8,658 10,385 12,245<br />
y-o-y 44% 41% 44% 44% 29% 36% 20% 18%<br />
Same-s<strong>to</strong>re sales growth 36% 18% 26% 11% 13%<br />
Wholesale (RMBm) 1,330 751 910 1,661 1,156 1,203 2,359 2,735 3,125<br />
y-o-y -19% 10% 40% 25% 54% 31% 42% 16% 14%<br />
Others 134 75.6 104 180 104 130 234 281 331<br />
After-sales (RMBm) -6% 22% 45% 34% 37% 25% 30% 20% 18%<br />
Sales (RMBm) 5,892 3,715 4,501 8,216 5,407 5,843 11,250 13,400 15,700<br />
y-o-y 6.8% 37.8% 40.8% 39.4% 45.6% 29.8% 36.9% 19.1% 17.2%<br />
Gross pr<strong>of</strong>it (RMBm) 1,401 915 1,134 2,049 1,392 1,540 2,932 3,536 4,184<br />
GP margin 23.8% 24.6% 25.2% 24.9% 25.7% 26.4% 26.1% 26.4% 26.7%<br />
bp change -35.4 -0.8 213.2 115.6 112.9 114.9 112.3 32.4 26.4<br />
EBIT 578 387 432 819 643 601 1,245 1,472 1,735<br />
y-o-y 6.2% 28.2% - 41.6% 66.3% 39.2% 52.0% 18.3% 17.9%<br />
EBIT margin 9.8% 10.4% 9.6% 10.0% 11.9% 10.3% 11.1% 11.0% 11.1%<br />
Pre-tax pr<strong>of</strong>it 513 425 391 816 647 567 1,214 1,441 1,709<br />
y-o-y -14.0% 45.7% 76.1% 58.9% 52.4% 44.9% 48.8% 18.8% 18.6%<br />
Tax -128 -95 -103 -198 -147 -151 -297 -360 -427<br />
Eff tax rate (excl CB loss) 24.9% 22.4% 26.4% 24.3% 22.7% 26.6% 24.5% 25.0% 25.0%<br />
Minorities -21 -25 -39 -63 -52 -33 -85 -101 -120<br />
Net pr<strong>of</strong>it/(loss) - report 364 305 249 554 448 383 831 980 1,162<br />
y-o-y -16.8% 39.3% 71.1% 52.0% 46.8% 54.1% 50.1% 17.9% 18.6%<br />
Net margin 6.2% 8.2% 5.5% 6.7% 8.3% 6.6% 7.4% 7.3% 7.4%<br />
Source: Company data, HSBC estimates<br />
40
3<br />
8<br />
.<br />
9<br />
Consumer Brands & Retail<br />
Global luxury goods<br />
March 2012<br />
abc<br />
Financials & valuation: Hengdeli Holdings Ltd<br />
Overweight (V)<br />
Financial statements<br />
Year <strong>to</strong> 12/2010a 12/2011e 12/2012e 12/2013e<br />
DCF analysis<br />
HSBC assumptions<br />
DCF, comprising<br />
Pr<strong>of</strong>it & loss summary (CNYm)<br />
Revenue 8,216 11,250 13,400 15,700<br />
EBITDA 872 1,320 1,562 1,840<br />
Depreciation & amortisation -53 -76 -90 -104<br />
Operating pr<strong>of</strong>it/EBIT 819 1,245 1,472 1,735<br />
Net interest -37 -2 5 10<br />
PBT 816 1,214 1,441 1,709<br />
HSBC PBT 816 1,214 1,441 1,709<br />
Taxation -198 -297 -360 -427<br />
Net pr<strong>of</strong>it 554 831 980 1,162<br />
HSBC net pr<strong>of</strong>it 554 831 980 1,162<br />
Cash flow summary (CNYm)<br />
Cash flow from operations -216 195 488 824<br />
Capex -350 -170 -149 -148<br />
Cash flow from investment -584 -159 -149 -148<br />
Dividends -110 -166 -249 -294<br />
Change in net debt -15 1 -61 -317<br />
FCF equity -846 14 384 695<br />
Balance sheet summary (CNYm)<br />
Intangible fixed assets 304 304 304 304<br />
Tangible fixed assets 905 1,075 1,012 1,162<br />
Current assets 7,623 9,024 9,996 11,145<br />
Cash & others 3,410 3,627 3,688 4,005<br />
Total assets 8,938 10,509 11,428 12,739<br />
Operating liabilities 1,011 1,488 1,784 2,097<br />
Gross debt 3,403 3,621 3,621 3,621<br />
Net debt -7 -6 -67 -384<br />
Shareholders funds 4,316 4,984 5,714 6,583<br />
Invested capital 4,410 5,288 5,840 6,508<br />
Ratio, growth and per share analysis<br />
Year <strong>to</strong> 12/2010a 12/2011e 12/2012e 12/2013e<br />
Y-o-y % change<br />
Revenue 39.3 36.9 19.1 17.2<br />
EBITDA 40.2 51.3 18.3 17.8<br />
Operating pr<strong>of</strong>it 41.6 52.0 18.3 17.9<br />
PBT 58.9 48.8 18.8 18.6<br />
HSBC EPS 26.5 43.2 17.9 18.6<br />
Ratios (%)<br />
Revenue/IC (x) 2.2 2.3 2.4 2.5<br />
ROIC 16.6 19.4 19.9 21.1<br />
ROE 15.4 17.9 18.3 18.9<br />
ROA 9.4 9.9 10.2 10.9<br />
EBITDA margin 10.6 11.7 11.7 11.7<br />
Operating pr<strong>of</strong>it margin 10.0 11.1 11.0 11.1<br />
EBITDA/net interest (x) 23.3 818.7<br />
Net debt/equity -0.2 -0.1 -1.1 -5.3<br />
Net debt/EBITDA (x) 0.0 0.0 0.0 -0.2<br />
CF from operations/net debt<br />
Per share data (CNY)<br />
EPS Rep (fully diluted) 0.12 0.19 0.20 0.24<br />
HSBC EPS (fully diluted) 0.12 0.17 0.20 0.24<br />
DPS 0.04 0.06 0.07 0.08<br />
NAV 1.03 1.13 1.30 1.50<br />
Risk-free rate (%) 3.0 EBIT growth 09-19e CAGR (%) 14.7<br />
Equity Premium (%) 7.0 EBIT growth 19-39e CAGR (%) 3.0<br />
Sec<strong>to</strong>r beta 1.20 Fade period 2039-45e<br />
Specific beta 1.40 WACC (%) 10.50<br />
Key forecast drivers<br />
Year <strong>to</strong> 12/2010a 12/2011e 12/2012e 12/2013e<br />
Total number <strong>of</strong> s<strong>to</strong>res 350 400 440 480<br />
PRC retail sales growth (%) 38 38 26 21<br />
HK retail sales growth (%) 41 32 10 12<br />
Retail turnover growth (%) 44 36 20 18<br />
Wholesales revenue growth (%) 25 42 16 14<br />
Total sales growth (%) 39 37 19 17<br />
Valuation data<br />
Year <strong>to</strong> 12/2010a 12/2011e 12/2012e 12/2013e<br />
EV/sales 1.5 1.1 0.9 0.8<br />
EV/EBITDA 14.3 9.5 8.1 6.7<br />
EV/IC 2.8 2.4 2.2 1.9<br />
PE* 23.4 16.4 13.9 11.7<br />
P/NAV 2.7 2.5 2.1 1.9<br />
FCF yield (%) -6.8 0.1 3.0 5.4<br />
Dividend yield (%) 1.4 2.0 2.4 2.9<br />
Note: * = Based on HSBC EPS (fully diluted)<br />
Issuer information<br />
Share price (HKD) 3.42 Target price (HKD) 4.75<br />
Reuters (Equity) 3389.HK Bloomberg (Equity) 3389 HK<br />
Market cap (USDm) 1,939 Market cap (HKDm) 15,042<br />
Free float (%) 15 Enterprise value (CNYm) 12,572<br />
Country China Sec<strong>to</strong>r Distribu<strong>to</strong>rs<br />
Analysts Erwan Rambourg Contact 852 2996 6572<br />
An<strong>to</strong>ine Belge Contact 33 1 5652 4347<br />
Sophie Dargnies Contact 33 1 5652 4348<br />
Price relative<br />
5.5<br />
5<br />
4.5<br />
4<br />
3.5<br />
3<br />
2.5<br />
2<br />
1.5<br />
1<br />
Jun-11<br />
Hengdeli Holdings Ltd<br />
Source: HSBC<br />
Note: price at close <strong>of</strong> 01 Mar 2012<br />
Dec-11<br />
Rel <strong>to</strong> SSE COMPOSITE INDEX<br />
5.5<br />
5<br />
4.5<br />
4<br />
3.5<br />
3<br />
2.5<br />
2<br />
1.5<br />
1<br />
41
Consumer Brands & Retail<br />
Global luxury goods<br />
March 2012<br />
abc<br />
Hermès<br />
Hermès should remain one <strong>of</strong> the fastest-growing companies in<br />
terms <strong>of</strong> <strong>to</strong>p line, but not in line in terms <strong>of</strong> EPS growth<br />
New capital structure should limit speculation<br />
Downgrading <strong>to</strong> Underweight (from Neutral) and increasing<br />
target price <strong>to</strong> EUR272 (from EUR240) on the back <strong>of</strong> earnings<br />
estimate increases<br />
Downgrade <strong>to</strong> Underweight<br />
New capital structure may limit<br />
speculation<br />
At end-2011, LVMH owned 22.4% <strong>of</strong> Hermès<br />
International.<br />
On 3 December 2011, the Hermès family created a<br />
private holding company in France, named H51. H51<br />
has 50.2% <strong>of</strong> <strong>to</strong>tal Hermès International share capital<br />
and has preferential rights on 12.3% <strong>of</strong> <strong>to</strong>tal share<br />
capital directly owned by family group members.<br />
Only 20 people from the family who owned c10% <strong>of</strong><br />
the s<strong>to</strong>ck decided not <strong>to</strong> be part <strong>of</strong> this holding<br />
company or <strong>to</strong> be subject <strong>to</strong> preferential rights.<br />
With this new structure (which limits the sale <strong>of</strong><br />
shares outside the Hermès family) and with the<br />
limited free float (c5.5% in our view), we think any<br />
further press speculation about it is less likely (the last<br />
example was on 9 June 2011, when the Daily Mail<br />
speculated that ‘LVMH was preparing a 350 euros-ashare<br />
<strong>of</strong>fer for Hermès’).<br />
Top line should be one <strong>of</strong> the best-inclass<br />
thanks <strong>to</strong> distinctive positioning<br />
Hermès posted a 14% organic sales growth in Q4 (vs<br />
18% in Q3). Growth in Hermès' own s<strong>to</strong>res (c80-82%<br />
<strong>of</strong> sales, +16%) continued <strong>to</strong> outperform growth in<br />
wholesale (c18-20% <strong>of</strong> sales, c6%) in Q4, which was<br />
impacted by delivery delays and the acquisition <strong>of</strong><br />
four concessions (two in Japan and two in Russia).<br />
The Q4 sales trend was at the low end <strong>of</strong> the range in<br />
terms <strong>of</strong> sales trends compared <strong>to</strong> our luxury coverage<br />
but we believe one <strong>of</strong> the main reason was the lack <strong>of</strong><br />
products in s<strong>to</strong>res (due <strong>to</strong> capacity constraints).<br />
Management said that sales in January 2012 grew at<br />
the same pace as Q4. Although we expect lower sales<br />
growth in Europe and in the US in 2012, we believe<br />
Hermès should record one <strong>of</strong> the highest sales growth<br />
rates in our luxury coverage thanks <strong>to</strong> its distinctive<br />
positioning. Indeed, even in 2009, the group<br />
registered only one quarter <strong>of</strong> negative sales trends:<br />
organic sales growth in Q1 2009 was down 5% (due<br />
<strong>to</strong> third-party distribution des<strong>to</strong>cking) but own-s<strong>to</strong>res<br />
sales growth was still positive (6%). We forecast<br />
13% organic sales growth in 2012e.<br />
42
Consumer Brands & Retail<br />
Global luxury goods<br />
March 2012<br />
abc<br />
Earnings, valuation and risks<br />
Hermès will report full earnings on 22 March<br />
2012. On the back <strong>of</strong> the strong 2011 sales,<br />
Hermès gave more accurate 2011 EBIT margin<br />
guidance. Management now expects <strong>to</strong> have an<br />
operating margin exceeding 30% vs ‘over the<br />
record-high achieved in 2010 (27.8%)’,<br />
previously. We forecast a 30.4% EBIT margin for<br />
2011 (vs 29% previously).<br />
Our 2012 EPS growth forecast is for a 19%<br />
increase year-on-year but we believe several<br />
luxury players will achieve 20%+.<br />
At the same time, Hermès’ shares have risen 23%<br />
since the beginning <strong>of</strong> 2012 after a 47% run in<br />
2011 (vs an 11% decline on average for peers).<br />
The s<strong>to</strong>ck is now trading at 42.9x 2012e and 38.3x<br />
2013e PE, ie a 152% premium <strong>to</strong> peers.<br />
Hermes' share price performance since January 2010<br />
300<br />
280<br />
260<br />
240<br />
220<br />
200<br />
180<br />
160<br />
140<br />
120<br />
100<br />
80<br />
Jan-10 May -10 Sep-10 Jan-11 May -11 Sep-11 Jan-12<br />
Source: Thomson Reuters Datastream<br />
For 2012e, management guided <strong>to</strong>wards 10%<br />
organic sales growth (with c10% in Europe, above<br />
10% in Americas and Asia and 0%+ in Japan),<br />
and underlined that operating leverage and the FX<br />
impact should not be as positive at the EBIT<br />
margin level for 2012 compared <strong>to</strong> 2011.<br />
We increase our 2012-13e EBIT estimates by<br />
7% and 9%, respectively, due <strong>to</strong> the higher Q4<br />
2011 sales and higher 2011 EBIT margin<br />
guidance. For 2012e and 2013e, we forecast<br />
organic sales growth <strong>of</strong> 13% (12% previously)<br />
and 10% (12% previously), respectively, and<br />
EBIT margin <strong>of</strong> 31% (vs 29.7% previously) and<br />
31.5% (vs 30.4% previously).<br />
Since March 2009, we have believed Hermès<br />
should trade structurally at a premium <strong>to</strong> its<br />
DCF value (and as a result we continue <strong>to</strong> apply<br />
a 25% premium). For many years, Hermès’ s<strong>to</strong>ck<br />
has been supported by the limited free float,<br />
<strong>take</strong>over speculation in the press and the potential<br />
for short squeezes.<br />
On our fundamental DCF valuation, we now<br />
value Hermès at EUR217.60 (vs EUR192) on the<br />
back <strong>of</strong> our earnings estimate increases and a<br />
change <strong>to</strong> our WACC (5.16% vs 5.30%) with<br />
these revisions: RFR <strong>of</strong> 3.0% vs 3.5%, ERP <strong>of</strong><br />
6.0% vs 5.0%. Applying a 25% premium <strong>to</strong> this<br />
fundamental valuation, we derive a new EUR272<br />
target price (up from EUR240). A full breakdown<br />
<strong>of</strong> our DCF assumptions is provided in the<br />
financials and valuation on page 45.<br />
Under our research model, for Europe ex-UK<br />
s<strong>to</strong>cks without a volatility indica<strong>to</strong>r, the Neutral<br />
band is 5 percentage points above and below the<br />
hurdle rate for Europe ex-UK s<strong>to</strong>cks <strong>of</strong> 9.0%. As<br />
our target price implies a -4.1% potential return,<br />
we downgrade <strong>to</strong> Underweight (from Neutral).<br />
Potential return equals the percentage difference<br />
between the current share price and the target<br />
price, including the forecast dividend yield<br />
when indicated.<br />
Upside risks include the current thin free float<br />
(c5.5%) being further reduced by share purchases<br />
by LVMH on the market or a buy-back by<br />
Hermès <strong>to</strong> cover employees’ grant shares.<br />
43
Consumer Brands & Retail<br />
Global luxury goods<br />
March 2012<br />
abc<br />
Hermès FY results and forecasts<br />
EURm 2004a YoY 2005a<br />
(%)<br />
YoY 2006a<br />
(%)<br />
YoY 2007a<br />
(%)<br />
YoY 2008a<br />
(%)<br />
YoY 2009a<br />
(%)<br />
YoY 2010a<br />
(%)<br />
YoY 2011e<br />
(%)<br />
YoY 2012e<br />
(%)<br />
YoY 2013e<br />
(%)<br />
Sales 1,332 8 1,427 7 1,515 6 1,625 7 1,765 9 1,914 8 2,401 25 2,841 18 3,300 16 3,628 10<br />
Gross pr<strong>of</strong>it 868 8 929 7 990 7 1,055 7 1,140 8 1,213 6 1,586 31 1,942 22 2,262 16 2,494 10<br />
Gross margin (%) 65.2% 65.1% 65.4% 64.9% 64.6% 63.3% 66.1% 68.4% 68.6% 68.8%<br />
Communication 71 27 76 7 90 18 93 3 98 5 91 -7 126 38 150 19 175 17 180 3<br />
as a % <strong>of</strong> sales 5.3% 5.3% 5.9% 5.7% 5.5% 4.8% 5.2% 5.3% 5.3% 5.0%<br />
Other operating costs 440 6 469 7 499 6 547 10 593 8 658 11 792 20 928 17 1,064 15 1,171 10<br />
EBIT 357 7 384 7 401 5 415 3 449 8 463 3 668 44 864 29 1,023 18 1,143 12<br />
EBIT margin 26.8 26.9 26.5 25.5 25.5 24.2 27.8 30.4 31.0 31.5<br />
Financial income 8 4 0 12 18 -13 -13 26 22 27<br />
Pre-tax pr<strong>of</strong>it 344 1 388 13 409 6 438 7 455 4 444 -3 653 47 880 35 1045 19 1170 12<br />
Net pr<strong>of</strong>it 214 -1 247 16 268 9 288 7 290 1 289 0 422 46 589 40 699 19 783 12<br />
HSBC EPS (EUR) 2.07 3 2.26 10 2.50 11 2.71 8 2.76 2 2.74 -0.5 4.00 46 5.58 40 6.62 19 7.41 12<br />
Source: Company data, HSBC estimates<br />
YoY<br />
(%)<br />
Hermès sales by geographic and product category<br />
EURm 2004a YoY 2005a<br />
(%)<br />
YoY 2006a<br />
(%)<br />
YoY 2007a<br />
(%)<br />
YoY 2008a<br />
(%)<br />
YoY 2009a<br />
(%)<br />
YoY 2010a<br />
(%)<br />
YoY 2011e<br />
(%)<br />
YoY 2012e<br />
(%)<br />
YoY 2013e<br />
(%)<br />
By product<br />
Silk 150 6% 163 9% 174 6% 193 11% 208 8% 227 9% 284 25% 347 22% 410 18% 453 10%<br />
Handbags & Travel 529 13% 568 7% 664 17% 675 2% 763 13% 936 23% 1,205 29% 1,348 12% 1,579 17% 1,753 11%<br />
RTW & accessories 273 2% 294 8% 294 0% 315 7% 337 7% 360 7% 445 24% 576 29% 681 18% 749 10%<br />
Other activities 134 12% 141 6% 77 -45% 86 11% 80 -6% 78 -2% 87 11% 109 25% 122 12% 132 8%<br />
Perfume 65 20% 73 13% 101 38% 119 18% 125 5% 117 -6% 138 17% 159 16% 171 7% 183 7%<br />
Watches 100 0% 104 4% 110 6% 105 -5% 95 -10% 87 -8% 113 30% 139 23% 157 13% 170 8%<br />
Tableware 35 3% 37 6% 45 21% 51 14% 48 -6% 38 -20% 44 14% 51 17% 56 9% 58 5%<br />
Other products 47 -2% 48 1% 52 8% 82 60% 109 33% 71 -35% 86 21% 113 31% 124 9% 130 5%<br />
Total 1,332 1,427 1,515 1,625 1765 1,914 2,401 2,841 3,300 3,628<br />
By geographic<br />
France 256 3% 269 5% 290 8% 327 13% 359 10% 370 3% 437 18% 495 13% 554 12% 610 10%<br />
Europe 222 9% 243 9% 280 15% 346 24% 382 10% 385 1% 463 20% 560 21% 623 11% 679 9%<br />
Total Europe 479 6% 512 7% 570 11% 673 18% 741 10% 756 2% 901 19% 1,055 17% 1,177 12% 1,289 9%<br />
Japan 398 7% 415 4% 410 -1% 382 -7% 393 3% 408 4% 453 11% 472 4% 512 9% 517 1%<br />
Asia 217 14% 245 13% 261 6% 282 8% 321 14% 423 32% 631 49% 808 28% 1,020 26% 1,173 15%<br />
Total Asia 616 9% 660 7% 671 2% 664 -1% 713 7% 831 16% 1,084 30% 1,280 18% 1,532 20% 1,690 10%<br />
America 197 11% 216 10% 232 8% 246 6% 265 8% 294 11% 385 31% 464 21% 545 17% 599 10%<br />
Rest <strong>of</strong> the world 41 8% 39 -4% 42 8% 43 1% 46 7% 34 -25% 31 -8% 43 37% 46 8% 50 8%<br />
Total 1,332 1427 1515 1,625 1,765 1,914 2,401 2,841 3,300 3,628<br />
Source: Company data, HSBC estimates<br />
YoY<br />
(%)<br />
44
-<br />
4<br />
.<br />
1<br />
Consumer Brands & Retail<br />
Global luxury goods<br />
March 2012<br />
abc<br />
Financials & valuation: Hermès<br />
Underweight<br />
Financial statements<br />
Year <strong>to</strong> 12/2010a 12/2011e 12/2012e 12/2013e<br />
DCF analysis<br />
HSBC assumptions<br />
DCF, comprising<br />
Pr<strong>of</strong>it & loss summary (EURm)<br />
Revenue 2,401 2,841 3,300 3,628<br />
EBITDA 790 993 1,160 1,289<br />
Depreciation & amortisation -121 -129 -137 -146<br />
Operating pr<strong>of</strong>it/EBIT 668 864 1,023 1,143<br />
Net interest -13 26 22 27<br />
PBT 653 880 1,045 1,170<br />
HSBC PBT 653 880 1,045 1,170<br />
Taxation -221 -280 -334 -374<br />
Net pr<strong>of</strong>it 422 589 699 783<br />
HSBC net pr<strong>of</strong>it 422 589 699 783<br />
Cash flow summary (EURm)<br />
Cash flow from operations 655 661 797 887<br />
Capex -138 -210 -250 -280<br />
Cash flow from investment -138 -210 -250 -280<br />
Dividends -119 -120 -221 -262<br />
Change in net debt -321 -356 -349 -372<br />
FCF equity 477 476 569 634<br />
Balance sheet summary (EURm)<br />
Intangible fixed assets 112 112 112 112<br />
Tangible fixed assets 774 855 968 1,101<br />
Current assets 1,564 1,991 2,386 2,803<br />
Cash & others 844 1,191 1,539 1,911<br />
Total assets 2,918 3,427 3,935 4,485<br />
Operating liabilities 697 725 744 760<br />
Gross debt 44 44 44 44<br />
Net debt -828 -1,185 -1,534 -1,905<br />
Shareholders funds 2,150 2,619 3,097 3,618<br />
Invested capital 909 1,042 1,184 1,346<br />
Ratio, growth and per share analysis<br />
Year <strong>to</strong> 12/2010a 12/2011e 12/2012e 12/2013e<br />
Y-o-y % change<br />
Revenue 25.4 18.3 16.1 9.9<br />
EBITDA 42.4 25.7 16.9 11.1<br />
Operating pr<strong>of</strong>it 44.4 29.2 18.5 11.7<br />
PBT 47.1 34.9 18.7 12.0<br />
HSBC EPS 45.7 39.5 18.6 12.0<br />
Ratios (%)<br />
Risk-free rate (%) 3.00 EBIT growth 2011-21e CAGR (%) 14.5<br />
Equity premium (%) 6.00 EBIT growth 2021-41e CAGR (%) 4.0<br />
Sec<strong>to</strong>r beta 1.20 Fade period 2041-47e<br />
Specific beta 0.30 WACC (%) 5.16<br />
Sensitivity and valuation range (DCF) <strong>to</strong> which we then add a 25% premium <strong>to</strong><br />
derive our target price (EUR272 per share)<br />
Cost <strong>of</strong> capital vs fade period 4 years 8 years 12 years<br />
4.8% 222.5 233.3 242.7<br />
5.0% 215.2 225.2 234.4<br />
5.2% 208.3 217.6 226.5<br />
5.4% 201.7 210.4 219.0<br />
5.6% 195.4 203.6 211.8<br />
Valuation data<br />
Year <strong>to</strong> 12/2010a 12/2011e 12/2012e 12/2013e<br />
EV/sales 11.9 10.0 8.5 7.6<br />
EV/EBITDA 36.3 28.5 24.1 21.4<br />
EV/IC 31.5 27.1 23.6 20.5<br />
PE* 70.9 50.8 42.9 38.3<br />
P/NAV 14.1 11.6 9.8 8.4<br />
FCF yield (%) 1.6 1.6 1.9 2.2<br />
Dividend yield (%) 0.5 0.7 0.9 1.0<br />
Note: * = Based on HSBC EPS (fully diluted)<br />
Issuer information<br />
Share price (EUR) 283.55 Target price (EUR) 272.00<br />
Reuters (Equity) HRMS.PA Bloomberg (Equity) RMS FP<br />
Market cap (USDm) 39,911 Market cap (EURm) 29,934<br />
Free float (%) 6 Enterprise value (EURm) 28,281<br />
Country France Sec<strong>to</strong>r Textiles, Apparel & Luxury<br />
Goods<br />
Analysts An<strong>to</strong>ine Belge Contact 33 1 5652 4347<br />
Erwan Rambourg Contact 852 2996 6572<br />
Sophie Dargnies Contact 33 1 5652 434<br />
Price relative<br />
Revenue/IC (x) 2.6 2.9 3.0 2.9<br />
ROIC 47.5 60.3 62.5 61.4<br />
ROE 21.4 24.7 24.4 23.3<br />
ROA 16.1 18.9 19.3 18.9<br />
EBITDA margin 32.9 34.9 35.2 35.5<br />
Operating pr<strong>of</strong>it margin 27.8 30.4 31.0 31.5<br />
EBITDA/net interest (x) 63.2<br />
Net debt/equity -38.3 -44.8 -48.9 -52.0<br />
Net debt/EBITDA (x) -1.0 -1.2 -1.3 -1.5<br />
CF from operations/net debt<br />
Per share data (EUR)<br />
348<br />
328<br />
308<br />
288<br />
268<br />
248<br />
228<br />
208<br />
188<br />
168<br />
Jun-11<br />
Hermes<br />
Rel <strong>to</strong> SBF-120<br />
Dec-11<br />
348<br />
328<br />
308<br />
288<br />
268<br />
248<br />
228<br />
208<br />
188<br />
168<br />
EPS Rep (fully diluted) 4.00 5.58 6.62 7.41<br />
HSBC EPS (fully diluted) 4.00 5.58 6.62 7.41<br />
DPS 1.50 2.09 2.48 2.78<br />
NAV 20.09 24.47 28.94 33.80<br />
Source: HSBC<br />
Note: price at close <strong>of</strong> 01 Mar 2012<br />
45
Consumer Brands & Retail<br />
Global luxury goods<br />
March 2012<br />
abc<br />
Hugo Boss<br />
HB has enjoyed the strongest consensus earnings revision<br />
‘momentum’ <strong>of</strong> the luxury sec<strong>to</strong>r over the last two years …<br />
… and has been rewarded by the strongest re-rating since<br />
Burberry in 2009-2010<br />
Remain Neutral, raise target price <strong>to</strong> EUR87 (from EUR82) on our<br />
higher estimates<br />
The best ‘momentum’ s<strong>to</strong>ry in<br />
the sec<strong>to</strong>r, but well rewarded<br />
Consensus earnings up 148% in last two years …<br />
Since the beginning <strong>of</strong> 2010, Hugo Boss (HB) has<br />
been the best momentum s<strong>to</strong>ry in the sec<strong>to</strong>r.<br />
According <strong>to</strong> Thomson Reuters Datastream, sellside<br />
consensus estimates for 2012 are now 148%<br />
higher than two years ago (end <strong>of</strong> February 2010).<br />
On 8 November 2011, the company significantly<br />
raised its FY15 guidance given on 12 April 2010.<br />
HB now expects 2015 sales <strong>of</strong> EUR3bn (vs<br />
EUR2.5bn previously) and 2015 EBITDA <strong>of</strong><br />
EUR750m (vs EUR500m previously). This<br />
implies a 2010-15e (five-year) CAGR <strong>of</strong> 12% in<br />
sales and 16% in EBITDA.<br />
Hugo Boss: a significant re-rating vs LVMH*<br />
EUR per share Hugo Boss LVMH<br />
Consensus 2012 EPS 2 years ago 1.84 5.46<br />
Consensus 2012 EPS <strong>to</strong>day 4.56 7.07<br />
Earnings revision 148% 29%<br />
Share price 2 years ago 24.01 79.00<br />
Share price <strong>to</strong>day 81.48 128.80<br />
Share price movement 239% 63%<br />
PE n+1 (2 year ago, ie 2011) 12.1 16.3<br />
PE n+1 (<strong>to</strong>day, ie 2013) 15.9 16.2<br />
HB discount <strong>to</strong> LVMH (2 years ago) -26%<br />
HB discount <strong>to</strong> LVMH (<strong>to</strong>day) -2%<br />
*Based on data as <strong>of</strong> 1 March Source: Thomson Reuters Datastream<br />
… rewarded by 239% increase in share price<br />
This performance has been rewarded by a 239%<br />
increase in the share price over the last two years,<br />
implying a significant re-rating <strong>of</strong> HB, both in<br />
absolute and relative terms. Based on consensus<br />
estimates, HB is now trading broadly in line with<br />
LVMH (the best proxy for the luxury goods<br />
sec<strong>to</strong>r, in our view) compared <strong>to</strong> a 26% discount<br />
two years ago.<br />
Short-term catalysts may now be lacking<br />
Since the beginning <strong>of</strong> 2012, HB has been the best<br />
share price performer in our universe, with a 43%<br />
rise. We believe part <strong>of</strong> this share price strength<br />
was a recovery effect from the weakness that<br />
followed a 14 November 2011 placement by<br />
controlling shareholder Permira (cut its holding<br />
from 55% <strong>to</strong> 42% <strong>of</strong> preference shares; its holding<br />
in the ordinary shares was unchanged at 88%).<br />
HB shares also benefited from stronger-thanexpected<br />
2011 results as well as anticipation <strong>of</strong><br />
strong 2012 guidance. Further short-term catalysts<br />
may thus be lacking. HB will provide precise<br />
2012 guidance on 14 March 2012, but its CEO<br />
has already stated that he was "confident despite<br />
the uncertain economic environment, the group<br />
will <strong>take</strong> another big step <strong>to</strong>wards its 2015 goals".<br />
46
Consumer Brands & Retail<br />
Global luxury goods<br />
March 2012<br />
abc<br />
We believe inves<strong>to</strong>rs have already <strong>take</strong>n on board<br />
that 2012 guidance will at least be in line with the<br />
annual average <strong>of</strong> the remaining years <strong>of</strong> the<br />
2010-2015 plan, which call for EBITDA <strong>of</strong><br />
EUR750m in 2015. Given that the 2011 EBITDA<br />
figure was EUR469m, we believe the 2012<br />
guidance implies a c12% increase in EBITDA <strong>to</strong><br />
cEUR525m.<br />
Still a very good fundamental s<strong>to</strong>ry<br />
We expect the main drivers <strong>of</strong> the 2011-15e growth<br />
<strong>to</strong> be:<br />
The over-proportionate growth in retail sales<br />
(which should reach at least 55% <strong>of</strong> sales in<br />
2015 vs 40% in 2010), including a mid singledigit<br />
average comps increase, 50 s<strong>to</strong>re openings<br />
per annum and some franchise buy-backs and<br />
conversion <strong>of</strong> corners in<strong>to</strong> shop-in-shops.<br />
The over-proportionate growth in sales in<br />
Asia (and <strong>to</strong> a lesser extent US sales), which<br />
should account for 21% <strong>of</strong> sales in 2015e vs<br />
13% in 2010.<br />
Better efficiencies (notably thanks <strong>to</strong> the<br />
"DRIVE" programme): supply chain, logistics,<br />
cus<strong>to</strong>mer service, improved coverage <strong>of</strong> the<br />
different segments <strong>of</strong> clothing and sportswear<br />
through five distinctive brands.<br />
The over-proportionate growth in womenswear and<br />
accessories anticipated by management should be a<br />
less significant driver, in our view.<br />
Earnings, valuation and risks<br />
On 9 February, HB reported preliminary results for<br />
2011. EBITDA rose 34% <strong>to</strong> EUR469m (vs 25-30%<br />
guidance and 30% consensus), implying a 270bp<br />
EBITDA improvement <strong>to</strong> 22.8% (driven mostly by a<br />
200bp GM increase <strong>to</strong> 61.4%).<br />
The 17% organic growth achieved in Q4 (19% over<br />
2011) was impressive for a group still generating<br />
c60% <strong>of</strong> its sales in Europe. Organic growth in Q4<br />
was in double digits in all regions, with the US and<br />
Asia above 20%. Europe was up by double digits as<br />
well with the UK and Germany doing particularly<br />
well (Spain was the only really weak spot).<br />
Performance within retail (c44% <strong>of</strong> sales in 2011<br />
and c55-60% in Q4) was a stand-out, driving the<br />
GM higher by 240bp in Q4 (<strong>to</strong>gether with selective<br />
price increases, a low level <strong>of</strong> markdowns and the<br />
benefits <strong>of</strong> the DRIVE project). The GM<br />
performance is a positive surprise after a 40bp<br />
decline in Q3. In Q4 alone (which is usually a lower<br />
quarter in terms <strong>of</strong> pr<strong>of</strong>its), EBITDA grew 26% <strong>to</strong><br />
EUR97m, a 120bp EBITDA margin expansion.<br />
Our 2012 and 2013 forecasts are for organic sales<br />
growth <strong>of</strong> 10% and 9% and EBIT margin gains <strong>of</strong><br />
90bp and 70bp. Our 2015 EBITDA estimate is<br />
EUR738m, 2% below the company’s EUR750m<br />
guidance (not because we are not confident that the<br />
company cannot meet its guidance, rather that our<br />
DCF methodology treats 2015 as a ‘medium-term’<br />
rather than a ‘specific’ year).<br />
We raise our 2012-2014 EPS estimates by 8% on<br />
the back <strong>of</strong> better-than-expected 2011 results and<br />
higher sales forecasts for Europe, and therefore<br />
increase our DCF-based target price for Hugo<br />
Boss <strong>to</strong> EUR87 from EUR82. The assumptions<br />
used in our DCF-derived target price are detailed<br />
on page 49, with these revisions: RFR <strong>of</strong> 3.0% vs<br />
3.5%, ERP <strong>of</strong> 6.0% vs 5.0%, specific beta <strong>of</strong> 1.0<br />
vs 1.1 and a WACC <strong>of</strong> 10.02% vs 8.8%. Under<br />
our research model, for s<strong>to</strong>cks without a volatility<br />
indica<strong>to</strong>r, the Neutral band is 5 percentage points<br />
above and below the hurdle rate for Europe ex-<br />
UK s<strong>to</strong>cks <strong>of</strong> 9.0%. Our target price provides a<br />
potential return <strong>of</strong> 6.8%, within the Neutral band<br />
<strong>of</strong> our model; therefore, we are reiterating our<br />
Neutral rating. Potential return equals the<br />
percentage difference between the current share<br />
price and the target price, including the forecast<br />
dividend yield when indicated.<br />
Upside specific risks include continued outperformance<br />
on 2015 targets. Downside<br />
theoretical risks include consumers’ confusion<br />
between the group’s five brands.<br />
47
Consumer Brands & Retail<br />
Global luxury goods<br />
March 2012<br />
abc<br />
Hugo Boss - pr<strong>of</strong>it & loss<br />
(EURm) 2006a 2007a 2008a 2009a 2010a 2011e 2012e 2013e 2014e<br />
Sales 1,495.5 1,632.0 1,686.1 1,561.9 1,729.4 2,058.6 2,300.0 2,500.0 2,700.0<br />
% y-o-y 14.2% 9.1% 3.3% -7.4% 10.7% 19.0% 11.7% 8.7% 8.0%<br />
Gross pr<strong>of</strong>it 854.5 946.4 1,010.6 850.1 1,027.1 1,264.0 1,421.4 1,555.0 1,690.2<br />
gross pr<strong>of</strong>it margin 57.1% 58.0% 59.9% 54.4% 59.4% 61.4% 61.8% 62.2% 62.6%<br />
Total SG&A -621.1 -658.7 -723.0 -691.7 -762.6 -864.2 -955.1 -1,031.0 -1,106.8<br />
% y-o-y 17.9% 6.1% 9.8% - 10.3% 13.3% 10.5% 7.9% 7.4%<br />
Ratio (in %) -41.5% -40.4% -42.9% -44.3% -44.1% -42.0% -41.5% -41.2% -41.0%<br />
Adjusted EBITDA 233.4 287.7 287.6 270.2 349.0 469.0 541.1 604.7 670.5<br />
Y-o-y 13.9% 23.3% -0.0% -6.0% 29.1% 34.4% 15.4% 11.8% 10.9%<br />
Adjusted EBITDA margin (in %) 15.6% 17.6% 17.1% 17.3% 20.2% 22.8% 23.5% 24.2% 24.8%<br />
One-<strong>of</strong>f adj. EBITDA <strong>to</strong> EBITDA 0.0 0.0 -36.0 -42.7 -13.6 0.0 0.0 0.0 0.0<br />
EBITDA 233.4 287.7 251.6 227.5 335.4 469.0 541.1 604.7 670.5<br />
EBITDA margin (%) 15.6% 17.6% 14.9% 14.6% 19.4% 22.8% 23.5% 24.2% 24.8%<br />
Amortisation & depreciation -49.1 -67.5 -60.9 -69.1 -70.9 -69.2 -74.7 -80.7 -87.2<br />
EBIT 184.4 220.2 190.7 158.4 264.5 399.8 466.3 524.0 583.3<br />
% y-o-y 13.2% 19.4% -13.4% -16.9% 67.0% 51.1% 16.7% 12.4% 11.3%<br />
EBIT margin (%) 12.3% 13.5% 11.3% 10.1% 15.3% 19.4% 20.3% 21.0% 21.6%<br />
Net financial result -4.5 -7.9 -41.7 -21.8 -14.8 -16.6 -7.0 -2.0 3.0<br />
EBT 179.9 212.3 149.0 136.6 249.7 383.2 459.3 522.0 586.3<br />
Income tax expenses -51.2 -58.3 -36.4 -32.7 -59.9 -92.0 -110.3 -125.3 -140.8<br />
Tax rate (%) -28.5% -27.5% -24.4% -23.9% -24.0% -24.0% -24.0% -24.0% -24.0%<br />
Net pr<strong>of</strong>it 128.7 154.0 112.6 104.0 189.8 291.2 349.0 396.7 445.6<br />
Minorities 0.0 -0.1 -0.1 -0.1 -3.3 -7.1 -8.1 -9.1 -10.1<br />
Net pr<strong>of</strong>it after minorities 128.6 153.9 112.5 103.9 186.4 284.1 340.9 387.6 435.5<br />
EPS preferred (EUR) 1.86 2.24 1.63 1.51 2.70 4.12 4.94 5.62 6.31<br />
% y-o-y 20.1% 20.4% -27.2% -7.4% 79.0% 52.5% 20.0% 13.7% 12.4%<br />
Number <strong>of</strong> shares (m) 69.1 68.7 69.0 68.8 69.0 69.0 69.0 69.0 69.0<br />
Sources: Company data, HSBC estimates<br />
Hugo Boss - split <strong>of</strong> sales<br />
(EURm) 2006a 2007a 2008a 2009a 2010a 2011e 2012e 2013e 2014e<br />
By region<br />
Europe 1,029 1,124 1,170 1,041 1,073 1,244 1,318 1,384 1,440<br />
America 274 299 307 312 381 454 523 572 618<br />
Asia 150 161 162 165 230 311 406 487 582<br />
Licences 43 49 47 44 45 50 53 57 61<br />
Total 1,496 1,632 1,686 1,562 1,729 2,059 2,300 2,500 2,700<br />
Europe 69% 69% 69% 67% 62% 60% 57% 55% 53%<br />
America 18% 18% 18% 20% 22% 22% 23% 23% 23%<br />
Asia 10% 10% 10% 11% 13% 15% 18% 19% 22%<br />
Licences 3% 3% 3% 3% 3% 2% 2% 2% 2%<br />
Total 100% 100% 100% 100% 100% 100% 100% 100% 100%<br />
By distribution network<br />
Wholesale na na 1,183 1,008 993 1,094 1,165 1,206 1,248<br />
Retail na na 456 510 691 914 1,081 1,237 1,390<br />
Licences na na 47 44 45 50 53 57 61<br />
Total na na 1,686 1,562 1,729 2,059 2,300 2,500 2,700<br />
Wholesale na na 70% 65% 57% 53% 51% 48% 46%<br />
Retail na na 27% 33% 40% 44% 47% 49% 51%<br />
Licences na na 3% 3% 3% 2% 2% 2% 2%<br />
Total na na 100% 100% 100% 100% 100% 100% 100%<br />
Sources: Company data, HSBC estimates<br />
48
6<br />
.<br />
8<br />
Consumer Brands & Retail<br />
Global luxury goods<br />
March 2012<br />
abc<br />
Financials & valuation: Hugo Boss<br />
Neutral<br />
Financial statements<br />
Year <strong>to</strong> 12/2010a 12/2011e 12/2012e 12/2013e<br />
DCF analysis<br />
HSBC assumptions<br />
DCF, comprising<br />
Pr<strong>of</strong>it & loss summary (EURm)<br />
Revenue 1,729 2,059 2,300 2,500<br />
EBITDA 335 469 541 605<br />
Depreciation & amortisation -71 -69 -75 -81<br />
Operating pr<strong>of</strong>it/EBIT 264 400 466 524<br />
Net interest -15 -17 -7 -2<br />
PBT 250 383 459 522<br />
HSBC PBT 250 383 459 522<br />
Taxation -60 -92 -110 -125<br />
Net pr<strong>of</strong>it 186 284 341 388<br />
HSBC net pr<strong>of</strong>it 186 284 341 388<br />
Cash flow summary (EURm)<br />
Cash flow from operations 309 276 373 436<br />
Capex -56 -90 -120 -120<br />
Cash flow from investment -64 -90 -120 -120<br />
Dividends -67 -140 -199 -239<br />
Change in net debt -179 -51 -74 -83<br />
FCF equity 196 186 253 316<br />
Balance sheet summary (EURm)<br />
Intangible fixed assets 127 127 127 127<br />
Tangible fixed assets 264 285 330 370<br />
Current assets 903 1,053 1,189 1,325<br />
Cash & others 296 343 417 500<br />
Total assets 1,355 1,526 1,707 1,882<br />
Operating liabilities 273 292 302 313<br />
Gross debt 533 533 533 533<br />
Net debt 200 149 75 -8<br />
Shareholders funds 344 495 645 803<br />
Invested capital 725 831 927 1,008<br />
Ratio, growth and per share analysis<br />
Year <strong>to</strong> 12/2010a 12/2011e 12/2012e 12/2013e<br />
Y-o-y % change<br />
Revenue 10.7 19.0 11.7 8.7<br />
EBITDA 47.4 39.8 15.4 11.8<br />
Operating pr<strong>of</strong>it 67.0 51.1 16.7 12.4<br />
PBT 82.8 53.4 19.9 13.6<br />
HSBC EPS 79.0 52.5 20.0 13.7<br />
Ratios (%)<br />
Revenue/IC (x) 2.5 2.6 2.6 2.6<br />
ROIC 28.8 39.0 40.3 41.1<br />
ROE 68.3 67.7 59.8 53.5<br />
ROA 15.7 20.2 21.6 22.1<br />
EBITDA margin 19.4 22.8 23.5 24.2<br />
Operating pr<strong>of</strong>it margin 15.3 19.4 20.3 21.0<br />
EBITDA/net interest (x) 22.7 28.3 77.3 302.4<br />
Net debt/equity 55.3 29.0 11.3 -1.0<br />
Net debt/EBITDA (x) 0.6 0.3 0.1 0.0<br />
CF from operations/net debt 154.6 185.2 497.2<br />
Per share data (EUR)<br />
EPS Rep (fully diluted) 2.70 4.12 4.94 5.62<br />
HSBC EPS (fully diluted) 2.70 4.12 4.94 5.62<br />
DPS 2.03 2.88 3.46 3.93<br />
Book value 4.98 7.18 9.36 11.65<br />
Risk-free rate (%) 3.00 EBIT growth 2011-21e CAGR (%) 9.4<br />
Equity premium (%) 6.00 EBIT growth 2021-41e CAGR (%) 4.0<br />
Sec<strong>to</strong>r beta 1.20 Fade period 2041-47e<br />
Specific beta 1.00 WACC (%) 10.02<br />
Sensitivity and valuation range (EUR/share)<br />
Cost <strong>of</strong> capital vs fade period 4 years 8 years 12 years<br />
9.1% 97 100 101<br />
9.6% 91 93 95<br />
10.1% 85 87 88<br />
10.6% 80 82 83<br />
11.1% 75 77 78<br />
Valuation data<br />
Year <strong>to</strong> 12/2010a 12/2011e 12/2012e 12/2013e<br />
EV/sales 3.3 2.7 2.4 2.2<br />
EV/EBITDA 16.8 11.9 10.2 9.0<br />
EV/IC 7.8 6.7 5.9 5.4<br />
PE* 30.2 19.8 16.5 14.5<br />
P/Book value 16.4 11.4 8.7 7.0<br />
FCF yield (%) 3.6 3.4 4.6 5.8<br />
Dividend yield (%) 2.5 3.5 4.2 4.8<br />
Note: * = Based on HSBC EPS (fully diluted)<br />
Issuer information<br />
Share price (EUR) 81.48 Target price (EUR) 87.00<br />
Reuters (Equity) BOSG_p.DE Bloomberg (Equity) BOS3 GR<br />
Market cap (USDm) 7,219 Market cap (EURm) 5,415<br />
Free float (%) 53 Enterprise value (EURm) 5,582<br />
Country Germany Sec<strong>to</strong>r Textiles, Apparel & Luxury<br />
Goods<br />
Analysts An<strong>to</strong>ine Belge Contact 33 1 5652 4347<br />
Erwan Rambourg Contact 852 2996 6572<br />
Sophie Dargnies Contact 33 1 5652 4348<br />
Price relative<br />
100<br />
90<br />
80<br />
70<br />
60<br />
50<br />
Jun-11<br />
Hugo Boss<br />
Source: HSBC<br />
Note: price at close <strong>of</strong> 01 Mar 2012<br />
Rel <strong>to</strong> DAX-100<br />
Dec-11<br />
100<br />
90<br />
80<br />
70<br />
60<br />
50<br />
49
Consumer Brands & Retail<br />
Global luxury goods<br />
March 2012<br />
abc<br />
Luxottica<br />
Self-help (Coach and Armani licences, M&A, Retail margin recovery)<br />
and best-in-class operating leverage<br />
Luxottica’s EPS growth underperformed peers in 2011, but this<br />
should no longer be the case in 2012e and 2013e<br />
Upgrade <strong>to</strong> Neutral (from UW), increase DCF target price <strong>to</strong><br />
EUR28.50 (from EUR19.50) on higher estimates and DCF roll-over<br />
Self-help and best-in-class<br />
operating leverage<br />
Our scenario was <strong>to</strong>o pessimistic<br />
In the light <strong>of</strong> the August 2011 market turmoil, we<br />
feared that Luxottica’s North America business<br />
(c60% <strong>of</strong> sales) would be under pressure. This<br />
was based on an analysis <strong>of</strong> what happened in<br />
2007, when Luxottica proved <strong>to</strong> be early-cyclical.<br />
This scenario proved <strong>to</strong> be <strong>to</strong>o pessimistic, with<br />
Luxottica’s North America sales in both<br />
Wholesale and Retail improving sequentially.<br />
Yet Luxottica’s EPS growth underperformed<br />
peers in 2011<br />
Even though our scenario was <strong>to</strong>o pessimistic,<br />
Luxottica nevertheless ended 2011 with EPS<br />
growth <strong>of</strong> 10%, which is likely <strong>to</strong> have been the<br />
weakest in our universe. At 15%, the EBIT<br />
growth rate achieved by the Wholesale division<br />
(40% <strong>of</strong> the <strong>to</strong>tal) was not <strong>to</strong>o dissimilar <strong>to</strong> peers,<br />
but the Retail division’s results were hampered by<br />
unfavourable FX movements, difficulties<br />
experienced in Australia and investments in EM.<br />
A lot <strong>of</strong> self-help in 2012 and 2013<br />
We like Luxottica because it should benefit from a lot<br />
<strong>of</strong> self-help in 2012 and 2013.<br />
The Coach licence, which we estimate will<br />
contribute EUR40m in sales in year 1, started <strong>to</strong><br />
impact the business in January 2012 and the first<br />
two months have been ‘well above expectations’<br />
according <strong>to</strong> management.<br />
As from 2013, the Armani licence (won from<br />
competi<strong>to</strong>r Safilo) will generate EUR150m in sales in<br />
year 1 with the potential, in our view, <strong>to</strong> reach<br />
EUR200m in year 3.<br />
New licences create significant value: not only can<br />
they be considered the equivalent <strong>of</strong> an acquisition at<br />
zero cost, but they also add <strong>to</strong> the size <strong>of</strong> the<br />
Wholesale division (leveraging existing fixed<br />
distribution costs and reinforcing Luxottica’s position<br />
as the supplier <strong>of</strong> choice for eyewear retailers). Before<br />
adding Coach and Armani <strong>to</strong> its portfolio, Luxottica<br />
was already by far the leader in eyewear licensing<br />
with a global market share <strong>of</strong> more than 40%. We<br />
now estimate that share at more than 50%. Luxottica<br />
also owns Ray-Ban and Oakley, the two star ‘house’<br />
brands <strong>of</strong> the industry.<br />
In 2012 and 2013, Luxottica should start <strong>to</strong><br />
benefit from recent acquisitions (Tecnol in the<br />
wholesale division and EM eyewear chains in the<br />
retail division), and made it clear that other<br />
acquisitions will follow. Although we have<br />
50
Consumer Brands & Retail<br />
Global luxury goods<br />
March 2012<br />
abc<br />
always viewed M&A in the luxury industry with<br />
some caution, Luxottica has developed a strong<br />
track record on creating value via acquisitions.<br />
In 2012 the Retail EBIT will benefit from the very<br />
favourable 2011 basis <strong>of</strong> comparison. Last year, it<br />
declined 30bp <strong>to</strong> 11.6%, but would have been<br />
13.9% at constant FX excluding one-<strong>of</strong>fs (notably<br />
due <strong>to</strong> the Australian business). Even assuming<br />
continued investments in EM, we forecast a 140bp<br />
improvement <strong>to</strong> 13% in 2012 based on current FX<br />
(EUR/USD=1.32) and the confirmation <strong>of</strong><br />
improving trends in Australia/New Zealand<br />
(optical comps up 9.9% in Q4 2011).<br />
2012 EPS growth forecast <strong>of</strong> 24% in spite <strong>of</strong><br />
less favourable geographic mix<br />
In spite <strong>of</strong> a less favourable geographic mix than<br />
peers (even after 27% growth in 2011, EM only<br />
accounted for a little more than 10% <strong>of</strong> sales in<br />
2011 vs more than 40% for peers), we forecast EPS<br />
growth rates <strong>of</strong> 24% in 2012 and 15% in 2013.<br />
Punchy yet realistic 2012 guidance<br />
On 28 February, Luxottica gave punchy 2012<br />
guidance, but it was realistic in our view: 30%<br />
sales growth in EM, 5-7% retail comps and 15%<br />
wholesale growth in North America, 4-6%<br />
wholesale growth in Western Europe. All in all,<br />
we estimate these regional trends should translate<br />
in<strong>to</strong> 9-10% <strong>to</strong>p-line growth. In addition,<br />
Luxottica’s leverage ‘rule <strong>of</strong> thumb’ <strong>of</strong> c2x (ie<br />
EBIT growth/sales growth), which was met in<br />
2011, was reiterated for 2012.<br />
Earnings, valuation and risks<br />
We forecast worldwide Retail comps <strong>of</strong> 5% for<br />
2012e (vs 5.5% in 2011), <strong>to</strong> which we add a 2.5%<br />
contribution from new s<strong>to</strong>res, a 4.1% contribution<br />
from acquisitions and a 4.2% FX impact, leading<br />
<strong>to</strong> 16% reported sales growth in 2012.<br />
We forecast Wholesale sales <strong>to</strong> slow from 11.2%<br />
at constant FX <strong>to</strong> 8.6% in 2012 (including Coach<br />
and Tecnol). For this division, which has<br />
his<strong>to</strong>rically shown a high operating leverage, we<br />
forecast another 80bp EBIT margin enhancement<br />
in 2012 (as in 2011) <strong>to</strong> a hefty 22.3%.<br />
At the group level, Luxottica sales and EBIT<br />
should thus grow at respectively 14% and 23% in<br />
2012, ie an operating leverage <strong>of</strong> 1.6x, amongst<br />
the best-in-class with Ferragamo, PPR and Prada.<br />
We have raised our 2012-13 EPS estimates by<br />
12% and 15% (we used <strong>to</strong> have a very pessimistic<br />
US scenario and we have now integrated Armani<br />
licence revenues).<br />
We increase our DCF-based target price <strong>to</strong><br />
EUR28.50 from EUR19.50 on the back <strong>of</strong> our<br />
higher estimates, roll forward our DCF by one<br />
year <strong>to</strong> 2012 and use higher mid-term assumptions<br />
following the addition <strong>of</strong> the Armani licence. The<br />
assumptions used in our target price are detailed<br />
on page 53 (RFR now 3.0% vs 3.5%, ERP 6.0%<br />
vs 5.0%, sec<strong>to</strong>r beta 1.1 vs 1.2, specific beta 0.90<br />
vs 0.95). Under our research model, for s<strong>to</strong>cks<br />
without a volatility indica<strong>to</strong>r, the Neutral band is<br />
5ppts above and below the hurdle rate for Europe<br />
ex-UK s<strong>to</strong>cks <strong>of</strong> 9.0%. Our EUR28.50 target price<br />
implies a 6% potential return; as this is within the<br />
Neutral band <strong>of</strong> our model, we upgrade Luxottica<br />
<strong>to</strong> Neutral from Underweight. Potential return<br />
equals the percentage difference between the<br />
current share price and the target price, including<br />
the forecast dividend yield when indicated.<br />
Luxottica is trading at 19.9x 2012e and 17.3x<br />
2013e PE (note that our EPS exclude trademark<br />
amortisation), implying a 6% premium <strong>to</strong> peers,<br />
broadly in line with the his<strong>to</strong>rical level.<br />
Upside risks <strong>to</strong> our rating include a better-thanexpected<br />
resilience <strong>of</strong> the group’s North American<br />
business, a faster-than-expected development in EM,<br />
a USD/EUR strengthening, value-enhancing<br />
acquisitions and new license deals. Downside risks<br />
include poor execution in integrating new deals and<br />
non-renewal <strong>of</strong> licence contracts.<br />
51
Consumer Brands & Retail<br />
Global luxury goods<br />
March 2012<br />
abc<br />
Luxottica P&L summary<br />
EURm 2005a 2006a 2007a 2008a** 2009e 2010a 2011a 2012e 2013e 2014e 06 vs<br />
05<br />
07 vs<br />
06<br />
08 vs<br />
07<br />
09 vs<br />
08<br />
10 evs 11e vs<br />
09 10e<br />
12e vs 13e vs<br />
11e 12e<br />
Wholesale 1,311 1,715 1,993 2,092 1,955 2,236 2,456 2,720 3,042 3,255 31% 16% 5% -7% 14% 10% 11% 12% 7%<br />
Retail 3,062 3,294 3,234 3,109 3,139 3,562 3,766 4,363 4,647 4,949 8% -2% -4% 1% 13% 6% 16% 6% 6%<br />
Inter-Segments -238 -333 -348 40% 4% -100%<br />
Oakley 88<br />
Total sales 4,135 4,676 4,967 5,202 5,094 5,798 6,222 7,084 7,689 8,204 13% 6% 5% -2% 14% 7% 14% 9% 7%<br />
Wholesale 304 446 528 440 356 462 529 605 702 771 46% 18% -17% -19% 30% 15% 14% 16% 10%<br />
Retail 355 431 362 431 367 424 437 566 621 682 21% -16% 19% -15% 15% 3% 30% 10% 10%<br />
Inter-Segments -78 -121 -60 -121 -140 -174 -159 -182 -203 -223 55% -50% 101% 16% 25% -9% 14% 12% 10%<br />
Oakley EBIT 3<br />
Total EBIT 581 756 833 750 583 712 807 990 1,120 1,230 30% 10% -10% -22% 22% 13% 23% 13% 10%<br />
Wholesale 23.2% 26.0% 26.5% 21.0% 18.2% 20.7% 21.5% 22.3% 23.1% 23.7%<br />
Retail 11.6% 13.1% 11.2% 13.8% 11.7% 11.9% 11.6% 13.0% 13.4% 13.8%<br />
Total EBIT margin 14.1% 16.2% 16.8% 14.4% 11.4% 12.3% 13.0% 14.0% 14.6% 15.0%<br />
Reported dil EPS (EUR) 0.73 0.94 1.07 0.83 0.69 0.83 0.98 1.24 1.44 1.61 29% 14% -23% -17% 21% 18% 27% 16% 12%<br />
HSBC dil EPS* (EUR) 0.73 0.94 1.10 0.96 0.80 0.99 1.09 1.35 1.55 1.72 29% 17% -13% -17% 23% 10% 24% 15% 11%<br />
Retail comps (worldwide) 5.5% 6.7% 1.2% -5.4% -4.2% 4.5% 5.5% 5.0% 4.0% 4.0%<br />
* Excluding exceptional items and trademark amortisation ** change in sales & EBIT breakdown methodology<br />
Source: Company data, HSBC estimates<br />
14e vs<br />
13e<br />
52
6<br />
.<br />
0<br />
Consumer Brands & Retail<br />
Global luxury goods<br />
March 2012<br />
abc<br />
Financials & valuation: Luxottica<br />
Neutral<br />
Financial statements<br />
Year <strong>to</strong> 12/2011a 12/2012e 12/2013e 12/2014e<br />
DCF analysis<br />
HSBC assumptions<br />
DCF, comprising<br />
Pr<strong>of</strong>it & loss summary (EURm)<br />
Revenue 6,222 7,084 7,689 8,204<br />
EBITDA 1,131 1,330 1,477 1,605<br />
Depreciation & amortisation -324 -340 -357 -375<br />
Operating pr<strong>of</strong>it/EBIT 807 990 1,120 1,230<br />
Net interest -109 -104 -91 -78<br />
PBT 695 886 1,029 1,152<br />
HSBC PBT 695 886 1,029 1,152<br />
Taxation -237 -305 -354 -396<br />
Net pr<strong>of</strong>it 452 575 667 747<br />
HSBC net pr<strong>of</strong>it 504 627 719 799<br />
Cash flow summary (EURm)<br />
Cash flow from operations 811 854 975 1,069<br />
Capex -307 -325 -345 -366<br />
Cash flow from investment -483 -413 -356 -377<br />
Dividends -202 -226 -286 -332<br />
Change in net debt -80 -227 -345 -372<br />
FCF equity 491 528 630 704<br />
Balance sheet summary (EURm)<br />
Intangible fixed assets 4,441 4,441 4,441 4,441<br />
Tangible fixed assets 1,694 1,768 1,767 1,768<br />
Current assets 2,269 2,391 2,495 2,607<br />
Cash & others 905 905 905 905<br />
Total assets 8,644 8,840 8,943 9,056<br />
Operating liabilities 1,626 1,700 1,766 1,835<br />
Gross debt 2,937 2,710 2,365 1,993<br />
Net debt 2,032 1,805 1,460 1,088<br />
Shareholders funds 3,625 3,974 4,356 4,771<br />
Invested capital 5,873 5,996 6,033 6,076<br />
Ratio, growth and per share analysis<br />
Year <strong>to</strong> 12/2011a 12/2012e 12/2013e 12/2014e<br />
Y-o-y % change<br />
Revenue 7.3 13.8 8.5 6.7<br />
EBITDA 9.4 17.6 11.1 8.7<br />
Operating pr<strong>of</strong>it 13.3 22.7 13.1 9.8<br />
PBT 14.8 27.5 16.1 11.9<br />
HSBC EPS 10.4 24.0 14.8 11.1<br />
Ratios (%)<br />
Revenue/IC (x) 1.1 1.2 1.3 1.4<br />
ROIC 9.3 10.9 12.2 13.3<br />
ROE 14.6 16.5 17.3 17.5<br />
ROA 6.5 7.4 8.3 9.0<br />
EBITDA margin 18.2 18.8 19.2 19.6<br />
Operating pr<strong>of</strong>it margin 13.0 14.0 14.6 15.0<br />
EBITDA/net interest (x) 10.4 12.8 16.3 20.7<br />
Net debt/equity 56.0 45.4 33.5 22.8<br />
Net debt/EBITDA (x) 1.8 1.4 1.0 0.7<br />
CF from operations/net debt 39.9 47.3 66.8 98.3<br />
Per share data (EUR)<br />
EPS Rep (fully diluted) 0.98 1.24 1.44 1.61<br />
HSBC EPS (fully diluted) 1.09 1.35 1.55 1.72<br />
DPS 0.49 0.62 0.72 0.80<br />
NAV 7.92 8.69 9.52 10.43<br />
Risk-free rate (%) 3.00 EBIT growth 2011-21e CAGR (%) 9.4<br />
Equity premium (%) 6.00 EBIT growth 2021-41e CAGR (%) 4.0<br />
Sec<strong>to</strong>r beta 1.10 Fade period 2041-47e<br />
Specific beta 0.90 WACC (%) 8.25<br />
Sensitivity and valuation range (EUR/share)<br />
Cost <strong>of</strong> capital vs fade period 4 years 8 years 12 years<br />
7.25% 33.4 34.3 34.8<br />
7.75% 30.4 31.2 31.7<br />
8.25% 27.8 28.5 29.0<br />
8.75% 25.5 26.1 26.6<br />
9.25% 23.5 24.0 24.5<br />
Valuation data<br />
Year <strong>to</strong> 12/2011a 12/2012e 12/2013e 12/2014e<br />
EV/sales 2.3 2.0 1.8 1.7<br />
EV/EBITDA 12.9 10.8 9.5 8.5<br />
EV/IC 2.5 2.4 2.3 2.2<br />
PE* 24.7 19.9 17.3 15.6<br />
P/NAV 3.4 3.1 2.8 2.6<br />
FCF yield (%) 3.9 4.2 5.0 5.6<br />
Dividend yield (%) 1.8 2.3 2.7 3.0<br />
Note: * = Based on HSBC EPS (fully diluted)<br />
Issuer information<br />
Share price (EUR) 26.89 Target price (EUR) 28.50<br />
Reuters (Equity) LUX.MI Bloomberg (Equity) LUX IM<br />
Market cap (USDm) 16,766 Market cap (EURm) 12,575<br />
Free float (%) 25 Enterprise value (EURm) 14,372<br />
Country Italy Sec<strong>to</strong>r Textiles, Apparel & Luxury<br />
Goods<br />
Analysts An<strong>to</strong>ine Belge Contact 33 1 5652 4347<br />
Erwan Rambourg Contact 852 2996 6572<br />
Sophie Dargnies Contact 33 1 5652 4348<br />
Price relative<br />
33<br />
31<br />
29<br />
27<br />
25<br />
23<br />
21<br />
19<br />
17<br />
Jun-11<br />
Luxottica<br />
Source: HSBC<br />
Note: price at close <strong>of</strong> 01 Mar 2012<br />
Rel <strong>to</strong> BCI ALL-SHARE INDEX<br />
Dec-11<br />
33<br />
31<br />
29<br />
27<br />
25<br />
23<br />
21<br />
19<br />
17<br />
53
Consumer Brands & Retail<br />
Global luxury goods<br />
March 2012<br />
abc<br />
LVMH<br />
16% EPS growth in 2012e is strong, but we believe several luxury<br />
players are likely <strong>to</strong> achieve 20%+<br />
17.8x 2012e and 15.9x 2013e PE, broadly in line with the sec<strong>to</strong>r<br />
Remain Neutral, target price increased <strong>to</strong> EUR135 (from EUR127) on<br />
higher estimates<br />
A real proxy in a sec<strong>to</strong>r that<br />
may deserve a <strong>breather</strong><br />
We have never been much at ease with the use <strong>of</strong><br />
the ‘sec<strong>to</strong>r proxy’ by certain inves<strong>to</strong>rs when they<br />
talk about LVMH, since it is a very vague notion,<br />
in our view. As far as earnings growth is<br />
concerned though, we are currently happy <strong>to</strong> state<br />
that LVMH is a good proxy for what the sec<strong>to</strong>r can<br />
deliver. Our 2012 EPS growth forecast is for a<br />
16% increase y-o-y: we believe several luxury<br />
players will achieve 20%+ but are comfortable that<br />
LVMH is trading broadly in line with the sec<strong>to</strong>r<br />
due <strong>to</strong> its more superior earnings predictability.<br />
As for many other luxury s<strong>to</strong>cks now, we believe<br />
that after its 18% share price performance since<br />
the beginning <strong>of</strong> the year (slightly below the<br />
European average, but ahead <strong>of</strong> the percentage<br />
increase in the FTSE Eur<strong>of</strong>irst 300), LVMH shares<br />
are up with events, hence our Neutral rating.<br />
The ‘proxy’ or ‘average’ status also reflects that<br />
some <strong>of</strong> LVMH businesses will, in our view,<br />
perform above the average (DFS, smaller fashion<br />
& leather brands) whilst others will perform in<br />
line (the LV brand, Cognac, Sephora) or underperform<br />
(Champagne, perfumes).<br />
LVMH: 2012e EBIT by division<br />
Champagne & Wines<br />
Other Fashion brands<br />
8%<br />
5%<br />
Cognac & spirits<br />
10%<br />
Selective retailing<br />
14%<br />
Louis Vuit<strong>to</strong>n brand<br />
51%<br />
Source: HSBC estimates<br />
Watches & Jewellery<br />
6%<br />
Perfumes & Cosmetics<br />
6%<br />
Above average: DFS, smaller fashion & leather<br />
brands<br />
DFS: this business should continue <strong>to</strong> be the star<br />
performer as an increasing share <strong>of</strong> its sales<br />
(c40% in 2011) are now generated by mainland<br />
<strong>to</strong>urists, leveraging an existing s<strong>to</strong>re network for<br />
which limited capex is needed.<br />
Smaller fashion & leather brands: we expect<br />
the likes <strong>of</strong> Fendi, Céline and Loewe <strong>to</strong> continue<br />
<strong>to</strong> grow at a faster rate than LV in 2012 and <strong>to</strong><br />
improve their pr<strong>of</strong>itability further from a low base<br />
In line with average: LV brand, Cognac, Sephora<br />
LV: achieving the 8% organic growth we forecast<br />
for 2012 would be another considerable<br />
achievement given that it would represent a<br />
EUR500m addition (ie 1.5x the size <strong>of</strong> a brand<br />
like YSL). Nevertheless, bear in mind that we<br />
54
Consumer Brands & Retail<br />
Global luxury goods<br />
March 2012<br />
abc<br />
forecast 9% average organic growth for the<br />
industry and that LV’s business model is not<br />
aimed at increasing its c44% EBIT margin, the<br />
highest in the industry.<br />
Cognac: we see Hennessy’s EBIT growing in line<br />
(14%) in 2012 with the group average thanks <strong>to</strong><br />
8% organic sales growth (with volume up 4%)<br />
and a 60bp EBIT margin expansion. But we think<br />
Hennessy is likely <strong>to</strong> underperform Martell<br />
(Pernod) and Rémy, which have more exposure <strong>to</strong><br />
Asia (the US still accounted for 44% <strong>of</strong> Hennessy<br />
volumes in 2010) and more inven<strong>to</strong>ries <strong>of</strong> older<br />
qualities <strong>of</strong> eau-de-vie.<br />
Sephora: even though the same-s<strong>to</strong>re sales growth<br />
rates <strong>of</strong> 14% in the US and 7% in Europe are unlikely<br />
<strong>to</strong> be sustained, in our view, s<strong>to</strong>re expansion in the US<br />
and China should support growth.<br />
Below average: Champagne, perfumes<br />
Champagne: although we raise our 2012 organic<br />
sales growth forecast from -5% <strong>to</strong> 0%, we<br />
continue <strong>to</strong> expect an 80bp EBIT margin<br />
contraction. Champagne remains a Franco-British<br />
drink with a strong US following but with little<br />
support in emerging markets.<br />
Perfumes: this division remains very exposed <strong>to</strong><br />
Europe (47% <strong>of</strong> sales) and has already<br />
underperformed in Q3 and Q4 (organic sales<br />
growth <strong>of</strong> 6% and 5%, respectively)<br />
Bulgari and Hermès may weigh<br />
In three years, Bulgari (acquired in 2011) may be<br />
seen as a fantastic addition if LVMH manages <strong>to</strong><br />
make the brand a threat <strong>to</strong> Cartier, as it once was.<br />
In the meantime, we think the new management<br />
team will have <strong>to</strong> review its strategy (eg<br />
distribution, product) very thoroughly <strong>to</strong> put the<br />
brand back on the high-end consumer’s radar.<br />
This, <strong>to</strong>gether with the fact that Bulgari has<br />
his<strong>to</strong>rically been more vulnerable than peers <strong>to</strong><br />
economic downturns (the brand is not considered<br />
a reference in watches by retailers and<br />
consumers), is likely <strong>to</strong> weigh on pr<strong>of</strong>itability<br />
short term. On the Hermès investment, while the<br />
interest in buying shares on a (very) long-term<br />
patrimonial view is clear (we can’t think <strong>of</strong> a<br />
brand in the space with higher differentiation and<br />
barriers <strong>to</strong> entry), on any shorter term view,<br />
returns on that investment are likely <strong>to</strong> be limited.<br />
Earnings, valuation and risks<br />
Organic sales growth was 12% in Q4 2011, in line<br />
with our 12% estimate. This compares <strong>to</strong> 14% in<br />
Q1, 15% in both Q2 and Q3. FY 2011 EBIT<br />
increased 22% y-o-y (20% ex Bulgari), ie a 100bp<br />
EBIT margin improvement <strong>to</strong> 22.2%.<br />
For 2012e, we forecast 14.6% reported sales<br />
growth (8.5% organic, 3% FX, consolidation<br />
3.1%). We expect a 15% y-o-y rise in EBIT (14%<br />
excluding Bulgari), implying a 10bp EBIT margin.<br />
The limited margin improvement is linked <strong>to</strong> the<br />
outperformance <strong>of</strong> lower-margin businesses (DFS<br />
and smaller fashion brands), the full integration <strong>of</strong><br />
Bulgari (c12% EBIT margin) and our forecast <strong>of</strong><br />
an 80bp EBIT margin deterioration in Champagne.<br />
We increase our 2012-14 EBIT estimates by 2%,<br />
2% and 5% due <strong>to</strong> higher sales forecasts (notably<br />
for the US region and for Champagne and smaller<br />
fashion & leather brands).<br />
We increase our DCF-based target price for<br />
LVMH <strong>to</strong> EUR135 from EUR127 on the back <strong>of</strong><br />
our currency-led earnings increases. The<br />
assumptions used in our target price are detailed<br />
on page 57. Under our research model, for s<strong>to</strong>cks<br />
without a volatility indica<strong>to</strong>r, the Neutral band is 5<br />
percentage points above and below the hurdle rate<br />
for Europe ex-UK s<strong>to</strong>cks <strong>of</strong> 9.0%. Our target<br />
price <strong>of</strong> EUR135 provides a potential return <strong>of</strong><br />
4.8%, within the Neutral band <strong>of</strong> our model;<br />
therefore, we are reiterating our Neutral rating on<br />
LVMH s<strong>to</strong>ck. Potential return equals the<br />
percentage difference between the current share<br />
price and the target price, including the forecast<br />
dividend yield when indicated.<br />
The main specific upside risks <strong>to</strong> our rating would be<br />
a greater resilience in sales and greater SG&A<br />
leverage. The main specific downside risks would be<br />
des<strong>to</strong>cking <strong>of</strong> Champagne and Spirits and value<br />
destruction linked <strong>to</strong> M&A activity (past and future).<br />
55
Consumer Brands & Retail<br />
Global luxury goods<br />
March 2012<br />
abc<br />
LVMH FY results & forecasts<br />
EURm 2007a YoY 2008a<br />
% chg<br />
YoY 2009a<br />
% chg<br />
YoY 2010a<br />
% chg<br />
YoY 2011a<br />
% chg<br />
YoY 2012e<br />
% chg<br />
YoY 2013e<br />
% chg<br />
YoY 2014e<br />
% chg<br />
Sales 16,481 8 17,193 4 17,053 -1 20,320 19 23,659 16 27,125 15 29,300 8 31,590 8<br />
Current operating income (EBIT) 3,555 12 3,628 2 3,352 -8 4,321 29 5,263 22 6,055 15 6,680 10 7,330 10<br />
Other operating income and expenses -126 -143 -191 -152 -109 -100 -100 -100<br />
Operating income 3,429 12 3,485 2 3,161 -9 4,169 32 5,154 24 5,955 16 6,580 10 7,230 10<br />
Net financial expenses -252 -281 -342 612 -242 -163 -94 -13<br />
Income before taxes 3,177 6 3,204 1 2,819 -12 4,781 70 4,912 3 5,792 18 6,487 12 7,218 11<br />
Taxes -853 -893 -849 -1,469 -1,453 -1,796 -2,011 -2,237<br />
Associates 7 7 3 7 6 8 10 12<br />
Minority interests -306 -292 -218 -287 -400 -409 -458 -509<br />
Net pft before goodwill and exceptionals 2,025 8 2,026 0 1,755 -13 3,032 73 3,065 1 3,596 17 4,027 12 4,483 11<br />
EPS (EUR) 4.22 7 4.26 1 3.70 -13 6.32 71 6.23 -1 7.22 16 8.08 12 9.00 11<br />
Sales by division<br />
Wines & Spirits 3,226 8 3,126 -3 2,740 -12 3,261 19 3,524 8 3,767 7 4,085 8 4,391 7<br />
Leather and Fashion 5,628 8 6,010 7 6,302 5 7,581 20 8,712 15 9,749 12 10,529 8 11,371 8<br />
Perfume and cosmetics 2,731 8 2,868 5 2,741 -4 3,076 12 3,195 4 3,377 6 3,529 4 3,688 4<br />
Selective distribution 4,179 7 4,376 5 4,533 4 5,378 19 6,436 20 7,418 15 8,090 9 8,797 9<br />
Watches 833 13 879 6 764 -13 985 29 1,949 98 2,814 44 3,067 9 3,343 9<br />
Others -116 nm -66 nm -27 nm 39 nm -157 nm 0 nm 0 nm 0 nm<br />
Total sales 16,481 8 17,193 4 17,053 -1 20,320 19 23,659 16 27,125 15 29,300 8 31,590 8<br />
EBIT by division<br />
Wines & Spirits 1,058 10 1,060 0 760 -28 930 22 1,101 18 1,176 7 1,305 11 1,430 10<br />
Leather and Fashion 1,829 12 1,927 5 1,986 3 2,555 29 3,075 20 3,463 13 3,772 9 4,108 9<br />
Perfume and cosmetics 256 15 290 13 291 0 332 14 348 5 371 7 395 6 420 6<br />
Selective distribution 439 10 388 -12 388 0 536 38 716 34 867 21 976 13 1,087 11<br />
Watches 141 76 118 -16 63 -47 128 103 265 107 394 49 460 17 525 14<br />
Others -168 34 -155 -8 -136 -12 -160 18 -242 51 -217 -10 -228 5 -240 5<br />
Total EBIT 3,555 12 3,628 2 3,352 -8 4,321 29 5,263 22 6,055 15 6,680 10 7,330 10<br />
EBIT margin by division<br />
Wines & Spirits 32.8% 33.9% 27.7% 28.5% 31.2% 31.2% 31.9% 32.6%<br />
Leather and Fashion 32.5% 32.1% 31.5% 33.7% 35.3% 35.5% 35.8% 36.1%<br />
Perfume and cosmetics 9.4% 10.1% 10.6% 10.8% 10.9% 11.0% 11.2% 11.4%<br />
Selective distribution 10.5% 8.9% 8.6% 10.0% 11.1% 11.7% 12.1% 12.4%<br />
Watches 16.9% 13.4% 8.2% 13.0% 13.6% 14.0% 15.0% 15.7%<br />
Others nm nm nm nm nm nm nm nm<br />
Total EBIT margin 21.6% 21.1% 19.7% 21.3% 22.2% 22.3% 22.8% 23.2%<br />
Source: Company data, HSBC estimates<br />
YoY<br />
% chg<br />
56
4<br />
.<br />
8<br />
Consumer Brands & Retail<br />
Global luxury goods<br />
March 2012<br />
abc<br />
Financials & valuation: LVMH<br />
Neutral<br />
Financial statements<br />
Year <strong>to</strong> 12/2011a 12/2012e 12/2013e 12/2014e<br />
DCF analysis<br />
HSBC assumptions<br />
DCF, comprising<br />
Pr<strong>of</strong>it & loss summary (EURm)<br />
Revenue 23,659 27,125 29,300 31,590<br />
EBITDA 6,187 6,873 7,547 8,249<br />
Depreciation & amortisation -924 -817 -867 -918<br />
Operating pr<strong>of</strong>it/EBIT 5,263 6,055 6,680 7,330<br />
Net interest -242 -163 -94 -13<br />
PBT 4,918 5,800 6,497 7,230<br />
HSBC PBT 4,912 5,792 6,487 7,218<br />
Taxation -1,453 -1,796 -2,011 -2,237<br />
Net pr<strong>of</strong>it 3,065 3,596 4,027 4,483<br />
HSBC net pr<strong>of</strong>it 3,065 3,596 4,027 4,483<br />
Cash flow summary (EURm)<br />
Cash flow from operations 3,643 3,963 4,737 5,272<br />
Capex -1,749 -1,400 -1,500 -1,600<br />
Cash flow from investment -6,309 -1,400 -1,500 -1,600<br />
Dividends -1,069 -1,324 -1,482 -1,631<br />
Change in net debt 1,982 -1,239 -1,755 -2,041<br />
FCF equity 2,209 2,852 3,526 3,961<br />
Balance sheet summary (EURm)<br />
Intangible fixed assets 18,439 18,439 18,439 18,439<br />
Tangible fixed assets 8,017 8,600 9,233 9,915<br />
Current assets 13,449 15,037 16,035 17,084<br />
Cash & others 2,606 2,606 2,606 2,606<br />
Total assets 47,372 49,740 51,570 53,501<br />
Operating liabilities 6,763 7,689 8,270 8,882<br />
Gross debt 7,266 6,027 4,272 2,231<br />
Net debt 4,660 3,421 1,666 -375<br />
Shareholders funds 22,451 24,724 27,269 30,122<br />
Invested capital 30,536 31,781 32,831 33,950<br />
Ratio, growth and per share analysis<br />
Year <strong>to</strong> 12/2011a 12/2012e 12/2013e 12/2014e<br />
Y-o-y % change<br />
Revenue 16.4 14.6 8.0 7.8<br />
EBITDA 19.9 11.1 9.8 9.3<br />
Operating pr<strong>of</strong>it 21.8 15.1 10.3 9.7<br />
PBT 2.7 17.9 12.0 11.3<br />
HSBC EPS -1.5 15.9 12.0 11.3<br />
Ratios (%)<br />
Revenue/IC (x) 0.9 0.9 0.9 0.9<br />
ROIC 13.6 13.4 14.3 15.2<br />
ROE 15.5 15.2 15.5 15.6<br />
ROA 8.6 8.5 9.0 9.5<br />
EBITDA margin 26.2 25.3 25.8 26.1<br />
Operating pr<strong>of</strong>it margin 22.2 22.3 22.8 23.2<br />
EBITDA/net interest (x) 25.6 42.2 80.6 640.8<br />
Net debt/equity 19.8 13.1 5.7 -1.2<br />
Net debt/EBITDA (x) 0.8 0.5 0.2 0.0<br />
CF from operations/net debt 78.2 115.8 284.4<br />
Per share data (EUR)<br />
EPS Rep (fully diluted) 6.23 7.22 8.08 9.00<br />
HSBC EPS (fully diluted) 6.23 7.22 8.08 9.00<br />
DPS 2.60 2.91 3.20 3.52<br />
NAV 44.18 48.65 53.65 59.27<br />
Risk-free rate (%) 3.00 EBIT growth 2011-21e CAGR (%) 7.8<br />
Equity premium (%) 6.00 EBIT growth 2021-41e CAGR (%) 4.0<br />
Sec<strong>to</strong>r beta 1.20 Fade period 2041-47e<br />
Specific beta 0.90 WACC (%) 9.09<br />
Sensitivity and valuation range (EUR/share)<br />
Cost <strong>of</strong> capital vs fade period 4 years 8 years 12 years<br />
8.1% 155 158 159<br />
8.6% 143 146 147<br />
9.1% 133 135 137<br />
9.6% 124 126 127<br />
10.1% 116 117 119<br />
Valuation data<br />
Year <strong>to</strong> 12/2011a 12/2012e 12/2013e 12/2014e<br />
EV/sales 2.8 2.4 2.2 2.0<br />
EV/EBITDA 10.8 9.6 8.5 7.6<br />
EV/IC 2.2 2.1 2.0 1.8<br />
PE* 20.7 17.8 15.9 14.3<br />
P/NAV 2.9 2.6 2.4 2.2<br />
FCF yield (%) 3.5 4.6 5.7 6.3<br />
Dividend yield (%) 2.0 2.3 2.5 2.7<br />
Note: * = Based on HSBC EPS (fully diluted)<br />
Issuer information<br />
Share price (EUR) 128.80 Target price (EUR) 135.00<br />
Reuters (Equity) LVMH.PA Bloomberg (Equity) MC FP<br />
Market cap (USDm) 87,205 Market cap (EURm) 65,407<br />
Free float (%) 47 Enterprise value (EURm) 65,793<br />
Country France Sec<strong>to</strong>r Textiles, Apparel & Luxury<br />
Goods<br />
Analysts An<strong>to</strong>ine Belge Contact 33 1 5652 4347<br />
Erwan Rambourg Contact 852 2996 6572<br />
Sophie Dargnies Contact 33 1 5652 4348<br />
Price relative<br />
151<br />
141<br />
131<br />
121<br />
111<br />
101<br />
91<br />
Jun-11<br />
LVMH<br />
Source: HSBC<br />
Rel <strong>to</strong> SBF-120<br />
Note: price at close <strong>of</strong> 01 Mar 2012<br />
Dec-11<br />
151<br />
141<br />
131<br />
121<br />
111<br />
101<br />
91<br />
57
Consumer Brands & Retail<br />
Global luxury goods<br />
March 2012<br />
abc<br />
PPR<br />
We believe PPR’s luxury division has the potential <strong>to</strong> continue <strong>to</strong><br />
outperform peers in terms <strong>of</strong> EBIT growth in 2012 as it did in 2011<br />
We see the 16 January announcement regarding Redcats’ and Fnac<br />
Italy’s classifications as discontinued assets as a sign that the<br />
disposal <strong>of</strong> the two assets in 2012 is likely<br />
Remain Overweight, raise target price <strong>to</strong> EUR150 (from EUR142) on<br />
2011 EBIT beat and lower tax rate<br />
All eyes should be on luxury<br />
Luxury division: Potential <strong>to</strong> continue <strong>to</strong><br />
outperform peers in 2012 as in 2011<br />
In 2011, PPR’s Luxury division registered 34%<br />
EBIT growth (restated for the accounting change<br />
affecting central costs), which is likely <strong>to</strong> have<br />
been one <strong>of</strong> the strongest in the industry. For<br />
2012, we forecast 19% EBIT growth, again above<br />
our estimate for the average <strong>of</strong> the industry (17%).<br />
The performance <strong>of</strong> the Gucci brand in Q4 2011<br />
(12% organic sales growth) did not meet our<br />
expectation (16%) due <strong>to</strong> unimpressive (12%)<br />
organic sales growth in Asia. Gucci is one <strong>of</strong> the<br />
most exposed brands <strong>to</strong> Korea (c8% <strong>of</strong> brand<br />
sales), which suffered from a sales decline in Q4.<br />
However, we continue <strong>to</strong> believe that the Gucci<br />
brand is well positioned in Asia, since its ‘fashion’<br />
positioning is resonating well with Chinese<br />
consumers. Gucci has adopted a gradual approach<br />
and still only had 46 s<strong>to</strong>res at the end <strong>of</strong> 2011<br />
compared <strong>to</strong> 39 at end-2010 and 32 at end-2009.<br />
The next three years should see 7-10 s<strong>to</strong>re openings<br />
pa (net <strong>of</strong> some possible closures/relocations). For<br />
the Gucci brand, Greater Chinese consumers<br />
accounted for c35% <strong>of</strong> <strong>to</strong>tal sales in 2011 (c23%<br />
locally and c12% abroad).<br />
One also should not forget the above-average<br />
performance <strong>of</strong> the Gucci brand in the five previous<br />
quarters (ie since Q3 2010), and we expect it <strong>to</strong><br />
register organic sales growth <strong>of</strong> 9% in 2012 and 8%<br />
in 2013. 2012 should see c45 s<strong>to</strong>re openings,<br />
bringing the <strong>to</strong>tal numbers <strong>of</strong> Gucci s<strong>to</strong>res <strong>to</strong> c421<br />
end-2012 (compared <strong>to</strong> 317 at end-2010).<br />
In addition, we believe the Gucci brand has<br />
significant EBIT margin improvement potential,<br />
even after the 180bp gain <strong>to</strong> 30.2% seen in 2011: we<br />
forecast EBIT margin <strong>to</strong> increase from 28.7% in<br />
2010 <strong>to</strong> 32.5% in 2014. Gucci is moving average<br />
prices higher by focusing on the medium segment <strong>of</strong><br />
its handbag proposition, with a higher leather content<br />
vs canvas and fewer logo products, and achieving a<br />
higher share <strong>of</strong> carry-overs. Gucci’s average price in<br />
leather goods has risen by c30% in two <strong>to</strong> three<br />
years. This is boosting sales and pr<strong>of</strong>itability since<br />
management claims that carry-over leather goods<br />
products do not have a lower margin than canvas,<br />
and markdowns are more limited.<br />
Bottega Veneta and Balenciaga, in our view, have<br />
the potential <strong>to</strong> outpace the industry average due<br />
<strong>to</strong> their niche positioning and the credibility <strong>of</strong><br />
their leather goods <strong>of</strong>fering (more than 70% <strong>of</strong><br />
58
Consumer Brands & Retail<br />
Global luxury goods<br />
March 2012<br />
abc<br />
sales for both <strong>of</strong> them). For Bottega in particular,<br />
which accounts for 14% <strong>of</strong> PPR’s Luxury<br />
division’s EBIT, we forecast organic sales growth<br />
<strong>of</strong> 18% in 2012 after 34% in 2011. YSL,<br />
Alexander McQueen, Stella McCartney, Brioni<br />
and Girard-Perregaux also have significant sales<br />
and margin potential, in our view.<br />
Too much weight given <strong>to</strong> ‘wrong debates’, in<br />
our view<br />
Talking <strong>to</strong> inves<strong>to</strong>rs, it seems that many inves<strong>to</strong>rs<br />
continue <strong>to</strong> put <strong>to</strong>o much weight on certain<br />
debates instead <strong>of</strong> focusing on the strength <strong>of</strong> the<br />
group’s luxury portfolio.<br />
We see the 16 January announcement regarding<br />
Redcats and Fnac Italy, classifying them as<br />
discontinued assets, as a sign that the disposal <strong>of</strong><br />
the two assets in 2012 is likely. We believe that if<br />
external audi<strong>to</strong>rs authorised PPR <strong>to</strong> use this IFRS<br />
classification, the probability <strong>of</strong> selling these two<br />
assets within the next 12 months is high.<br />
If these two disposals were <strong>to</strong> <strong>take</strong> place in 2012,<br />
the only remaining non-core assets would be Fnac<br />
(6% <strong>of</strong> our SOTP) and the residual 42% s<strong>take</strong> in<br />
CFAO (4% <strong>of</strong> our SOTP). PPR would have<br />
almost accomplished its transformation in<strong>to</strong> a<br />
luxury (75% <strong>of</strong> SOTP) and sporting goods &<br />
lifestyle (15%) company.<br />
Not only does the market not seem <strong>to</strong> recognise<br />
that PPR’s good track record in selling assets is a<br />
proxy for future disposals, it also appears worried<br />
about the potential dilution risk linked <strong>to</strong> PPR’s<br />
stated M&A ambitions in luxury and branded<br />
goods. We have fewer concerns than most about<br />
PPR’s possible next move, especially in the next<br />
12-18 months. 2011 showed that PPR is focusing<br />
on small <strong>to</strong> medium-sized deals. PPR acquired the<br />
sports & lifestyle company Volcom (for an EV <strong>of</strong><br />
USD516m), the premium menswear company<br />
Brioni (EUR170m in sales in 2010, undisclosed<br />
price – our estimate is EUR300m) and increased<br />
its s<strong>take</strong> in the watch company Sowind (Girard-<br />
Perregaux and JeanRichard brands as well as<br />
watch movements manufacturing capacities) from<br />
23% <strong>to</strong> 50.1% for cEUR200m (a hefty price, in<br />
our view, but on a small deal).<br />
We acknowledge that Puma’s disappointing<br />
operating and share price performance since its<br />
acquisition may lead <strong>to</strong> scepticism about PPR’s<br />
ability <strong>to</strong> create value from acquisitions in<br />
sporting goods & lifestyle. We note though that<br />
since Q2 2011, Puma’s <strong>to</strong>p line has been<br />
encouraging. Organic sales growth was 14% in<br />
Q2, 10% in Q3 and 16% in Q4.<br />
Earnings, valuation and risks<br />
We have raised our 2012-2014 EPS estimates by<br />
6% following the 3% EBIT beat in 2011 and now<br />
use a 25% tax rate instead <strong>of</strong> 27% (Redcats, which<br />
has a higher tax rate, is no longer in the base).<br />
We are increasing our sum-<strong>of</strong>-the-parts-based<br />
target price <strong>to</strong> EUR150 (from EUR142) on the<br />
back <strong>of</strong> the above-mentioned upward revision in<br />
our EBIT estimates for the Luxury division. For<br />
details <strong>of</strong> our sum-<strong>of</strong>-the-parts valuation approach,<br />
please refer <strong>to</strong> page 61. Under our research model,<br />
for Europe ex-UK s<strong>to</strong>cks without a volatility<br />
indica<strong>to</strong>r, the Neutral band is 5 percentage points<br />
above and below the hurdle rate <strong>of</strong> 9.0%. Since<br />
our target price implies a 16.6% potential return,<br />
which is above the Neutral band, we reiterate our<br />
Overweight rating on PPR. Potential return equals<br />
the percentage difference between the current<br />
share price and the target price, including the<br />
forecast dividend yield when indicated.<br />
Downside risks <strong>to</strong> our Overweight rating include<br />
underperformance <strong>of</strong> the Gucci brand, disposals <strong>of</strong><br />
assets at lower-than-expected prices, and value<br />
destruction linked <strong>to</strong> acquisitions.<br />
59
Consumer Brands & Retail<br />
Global luxury goods<br />
March 2012<br />
abc<br />
PPR earnings forecasts<br />
EURm<br />
2003 pro 2004 pro<br />
forma forma<br />
2005a 2006a 2007a 2008a 2009a* 2010a* 2011a 2012e 2013e 2014e<br />
Sales<br />
Luxury Goods 2,576 2,712 3,034 3,568 3,867 3,380 3,390 4,011 4,917 5,775 6,283 6,820<br />
Retail 13,903 14,358 13,906 14,365 14,196 14,318 10,690 7,909 4,165 4,123 4,247 4,374<br />
Puma 1,718 2,524 2,461 2,706 3,009 3,330 3,565 3,820<br />
Volcom 147 311 333 356<br />
Other -30 -29 -2 -2 -20 -21 -16 -21 -10 -14 -18 -21<br />
Total PPR 16,449 17,042 16,938 17,931 19,761 20,201 16,525 14,605 12,227 13,525 14,410 15,350<br />
Sales growth y-o-y (%)<br />
Luxury Goods 5.3 11.9 17.6 8.4 -12.6 0.3 18.3 22.6 17.4 8.8 8.5<br />
Retail 3.3 -3.1 3.3 -1.2 0.9 -25.3 -26.0 -47.3 -1.0 3.0 3.0<br />
Puma 47.0 -2.5 10.0 11.2 10.7 7.1 7.2<br />
Volcom 111.7 7.1 7.1<br />
Total PPR 3.6 -0.6 5.9 10.2 2.2 -18.2 -11.6 -16.3 10.6 6.5 6.5<br />
EBIT<br />
Luxury Goods 250 288 392 565 731 731 692 897 1,263 1,497 1,683 1,881<br />
Retail 754 760 729 759 785 695 422 353 103 82 127 131<br />
Puma 236 350 320 337 333 376 424 478<br />
Volcom 14 36 42 46<br />
Holding companies & other -61 -59 -50 -57 -54 -50 -56 -110 -111 -116 -116<br />
Total PPR 1,003 986 1,063 1,275 1,696 1,721 1,383 1,531 1,602 1,880 2,160 2,420<br />
EBIT margins (%)<br />
Luxury Goods 9.7 10.6 12.9 15.8 18.9 21.6 20.4 22.4 25.7 25.9 26.8 27.6<br />
Retail 5.4 5.3 5.2 5.3 5.5 4.9 3.9 4.5 2.5 2.0 3.0 3.0<br />
Puma 13.7 13.9 13.0 12.5 11.1 11.3 11.9 12.5<br />
Volcom 9.2 11.6 12.5 13.0<br />
Total PPR 6.1 5.8 6.3 7.1 8.6 8.5 8.4 10.5 13.1 13.9 15.0 15.8<br />
EBIT growth y-o-y (%)<br />
Luxury Goods 15.3 36.3 44.2 29.3 0.0 -5.3 29.7 40.7 18.6 12.4 11.8<br />
Retail 0.8 -4.0 4.1 3.4 -11.5 -39.3 -16.3 -70.9 -19.6 54.5 3.0<br />
Puma 48.2 -8.6 5.5 -1.2 12.8 12.8 12.7<br />
Volcom 166.9 15.4 11.3<br />
Total PPR -1.7 7.7 19.9 33.1 1.5 -19.6 10.7 4.6 17.3 14.9 12.0<br />
Other operating inc/charges nm nm 3 0 100 -361 -547 -194 -58 0 0 0<br />
Operating income nm nm 1,066 1,274 1,796 1,360 837 1,337 1,544 1,880 2,160 2,420<br />
Net Interest nm nm -307 -290 -322 -373 -381 -254 -215 -210 -177 -125<br />
Tax nm nm -187 -260 -298 -335 -177 -304 -317 -417 -496 -574<br />
Tax rate (%) nm nm -24.7% -26.4% -20.2% -33.9% -38.8% -28.1% -23.9% -25.0% -25.0% -25.0%<br />
Equity Affiliate Share nm nm 3 2 1 1 0 36 47 58 69 79<br />
Minorities nm nm -38 -47 -119 -117 -32 -51 -59 -75 -85 -96<br />
Net pr<strong>of</strong>it reported nm 536 685 922 537 985 964 986 1,305 1,541 1,774<br />
Net pr<strong>of</strong>it (base <strong>of</strong> diluted EPS calculation) 578 698 904 875 712 932 1,055 1,305 1,541 1,774<br />
Avg number <strong>of</strong> shares used in diluted EPS (m) nm 132.5 121.7 128.7 126.1 126.5 126.7 126.3 126.3 126.3 126.3<br />
HSBC EPS (diluted)** (EUR) nm 4.36 5.73 7.03 6.94 5.63 7.35 8.35 10.33 12.20 14.05<br />
HSBC EPS growth (%) nm nm 31.3 22.6 -1.2 -18.8 30.5 13.6 23.7 18.1 15.1<br />
*2009 not restated for the disposal <strong>of</strong> Conforama, 2010 not restated for Redcats discontinuation and change in central costs accounting<br />
**HSBC 2012-2014e EPS includes discontinued activities<br />
Source: Company data, HSBC estimates<br />
60
1<br />
6<br />
.<br />
6<br />
Consumer Brands & Retail<br />
Global luxury goods<br />
March 2012<br />
abc<br />
Financials & valuation: PPR<br />
Overweight<br />
Financial statements<br />
Year <strong>to</strong> 12/2011a 12/2012e 12/2013e 12/2014e<br />
Pr<strong>of</strong>it & loss summary (EURm)<br />
Revenue 12,227 13,525 14,410 15,350<br />
EBITDA 1,911 2,212 2,512 2,793<br />
Depreciation & amortisation -309 -332 -352 -373<br />
Operating pr<strong>of</strong>it/EBIT 1,602 1,880 2,160 2,420<br />
Net interest -215 -210 -177 -125<br />
PBT 1,376 1,728 2,052 2,374<br />
HSBC PBT 1,329 1,670 1,983 2,295<br />
Taxation -317 -417 -496 -574<br />
Net pr<strong>of</strong>it 999 1,235 1,471 1,705<br />
HSBC net pr<strong>of</strong>it 1,055 1,305 1,541 1,774<br />
Cash flow summary (EURm)<br />
Cash flow from operations 1,036 1,364 1,667 1,908<br />
Capex -325 -348 -372 -399<br />
Cash flow from investment 104 -648 -372 -399<br />
Dividends -441 -448 -475 -503<br />
Change in net debt -414 -334 -888 -1,077<br />
FCF equity 819 1,030 1,310 1,527<br />
Balance sheet summary (EURm)<br />
Intangible fixed assets 16,136 16,136 16,136 16,136<br />
Tangible fixed assets 1,372 1,688 1,709 1,735<br />
Current assets 5,277 5,606 5,895 6,208<br />
Cash & others 1,271 1,271 1,271 1,271<br />
Total assets 24,954 25,599 25,910 26,248<br />
Operating liabilities 8,163 8,286 8,419 8,562<br />
Gross debt 4,678 4,343 3,455 2,378<br />
Net debt 3,407 3,073 2,185 1,108<br />
Shareholders funds 10,925 11,782 12,848 14,119<br />
Invested capital 13,351 13,873 14,051 14,246<br />
PPR sum-<strong>of</strong>-the-parts valuation<br />
Valuation Per share<br />
(EURm) (EUR)<br />
Methodology<br />
Gucci brand 11,603 91 9.5x 2012e EBITDA<br />
Bottega Veneta 3,461 27 13x 2012e EBITDA<br />
Other luxury businesses 1,739 14 1.5x 2012e sales (adj for minorities)<br />
Sub-<strong>to</strong>tal Luxury 16,802 132<br />
Fnac 1,237 10 0.3x 2012e sales<br />
Redcats 949 7 0.3x 2012e sales<br />
Retail (Fnac+Redcats) 2,186 17<br />
CFAO (41.98%) 904 7 HSBC target price EUR35<br />
Puma (75.12%) 2,942 23 HSBC target price EUR275<br />
Volcom 356 3 Acquisition price<br />
Other -1,113 -9 10 x 2012e EBITDA<br />
Total PPR 22,078 174<br />
Net debt end-2012e -3,073 -24<br />
Total PPR equity value 19,005 150<br />
Note: CFAO (CFAO FP, EUR30.09, OW); Puma (PUM GR, EUR256.95, OW)<br />
Valuation data<br />
Year <strong>to</strong> 12/2011a 12/2012e 12/2013e 12/2014e<br />
EV/sales 1.6 1.4 1.3 1.1<br />
EV/EBITDA 10.3 8.8 7.4 6.2<br />
EV/IC 1.5 1.4 1.3 1.2<br />
PE* 15.4 12.4 10.5 9.2<br />
P/NAV 1.5 1.4 1.3 1.2<br />
FCF yield (%) 5.0 6.3 8.0 9.4<br />
Dividend yield (%) 2.7 2.9 3.1 3.2<br />
Note: * = Based on HSBC EPS (fully diluted)<br />
Issuer information<br />
Share price (EUR) 128.60 Target price (EUR) 150.00<br />
Ratio, growth and per share analysis<br />
Year <strong>to</strong> 12/2011a 12/2012e 12/2013e 12/2014e<br />
Y-o-y % change<br />
Revenue -16.3 10.6 6.5 6.5<br />
EBITDA 2.7 15.7 13.6 11.2<br />
Operating pr<strong>of</strong>it 4.6 17.3 14.9 12.0<br />
PBT 22.9 25.6 18.8 15.7<br />
HSBC EPS 13.6 23.7 18.1 15.1<br />
Reuters (Equity) PRTP.PA Bloomberg (Equity) PP FP<br />
Market cap (USDm) 21,746 Market cap (EURm) 16,310<br />
Free float (%) 55 Enterprise value (EURm) 19,383<br />
Country France Sec<strong>to</strong>r Multiline Retail<br />
Analysts An<strong>to</strong>ine Belge Contact 33 1 5652 4347<br />
Erwan Rambourg Contact 852 2996 6572<br />
Sophie Dargnies Contact 33 1 5652 4348<br />
Price relative<br />
Ratios (%)<br />
Revenue/IC (x) 0.8 1.0 1.0 1.1<br />
ROIC 8.4 10.5 11.7 13.0<br />
ROE 9.8 11.5 12.5 13.2<br />
ROA 4.9 5.8 6.6 7.3<br />
EBITDA margin 15.6 16.4 17.4 18.2<br />
Operating pr<strong>of</strong>it margin 13.1 13.9 15.0 15.8<br />
EBITDA/net interest (x) 8.9 10.5 14.2 22.4<br />
Net debt/equity 29.0 24.4 16.0 7.4<br />
Net debt/EBITDA (x) 1.8 1.4 0.9 0.4<br />
CF from operations/net debt 30.4 44.4 76.3 172.3<br />
147<br />
147<br />
137<br />
127<br />
117<br />
107<br />
97<br />
87<br />
Jun-11<br />
PPR<br />
Rel <strong>to</strong> SBF-120<br />
Dec-11<br />
137<br />
127<br />
117<br />
107<br />
97<br />
87<br />
Per share data (EUR)<br />
Source: HSBC<br />
EPS Rep (fully diluted) 7.91 9.78 11.65 13.50<br />
HSBC EPS (fully diluted) 8.35 10.33 12.20 14.05<br />
DPS 3.50 3.71 3.93 4.17<br />
NAV 86.09 92.84 101.24 111.26<br />
Note: price at close <strong>of</strong> 01 Mar 2012<br />
61
Consumer Brands & Retail<br />
Global luxury goods<br />
March 2012<br />
abc<br />
Prada<br />
Execution has been very strong for the past 18 months and we<br />
expect 2011 results on 29 March <strong>to</strong> be impressive once again<br />
Growth s<strong>to</strong>ry appealing but risks remain. Despite higher estimates<br />
than consensus, we struggle <strong>to</strong> see much upside from here<br />
Increase our target price <strong>to</strong> HKD48 (from HKD39) on higher<br />
estimates, remain Neutral (V)<br />
Fantastic execution but well<br />
priced in now, we believe<br />
A very impressive delivery, expect<br />
more short term<br />
Strong Q3<br />
On 29 November 2011, Prada published very<br />
impressive Q3 results with an acceleration in sales<br />
growth (linked <strong>to</strong> both an acceleration in same<br />
s<strong>to</strong>re sales growth as well as a higher contribution<br />
from new s<strong>to</strong>res and a rebound by wholesale) and<br />
conversely very impressive operating leverage.<br />
Group EBIT margin shot up 620bps (<strong>to</strong> 23.3% <strong>of</strong><br />
sales) as the non recurrent IPO-related charge <strong>of</strong><br />
cEUR10m weighed on the first half at the SG&A<br />
level and the group benefited from a greater scale<br />
effect given the sales growth rates.<br />
With no slowdown by brand or region, but a<br />
worrying macro backdrop, management at the<br />
time could only state the obvious ("continue <strong>to</strong><br />
moni<strong>to</strong>r trends in order <strong>to</strong> promptly react as in the<br />
past"). We are now convinced that Q4 (ended<br />
January 2012) will probably prove <strong>to</strong> be<br />
somewhat a re-run <strong>of</strong> the very strong Q3.<br />
Q4/FY should also impress<br />
Prada should publish FY results on 29 March and<br />
we expect these <strong>to</strong> be strong. We believe Q4<br />
should show a similar <strong>to</strong>p-line performance (31%<br />
vs 33% reported growth in Q3) and see a 510bps<br />
EBIT margin expansion (<strong>to</strong> a record high 30.0%<br />
in the quarter), implying net pr<strong>of</strong>it in Q4 would<br />
almost double year-on-year. Undoubtedly, if this<br />
is the case, Prada will have been taking market<br />
share. Over the FY <strong>to</strong> January 2012, this will<br />
mean sales growth <strong>of</strong> 27%, gross margin<br />
expansion <strong>of</strong> 370bps (<strong>to</strong> 71.5%) and EBIT margin<br />
<strong>of</strong> 25.1% (up c500bps), a very sizeable feat.<br />
When we initiated coverage in Oc<strong>to</strong>ber 2011, we<br />
explained that the “group’s capacity <strong>to</strong> disappoint<br />
in the next 18 months years [was] limited” as Prada<br />
fits particularly well in<strong>to</strong> our travel theme. Not only<br />
has it grown on booming sales in Asia, but sales in<br />
Europe and Italy have clearly benefited from<br />
<strong>to</strong>urism. The magnitude <strong>of</strong> growth (and associated<br />
margin expansion) has <strong>take</strong>n us by surprise and we<br />
think the s<strong>to</strong>ck’s recent re-rating has been well<br />
justified; we continue <strong>to</strong> believe there are risks,<br />
implying the s<strong>to</strong>ck may be close <strong>to</strong> correctly<br />
valued at this stage.<br />
62
Consumer Brands & Retail<br />
Global luxury goods<br />
March 2012<br />
abc<br />
Gauging risk/reward in 2012<br />
One <strong>of</strong> the reasons we were cautious on Oc<strong>to</strong>ber was<br />
that we viewed the retail expansion strategy at Prada<br />
as <strong>to</strong>o aggressive, especially considering this is a<br />
family-controlled business. The recent same s<strong>to</strong>re<br />
sales growth seems <strong>to</strong> underline that for now, the<br />
company’s expansion is supported by trends.<br />
However, we still believe Prada will be more<br />
exposed <strong>to</strong> a slowdown in demand that others from a<br />
P&L point <strong>of</strong> view given the level <strong>of</strong> fixed costs the<br />
business is currently incurring.<br />
Note this is theoretical and we expect strong<br />
operating leverage in FY Jan 2013 and the<br />
following year but while Prada should be able <strong>to</strong><br />
reach Gucci/Cartier-type 30% EBIT margins, it<br />
might <strong>take</strong> a few years still.<br />
The pricing power that luxury brands can apply is<br />
proportionate <strong>to</strong> this idea <strong>of</strong> scarcity associated<br />
with service and the notion that a brand can<br />
become <strong>to</strong>o “commonplace”. Selling expenses as<br />
a percentage <strong>of</strong> sales have come down and this<br />
despite the opening <strong>of</strong> c75 s<strong>to</strong>res in 2011.<br />
Although this is supportive <strong>of</strong> margins short term,<br />
as sales improve, it leads us <strong>to</strong> question the level<br />
<strong>of</strong> service in the group’s s<strong>to</strong>res and the potential<br />
for long-term depreciation <strong>of</strong> the brand. Current<br />
s<strong>to</strong>re locations might lose relevance in the<br />
coming quarters.<br />
What it means <strong>to</strong> be listed in HK<br />
We also believe it is quite relevant, particularly as<br />
our team is based in both Europe and Hong Kong,<br />
that Prada should trade in line with EU and USlisted<br />
peers. In other words the HK-listing<br />
premium, were it <strong>to</strong> reappear, would be difficult<br />
<strong>to</strong> justify. This is because, from an operations<br />
perspective, other companies, eg Richemont and<br />
LVMH, have theoretically as much legitimacy <strong>to</strong><br />
be HK-listed as Prada.<br />
Earnings, valuation and risks<br />
For FY Jan 13e, we continue <strong>to</strong> <strong>take</strong> the view that<br />
Prada should have the highest sales growth in the<br />
sec<strong>to</strong>r (16% organic, 19% reported). Gross margin<br />
should increase by another 120bps (<strong>to</strong>72.7%) as<br />
the shift <strong>to</strong> retail from wholesale continues and FX<br />
becomes favourable. At the EBIT margin level, we<br />
have fac<strong>to</strong>red in another 190bps <strong>of</strong> improvement<br />
<strong>to</strong> 27.0% <strong>of</strong> sales. For us, the biggest unknown<br />
will be selling expenses: we currently see these<br />
coming down by 30bps (<strong>to</strong> 30.8% <strong>of</strong> sales) but this<br />
will vary greatly depending on sales growth and<br />
associated staff costs.<br />
We have increased our FY Jan 13e-14e EBIT<br />
estimates by 16% on the back <strong>of</strong> much higher sales<br />
growth than expected in FY Jan 12e, generating<br />
impressive operating leverage.<br />
We have increased our DCF-based target price <strong>to</strong><br />
HKD48 (from HKD39) on these revisions and<br />
changes <strong>to</strong> our assumptions (RFR 3.0% vs 3.5%,<br />
ERP 5.5% vs 4.5%, WACC 10.26% vs 8.7%; see<br />
page 65). Under our research model, for s<strong>to</strong>cks<br />
with a volatility indica<strong>to</strong>r, the Neutral band is<br />
10ppts above and below the hurdle rate for Hong<br />
Kong s<strong>to</strong>cks <strong>of</strong> 8.5%. Our target price <strong>of</strong> HKD48<br />
provides a potential return <strong>of</strong> 10%, which is<br />
within the Neutral band, therefore we reiterate our<br />
Neutral (V) rating. Potential return equals the<br />
percentage difference between the current share<br />
price and the target price, including the forecast<br />
dividend yield when indicated.<br />
On our new estimates, Prada is trading at 18.8x<br />
CY12e and 16.1x CY13e EPS, or at an average 2%<br />
premium <strong>to</strong> its Europe-listed peers for 2012e.<br />
Risks (on both the upside and downside) include<br />
those common <strong>to</strong> most luxury s<strong>to</strong>cks, ie macroeconomic<br />
conditions in emerging markets and the<br />
USD/EUR rate. Company-specific risks include a<br />
placement <strong>of</strong> shares from Prada family members<br />
and failure/success <strong>to</strong> execute the retail strategy<br />
(translating in<strong>to</strong> greater/smaller operating<br />
leverage than we model).<br />
63
Consumer Brands & Retail<br />
Global luxury goods<br />
March 2012<br />
abc<br />
Prada SPA – P&L<br />
Year ending Jan+1 (EURm) FY 2009a Q4 2010a H2 2010a FY 2010a Q4 2011a H2 2011e FY 2011e FY 2012e FY 2013e<br />
Net sales 1,531 654 1,097 2,017 855 1,444 2,562 3,050 3,400<br />
Royalties 31 7 13 30 15 22 38 46 51<br />
Net revenues 1,561 661 1,110 2,047 869 1,466 2,600 3,096 3,451<br />
Gross pr<strong>of</strong>it 975 460 774 1,388 623 1,054 1,859 2,251 2,537<br />
Gross margin (%) 62.4% 69.6% 69.7% 67.8% 71.7% 71.9% 71.5% 72.7% 73.5%<br />
Product and development expenses (97) (26) (48) (97) (27) (49) (100) (105) (110)<br />
as a % <strong>of</strong> sales 6.2% 4.0% 4.3% 4.7% 3.2% 3.3% 3.8% 3.4% 3.2%<br />
Advertising and promotion expenses (76) (23) (48) (85) (33) (69) (123) (155) (179)<br />
as a % <strong>of</strong> sales 4.9% 3.6% 4.4% 4.2% 3.8% 4.7% 4.7% 5.0% 5.2%<br />
Selling expenses (485) (195) (353) (643) (252) (451) (809) (953) (1 056)<br />
as a % <strong>of</strong> sales 31.0% 29.8% 31.8% 31.4% 29.5% 30.8% 31.1% 30.8% 30.6%<br />
General and administrative expenses (130) (46) (78) (145) (51) (85) (174) (201) (221)<br />
as a % <strong>of</strong> sales 8.4% 7.0% 7.0% 7.1% 6.0% 5.8% 6.7% 6.5% 6.4%<br />
SG&A as a % <strong>of</strong> sales 44.4% 47.6% 47.4% 42.4% 44.6% 46.4% 45.7% 45.4%<br />
EBIT 187.1 164.9 241.5 413.7 260.8 399.7 653.1 836.1 970.3<br />
EBIT margin (%) 12.0% 24.9% 21.8% 20.2% 30.0% 27.3% 25.1% 27.0% 28.1%<br />
Source: Company data, HSBC estimates<br />
64
9<br />
.<br />
6<br />
Consumer Brands & Retail<br />
Global luxury goods<br />
March 2012<br />
abc<br />
Financials & valuation: Prada SPA<br />
Neutral (V)<br />
Financial statements<br />
Year <strong>to</strong> 01/2011a 01/2012e 01/2013e 01/2014e<br />
DCF analysis<br />
HSBC assumptions<br />
DCF, comprising<br />
Pr<strong>of</strong>it & loss summary (EURm)<br />
Revenue 2,047 2,600 3,096 3,451<br />
EBITDA 531 770 975 1,126<br />
Depreciation & amortisation -118 -117 -139 -155<br />
Operating pr<strong>of</strong>it/EBIT 414 653 836 970<br />
Net interest -21 -21 -21 -21<br />
PBT 388 628 811 945<br />
HSBC PBT 388 628 811 945<br />
Taxation -135 -163 -211 -246<br />
Net pr<strong>of</strong>it 251 462 597 696<br />
HSBC net pr<strong>of</strong>it 251 462 597 696<br />
Cash flow summary (EURm)<br />
Cash flow from operations 374 516 687 817<br />
Capex -188 -257 -275 -293<br />
Cash flow from investment -192 -257 -275 -293<br />
Dividends -59 -132 -171 -199<br />
Change in net debt -71 -355 -242 -325<br />
FCF equity 112 263 416 528<br />
Balance sheet summary (EURm)<br />
Intangible fixed assets 869 869 869 869<br />
Tangible fixed assets 725 865 1,000 1,138<br />
Current assets 770 1,185 1,563 1,985<br />
Cash & others 97 351 593 917<br />
Total assets 2,366 2,921 3,434 3,995<br />
Operating liabilities 518 613 697 757<br />
Gross debt 498 397 397 397<br />
Net debt 401 46 -196 -520<br />
Shareholders funds 1,204 1,763 2,189 2,687<br />
Invested capital 1,750 1,955 2,143 2,318<br />
Ratio, growth and per share analysis<br />
Year <strong>to</strong> 01/2011a 01/2012e 01/2013e 01/2014e<br />
Y-o-y % change<br />
Revenue 31.1 27.0 19.1 11.5<br />
EBITDA 87.9 44.9 26.7 15.4<br />
Operating pr<strong>of</strong>it 131.0 57.9 28.0 16.0<br />
PBT 150.2 61.7 29.2 16.6<br />
HSBC EPS 147.9 81.8 29.3 16.6<br />
Ratios (%)<br />
Revenue/IC (x) 1.2 1.4 1.5 1.5<br />
ROIC 16.0 26.1 30.2 32.2<br />
ROE 22.3 31.1 30.2 28.6<br />
ROA 11.9 18.2 19.4 19.2<br />
EBITDA margin 26.0 29.6 31.5 32.6<br />
Operating pr<strong>of</strong>it margin 20.2 25.1 27.0 28.1<br />
EBITDA/net interest (x) 25.0 36.2 45.8 52.9<br />
Net debt/equity 33.1 2.6 -8.9 -19.3<br />
Net debt/EBITDA (x) 0.8 0.1 -0.2 -0.5<br />
CF from operations/net debt 93.2 1130.0<br />
Per share data (EUR)<br />
EPS Rep (fully diluted) 0.10 0.18 0.23 0.27<br />
HSBC EPS (fully diluted) 0.10 0.18 0.23 0.27<br />
DPS 0.05 0.07 0.08 0.09<br />
NAV 0.48 0.69 0.86 1.05<br />
Risk-free rate (%) 3.00 EBIT growth 11-21e CAGR (%) 9.4<br />
Equity premium (%) 5.50 EBIT growth 21-41e CAGR (%) 4.0<br />
Sec<strong>to</strong>r beta 1.20 Fade period 2041-47e<br />
Specific beta 1.00 WACC (%) 10.26<br />
Sensitivity and valuation range (HKD/share)<br />
Cost <strong>of</strong> capital vs fade period 4 years 8 years 12 years<br />
9.3% 52.4 53.1 53.7<br />
9.8% 49.8 50.4 51.0<br />
10.3% 47.4 48.0 48.5<br />
10.8% 45.3 45.8 46.2<br />
11.3% 43.3 43.7 44.1<br />
Valuation data<br />
Year <strong>to</strong> 01/2011a 01/2012e 01/2013e 01/2014e<br />
EV/sales 5.5 4.2 3.4 3.0<br />
EV/EBITDA 21.2 14.1 10.9 9.2<br />
EV/IC 6.4 5.6 5.0 4.5<br />
PE* 43.1 23.7 18.3 15.7<br />
P/NAV 9.0 6.2 5.0 4.1<br />
FCF yield (%) 1.0 2.4 3.8 4.9<br />
Dividend yield (%) 1.2 1.6 1.8 2.0<br />
Note: * = Based on HSBC EPS (fully diluted)<br />
Issuer information<br />
Share price (HKD) 43.80 Target price (HKD) 48.00<br />
Reuters (Equity) 1913.HK Bloomberg (Equity) 1913 HK<br />
Market cap (USDm) 14,450 Market cap (HKDm) 112,076<br />
Free float (%) 20 Enterprise value (EURm) 10,891<br />
Country Hong Kong Sec<strong>to</strong>r Textiles, Apparel & Luxury<br />
Goods<br />
Analysts Erwan Rambourg Contact 852 2996 6572<br />
An<strong>to</strong>ine Belge Contact 33 1 5652 4347<br />
Sophie Dargnies Contact 33 1 5652 4348<br />
Price relative<br />
51<br />
46<br />
41<br />
36<br />
31<br />
26<br />
Jun-11<br />
Prada SPA<br />
Source: HSBC<br />
Note: price at close <strong>of</strong> 01 Mar 2012<br />
Rel <strong>to</strong> HANG SENG INDEX<br />
Dec-11<br />
51<br />
46<br />
41<br />
36<br />
31<br />
26<br />
65
Consumer Brands & Retail<br />
Global luxury goods<br />
March 2012<br />
abc<br />
Richemont<br />
Valuation remains undemanding but while the year probably started<br />
well, <strong>to</strong>ugh comps are ahead (April-September)<br />
There is a case for high-end watches underperforming the average<br />
short term; this implies operating leverage may be lacking this year<br />
Downgrade <strong>to</strong> Neutral from Overweight, cut target price <strong>to</strong> CHF62<br />
(from CHF66) on lower estimates<br />
Absolute valuation fine, shortterm<br />
turbulence likely though<br />
On our estimates Richemont is trading at a 2012e<br />
calendar PE <strong>of</strong> 16.6x. Looking at the barriers <strong>to</strong><br />
entry in the luxury space generally and the power<br />
<strong>of</strong> the Cartier brand in particular, and given it is<br />
impossible <strong>to</strong> match its portfolio with the specialist<br />
watchmakers (Baume et Mercier aside maybe), it<br />
is difficult <strong>to</strong> avoid thinking this asset is not very<br />
cheap in absolute terms at current levels.<br />
But since we believe there is a case for high-end<br />
watches underperforming the average short term,<br />
the valuation argument may not be sufficient.<br />
What could make things more difficult in the next<br />
few months is how unpredictable trends will be<br />
given H1’s (ended September 2011) very strong<br />
organic sales growth and how easy it will be for<br />
the group <strong>to</strong> lap this <strong>to</strong>ugh basis <strong>of</strong> comparison.<br />
H1 ending September sales were up 36% at<br />
constant FX and we estimate that pure pricing was<br />
c8%, volume growth was in the high teens and the<br />
rest (high single digit <strong>to</strong> low double digit) was<br />
various mix effects (shifting from franchise <strong>to</strong><br />
DOS, streamlining <strong>of</strong> wholesale distribution in the<br />
US leading <strong>to</strong> consumers buying in DOS rather<br />
than third-party retailers, product mix).<br />
Richemont: organic sales growth rates<br />
FY March 2008a 2009a 2010a 2011a 2012e<br />
H1 16% 16% -20% 22% 36%<br />
H2 15% -12% 10% 16% 19%<br />
FY 16% 2% -5% 19% 27%<br />
Source: Company data, HSBC estimates<br />
Although pricing can <strong>of</strong>fer another 3-4% <strong>of</strong> growth<br />
for FY March 2013e, we estimate, we believe<br />
volumes will be flattish or even slightly down and a<br />
further shift <strong>to</strong> retail can add a few more points <strong>to</strong><br />
<strong>to</strong>p-line growth. All in, we expect growth <strong>to</strong> slow<br />
from 27% in FY March 2012 <strong>to</strong> 5% in FY March<br />
2013. On the face <strong>of</strong> it the market may think this is<br />
a poor figure but for us, this is more a return <strong>to</strong><br />
almost “trend-like” growth despite the very <strong>to</strong>ugh<br />
basis <strong>of</strong> comparison.<br />
Don’t want <strong>to</strong> be left “high and dry”<br />
This part is common <strong>to</strong> the investment cases <strong>of</strong><br />
Hengdeli, Richemont and the Swatch Group and<br />
concerns all three. We believe trends in China will<br />
slow but not see a steep step down and the recent<br />
Swiss watch exports point <strong>to</strong> very decent orders that<br />
will support February/March sales.<br />
We think, however, that price points will matter<br />
more this year than last, with higher-end products<br />
probably seeing sales slow more than the average<br />
66
Consumer Brands & Retail<br />
Global luxury goods<br />
March 2012<br />
abc<br />
for the watch space. There are several reasons we<br />
think this will be the case:<br />
We estimate that up <strong>to</strong> two-thirds <strong>of</strong><br />
consumers purchasing luxury products in<br />
China are new <strong>to</strong> the brands they buy (ie not<br />
“repeat purchasers”) and are taking the view<br />
that the proportion <strong>of</strong> clients “new <strong>to</strong> a brand”<br />
is greater at the lower price points (Rado,<br />
Mido, Longines, Tissot) than for Omega and<br />
above type <strong>of</strong> price points.<br />
We believe that consumers able <strong>to</strong> afford<br />
higher price points are more “travelled” and<br />
exposed <strong>to</strong> negative headline news weighing<br />
on sentiment and will <strong>take</strong> the view that they<br />
can postpone a EUR10k purchase, waiting for<br />
a better psychological environment.<br />
We are convinced that corporate gift giving<br />
(or Guanxi) drives high-end purchases more<br />
than it drives sales <strong>of</strong> the likes <strong>of</strong> Rado,<br />
Longines, Tissot, etc and if real estate deals<br />
are scarce and government <strong>of</strong>ficials change at<br />
year-end, we could see gifting slowing, at<br />
least temporarily.<br />
Our estimate for Greater China is that sales<br />
growth for Omega and above price points will be<br />
in the high single digits/low double digits only<br />
while lower-priced brands could still grow<br />
comfortably in the high 20s, if not more, on the<br />
back <strong>of</strong> middle-class expansion and higher wages.<br />
We think Hengdeli is a good proxy for the space<br />
in Greater China and we see it increasing <strong>to</strong>tal<br />
sales by 19% (vs 37% in 2011e), or 20% at retail<br />
(vs 36%), with mainland China up 26% (vs 38%)<br />
and HK up 10% only (vs 32%). Note there is a<br />
correlation between regional exposure and price<br />
points (the mainland being far more volume<br />
driven than HK).<br />
As far as Richemont is concerned, we still believe<br />
that Cartier can act as the Louis Vuit<strong>to</strong>n <strong>of</strong> watches<br />
and jewellery, ie progressively become the reference<br />
brand but <strong>to</strong>p-line growth could be temporarily<br />
muted as high-end consumers, including in China,<br />
postpone their purchase intentions.<br />
Earnings, valuation and risks<br />
We have cut our FY March 13e-14e EBIT<br />
estimates by 4-8% on the back <strong>of</strong> lower sales<br />
growth (high-end underperforming the average for<br />
watches) and the impact this has on EBIT (lack <strong>of</strong><br />
operating leverage in FY March 13 as the<br />
company continues <strong>to</strong> invest much behind the<br />
brands). On our revised estimates, EBIT margin<br />
should dip by 20bps in FY March 2013 and regain<br />
50bps (<strong>to</strong> 21.8% <strong>of</strong> sales) in FY March 2014.<br />
We have lowered our DCF-based target price <strong>to</strong><br />
CHF62 (vs CHF66) following these estimate<br />
revisions. Our DCF assumptions are unchanged<br />
(see table on page 69). Under our research model,<br />
for s<strong>to</strong>cks without a volatility indica<strong>to</strong>r, the Neutral<br />
band is 5 ppts above and below the hurdle rate for<br />
Swiss s<strong>to</strong>cks <strong>of</strong> 7.5%. Our target price <strong>of</strong> EUR62<br />
provides a potential return <strong>of</strong> 11%, which is within<br />
the Neutral band; therefore, we downgrade the<br />
s<strong>to</strong>ck Neutral from Overweight. Potential return<br />
equals the percentage difference between the<br />
current share price and the target price, including<br />
the forecast dividend yield when indicated.<br />
On our new estimates, Richemont is trading at 16.6x<br />
CY 2012e and 14.6x CY 2013e EPS, an attractive<br />
valuation for long-term inves<strong>to</strong>rs. Specific risks<br />
include the Swiss franc’s strength (on the downside)<br />
or weakness (on the upside).<br />
Downside risks are the his<strong>to</strong>rically lower resilience<br />
<strong>of</strong> watches compared <strong>to</strong> other luxury segments in<br />
case <strong>of</strong> a severe economic downturn, and failure <strong>to</strong><br />
improve results <strong>of</strong> underperforming assets. Upside<br />
risks include a much better resilience <strong>of</strong> sales trends<br />
and more convincing margin turnaround at Baume<br />
& Mercier, Dunhill and Net-à-Porter.<br />
67
Consumer Brands & Retail<br />
Global luxury goods<br />
March 2012<br />
abc<br />
Richemont FY results and forecasts<br />
YE March (EURm) 2007a 2008a 2009a H1 10a H2 10a 2010a H1 11a H2 11a 2011a H1 12a H2 12e 2012e 2013e 2014e<br />
Net sales 4,827 5,302 5,418 2,379 2,797 5,176 3,259 3,633 6,892 4,214 4,361 8,575 9,325 10,000<br />
% change 12.0% 9.8% 2.2% -15.0% 6.8% -4.5% 37.0% 29.9% 33.2% 29.3% 20.0% 24.4% 8.8% 7.2%<br />
Gross pr<strong>of</strong>it 3,074 3,405 3,417 1,464 1,727 3,191 2,113 2,281 4,394 2,665 2,737 5,402 5,875 6,332<br />
Gross margin 63.7% 64.2% 63.1% 61.5% 61.7% 61.6% 64.8% 62.8% 63.8% 63.2% 62.8% 63.0% 63.0% 63.3%<br />
Selling & distribution 1,090 1,181 1,235 598 679 1,277 761 893 1,654 891 1,077 1,968 2,176 2,337<br />
as a % <strong>of</strong> sales 22.6% 22.3% 22.8% 25.1% 24.3% 24.7% 23.3% 24.6% 24.0% 21.1% 24.7% 23.0% 23.3% 23.4%<br />
Administration 503 528 542 259 286 545 314 342 656 342 353 695 751 800<br />
as a % <strong>of</strong> sales 10.4% 10.0% 10.0% 10.9% 10.2% 10.5% 9.6% 9.4% 9.5% 8.1% 8.1% 8.1% 8.1% 8.0%<br />
Communication 570 607 644 204 302 506 264 435 699 340 526 866 933 990<br />
as a % <strong>of</strong> sales 11.8% 11.4% 11.9% 8.6% 10.8% 9.8% 8.1% 12.0% 10.1% 8.1% 12.1% 10.1% 10.0% 9.9%<br />
Other/non-recurring items -5 -13 28 13 20 33 14 16 30 17 13 30 30 30<br />
Total operating exps 2,158 2,297 2,449 1,074 1,287 2,361 1,353 1,686 3,039 1,590 1,970 3,560 3,889 4,157<br />
as a % <strong>of</strong> sales 44.7% 43.3% 45.2% 45.1% 46.0% 45.6% 41.5% 46.4% 44.1% 37.7% 45.2% 41.5% 41.7% 41.6%<br />
EBIT reported 916 1,108 968 390 440 830 760 595 1,355 1,075 768 1,843 1,985 2,175<br />
EBIT underlying 900 1,108 968 390 440 830 760 595 1,355 1,075 768 1,843 1,985 2,175<br />
EBIT margin underlying 18.6% 20.9% 17.9% 16.4% 15.7% 16.0% 23.3% 16.4% 19.7% 25.5% 17.6% 21.5% 21.3% 21.8%<br />
Financial result 31 47 -101 24 -161 -137 -120 -163 -283 -227 15 -212 20 26<br />
Exceptional 102 0 102 0 0<br />
Taxation -158 -195 -133 -70 -24 -94 -98 -98 -196 -139 -133 -272 -335 -368<br />
Minority interest -1 1 3 0 4 4 -2 103 101 0 0 0 -1 0<br />
Luxury net pr<strong>of</strong>it (reported) 788 961 737 344 259 603 642 437 1,079 709 649 1,358 1,670 1,834<br />
Source: Company data, HSBC estimates<br />
Richemont FY sales and EBIT by segment<br />
YE March (EURm) 2007a 2008a 2009a H1 10a H2 10a 2010a H1 11a H2 11a 2011a H1 12a H2 12e 2012e 2013e 2014e<br />
Sales by segment<br />
Jewellery maisons 2,435 2 657 2 762 1 222 1 465 2 688 1 619 1 860 3 479 2 165 2 305 4 470 4 976 5 349<br />
Specialist watchmakers 1,203 1 378 1 437 655 699 1 353 901 873 1 774 1 171 1 039 2 210 2 409 2 578<br />
Writing instruments 585 637 587 238 313 551 303 369 672 334 372 706 755 793<br />
Other businesses 604 630 632 264 320 584 436 531 967 544 646 1 190 1 311 1 430<br />
Total sales 4,827 5,302 5,418 2,379 2,797 5,176 3,259 3,633 6,892 4,214 4,361 8,575 9,450 10,150<br />
EBIT by segment<br />
Jewellery maisons 667 767 777 349 393 742 541 521 1 062 734 666 1 400 1 573 1 701<br />
Specialist watchmakers 274 376 301 133 98 231 259 120 379 312 171 483 553 607<br />
Writing instruments 110 120 69 29 50 79 48 61 109 54 52 106 117 125<br />
Other businesses 9 2 -39 -29 -7 -36 -19 -16 -35 -17 15 -2 27 55<br />
Total EBIT before<br />
1,060 1,265 1,108 482 534 1,016 829 687 1,516 1,083 904 1,987 2,270 2,489<br />
unallocated costs<br />
EBIT reported 916 1,108 968 390 440 830 760 595 1,355 1,075 768 1,843 2,053 2,256<br />
EBIT margin by segment<br />
Jewellery maisons 27.4% 28.9% 28.1% 28.6% 26.8% 27.6% 33.4% 28.0% 30.5% 33.9% 28.9% 31.3% 31.6% 31.8%<br />
Specialist watchmakers 22.8% 27.3% 20.9% 20.3% 14.0% 17.1% 28.7% 13.8% 21.4% 26.6% 16.5% 21.9% 23.0% 23.6%<br />
Writing instruments 18.8% 18.8% 11.8% 12.2% 16.0% 14.3% 15.8% 16.5% 16.2% 16.2% 14.0% 15.0% 15.5% 15.8%<br />
Other businesses 1.5% 0.3% -6.2% -11.0% -2.2% -6.2% -4.4% -3.0% -3.6% -3.1% 2.3% -0.2% 2.1% 3.9%<br />
Total EBIT margin before 22.0% 23.9% 20.4% 20.3% 19.1% 19.6% 25.4% 18.9% 22.0% 25.7% 20.7% 23.2% 24.0% 24.5%<br />
unallocated costs<br />
EBIT margin reported 19.0% 20.9% 17.9% 16.4% 15.7% 16.0% 23.3% 16.4% 19.7% 25.5% 17.6% 21.5% 21.7% 22.2%<br />
Source: Company data, HSBC estimates<br />
68
1<br />
0<br />
.<br />
8<br />
Consumer Brands & Retail<br />
Global luxury goods<br />
March 2012<br />
abc<br />
Financials & valuation: Richemont Br<br />
Neutral<br />
Financial statements<br />
Year <strong>to</strong> 03/2011a 03/2012e 03/2013e 03/2014e<br />
DCF analysis<br />
HSBC assumptions<br />
DCF, comprising<br />
Pr<strong>of</strong>it & loss summary (EURm)<br />
Revenue 6,892 8,575 9,325 10,000<br />
EBITDA 1,760 2,288 2,476 2,714<br />
Depreciation & amortisation -405 -446 -490 -539<br />
Operating pr<strong>of</strong>it/EBIT 1,355 1,843 1,985 2,175<br />
Net interest -283 -212 20 26<br />
PBT 1,174 1,631 2,005 2,201<br />
HSBC PBT 1,072 1,631 2,005 2,201<br />
Taxation -196 -272 -335 -368<br />
Net pr<strong>of</strong>it 1,079 1,358 1,670 1,834<br />
HSBC net pr<strong>of</strong>it 978 1,358 1,670 1,834<br />
Cash flow summary (EURm)<br />
Cash flow from operations 1,495 1,572 1,950 2,168<br />
Capex -323 -600 -653 -700<br />
Cash flow from investment -578 -600 -653 -700<br />
Dividends -141 -191 -256 -330<br />
Change in net debt -694 -780 -1,040 -1,163<br />
FCF equity 894 971 1,297 1,494<br />
Balance sheet summary (EURm)<br />
Intangible fixed assets 59 59 59 59<br />
Tangible fixed assets 1,267 1,422 1,584 1,745<br />
Current assets 7,034 7,545 8,950 10,422<br />
Cash & others 3,381 3,490 4,530 5,693<br />
Total assets 9,693 10,359 11,926 13,560<br />
Operating liabilities 1,542 1,712 1,866 1,996<br />
Gross debt 791 120 120 120<br />
Net debt -2,590 -3,370 -4,410 -5,573<br />
Shareholders funds 6,980 8,147 9,560 11,064<br />
Invested capital 3,437 3,824 4,198 4,537<br />
Ratio, growth and per share analysis<br />
Year <strong>to</strong> 03/2011a 03/2012e 03/2013e 03/2014e<br />
Y-o-y % change<br />
Revenue 33.2 24.4 8.8 7.2<br />
EBITDA 53.8 30.0 8.2 9.6<br />
Operating pr<strong>of</strong>it 63.3 36.0 7.8 9.6<br />
PBT 70.1 38.9 23.0 9.8<br />
HSBC EPS 60.5 38.9 22.9 9.8<br />
Ratios (%)<br />
Revenue/IC (x) 2.2 2.4 2.3 2.3<br />
ROIC 35.3 42.3 41.2 41.5<br />
ROE 15.5 18.0 18.9 17.8<br />
ROA 13.9 15.3 14.8 14.2<br />
EBITDA margin 25.5 26.7 26.5 27.1<br />
Operating pr<strong>of</strong>it margin 19.7 21.5 21.3 21.8<br />
EBITDA/net interest (x) 6.2 10.8<br />
Net debt/equity -37.0 -41.3 -46.1 -50.3<br />
Net debt/EBITDA (x) -1.5 -1.5 -1.8 -2.1<br />
CF from operations/net debt<br />
Per share data (EUR)<br />
EPS Rep (fully diluted) 1.91 2.40 2.95 3.24<br />
HSBC EPS (fully diluted) 1.73 2.40 2.95 3.24<br />
DPS 0.34 0.45 0.58 0.67<br />
NAV 12.16 14.19 16.65 19.27<br />
Risk-free rate (%) 3.00 EBIT growth 2011-21e CAGR (%) 6.4<br />
Equity premium (%) 4.50 EBIT growth 2021-41e CAGR (%) 4.0<br />
Sec<strong>to</strong>r beta 1.20 Fade period 2041-47e<br />
Specific beta 1.20 WACC (%) 9.48<br />
Sensitivity and valuation range (CHF/share)<br />
Cost <strong>of</strong> capital vs fade period 4 years 8 years 12 years<br />
8.5% 68.5 69.7 70.6<br />
9.0% 64.6 65.7 66.5<br />
9.5% 61.1 62.0 62.8<br />
10.0% 57.9 58.7 59.4<br />
10.5% 55.1 55.7 56.4<br />
Valuation data<br />
Year <strong>to</strong> 03/2011a 03/2012e 03/2013e 03/2014e<br />
EV/sales 3.5 2.6 2.3 2.0<br />
EV/EBITDA 13.6 9.8 8.7 7.5<br />
EV/IC 7.0 5.9 5.1 4.5<br />
PE* 26.8 19.3 15.7 14.3<br />
P/NAV 3.8 3.3 2.8 2.4<br />
FCF yield (%) 3.4 3.8 5.0 5.8<br />
Dividend yield (%) 0.7 1.0 1.3 1.4<br />
Note: * = Based on HSBC EPS (fully diluted)<br />
Issuer information<br />
Share price (CHF) 55.75 Target price (CHF) 62.00<br />
Reuters (Equity) CFR.VX Bloomberg (Equity) CFR VX<br />
Market cap (USDm) 35,409 Market cap (CHFm) 32,012<br />
Free float (%) 91 Enterprise value (EURm) 22,492<br />
Country Switzerland Sec<strong>to</strong>r Textiles, Apparel & Luxury<br />
Goods<br />
Analysts Erwan Rambourg Contact 852 2996 6572<br />
An<strong>to</strong>ine Belge Contact 33 1 5652 4347<br />
Sophie Dargnies Contact 33 1 5652 4348<br />
Price relative<br />
61<br />
56<br />
51<br />
46<br />
41<br />
36<br />
Jun-11<br />
Richemont Br<br />
Source: HSBC<br />
Note: price at close <strong>of</strong> 02 Mar 2012<br />
Rel <strong>to</strong> SMI<br />
Dec-11<br />
61<br />
56<br />
51<br />
46<br />
41<br />
36<br />
69
Consumer Brands & Retail<br />
Global luxury goods<br />
March 2012<br />
abc<br />
Swatch<br />
Still a very China-driven call but one we are happy <strong>to</strong> reiterate<br />
There is a case for access brand watches outperforming the highend<br />
segment short term; with c58% sales exposure <strong>to</strong> the access<br />
segment, Swatch should continue <strong>to</strong> gain market share<br />
Remain Overweight; increase TP <strong>to</strong> CHF500 from CHF465 on<br />
higher sales growth estimates<br />
Purest play on China and<br />
access brands after Hengdeli<br />
“Cheap and cheerful” part <strong>of</strong> the<br />
portfolio should do very well in 2012<br />
It's not <strong>of</strong>ten that a company produces year 2 sellside<br />
estimates in year 1. Publishing an update<br />
twice a year and having had an exceptional finish<br />
<strong>to</strong> 2011, the group published FY 2011 sales<br />
figures in early January and achieved just that.<br />
Sales for 2011 were pretty much in line with<br />
expectations for 2012. We think this was possible<br />
because volume-driven brands have started <strong>to</strong><br />
outperform the average for the sec<strong>to</strong>r in the latter<br />
part <strong>of</strong> 2011. We <strong>take</strong> the view this will continue.<br />
Swatch group sales grew by double digits in<br />
February (as in January). This is a positive<br />
performance since Chinese New Year occurred in<br />
January this year (vs February last year), so<br />
February faced a <strong>to</strong>ugher basis <strong>of</strong> comparison.<br />
We think, however, that price points will matter<br />
more this year than last, with higher-end products<br />
probably seeing sales slow more than the average<br />
for the watch space. According <strong>to</strong> CEO Mr Hayek,<br />
in mainland China (but not in Hong Kong), midrange<br />
brands did better than high-end brands.<br />
January/February sell out (sales <strong>to</strong> the endconsumer)<br />
in Mainland China were 50% for<br />
Longines, 57% for Tissot and 14% for Omega. In<br />
Mainland China, Mr Hayek thinks that the group's<br />
high-end brands could grow at 9-10% in 2012 and<br />
the rest <strong>of</strong> the portfolio at "high double digit rates".<br />
Swatch 2011 sales breakdown<br />
Electronic Systems<br />
5%<br />
Production external sales<br />
7%<br />
Low end watch<br />
segment<br />
14%<br />
Medium watch segment<br />
44%<br />
High end watch<br />
segment*<br />
30%<br />
*Includes Breguet, Blancpain, Glasshütte, Léon Ha<strong>to</strong>t, Jacquet Droz, 50% <strong>of</strong> Omega sales<br />
Source: HSBC estimates<br />
There are several reasons we think this will be<br />
the case:<br />
We estimate that up <strong>to</strong> two-thirds <strong>of</strong><br />
consumers purchasing luxury products in<br />
China are new <strong>to</strong> the brands they buy (ie not<br />
“repeat purchasers”) and <strong>take</strong> the view that<br />
70
Consumer Brands & Retail<br />
Global luxury goods<br />
March 2012<br />
abc<br />
the proportion <strong>of</strong> clients “new <strong>to</strong> a brand” is<br />
greater at the lower price points (Rado, Mido,<br />
Longines, Tissot) than for Omega and above<br />
type <strong>of</strong> price points.<br />
We believe consumers able <strong>to</strong> afford higher<br />
price points are more “travelled” and exposed<br />
<strong>to</strong> negative headline news weighing on<br />
sentiment and will <strong>take</strong> the view that they can<br />
postpone a purchase, waiting for a better<br />
psychological environment. The access<br />
segment is also less vulnerable <strong>to</strong> the ‘guilt<br />
fac<strong>to</strong>r’ (buying a USD1,500 watch is less <strong>of</strong> a<br />
statement than buying a USD50,000 watch).<br />
We are convinced that corporate gift giving (or<br />
Guanxi) drives high-end purchases more than<br />
it drives sales <strong>of</strong> the likes <strong>of</strong> Rado, Longines,<br />
Tissot, etc and if real estate deals are scarce<br />
and government <strong>of</strong>ficials change at year-end,<br />
we see gifting slowing, at least temporarily<br />
We think Hengdeli is a good proxy for the space<br />
in Greater China and we see it increasing <strong>to</strong>tal<br />
sales by 19% (vs 37% in 2011e), or 20% at retail<br />
(vs 36%), with mainland China up 26% (vs 38%)<br />
and HK up 10% only (vs 32%). Note there is a<br />
correlation between regional exposure and price<br />
points (the mainland being far more volume<br />
driven than HK).<br />
Swatch 2011 sales by region<br />
Greater<br />
Japan<br />
China<br />
2%<br />
Oceania<br />
38%<br />
1%<br />
Africa<br />
Asia ex<br />
1%<br />
GC ex<br />
Japan<br />
14%<br />
Europe<br />
Americas<br />
36%<br />
8%<br />
Earnings, valuation and risks<br />
The CEO confirmed that 5-10% sales growth<br />
seemed achievable in 2012, and that the group<br />
would try <strong>to</strong> be "as close as possible" from the<br />
CHF8bn gross sales level.<br />
We fac<strong>to</strong>r in 12% organic sales growth (vs 7%<br />
previously) for the year and are confident that with<br />
exposure <strong>to</strong> China and a more recent trend – retail<br />
expansion in the US – this is an achievable number.<br />
If FX stays at the current level, Swatch believes<br />
the FX impact at the sales and EBIT level would<br />
be broadly neutral in H1 2012 and slightly<br />
positive in H2 2012. This is good news since FX<br />
pressures were the main cause behind the lack <strong>of</strong><br />
leverage in 2011. We have raised our 2012-2014<br />
EBIT estimates by 4%, 6% and 8%.<br />
We have increased our DCF-based target price <strong>to</strong><br />
CHF500 (vs CHF465) on these revisions. Our<br />
DCF assumptions are unchanged (see table on<br />
page 73). Under our research model, for s<strong>to</strong>cks<br />
without a volatility indica<strong>to</strong>r, the Neutral band is<br />
5ppts above and below the hurdle rate for Swiss<br />
s<strong>to</strong>cks <strong>of</strong> 7.5%. Our target price <strong>of</strong> CHF500<br />
implies a potential return <strong>of</strong> 22.3%, above the<br />
Neutral band <strong>of</strong> our model; therefore, we reiterate<br />
our Overweight rating on Swatch. Potential return<br />
equals the percentage difference between the<br />
current share price and the target price, including<br />
the forecast dividend yield when indicated.<br />
Swatch currently trades at 14.6x 2012e PE and<br />
13.1x 2013e PE. Restated for the group’s net cash<br />
pile (CHF2.5bn at end-2012e), Swatch’s cash<br />
2013e PE is 11.0x. We believe this is an attractive<br />
valuation if our assumption that Asian<br />
consumption (local and travel related) will hold<br />
up is correct.<br />
Source: Company data<br />
71
Consumer Brands & Retail<br />
Global luxury goods<br />
March 2012<br />
abc<br />
We welcome the news that, after 18 months <strong>of</strong><br />
having no IR manager, Swatch announced that Mr<br />
Félix Knecht (Treasurer) would assume an IR role<br />
(although only part-time).<br />
Downside risks <strong>to</strong> our rating include a slower-thanexpected<br />
return <strong>of</strong> the production division’s EBIT<br />
margin <strong>to</strong> 2007 peak; watch movement shortages<br />
weighing on sales, negative macro newsflow on<br />
China, and a stronger CHF.<br />
Swatch P&L<br />
CHFm 2006a YoY<br />
(%)<br />
2007a YoY<br />
(%)<br />
2008a<br />
YoY<br />
(%)<br />
2009a<br />
YoY<br />
(%)<br />
2010a* YoY<br />
(%)<br />
2011a<br />
YoY<br />
(%)<br />
2012e YoY 2013e<br />
(%)<br />
YoY<br />
(%)<br />
2014e<br />
YoY<br />
(%)<br />
Sales<br />
Watches & Jewellery 3,723 14 4,456 20 4,547 2 4,187 -8 5,225 25 5,953 14 6,798 14 7,376 9 7,927 7<br />
Watches Production 1,335 9 1,624 22 1,742 7 1,429 -18 1,487 4 1,972 33 2,213 12 2,401 9 2,581 8<br />
Electronics Systems 586 9 623 6 526 -16 391 -26 436 12 334 -23 364 9 388 6 411 6<br />
General services 6 0 5 7 5 5 5 5 5 5<br />
Elimination internal sales -830 10 -1,062 28 -1,145 8 -870 -24 -1,045 20 -1,500 44 -1,680 12 -1,820 8 -1,954 7<br />
Total net sales 4,820 12 5,646 17 5,677 1 5,142 -9 6,108 19 6,764 11 7,700 14 8,350 8 8,970 7<br />
Total gross sales 5,050 12 5,941 18 5,966 0 5,421 -9 6,440 19 7,143 11 8,106 13 8,784 8 9,434 7<br />
EBIT<br />
Watches 738 18 920 25 828 -10 804 -3 1,257 56 1,352 8 1,574 16 1,739 10 1,891 9<br />
Watches production 147 213 235 60 281 20 94 -67 186 98 322 73 376 17 420 12 465 11<br />
Electronics systems 106 36 99 -7 104 5 24 -77 62 158 13 -79 25 96 35 37 41 18<br />
General services -18 13 -18 0 -11 -39 -19 73 -69 263 -73 6 -76 4 -79 4 -82 4<br />
Total 973 32 1,236 27 1,202 -3 903 -25 1,436 59 1,614 12 1,900 18 2,115 11 2,315 9<br />
EBIT margin<br />
Watches 19.8% 20.6% 18.2% 19.2% 24.1% 22.7% 23.2% 23.6% 23.9%<br />
Watches production 11.0% 14.5% 16.1% 6.6% 12.5% 16.3% 17.0% 17.5% 18.0%<br />
Electronics systems 18.1% 15.9% 19.8% 6.1% 14.2% 3.9% 7.0% 9.0% 10.0%<br />
Total 20.2% 21.9% 21.2% 17.6% 23.5% 23.9% 24.7% 25.3% 25.8%<br />
Net financial result & associates 84 37 -196 46 -38 -3 35 47 59<br />
Taxes -227 -258 -168 -186 -318 -335 -416 -465 -510<br />
Tax rate 21.5% 20.3% 16.7% 19.6% 22.7% 20.8% 21.5% 21.5% 21.5%<br />
Minority interest -3 -4 -4 -4 -6 -7 -9 -11 -13<br />
Net consolidated income (reported) 827 35 1,011 22 834 -18 759 -9 1,074 42 1,269 18 1,510 19 1,686 12 1,850 10<br />
EPS (bearer) (reported) (CHF) 14.87 39 18.50 24 15.76 -15 14.48 -8 20.28 40 23.49 16 27.95 19 31.21 12 34.25 10<br />
EPS (bearer) (HSBC) (CHF) 14.87 41 18.50 24 15.76 -15 14.48 -8 20.28 40 23.49 16 27.95 19 31.21 12 34.25 10<br />
* Restated<br />
Source : Company data, HSBC estimates<br />
72
2<br />
2<br />
.<br />
3<br />
Consumer Brands & Retail<br />
Global luxury goods<br />
March 2012<br />
abc<br />
Financials & valuation: Swatch<br />
Overweight<br />
Financial statements<br />
Year <strong>to</strong> 12/2011a 12/2012e 12/2013e 12/2014e<br />
DCF analysis<br />
HSBC assumptions<br />
DCF, comprising<br />
Pr<strong>of</strong>it & loss summary (CHFm)<br />
Revenue 6,764 7,700 8,350 8,970<br />
EBITDA 1,843 2,138 2,363 2,573<br />
Depreciation & amortisation -229 -238 -248 -258<br />
Operating pr<strong>of</strong>it/EBIT 1,614 1,900 2,115 2,315<br />
Net interest -9 35 47 59<br />
PBT 1,611 1,935 2,162 2,374<br />
HSBC PBT 1,611 1,935 2,162 2,374<br />
Taxation -335 -416 -465 -510<br />
Net pr<strong>of</strong>it 1,269 1,510 1,686 1,850<br />
HSBC net pr<strong>of</strong>it 1,269 1,510 1,686 1,850<br />
Cash flow summary (CHFm)<br />
Cash flow from operations 644 1,158 1,593 1,741<br />
Capex -515 -410 -450 -450<br />
Cash flow from investment -523 -410 -450 -450<br />
Dividends -270 -317 -377 -422<br />
Change in net debt 183 -444 -778 -880<br />
FCF equity 129 748 1,143 1,291<br />
Balance sheet summary (CHFm)<br />
Intangible fixed assets 328 328 328 328<br />
Tangible fixed assets 1,665 1,837 2,039 2,232<br />
Current assets 7,096 8,230 9,457 10,822<br />
Cash & others 2,169 2,613 3,391 4,271<br />
Total assets 9,805 11,111 12,540 14,098<br />
Operating liabilities 1,133 1,224 1,322 1,427<br />
Gross debt 91 91 91 91<br />
Net debt -2,078 -2,522 -3,300 -4,180<br />
Shareholders funds 8,054 9,246 10,555 11,984<br />
Invested capital 5,787 6,558 7,112 7,684<br />
Ratio, growth and per share analysis<br />
Year <strong>to</strong> 12/2011a 12/2012e 12/2013e 12/2014e<br />
Y-o-y % change<br />
Revenue 10.7 13.8 8.4 7.4<br />
EBITDA 11.2 16.0 10.5 8.9<br />
Operating pr<strong>of</strong>it 12.4 17.7 11.3 9.4<br />
PBT 15.2 20.1 11.7 9.8<br />
HSBC EPS 15.8 19.0 11.7 9.7<br />
Ratios (%)<br />
Revenue/IC (x) 1.3 1.2 1.2 1.2<br />
ROIC 24.4 24.2 24.3 24.6<br />
ROE 16.8 17.5 17.0 16.4<br />
ROA 13.9 14.3 14.0 13.6<br />
EBITDA margin 27.2 27.8 28.3 28.7<br />
Operating pr<strong>of</strong>it margin 23.9 24.7 25.3 25.8<br />
EBITDA/net interest (x) 204.8<br />
Net debt/equity -25.7 -27.2 -31.2 -34.8<br />
Net debt/EBITDA (x) -1.1 -1.2 -1.4 -1.6<br />
CF from operations/net debt<br />
Per share data (CHF)<br />
EPS Rep (fully diluted) 23.49 27.95 31.21 34.25<br />
HSBC EPS (fully diluted) 23.49 27.95 31.21 34.25<br />
DPS 5.87 6.99 7.80 8.56<br />
NAV 149.11 171.18 195.41 221.86<br />
Risk-free rate (%) 3.00 EBIT growth 2011-21e CAGR (%) 8.8<br />
Equity premium (%) 4.50 EBIT growth 2021-41e CAGR (%) 4.0<br />
Sec<strong>to</strong>r beta 1.20 Fade period 2041-47e<br />
Specific beta 1.20 WACC (%) 9.48<br />
Sensitivity and valuation range (CHF/share)<br />
Cost <strong>of</strong> capital vs fade period 4 years 8 years 12 years<br />
8.5% 562 573 581<br />
9.0% 525 534 542<br />
9.5% 492 500 507<br />
10.0% 462 469 476<br />
10.5% 436 442 448<br />
Valuation data<br />
Year <strong>to</strong> 12/2011a 12/2012e 12/2013e 12/2014e<br />
EV/sales 2.8 2.4 2.1 1.8<br />
EV/EBITDA 10.1 8.5 7.4 6.4<br />
EV/IC 3.2 2.8 2.4 2.1<br />
PE* 17.4 14.6 13.1 11.9<br />
P/NAV 2.7 2.4 2.1 1.8<br />
FCF yield (%) 0.6 3.6 5.5 6.2<br />
Dividend yield (%) 1.4 1.7 1.9 2.1<br />
Note: * = Based on HSBC EPS (fully diluted)<br />
Issuer information<br />
Share price (CHF) 408.90 Target price (CHF) 500<br />
Reuters (Equity) UHR.VX Bloomberg (Equity) UHR VX<br />
Market cap (USDm) 23,684 Market cap (CHFm) 21,411<br />
Free float (%) 73 Enterprise value (CHFm) 18,173<br />
Country Switzerland Sec<strong>to</strong>r Textiles, Apparel & Luxury<br />
Goods<br />
Analysts An<strong>to</strong>ine Belge Contact 33 1 5652 4347<br />
Erwan Rambourg Contact 852 2996 6572<br />
Sophie Dargnies Contact 33 1 5652 4348<br />
Price relative<br />
459<br />
439<br />
419<br />
399<br />
379<br />
359<br />
339<br />
319<br />
299<br />
279<br />
Jun-11<br />
Swatch<br />
Source: HSBC<br />
Rel <strong>to</strong> SMI<br />
Note: price at close <strong>of</strong> 01 Mar 2012<br />
Dec-11<br />
459<br />
439<br />
419<br />
399<br />
379<br />
359<br />
339<br />
319<br />
299<br />
279<br />
73
Consumer Brands & Retail<br />
Global luxury goods<br />
March 2012<br />
abc<br />
Tiffany<br />
Tiffany registered the slowest growth in our universe during the<br />
holiday season<br />
Still no definite answer <strong>to</strong> why performance was weaker than peers<br />
(apart from the usual vulnerability <strong>to</strong> US local jewellers discounting<br />
in <strong>to</strong>ugher times)<br />
Remain Neutral, unchanged USD69 target price<br />
The industry outlier<br />
Slowest growth in our universe during the<br />
holiday season<br />
On 10 January, Tiffany warned on FY Jan 2012<br />
pr<strong>of</strong>its following weaker-than-expected November-<br />
December sales. Reported sales increased 7% on a<br />
worldwide basis in the two months (comps 4%,<br />
contribution from new s<strong>to</strong>res 2%, FX 1%). This 7%<br />
increase compared with low double-digit company<br />
guidance for Q4 ended January 2012. The 6%<br />
growth at constant FX was below the following<br />
figures disclosed by peers for calendar Q4:<br />
Richemont 24%, Burberry 21%, Ferragamo 20%,<br />
Swatch c19% (HSBC estimate), Hugo Boss (17%),<br />
Coach 15%, Luxottica 9% and Tod’s 8%.<br />
The slowdown in the Americas (sales up 4%,<br />
comps 2% in November-December compared with<br />
comps 15% in Q3), which accounts for c50% <strong>of</strong><br />
sales, was the main reason for the earnings miss.<br />
Tourist sales increased y-o-y, but local sales<br />
declined. The weakness seen in November in the<br />
East Coast spread <strong>to</strong> the rest <strong>of</strong> the US in December<br />
(with the East Coast still being the s<strong>of</strong>ter area).<br />
By price segment, trends were broad-based.<br />
Management indicated that Tiffany (which has a<br />
no-discount policy) suffered from competitive<br />
discounting from local jewellers.<br />
The second main reason was the negative trend<br />
seen in London (slightly less than half <strong>of</strong> European<br />
sales, ie c6% <strong>of</strong> <strong>to</strong>tal sales). As a consequence,<br />
comp sales in Europe declined 4% (2% including<br />
new s<strong>to</strong>res) in spite <strong>of</strong> a modest rise in sales in<br />
Continental Europe. Compared with European<br />
peers, Tiffany does not benefit as much from<br />
<strong>to</strong>urist-related sales.<br />
In Asia, trends remained robust (18% at constant<br />
FX, comps 12%), but moderated compared with<br />
the very strong growth rates seen in previous<br />
quarters (36% in Q2 and 41% in Q3). According <strong>to</strong><br />
Tiffany, this is a normalisation <strong>of</strong> trends <strong>to</strong>wards<br />
growth rates sustainable for the medium term<br />
(rather than a negative inflexion point). The<br />
positive surprise came from Japan, which saw a 6%<br />
rise in comps.<br />
On the back <strong>of</strong> these lower-than-expected<br />
November-December trends, the company cut its<br />
FY Jan 2012e EPS guidance <strong>to</strong> USD3.60-3.65<br />
(versus USD3.70-3.80 previously). Traditionally,<br />
Tiffany needs a 5-6% comps figure <strong>to</strong> generate<br />
positive leverage on SG&A. We thus believe the<br />
4% comp figure is likely <strong>to</strong> translate in<strong>to</strong> a slight<br />
decline in gross margin combined with a negative<br />
SG&A leverage in Q4 Jan 2012e.<br />
74
Consumer Brands & Retail<br />
Global luxury goods<br />
March 2012<br />
abc<br />
Still no definite answer <strong>to</strong> why performance<br />
was weaker than peers: Richemont’s strong<br />
performance is evidence that the issue is not the<br />
segment (jewellery), while that <strong>of</strong> the affordable<br />
luxury player Coach suggests that Tiffany’s price<br />
positioning (on average lower than peers) is also<br />
not a problem. Two fac<strong>to</strong>rs have played a role: (i)<br />
Tiffany benefits less than peers from <strong>to</strong>uristrelated<br />
sales in the US and <strong>to</strong> a greater extent in<br />
Europe; and (ii) it is always more vulnerable than<br />
peers <strong>to</strong> the discounting habits <strong>of</strong> US local ‘mom<br />
& pop’ jewellers in <strong>to</strong>ugher times. Beyond that,<br />
we are always reluctant <strong>to</strong> draw definite<br />
conclusions from trends over two <strong>to</strong> three months.<br />
Tiffany’s 2010 sales breakdown by region<br />
Americas<br />
50%<br />
Source: Company data<br />
Japan<br />
18%<br />
Other<br />
2%<br />
Asia Pacific<br />
18%<br />
Europe<br />
12%<br />
Earnings, valuation and risks<br />
We leave our 2011-13 EPS estimates unchanged.<br />
For 2011, our estimate is USD3.65, in line with the<br />
higher end <strong>of</strong> the USD3.60-3.65 company guidance<br />
(and close <strong>to</strong> the USD3.64 consensus estimate). Our<br />
2012 and 2013 EPS estimates remain below<br />
consensus (5% and 4%, respectively).<br />
We leave our DCF-based target price unchanged at<br />
USD69. The assumptions used <strong>to</strong> generate our<br />
DCF-derived target price are detailed on page 77.<br />
Under our research model, for s<strong>to</strong>cks without a<br />
volatility indica<strong>to</strong>r, the Neutral band is 5<br />
percentage points above and below the hurdle rate<br />
for US s<strong>to</strong>cks <strong>of</strong> 7.0%. Our target price <strong>of</strong> USD69<br />
implies a potential return <strong>of</strong> 3.7%, within the<br />
Neutral band <strong>of</strong> our model; therefore, we reiterate<br />
our Neutral rating on Tiffany. Potential return<br />
equals the percentage difference between the<br />
current share price and the target price, including<br />
the forecast dividend yield when indicated.<br />
After its marked underperformance y-t-d (shares<br />
down 1% vs 16-43% increases for other players),<br />
Tiffany currently trades at 15.2x calendar 2013e,<br />
ie in line with European peers.<br />
Upside risks <strong>to</strong> our rating include stronger-thanexpected<br />
comps in the US and SG&A leverage as<br />
well as speculation that Tiffany may be a <strong>take</strong>over<br />
target following the termination <strong>of</strong> the watch<br />
contract with Swatch (announced 11 September,<br />
2011), which has been described as a poison pill<br />
(see FT article from 22 May 2008). Downside<br />
risks <strong>to</strong> our rating include a more pronounced US<br />
slowdown than the one embedded in our<br />
forecasts, non-domestic investment weighing on<br />
earnings (s<strong>to</strong>res, ad spend) and disappointing<br />
results in watches.<br />
For 2012, we forecast 3% reported sales growth<br />
(comps 0%, contribution from new s<strong>to</strong>res 3%, FX<br />
0%). Our worldwide 0% comps forecast is based on<br />
the following regional comps assumptions:<br />
Americas -5%, Europe -3%, Japan +1% and Asia<br />
+13%. We expect the EBIT margin (adjusted for<br />
one-<strong>of</strong>fs) <strong>to</strong> decrease 90bp <strong>to</strong> 19.9% on the back <strong>of</strong> a<br />
30bp gross margin deterioration and negative SG&A<br />
leverage (even though Tiffany said it is currently<br />
adjusting costs <strong>to</strong> the recent slowdown in trends).<br />
75
Consumer Brands & Retail<br />
Global luxury goods<br />
March 2012<br />
abc<br />
Tiffany results & forecasts<br />
USDm FY08a FY09a FY10a Q1 11a Q2 11a Q3 11a Q4 11e FY11e FY12e FY13e<br />
Net sales 2,860.0 2,709.7 3,085.3 761.0 872.7 821.8 1,179.6 3,635.0 3,760.0 4,120.0<br />
Gross pr<strong>of</strong>it 1,645.4 1,530.2 1,822.3 443.7 514.7 475.8 713.7 2,147.8 2,210.9 2,443.2<br />
Gross margin 57.5% 56.5% 59.1% 58.3% 59.0% 57.9% 60.5% 59.1% 58.8% 59.3%<br />
SG&A 1,172.6 1,089.7 1,227.5 307.7 374.2 329.7 424.2 1,435.7 1,462.9 1,588.2<br />
SG&A as % <strong>of</strong> sales 41.0% 40.2% 39.8% 40.4% 42.9% 40.1% 36.0% 39.5% 38.9% 38.5%<br />
Operating income reported 472.8 440.5 594.8 136.0 140.5 146.2 289.5 712.0 748.0 855.0<br />
Operating income HSBC* 472.8 440.5 610.8 145.0 174.0 146.2 289.5 754.5 748.0 855.0<br />
Operating margin HSBC* 16.5% 16.3% 19.8% 19.0% 19.9% 17.8% 24.5% 20.8% 19.9% 20.8%<br />
Interest income 28.9 50.5 47.3 10.1 9.6 10.4 9.8 40.0 20.0 0.0<br />
Earnings before tax 346.1 390.0 547.4 125.8 130.9 135.8 279.6 672.0 728.0 855.0<br />
Income taxes 126.1 124.3 179.0 44.8 40.9 46.1 95.1 226.8 247.5 290.7<br />
Tax rate (%) 36.4% 31.9% 32.7% 35.6% 31.2% 33.9% 34.0% 33.7% 34.0% 34.0%<br />
Net earnings 220.0 264.8 368.4 81.1 90.0 89.7 184.6 445.2 480.5 564.3<br />
Net EPS common (diluted) HSBC* (USD) 1.74 2.11 2.93 0.67 0.86 0.70 1.44 3.65 3.74 4.39<br />
Net EPS common (diluted) reported (USD) 1.74 2.11 2.87 0.63 0.69 0.70 1.44 3.45 3.74 4.39<br />
Weighted avg com share outst. (diluted, m) 126.4 125.4 128.4 129.4 129.8 128.8 128.5 129.1 128.6 128.6<br />
Americas 1,586.6 1,410.9 1,574.6 374.7 438.2 387.7 597.8 1,798.4 1,766.4 1,922.9<br />
Japan 543.4 527.1 546.5 123.4 142.5 146.4 204.7 617.0 635.5 635.5<br />
Asia ex-Japan 378.6 430.0 549.2 167.2 173.2 183.2 224.1 747.7 897.3 1,058.8<br />
Europe 284.6 311.8 360.8 85.6 101.3 92.5 136.5 415.9 399.2 435.2<br />
Other 66.7 29.9 54.2 10.1 17.4 11.9 16.6 56.0 61.6 67.7<br />
Total sales (USDm) 2,860.0 2,709.7 3,085.3 761.0 872.6 821.8 1,179.6 3,635.0 3,760.0 4,120.0<br />
Americas 55% 52% 51% 49% 50% 47% 51% 49% 47% 47%<br />
Japan 19% 19% 18% 16% 16% 18% 17% 17% 17% 15%<br />
Asia ex-Japan 13% 16% 18% 22% 20% 22% 19% 21% 24% 26%<br />
Europe 10% 12% 12% 11% 12% 11% 12% 11% 11% 11%<br />
Other 2% 1% 2% 1% 2% 1% 1% 2% 2% 2%<br />
Total sales (as a % <strong>of</strong> <strong>to</strong>tal) 100% 100% 100% 100% 100% 100% 100% 100% 100% 100%<br />
YoY evolution<br />
Sales -3% -5% 14% 20% 30% 21% 7% 18% 3% 10%<br />
Selling, G&A -3% -7% 13% 18% 37% 10% 8% 17% 2% 9%<br />
EBIT 11% -7% 35% 29% 24% 50% 4% 20% 5% 14%<br />
PBT -34% 13% 40% 35% 28% 61% 5% 23% 8% 17%<br />
Net earnings -34% 20% 39% 26% 33% 63% 2% 21% 8% 17%<br />
EPS diluted (HSBC) -25% 21% 39% 39% 56% 51% 0% 25% 2% 17%<br />
Reported sales growth<br />
Americas -10% -11% 12% 19% 25% 17% 4% 14% -2% 9%<br />
Japan 4% -3% 7% 7% 7% 12% 12% 13% 3% 0%<br />
Asia ex-Japan 10% 20% 29% 37% 29% 44% 19% 36% 20% 18%<br />
Europe 17% 10% 16% 25% 32% 19% -1% 15% -4% 9%<br />
Other -18% -55% 81% -18% 46% -18% 8% 3% 10% 10%<br />
Total sales -3% -5% 14% 20% 30% 21% 7% 18% 3% 10%<br />
Comp s<strong>to</strong>re sales<br />
Americas -14% -11% 8% 17% 23% 15% 2% 13% -5% 6%<br />
Japan -10% -12% -4% -3% 8% 4% 6% 4% 1% 0%<br />
Asia ex-Japan 5% 10% 14% 26% 41% 36% 12% 27% 13% 11%<br />
Europe 6% 9% 18% 15% 11% 6% -4% 6% -3% 5%<br />
Total sales -9% -7% 8% 15% 22% 16% 4% 13% 0% 6%<br />
*Restated for one-<strong>of</strong>fs<br />
Source: Company data, HSBC estimates<br />
76
3<br />
.<br />
7<br />
Consumer Brands & Retail<br />
Global luxury goods<br />
March 2012<br />
abc<br />
Financials & valuation: Tiffany<br />
Neutral<br />
Financial statements<br />
Year <strong>to</strong> 01/2011a 01/2012e 01/2013e 01/2014e<br />
DCF analysis<br />
HSBC assumptions<br />
DCF, comprising<br />
Pr<strong>of</strong>it & loss summary (USDm)<br />
Revenue 3,085 3,635 3,760 4,120<br />
EBITDA 743 869 914 1,031<br />
Depreciation & amortisation -148 -157 -166 -176<br />
Operating pr<strong>of</strong>it/EBIT 611 755 748 855<br />
Net interest -47 -40 -20 0<br />
PBT 547 672 728 855<br />
HSBC PBT 547 672 728 855<br />
Taxation -179 -227 -248 -291<br />
Net pr<strong>of</strong>it 368 445 480 564<br />
HSBC net pr<strong>of</strong>it 376 471 480 564<br />
Cash flow summary (USDm)<br />
Cash flow from operations 326 307 523 607<br />
Capex -127 -250 -226 -247<br />
Cash flow from investment -127 -250 -226 -247<br />
Dividends -120 -148 -165 -185<br />
Change in net debt -21 230 -133 -175<br />
FCF equity 173 30 268 328<br />
Balance sheet summary (USDm)<br />
Intangible fixed assets 0 0 0 0<br />
Tangible fixed assets 666 759 818 889<br />
Current assets 2,643 2,746 3,042 3,394<br />
Cash & others 741 511 644 819<br />
Total assets 3,736 3,932 4,288 4,710<br />
Operating liabilities 870 880 891 902<br />
Gross debt 688 688 688 688<br />
Net debt -53 177 44 -131<br />
Shareholders funds 2,177 2,363 2,708 3,120<br />
Invested capital 1,697 2,113 2,325 2,562<br />
Ratio, growth and per share analysis<br />
Year <strong>to</strong> 01/2011a 01/2012e 01/2013e 01/2014e<br />
Y-o-y % change<br />
Revenue 13.9 17.8 3.4 9.6<br />
EBITDA 28.1 17.0 5.2 12.8<br />
Operating pr<strong>of</strong>it 38.7 23.5 -0.9 14.3<br />
PBT 40.4 22.8 8.3 17.4<br />
HSBC EPS 38.6 24.7 2.4 17.4<br />
Ratios (%)<br />
Revenue/IC (x) 1.9 1.9 1.7 1.7<br />
ROIC 25.1 24.8 22.2 23.1<br />
ROE 18.5 20.8 18.9 19.4<br />
ROA 11.1 12.3 12.0 12.5<br />
EBITDA margin 24.1 23.9 24.3 25.0<br />
Operating pr<strong>of</strong>it margin 19.8 20.8 19.9 20.8<br />
EBITDA/net interest (x) 15.7 21.7 45.7<br />
Net debt/equity -2.4 7.5 1.6 -4.2<br />
Net debt/EBITDA (x) -0.1 0.2 0.0 -0.1<br />
CF from operations/net debt 173.7 1182.3<br />
Per share data (USD)<br />
EPS Rep (fully diluted) 2.87 3.45 3.74 4.39<br />
HSBC EPS (fully diluted) 2.93 3.65 3.74 4.39<br />
DPS 1.00 1.16 1.30 1.46<br />
NAV 17.23 18.51 21.21 24.43<br />
Risk-free rate (%) 3.00 EBIT growth 2011-21e CAGR (%) 7.2<br />
Equity premium (%) 4.00 EBIT growth 2021-41e CAGR (%) 4.0<br />
Sec<strong>to</strong>r beta 1.20 Fade period 2041-47e<br />
Specific beta 1.20 WACC (%) 8.74<br />
Sensitivity and valuation range (USD/share)<br />
Cost <strong>of</strong> capital vs fade period 4 years 8 years 12 years<br />
7.7% 79 81 82<br />
8.2% 73 75 76<br />
8.7% 68 69 70<br />
9.2% 63 64 65<br />
9.7% 59 60 61<br />
Valuation data<br />
Year <strong>to</strong> 01/2011a 01/2012e 01/2013e 01/2014e<br />
EV/sales 2.7 2.4 2.3 2.0<br />
EV/EBITDA 11.3 9.9 9.3 8.1<br />
EV/IC 4.9 4.1 3.7 3.2<br />
PE* 22.7 18.2 17.8 15.2<br />
P/NAV 3.9 3.6 3.1 2.7<br />
FCF yield (%) 2.1 0.4 3.2 3.9<br />
Dividend yield (%) 1.5 1.7 2.0 2.2<br />
Note: * = Based on HSBC EPS (fully diluted)<br />
Issuer information<br />
Share price (USD) 66.53 Target price (USD) 69.00<br />
Reuters (Equity) TIF.N Bloomberg (Equity) TIF US<br />
Market cap (USDm) 8,447 Market cap (USDm) 8,447<br />
Free float (%) 100 Enterprise value (USDm) 8,623<br />
Country United States Sec<strong>to</strong>r Specialty Retail<br />
Analysts An<strong>to</strong>ine Belge Contact 33 1 5652 4347<br />
Erwan Rambourg Contact 852 2996 6572<br />
Sophie Dargnies Contact 33 1 5652 4348<br />
Price relative<br />
89<br />
84<br />
79<br />
74<br />
69<br />
64<br />
59<br />
54<br />
Jun-11<br />
Tiffany Rel <strong>to</strong> S&P 500<br />
Source: HSBC<br />
Note: price at close <strong>of</strong> 01 Mar 2012<br />
Dec-11<br />
89<br />
84<br />
79<br />
74<br />
69<br />
64<br />
59<br />
54<br />
77
Consumer Brands & Retail<br />
Global luxury goods<br />
March 2012<br />
abc<br />
Tod’s<br />
Tod’s brand should be less affected by macro issues (thanks <strong>to</strong> its<br />
distinctive positioning and balanced geographic mix) than Hogan<br />
and Fay, whose sales exposure <strong>to</strong> the Italian market is over 90%<br />
Share price recovery (23%) since the beginning <strong>of</strong> 2012<br />
Downgrading <strong>to</strong> Neutral from Overweight, increasing target price <strong>to</strong><br />
EUR81 (from EUR80) following higher Q4 2011 sales<br />
Potential risk due <strong>to</strong> Hogan<br />
and Fay<br />
Share price recovery since the<br />
beginning <strong>of</strong> 2012<br />
When Tod’s published its Q4 sales, the market<br />
was disappointed by the 12% sales decline in Italy<br />
(50% <strong>of</strong> group sales) even though Q4 sales overall<br />
came out above expectations (reaching<br />
EUR195m). True, Italy sales growth slowed down<br />
compared <strong>to</strong> Q3 (-12% vs +9% in Q3). But this<br />
negative performance was mostly due <strong>to</strong> Hogan<br />
(c55% <strong>of</strong> Italy sales according <strong>to</strong> our estimates)<br />
and Fay (c20%). The Tod’s brand itself (55% <strong>of</strong><br />
sales) registered 19% organic sales growth in Q4,<br />
ie an acceleration compared <strong>to</strong> Q3 (18%) whilst<br />
Hogan (-c10% in Q4 vs c+11% in Q3) and Fay (-<br />
c20% in Q4 vs c1% in Q3) decelerated. All in all,<br />
the Tod's group managed <strong>to</strong> register 8%<br />
worldwide organic sales growth thanks <strong>to</strong> very<br />
strong sales growth elsewhere (Rest <strong>of</strong> Europe<br />
16%, US 23% and RoW 37%).<br />
Even though Tod’s shares lost 7% when the group<br />
published its Q4 2011 sales, the group share price<br />
has recovered markedly since the beginning <strong>of</strong><br />
2012 (23%).<br />
Tod’s brand itself (55% <strong>of</strong> sales in<br />
2011) should be resilient<br />
Distinctive positioning should enable the<br />
brand <strong>to</strong> be resilient in Italy<br />
The Tod’s brand has a distinctive positioning<br />
(classic, discreet, comfortable, yet perceived as<br />
luxury). In 2008-2009, ‘core buyers’ <strong>of</strong> shoes in<br />
Italy (defined as women buying up <strong>to</strong> 10 pairs per<br />
year) scaled down their purchases, but continued<br />
<strong>to</strong> buy their pair <strong>of</strong> Tod’s, which has no substitute<br />
product. Italy only registered one quarter <strong>of</strong><br />
negative trends (-1% in Q4 2009). We thus<br />
forecast flat organic sales growth in Europe<br />
(including Italy) for the Tod’s brand.<br />
Higher growth rate in Asia and RoW as the<br />
brand is an emerging brand there<br />
Asia (including ROW) only accounted for 18% <strong>of</strong><br />
sales in 2011 versus 9% in 2008 (compared <strong>to</strong><br />
more than 30% on average for the industry), but is<br />
growing at one <strong>of</strong> the fastest rates in the industry<br />
(China and Greater China both grew by more than<br />
50% in 2011). The group is accelerating the s<strong>to</strong>reopening<br />
process (20 additional s<strong>to</strong>res in 2012e, <strong>of</strong><br />
which 90% will be in Asia ex-Japan).<br />
Management expects <strong>to</strong> have c50 s<strong>to</strong>res for Tod’s<br />
group by the end <strong>of</strong> 2012e and the target is <strong>to</strong><br />
reach 100 s<strong>to</strong>res in the long term. We thus believe<br />
that the relatively small size <strong>of</strong> the group and the<br />
78
Consumer Brands & Retail<br />
Global luxury goods<br />
March 2012<br />
abc<br />
distinctive positioning <strong>of</strong> the brand should enable<br />
it <strong>to</strong> register better organic sales growth rates in<br />
Asia ex-Japan than its peers in the next three<br />
years. In addition, margins should benefit from<br />
the resulting geographic mix effect as in Asia (i)<br />
the mark-up is higher (3x-3.5x and even 4.0x for<br />
leather goods) vs 2.3x-2.5x in Continental Europe,<br />
and 2.6x-2.7x in UK; and (ii) the proportion <strong>of</strong><br />
leather goods and accessories sales is higher<br />
(margins on leather goods and accessories are<br />
500-1,000bp higher than for shoes).<br />
Over-exposure <strong>to</strong> Italy, mainly due <strong>to</strong><br />
Hogan and Fay<br />
Italy represented 50% <strong>of</strong> the <strong>to</strong>tal group sales in<br />
2011, <strong>of</strong> which c55% from Hogan, c20% from<br />
Fay and c25% from the Tod’s brand itself plus<br />
Roger Vivier. HSBC economists are forecasting a<br />
2% GDP decline in Italy (vs a 0.4% rise in 2011)<br />
and we believe these brands, which are mainly<br />
exposed <strong>to</strong> the Italian market (c90% for Hogan<br />
and c95% for Fay) will suffer more than the Tod’s<br />
brand itself, which benefits from <strong>to</strong>urism in Italy<br />
(c15-20% <strong>of</strong> sales in that country). We forecast a<br />
3% decline in Italy in 2012e for the group.<br />
Tod’s sales breakdown by region, 2011<br />
Italy<br />
51%:<br />
o/w Tod's + Roger Vivier<br />
25%<br />
o/w Fay<br />
20%<br />
o/w Hogan<br />
55%<br />
Europe<br />
20%<br />
ROW<br />
22%<br />
Source: Company data, HSBC estimate for Italy breakdown by brand<br />
North America<br />
7%<br />
Earnings, valuation and risks<br />
Tod’s will report its 2011 results on 13 March<br />
2012. During the Q4 sales publication,<br />
management mentioned that the 25.9% EBITDA<br />
margin expected by the consensus (implying a<br />
140bp improvement) was ‘very feasible’. We<br />
expect a 160bp increase <strong>to</strong> 26.1% (vs 25.9%<br />
previously). For 2012e, management also<br />
indicated that it was comfortable with current<br />
consensus sales expectations (6.5%) as order<br />
backlogs for Spring/Summer are up mid-single<br />
digits (<strong>of</strong> which half from pricing and half from<br />
volume). Management considered the 26.2%<br />
EBITDA margin consensus ‘very feasible’ as<br />
leather goods in the order backlog for<br />
Spring/Summer continued <strong>to</strong> outperform shoes,<br />
according <strong>to</strong> management.<br />
We increase our 2011e-13e estimates by 3%, 2%<br />
and 1%, respectively, on the back <strong>of</strong> higher sales<br />
growth in Q4. For 2012e and 2013e, we forecast<br />
organic sales growth <strong>of</strong> 5% (7% previously) and<br />
7% (unchanged) and EBITDA margins <strong>of</strong> 26.3%<br />
(unchanged) and 26.6% (vs 26.7% previously).<br />
We are 2% above consensus for 2012e but in line<br />
with it for 2013e.<br />
All in all, we increase our DCF-based target price<br />
from EUR80 <strong>to</strong> EUR81 on the back <strong>of</strong> our<br />
estimate changes (see above). The assumptions<br />
used <strong>to</strong> generate our DCF-derived target price are<br />
detailed on page 81. Our new WACC is 10.2% vs<br />
9.5% (changes are: RFR 3.0% vs 3.5%, ERP 6.0%<br />
vs 5.0%). Tod’s is currently trading at 16.8x 2012e<br />
and 15.5x 2013e PE, ie in line with the sec<strong>to</strong>r.<br />
Under our research model, for s<strong>to</strong>cks without a<br />
volatility indica<strong>to</strong>r, the Neutral band is 5ppts<br />
above and below the hurdle rate for Europe ex-UK<br />
s<strong>to</strong>cks <strong>of</strong> 9.0%. Our EUR81 target price implies a<br />
potential return <strong>of</strong> 4.1%, within the Neutral band;<br />
therefore, we are downgrading our rating <strong>to</strong><br />
Neutral (from Overweight). Potential return equals<br />
the percentage difference between the current<br />
share price and the target price, including the<br />
forecast dividend yield when indicated.<br />
Downside risks <strong>to</strong> our rating include: (i) evidence<br />
that there is a limit <strong>to</strong> growth in Italy; (ii) failure<br />
<strong>to</strong> expand significantly beyond shoes, and (iii) a<br />
new sale <strong>of</strong> shares by the family, which has<br />
repeatedly said it wanted <strong>to</strong> increase the free float<br />
and only have more than 50% (currently, the<br />
Della Valle family holds c57%).<br />
Upside risks include a faster-than-expected<br />
increase in the awareness <strong>of</strong> the Hogan’s brand.<br />
79
Consumer Brands & Retail<br />
Global luxury goods<br />
March 2012<br />
abc<br />
Tod's FY results and forecasts<br />
YE Dec (EURm) 2004a 2005a 2006a 2007a 2008a 2009a 2010a 2011e 2012e 2013e 2014e<br />
Net Sales 421 503 573 657 708 713 788 894 953 1,020 1,095<br />
Change (%) 13.3% 19.5% 13.9% 14.7% 7.7% 0.8% 10.4% 13.5% 6.6% 7.0% 7.4%<br />
Total production costs 336 396 445 517 567 570 613 680 721 768 818<br />
as % <strong>of</strong> sales 79.8% 78.7% 77.6% 78.7% 80.1% 79.9% 77.9% 76.0% 75.6% 75.3% 74.7%<br />
Change (%) 8.7% 17.8% 12.4% 16.3% 9.6% 0.6% 7.6% 10.8% 6.1% 6.5% 6.6%<br />
EBITDA 89 113 137 153 155 159 193 233 251 271 296<br />
as % <strong>of</strong> sales 21.1% 22.4% 24.0% 23.3% 22.0% 22.2% 24.5% 26.1% 26.3% 26.6% 27.0%<br />
Change in % 15.9% 27.0% 21.8% 11.3% 1.6% 2.0% 21.7% 20.7% 7.7% 8.0% 9.2%<br />
Amortization and reserves 22 23 24 27 30 32 33 41 43 46 49<br />
EBIT 67 90 114 126 126 126 160 192 208 225 247<br />
Percent <strong>of</strong> revenue 15.9% 17.9% 19.9% 19.3% 17.8% 17.7% 20.3% 21.5% 21.8% 22.0% 22.5%<br />
Change in % 53.4% 34.3% 26.3% 11.2% -0.5% 0.5% 26.5% 20.1% 8.0% 8.3% 9.7%<br />
Financial income 0 2 -1 0 -1 0 3 3 3 4 6<br />
Income before taxes 67 92 113 127 125 127 163 195 211 229 253<br />
% <strong>of</strong> revenue 15.9% 18.3% 19.7% 19.3% 17.7% 17.7% 20.7% 21.8% 22.1% 22.4% 23.1%<br />
Change (%) 44.7% 37.2% 23.2% 11.9% -1.2% 1.1% 29.1% 19.1% 8.3% 8.6% 10.4%<br />
Taxes 28 38 46 48 41 40 53 62 67 73 81<br />
Tax rate 42.1% 41.4% 41.0% 37.8% 33.2% 31.9% 32.2% 32.0% 32.0% 32.0% 32.0%<br />
Minority interests 0 1 1 1 1 0 2 2 2 2 2<br />
Consolidated net pr<strong>of</strong>it 38 53 66 77 83 86 109 131 142 154 170<br />
% <strong>of</strong> revenue 9.1% 10.6% 11.5% 11.8% 11.7% 12.0% 13.8% 14.6% 14.9% 15.1% 15.5%<br />
Change (%) 49.4% 38.7% 23.8% 17.1% 6.7% 3.8% 27.3% 19.8% 8.5% 8.7% 10.5%<br />
EPS diluted (EUR) 1.24 1.68 2.08 2.43 2.66 2.80 3.56 4.27 4.63 5.03 5.56<br />
Y-o-y change ( %) 36% 24% 17% 9% 5% 27% 20% 8% 9% 10%<br />
Source: Company data, HSBC estimates<br />
Tod's FY sales by segment<br />
YE Dec (EURm) 2004a 2005a 2006a 2007a 2008a 2009a 2010a 2011 2012e 2013e 2014e Split in<br />
2004<br />
Sales by brand<br />
Tod's 240 289 326 348 357 349 407 488 565 619 672 57% 61%<br />
Hogan 102 126 155 200 239 257 268 281 265 271 279 24% 25%<br />
Fay 69 77 82 90 93 92 90 88 76 76 80 16% 7%<br />
Other 10 11 9 20 19 16 23 37 47 53 64 2% 6%<br />
Total 421 503 573 657 708 713 788 894 953 1,020 1,095<br />
Sales by product category<br />
Shoes 268 315 358 427 486 506 565 647 706 759 816 64% 75%<br />
Leather goods & accessories 85 112 133 139 127 111 123 145 159 173 187 20% 17%<br />
Apparel 67 75 81 89 95 95 99 102 87 87 92 16% 8%<br />
Other 1 1 1 1 1 1 1 1 1 1 1 0% 0%<br />
Total 421 503 573 657 708 713 788 894 953 1,020 1,095<br />
Sales by channel<br />
DOS 220 259 283 318 336 349 404 474 510 551 599 52% 55%<br />
Third parties 201 244 290 339 372 364 384 420 443 469 496 48% 45%<br />
Total 421 503 573 657 708 713 788 894 953 1,020 1,095<br />
Sales by region<br />
Italy 205 241 280 334 384 405 426 449 436 445 459 49% 42%<br />
Europe 117 135 145 161 161 151 164 182 185 194 206 28% 19%<br />
North America 50 57 60 66 59 46 53 62 70 71 74 12% 7%<br />
Rest <strong>of</strong> World 50 70 88 97 103 111 145 200 263 310 357 12% 33%<br />
Total 421 503 573 657 708 713 788 894 953 1 020 1 095<br />
Source: Company data, HSBC estimates<br />
Split in<br />
2014e<br />
80
4<br />
.<br />
1<br />
Consumer Brands & Retail<br />
Global luxury goods<br />
March 2012<br />
abc<br />
Financials & valuation: TOD'S<br />
Neutral<br />
Financial statements<br />
Year <strong>to</strong> 12/2011a 12/2012e 12/2013e 12/2014e<br />
DCF analysis<br />
HSBC assumptions<br />
DCF, comprising<br />
Pr<strong>of</strong>it & loss summary (EURm)<br />
Revenue 894 953 1,020 1,095<br />
EBITDA 233 251 271 296<br />
Depreciation & amortisation -41 -43 -46 -49<br />
Operating pr<strong>of</strong>it/EBIT 192 208 225 247<br />
Net interest 3 3 4 6<br />
PBT 195 211 229 253<br />
HSBC PBT 195 211 229 253<br />
Taxation -62 -67 -73 -81<br />
Net pr<strong>of</strong>it 131 142 154 170<br />
HSBC net pr<strong>of</strong>it 131 142 154 170<br />
Cash flow summary (EURm)<br />
Cash flow from operations 145 171 184 201<br />
Capex -70 -50 -50 -49<br />
Cash flow from investment -70 -50 -50 -49<br />
Dividends -107 -75 -82 -89<br />
Change in net debt 25 -39 -46 -152<br />
FCF equity 77 123 136 154<br />
Balance sheet summary (EURm)<br />
Intangible fixed assets 209 209 209 209<br />
Tangible fixed assets 203 210 214 213<br />
Current assets 539 604 678 863<br />
Cash & others 147 186 232 384<br />
Total assets 991 1,063 1,141 1,325<br />
Operating liabilities 202 213 226 240<br />
Gross debt 75 75 75 75<br />
Net debt -72 -111 -156 -309<br />
Shareholders funds 667 727 792 962<br />
Invested capital 603 624 643 661<br />
Ratio, growth and per share analysis<br />
Year <strong>to</strong> 12/2011a 12/2012e 12/2013e 12/2014e<br />
Y-o-y % change<br />
Revenue 13.5 6.6 7.0 7.4<br />
EBITDA 20.7 7.7 8.0 9.2<br />
Operating pr<strong>of</strong>it 20.1 8.0 8.3 9.7<br />
PBT 19.1 8.3 8.6 10.4<br />
HSBC EPS 19.8 8.5 8.7 10.5<br />
Ratios (%)<br />
Revenue/IC (x) 1.6 1.6 1.6 1.7<br />
ROIC 23.2 23.0 24.1 25.7<br />
ROE 20.4 20.3 20.3 19.4<br />
ROA 13.9 14.0 14.1 13.9<br />
EBITDA margin 26.1 26.3 26.6 27.0<br />
Operating pr<strong>of</strong>it margin 21.5 21.8 22.0 22.5<br />
EBITDA/net interest (x)<br />
Net debt/equity -10.6 -15.1 -19.6 -31.9<br />
Net debt/EBITDA (x) -0.3 -0.4 -0.6 -1.0<br />
CF from operations/net debt<br />
Per share data (EUR)<br />
EPS Rep (fully diluted) 4.27 4.63 5.03 5.56<br />
HSBC EPS (fully diluted) 4.27 4.63 5.03 5.56<br />
DPS 2.46 2.67 2.90 3.20<br />
NAV 22.05 24.03 26.19 31.81<br />
Risk-free rate (%) 3.00 EBIT growth 2011-21e CAGR (%) 8.4<br />
Equity premium (%) 6.00 EBIT growth 2021-41e CAGR (%) 4.0<br />
Sec<strong>to</strong>r beta 1.20 Fade period 2041-47e<br />
Specific beta 1.00 WACC (%) 10.20<br />
Sensitivity and valuation range (EUR/share)<br />
Cost <strong>of</strong> capital vs fade period 4 years 8 years 12 years<br />
9.8% 83.8 85.2 86.2<br />
10.0% 81.7 83.0 84.1<br />
10.2% 79.8 81.0 82.0<br />
10.4% 77.9 79.0 80.0<br />
10.6% 76.1 77.2 78.1<br />
Valuation data<br />
Year <strong>to</strong> 12/2011a 12/2012e 12/2013e 12/2014e<br />
EV/sales 2.6 2.4 2.2 1.9<br />
EV/EBITDA 9.9 9.0 8.2 7.0<br />
EV/IC 3.8 3.6 3.5 3.1<br />
PE* 18.2 16.8 15.5 14.0<br />
P/NAV 3.5 3.2 3.0 2.4<br />
FCF yield (%) 3.2 5.1 5.7 6.5<br />
Dividend yield (%) 3.2 3.4 3.7 4.1<br />
Note: * = Based on HSBC EPS (fully diluted)<br />
Issuer information<br />
Share price (EUR) 77.80 Target price (EUR) 81.00<br />
Reuters (Equity) TOD.MI Bloomberg (Equity) TOD IM<br />
Market cap (USDm) 3,175 Market cap (EURm) 2,381<br />
Free float (%) 39 Enterprise value (EURm) 2,271<br />
Country Italy Sec<strong>to</strong>r Textiles, Apparel & Luxury<br />
Goods<br />
Analysts Sophie Dargnies Contact 33 1 5652 4348<br />
An<strong>to</strong>ine Belge Contact 33 1 5652 4347<br />
Erwan Rambourg Contact 852 2996 6572<br />
Price relative<br />
115<br />
105<br />
95<br />
85<br />
75<br />
65<br />
55<br />
Jun-11<br />
TOD'S<br />
Source: HSBC<br />
Note: price at close <strong>of</strong> 01 Mar 2012<br />
Rel <strong>to</strong> BCI ALL-SHARE INDEX<br />
Dec-11<br />
115<br />
105<br />
95<br />
85<br />
75<br />
65<br />
55<br />
81
Consumer Brands & Retail<br />
Global luxury goods<br />
March 2012<br />
abc<br />
Notes<br />
82
Consumer Brands & Retail<br />
Global luxury goods<br />
March 2012<br />
abc<br />
Notes<br />
83
Consumer Brands & Retail<br />
Global luxury goods<br />
March 2012<br />
abc<br />
Notes<br />
84
Consumer Brands & Retail<br />
Global luxury goods<br />
March 2012<br />
abc<br />
Disclosure appendix<br />
Analyst Certification<br />
The following analyst(s), economist(s), and/or strategist(s) who is(are) primarily responsible for this report, certifies(y) that the<br />
opinion(s) on the subject security(ies) or issuer(s) and/or any other views or forecasts expressed herein accurately reflect their<br />
personal view(s) and that no part <strong>of</strong> their compensation was, is or will be directly or indirectly related <strong>to</strong> the specific<br />
recommendation(s) or views contained in this research report: An<strong>to</strong>ine Belge, Erwan Rambourg and Sophie Dargnies<br />
Important disclosures<br />
S<strong>to</strong>ck ratings and basis for financial analysis<br />
HSBC believes that inves<strong>to</strong>rs utilise various disciplines and investment horizons when making investment decisions, which<br />
depend largely on individual circumstances such as the inves<strong>to</strong>r's existing holdings, risk <strong>to</strong>lerance and other considerations.<br />
Given these differences, HSBC has two principal aims in its equity research: 1) <strong>to</strong> identify long-term investment opportunities<br />
based on particular themes or ideas that may affect the future earnings or cash flows <strong>of</strong> companies on a 12 month time horizon;<br />
and 2) from time <strong>to</strong> time <strong>to</strong> identify short-term investment opportunities that are derived from fundamental, quantitative,<br />
technical or event-driven techniques on a 0-3 month time horizon and which may differ from our long-term investment rating.<br />
HSBC has assigned ratings for its long-term investment opportunities as described below.<br />
This report addresses only the long-term investment opportunities <strong>of</strong> the companies referred <strong>to</strong> in the report. As and when<br />
HSBC publishes a short-term trading idea the s<strong>to</strong>cks <strong>to</strong> which these relate are identified on the website at<br />
www.hsbcnet.com/research. Details <strong>of</strong> these short-term investment opportunities can be found under the Reports section <strong>of</strong> this<br />
website.<br />
HSBC believes an inves<strong>to</strong>r's decision <strong>to</strong> buy or sell a s<strong>to</strong>ck should depend on individual circumstances such as the inves<strong>to</strong>r's<br />
existing holdings and other considerations. Different securities firms use a variety <strong>of</strong> ratings terms as well as different rating<br />
systems <strong>to</strong> describe their recommendations. Inves<strong>to</strong>rs should carefully read the definitions <strong>of</strong> the ratings used in each research<br />
report. In addition, because research reports contain more complete information concerning the analysts' views, inves<strong>to</strong>rs<br />
should carefully read the entire research report and should not infer its contents from the rating. In any case, ratings should not<br />
be used or relied on in isolation as investment advice.<br />
Rating definitions for long-term investment opportunities<br />
S<strong>to</strong>ck ratings<br />
HSBC assigns ratings <strong>to</strong> its s<strong>to</strong>cks in this sec<strong>to</strong>r on the following basis:<br />
For each s<strong>to</strong>ck we set a required rate <strong>of</strong> return calculated from the cost <strong>of</strong> equity for that s<strong>to</strong>ck’s domestic or, as appropriate,<br />
regional market established by our strategy team. The price target for a s<strong>to</strong>ck represents the value the analyst expects the s<strong>to</strong>ck<br />
<strong>to</strong> reach over our performance horizon. The performance horizon is 12 months. For a s<strong>to</strong>ck <strong>to</strong> be classified as Overweight, the<br />
potential return, which equals the percentage difference between the current share price and the target price, including the<br />
forecast dividend yield when indicated, must exceed the required return by at least 5 percentage points over the next 12 months<br />
(or 10 percentage points for a s<strong>to</strong>ck classified as Volatile*). For a s<strong>to</strong>ck <strong>to</strong> be classified as Underweight, the s<strong>to</strong>ck must be<br />
expected <strong>to</strong> underperform its required return by at least 5 percentage points over the next 12 months (or 10 percentage points<br />
for a s<strong>to</strong>ck classified as Volatile*). S<strong>to</strong>cks between these bands are classified as Neutral.<br />
Our ratings are re-calibrated against these bands at the time <strong>of</strong> any 'material change' (initiation <strong>of</strong> coverage, change <strong>of</strong> volatility<br />
status or change in price target). Notwithstanding this, and although ratings are subject <strong>to</strong> ongoing management review,<br />
expected returns will be permitted <strong>to</strong> move outside the bands as a result <strong>of</strong> normal share price fluctuations without necessarily<br />
triggering a rating change.<br />
85
Consumer Brands & Retail<br />
Global luxury goods<br />
March 2012<br />
abc<br />
*A s<strong>to</strong>ck will be classified as volatile if its his<strong>to</strong>rical volatility has exceeded 40%, if the s<strong>to</strong>ck has been listed for less than 12<br />
months (unless it is in an industry or sec<strong>to</strong>r where volatility is low) or if the analyst expects significant volatility. However,<br />
s<strong>to</strong>cks which we do not consider volatile may in fact also behave in such a way. His<strong>to</strong>rical volatility is defined as the past<br />
month's average <strong>of</strong> the daily 365-day moving average volatilities. In order <strong>to</strong> avoid misleadingly frequent changes in rating,<br />
however, volatility has <strong>to</strong> move 2.5 percentage points past the 40% benchmark in either direction for a s<strong>to</strong>ck's status <strong>to</strong> change.<br />
Rating distribution for long-term investment opportunities<br />
As <strong>of</strong> 08 March 2012, the distribution <strong>of</strong> all ratings published is as follows:<br />
Overweight (Buy) 50% (26% <strong>of</strong> these provided with Investment Banking Services)<br />
Neutral (Hold) 36% (24% <strong>of</strong> these provided with Investment Banking Services)<br />
Underweight (Sell) 14% (16% <strong>of</strong> these provided with Investment Banking Services)<br />
Information regarding company share price performance and his<strong>to</strong>ry <strong>of</strong> HSBC ratings and price targets in respect <strong>of</strong> its longterm<br />
investment opportunities for the companies the subject <strong>of</strong> this report,is available from www.hsbcnet.com/research.<br />
HSBC & Analyst disclosures<br />
Disclosure checklist<br />
Company Ticker Recent price Price Date Disclosure<br />
BURBERRY GROUP BRBY.L 14.37 07-Mar-2012 4, 7<br />
CHRISTIAN DIOR DIOR.PA 114.00 07-Mar-2012 6<br />
HENGDELI HOLDINGS LTD 3389.HK 3.48 08-Mar-2012 4<br />
HERMES HRMS.PA 278.00 07-Mar-2012 2,6,7<br />
LUXOTTICA LUX.MI 26.46 07-Mar-2012 7<br />
LVMH LVMH.PA 125.95 07-Mar-2012 1,2,4, 5,6,7,11<br />
PPR PRTP.PA 126.70 07-Mar-2012 2,6,7,11<br />
PRADA SPA 1913.HK 47.25 08-Mar-2012 6,7<br />
RICHEMONT(CIE FIN) CFR.VX 55.10 07-Mar-2012 2,7<br />
SALVATORE FERRAGAMO SFER.MI 14.18 07-Mar-2012 7<br />
SWATCH UHR.VX 408.80 07-Mar-2012 4,6<br />
Source: HSBC<br />
1 HSBC* has managed or co-managed a public <strong>of</strong>fering <strong>of</strong> securities for this company within the past 12 months.<br />
2 HSBC expects <strong>to</strong> receive or intends <strong>to</strong> seek compensation for investment banking services from this company in the next<br />
3 months.<br />
3 At the time <strong>of</strong> publication <strong>of</strong> this report, HSBC Securities (USA) Inc. is a Market Maker in securities issued by this<br />
company.<br />
4 As <strong>of</strong> 31 January 2012 HSBC beneficially owned 1% or more <strong>of</strong> a class <strong>of</strong> common equity securities <strong>of</strong> this company.<br />
5 As <strong>of</strong> 31 January 2012, this company was a client <strong>of</strong> HSBC or had during the preceding 12 month period been a client <strong>of</strong><br />
and/or paid compensation <strong>to</strong> HSBC in respect <strong>of</strong> investment banking services.<br />
6 As <strong>of</strong> 31 January 2012, this company was a client <strong>of</strong> HSBC or had during the preceding 12 month period been a client <strong>of</strong><br />
and/or paid compensation <strong>to</strong> HSBC in respect <strong>of</strong> non-investment banking-securities related services.<br />
7 As <strong>of</strong> 31 January 2012, this company was a client <strong>of</strong> HSBC or had during the preceding 12 month period been a client <strong>of</strong><br />
and/or paid compensation <strong>to</strong> HSBC in respect <strong>of</strong> non-securities services.<br />
8 A covering analyst/s has received compensation from this company in the past 12 months.<br />
9 A covering analyst/s or a member <strong>of</strong> his/her household has a financial interest in the securities <strong>of</strong> this company, as<br />
detailed below.<br />
10 A covering analyst/s or a member <strong>of</strong> his/her household is an <strong>of</strong>ficer, direc<strong>to</strong>r or supervisory board member <strong>of</strong> this<br />
company, as detailed below.<br />
11 At the time <strong>of</strong> publication <strong>of</strong> this report, HSBC is a non-US Market Maker in securities issued by this company and/or in<br />
securities in respect <strong>of</strong> this company<br />
Analysts, economists, and strategists are paid in part by reference <strong>to</strong> the pr<strong>of</strong>itability <strong>of</strong> HSBC which includes investment<br />
banking revenues.<br />
86
Consumer Brands & Retail<br />
Global luxury goods<br />
March 2012<br />
abc<br />
For disclosures in respect <strong>of</strong> any company mentioned in this report, please see the most recently published report on that<br />
company available at www.hsbcnet.com/research.<br />
* HSBC Legal Entities are listed in the Disclaimer below.<br />
Additional disclosures<br />
1 This report is dated as at 08 March 2012.<br />
2 All market data included in this report are dated as at close 01 March 2012, unless otherwise indicated in the report.<br />
3 HSBC has procedures in place <strong>to</strong> identify and manage any potential conflicts <strong>of</strong> interest that arise in connection with its<br />
Research business. HSBC's analysts and its other staff who are involved in the preparation and dissemination <strong>of</strong> Research<br />
operate and have a management reporting line independent <strong>of</strong> HSBC's Investment Banking business. Information Barrier<br />
procedures are in place between the Investment Banking and Research businesses <strong>to</strong> ensure that any confidential and/or<br />
price sensitive information is handled in an appropriate manner.<br />
4 As <strong>of</strong> 31 January 2012, HSBC and/or its affiliates (including the funds, portfolios and investment clubs in securities<br />
managed by such entities) either, directly or indirectly, own or are involved in the acquisition, sale or intermediation <strong>of</strong>,<br />
1% or more <strong>of</strong> the <strong>to</strong>tal capital <strong>of</strong> the subject companies securities in the market for the following Company(ies):<br />
BURBERRY GROUP, HENGDELI HOLDINGS LTD, LVMH, SWATCH<br />
87
Consumer Brands & Retail<br />
Global luxury goods<br />
March 2012<br />
abc<br />
Disclaimer<br />
* Legal entities as at 04 March 2011<br />
‘UAE’ HSBC Bank Middle East Limited, Dubai; ‘HK’ The Hongkong and Shanghai Banking Corporation Limited,<br />
Hong Kong; ‘TW’ HSBC Securities (Taiwan) Corporation Limited; ‘CA’ HSBC Securities (Canada) Inc, Toron<strong>to</strong>;<br />
HSBC Bank, Paris Branch; HSBC France; ‘DE’ HSBC Trinkaus & Burkhardt AG, Düsseldorf; 000 HSBC Bank<br />
(RR), Moscow; ‘IN’ HSBC Securities and Capital Markets (India) Private Limited, Mumbai; ‘JP’ HSBC Securities<br />
(Japan) Limited, Tokyo; ‘EG’ HSBC Securities Egypt SAE, Cairo; ‘CN’ HSBC Investment Bank Asia Limited,<br />
Beijing Representative Office; The Hongkong and Shanghai Banking Corporation Limited, Singapore Branch; The<br />
Hongkong and Shanghai Banking Corporation Limited, Seoul Securities Branch; The Hongkong and Shanghai<br />
Banking Corporation Limited, Seoul Branch; HSBC Securities (South Africa) (Pty) Ltd, Johannesburg; ‘GR’ HSBC<br />
Securities SA, Athens; HSBC Bank plc, London, Madrid, Milan, S<strong>to</strong>ckholm, Tel Aviv; ‘US’ HSBC Securities (USA)<br />
Inc, New York; HSBC Yatirim Menkul Degerler AS, Istanbul; HSBC México, SA, Institución de Banca Múltiple,<br />
Grupo Financiero HSBC; HSBC Bank Brasil SA – Banco Múltiplo; HSBC Bank Australia Limited; HSBC Bank<br />
Argentina SA; HSBC Saudi Arabia Limited; The Hongkong and Shanghai Banking Corporation Limited, New<br />
Zealand Branch<br />
Issuer <strong>of</strong> report<br />
HSBC Bank plc, Paris branch<br />
15, rue Vernet<br />
75419 Paris Cedex 08, France<br />
Téléphone: +33 1 40 70 70 40<br />
Fax: +33 1 58 13 96 48<br />
Website: www.research.hsbc.com<br />
This document has been issued by HSBC Bank plc, Paris branch (»HSBC») for the information <strong>of</strong> its cus<strong>to</strong>mers only.<br />
This document is not and should not be construed as an <strong>of</strong>fer <strong>to</strong> sell or the solicitation <strong>of</strong> an <strong>of</strong>fer <strong>to</strong> purchase or subscribe for any investment. HSBC has based this<br />
document on information obtained from sources it believes <strong>to</strong> be reliable but which it has not independently verified; HSBC makes no guarantee, representation or<br />
warranty and accepts no responsibility or liability as <strong>to</strong> its accuracy or completeness. Expressions <strong>of</strong> opinion are those <strong>of</strong> the Research Department <strong>of</strong> HSBC only and are<br />
subject <strong>to</strong> change without notice. HSBC and its affiliates and/or their <strong>of</strong>ficers, direc<strong>to</strong>rs and employees may have positions in any securities mentioned in this document<br />
(or in any related investment) and may from time <strong>to</strong> time add <strong>to</strong> or dispose <strong>of</strong> any such securities (or investment). HSBC and its affiliates may act as market maker or<br />
have assumed an underwriting commitment in the securities <strong>of</strong> companies discussed in this document (or in related investments), may sell them <strong>to</strong> or buy them from<br />
cus<strong>to</strong>mers on a principal basis and may also perform or seek <strong>to</strong> perform investment banking or underwriting services for or relating <strong>to</strong> those companies and may also be<br />
accounted for in the supervisory board or any other committee <strong>of</strong> those companies. The information and opinions contained within the research reports are based upon<br />
rates <strong>of</strong> taxation applicable at the time <strong>of</strong> publication but which are subject <strong>to</strong> change from time <strong>to</strong> time. Past performance is not necessarily a guide <strong>to</strong> future<br />
performance. The value <strong>of</strong> any investment or income may go down as well as up and you may not get back the full amount invested. Where an investment is<br />
denominated in a currency other than the local currency <strong>of</strong> the recipient <strong>of</strong> the research report, changes in the exchange rates may have an adverse effect on the value,<br />
price or income <strong>of</strong> that investment. In case <strong>of</strong> investments for which there is no recognised market it may be difficult for inves<strong>to</strong>rs <strong>to</strong> sell their investments or <strong>to</strong> obtain<br />
reliable information about its value or the extent <strong>of</strong> the risk <strong>to</strong> which it is exposed.<br />
HSBC Securities (USA) Inc. accepts responsibility for the content <strong>of</strong> this research report prepared by its non-US foreign affiliate. All U.S. persons receiving and/or<br />
accessing this report and wishing <strong>to</strong> effect transactions in any security discussed herein should do so with HSBC Securities (USA) Inc. in the United States and not with<br />
its non-US foreign affiliate, the issuer <strong>of</strong> this report.<br />
In the UK this document is for the information <strong>of</strong> its Clients (as defined in the Rules <strong>of</strong> FSA) and those <strong>of</strong> its affiliates only. It is not intended for Retail Clients in the<br />
UK. If this research is received by a cus<strong>to</strong>mer <strong>of</strong> an affiliate <strong>of</strong> HSBC, its provision <strong>to</strong> the recipient is subject <strong>to</strong> the terms <strong>of</strong> business in place between the recipient and<br />
such affiliate. The protections afforded by the UK regula<strong>to</strong>ry regime are available only <strong>to</strong> those dealing with a representative <strong>of</strong> HSBC Bank plc in the UK. In Singapore,<br />
this publication is distributed by The Hongkong and Shanghai Banking Corporation Limited, Singapore Branch for the general information <strong>of</strong> institutional inves<strong>to</strong>rs or<br />
other persons specified in Sections 274 and 304 <strong>of</strong> the Securities and Futures Act (Chapter 289) (“SFA”) and accredited inves<strong>to</strong>rs and other persons in accordance with<br />
the conditions specified in Sections 275 and 305 <strong>of</strong> the SFA. This publication is not a prospectus as defined in the SFA. It may not be further distributed in whole or in<br />
part for any purpose. The Hongkong and Shanghai Banking Corporation Limited Singapore Branch is regulated by the Monetary Authority <strong>of</strong> Singapore. Recipients in<br />
Singapore should contact a "Hongkong and Shanghai Banking Corporation Limited, Singapore Branch" representative in respect <strong>of</strong> any matters arising from, or in<br />
connection with this report.<br />
In Australia, this publication has been distributed by The Hongkong and Shanghai Banking Corporation Limited (ABN 65 117 925 970, AFSL 301737) for the general<br />
information <strong>of</strong> its “wholesale” cus<strong>to</strong>mers (as defined in the Corporations Act 2001). Where distributed <strong>to</strong> retail cus<strong>to</strong>mers, this research is distributed by HSBC Bank<br />
Australia Limited (AFSL No. 232595). These respective entities make no representations that the products or services mentioned in this document are available <strong>to</strong><br />
persons in Australia or are necessarily suitable for any particular person or appropriate in accordance with local law. No consideration has been given <strong>to</strong> the particular<br />
investment objectives, financial situation or particular needs <strong>of</strong> any recipient. This publication is distributed in New Zealand by The Hongkong and Shanghai Banking<br />
Corporation Limited, New Zealand Branch.<br />
In Japan, this publication has been distributed by HSBC Securities (Japan) Limited. In Hong Kong, this document has been distributed by The Hongkong and Shanghai<br />
Banking Corporation Limited in the conduct <strong>of</strong> its Hong Kong regulated business for the information <strong>of</strong> its institutional and pr<strong>of</strong>essional cus<strong>to</strong>mers; it is not intended for<br />
and should not be distributed <strong>to</strong> retail cus<strong>to</strong>mers in Hong Kong. The Hongkong and Shanghai Banking Corporation Limited makes no representations that the products or<br />
services mentioned in this document are available <strong>to</strong> persons in Hong Kong or are necessarily suitable for any particular person or appropriate in accordance with local<br />
law. All inquiries by such recipients must be directed <strong>to</strong> The Hongkong and Shanghai Banking Corporation Limited. It may not be further distributed in whole or in part<br />
for any purpose. In Korea, this publication is distributed by The Hongkong and Shanghai Banking Corporation Limited, Seoul Securities Branch ("HBAP SLS") for the<br />
general information <strong>of</strong> pr<strong>of</strong>essional inves<strong>to</strong>rs specified in Article 9 <strong>of</strong> the Financial Investment Services and Capital Markets Act (“FSCMA”). This publication is not a<br />
prospectus as defined in the FSCMA. It may not be further distributed in whole or in part for any purpose. HBAP SLS is regulated by the Financial Services Commission<br />
and the Financial Supervisory Service <strong>of</strong> Korea. HSBC Bank plc, Paris branch is authorised by the Comité des établissements de crédit et des entreprises d'investissement<br />
and regulated by the <strong>French</strong> Banking Commission and the Au<strong>to</strong>rité des marchés financiers. (231105)<br />
© Copyright. HSBC Bank plc, Paris branch 2012, ALL RIGHTS RESERVED. No part <strong>of</strong> this publication may be reproduced, s<strong>to</strong>red in a retrieval system, or transmitted,<br />
on any form or by any means, electronic, mechanical, pho<strong>to</strong>copying, recording, or otherwise, without the prior written permission <strong>of</strong> HSBC Bank plc, Paris branch.<br />
MICA (P) 208/04/2011 and MICA (P) 040/04/2011<br />
[323009]<br />
88
An<strong>to</strong>ine Belge*<br />
Analyst<br />
HSBC Bank plc, Paris Branch<br />
+33 1 5652 4347<br />
an<strong>to</strong>ine.belge@hsbc.com<br />
An<strong>to</strong>ine Belge is Head <strong>of</strong> Consumer Brands and Retail Equity Research and is a <strong>to</strong>p ranked analyst covering the luxury, sporting goods<br />
and spirits sec<strong>to</strong>rs. He has been an analyst since 1998 and joined HSBC in 2003. Prior <strong>to</strong> this, he worked for seven years in the industry<br />
as a Finance Controller for Christian Dior and Chanel.<br />
Erwan Rambourg*<br />
Analyst<br />
The Hongkong and Shanghai Banking Corporation Limited<br />
+852 2996 6572<br />
erwanrambourg@hsbc.com.hk<br />
Erwan Rambourg is Head <strong>of</strong> Consumer Brands and Retail Equity Research and is a <strong>to</strong>p ranked analyst covering the luxury, sporting<br />
goods and spirits sec<strong>to</strong>rs. He joined HSBC in January 2005 and in 2011 relocated from London <strong>to</strong> Hong Kong as many s<strong>to</strong>cks under<br />
coverage are now Asia-driven. Before moving <strong>to</strong> HSBC, Erwan worked for eight years as Marketing Manager in the luxury industry,<br />
notably for Richemont and LVMH.<br />
Sophie Dargnies*<br />
Analyst<br />
HSBC Bank plc, Paris Branch<br />
+33 1 5652 4348<br />
sophie.dargnies@hsbc.com<br />
Sophie is an equity analyst covering the luxury, sporting goods and spirits sec<strong>to</strong>rs. She joined the Luxury and Sporting Goods team<br />
at HSBC in May 2008. Before joining HSBC, Sophie worked as a consultant for three years. She is a graduate <strong>of</strong> EDHEC Business School.<br />
*Employed by a non-US affiliate <strong>of</strong> HSBC Securities (USA) Inc, and is not registered/qualified pursuant <strong>to</strong> FINRA regulations.