US M&A News and Trends - Compliance Week
US M&A News and Trends - Compliance Week
US M&A News and Trends - Compliance Week

Create successful ePaper yourself
Turn your PDF publications into a flip-book with our unique Google optimized e-Paper software.
2 <strong>US</strong> Merger<br />
Metrics<br />
2 <strong>US</strong> Middle<br />
Market Monitor<br />
3 <strong>US</strong> Industry<br />
Activity & Value<br />
4 Global Industry<br />
Spotlight<br />
5 <strong>US</strong> Strategic<br />
Buyer Report<br />
5 <strong>US</strong> Private<br />
Equity Report<br />
6 Top <strong>US</strong> Advisors<br />
7 Top <strong>US</strong> Deals<br />
Scoreboard<br />
March 2011<br />
MERGERSTAT Monthly Review<br />
<strong>US</strong> M&A <strong>News</strong> <strong>and</strong> <strong>Trends</strong><br />
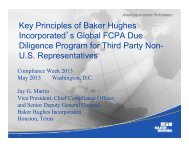
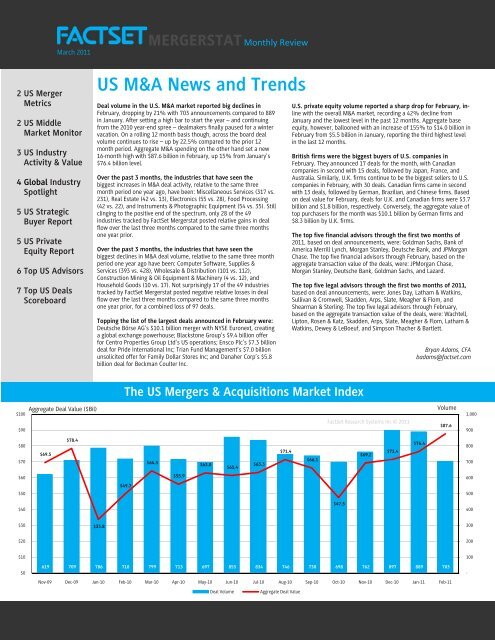
Deal volume in the U.S. M&A market reported big declines in<br />
February, dropping by 21% with 703 announcements compared to 889<br />
in January. After setting a high bar to start the year – <strong>and</strong> continuing<br />
from the 2010 year-end spree – dealmakers finally paused for a winter<br />
vacation. On a rolling 12 month basis though, across the board deal<br />
volume continues to rise – up by 22.5% compared to the prior 12<br />
month period. Aggregate M&A spending on the other h<strong>and</strong> set a new<br />
16-month high with $87.6 billion in February, up 15% from January’s<br />
$76.4 billion level.<br />
Over the past 3 months, the industries that have seen the<br />
biggest increases in M&A deal activity, relative to the same three<br />
month period one year ago, have been: Miscellaneous Services (317 vs.<br />
231), Real Estate (42 vs. 13), Electronics (55 vs. 28), Food Processing<br />
(42 vs. 22), <strong>and</strong> Instruments & Photographic Equipment (54 vs. 35). Still<br />
clinging to the positive end of the spectrum, only 28 of the 49<br />
industries tracked by FactSet Mergerstat posted relative gains in deal<br />
flow over the last three months compared to the same three months<br />
one year prior.<br />
Over the past 3 months, the industries that have seen the<br />
biggest declines in M&A deal volume, relative to the same three month<br />
period one year ago have been: Computer Software, Supplies &<br />
Services (393 vs. 428), Wholesale & Distribution (101 vs. 112),<br />
Construction Mining & Oil Equipment & Machinery (4 vs. 12), <strong>and</strong><br />
Household Goods (10 vs. 17). Not surprisingly 17 of the 49 industries<br />
tracked by FactSet Mergerstat posted negative relative losses in deal<br />
flow over the last three months compared to the same three months<br />
one year prior, for a combined loss of 97 deals.<br />
Topping the list of the largest deals announced in February were:<br />
Deutsche Börse AG’s $10.1 billion merger with NYSE Euronext, creating<br />
a global exchange powerhouse; Blackstone Group’s $9.4 billion offer<br />
for Centro Properties Group Ltd’s <strong>US</strong> operations; Ensco Plc’s $7.3 billion<br />
deal for Pride International Inc; Trian Fund Management’s $7.0 billion<br />
unsolicited offer for Family Dollar Stores Inc; <strong>and</strong> Danaher Corp’s $5.8<br />
billion deal for Beckman Coulter Inc.<br />
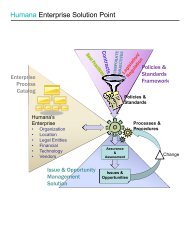
U.S. private equity volume reported a sharp drop for February, inline<br />
with the overall M&A market, recording a 42% decline from<br />
January <strong>and</strong> the lowest level in the past 12 months. Aggregate base<br />
equity, however, ballooned with an increase of 155% to $14.0 billion in<br />
February from $5.5 billion in January, reporting the third highest level<br />
in the last 12 months.<br />
British firms were the biggest buyers of U.S. companies in<br />
February. They announced 17 deals for the month, with Canadian<br />
companies in second with 15 deals, followed by Japan, France, <strong>and</strong><br />
Australia. Similarly, U.K. firms continue to be the biggest sellers to U.S.<br />
companies in February, with 30 deals. Canadian firms came in second<br />
with 13 deals, followed by German, Brazilian, <strong>and</strong> Chinese firms. Based<br />
on deal value for February, deals for U.K. <strong>and</strong> Canadian firms were $3.7<br />
billion <strong>and</strong> $1.8 billion, respectively. Conversely, the aggregate value of<br />
top purchasers for the month was $10.1 billion by German firms <strong>and</strong><br />
$8.3 billion by U.K. firms.<br />
The top five financial advisors through the first two months of<br />
2011, based on deal announcements, were: Goldman Sachs, Bank of<br />
America Merrill Lynch, Morgan Stanley, Deutsche Bank, <strong>and</strong> JPMorgan<br />
Chase. The top five financial advisors through February, based on the<br />
aggregate transaction value of the deals, were: JPMorgan Chase,<br />
Morgan Stanley, Deutsche Bank, Goldman Sachs, <strong>and</strong> Lazard.<br />
The top five legal advisors through the first two months of 2011,<br />
based on deal announcements, were: Jones Day, Latham & Watkins,<br />
Sullivan & Cromwell, Skadden, Arps, Slate, Meagher & Flom, <strong>and</strong><br />
Shearman & Sterling. The top five legal advisors through February,<br />
based on the aggregate transaction value of the deals, were: Wachtell,<br />
Lipton, Rosen & Katz, Skadden, Arps, Slate, Meagher & Flom, Latham &<br />
Watkins, Dewey & LeBoeuf, <strong>and</strong> Simpson Thacher & Bartlett.<br />
Bryan Adams, CFA<br />
badams@factset.com<br />
The <strong>US</strong> Mergers & Acquisitions Market Index<br />
$100<br />
$90<br />
Aggregate Deal Value ($Bil)<br />
FactSet Research Systems Inc © 2011<br />
Volume<br />
$87.6<br />
1,000<br />
900<br />
$80<br />
$70<br />
$69.5<br />
$78.4<br />
$64.3<br />
$63.0<br />
$61.4<br />
$63.3<br />
$71.4<br />
$66.1<br />
$69.2<br />
$71.4<br />
$76.4<br />
800<br />
700<br />
$60<br />
$55.9<br />
600<br />
$49.7<br />
$50<br />
500<br />
$40<br />
$47.5<br />
400<br />
$30<br />
$33.8<br />
300<br />
$20<br />
200<br />
$10<br />
$0<br />
619 709 786 718 799 713 697 855 834 746 738 698 762 897 889 703<br />
Nov-09 Dec-09 Jan-10 Feb-10 Mar-10 Apr-10 May-10 Jun-10 Jul-10 Aug-10 Sep-10 Oct-10 Nov-10 Dec-10 Jan-11 Feb-11<br />
Deal Volume<br />
Aggregate Deal Value<br />
100<br />
-
<strong>US</strong> MergerMetrics .<br />
Merger Stats<br />
Number of Deals<br />
Agg. Base Equity ($Bil)<br />
12 Months Ended 12 Months Ended Average<br />
Deal Size 02/28/11 02/28/10 Change 02/28/11 02/28/10 Change<br />
P/E<br />
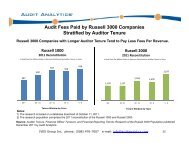
$1 Billion + 172 91 89.0% $511.1 $385.3 32.6% 28.6<br />
$500M to $999.9M 151 72 109.7% 108.2 47.8 126.4% 28.9<br />
$250M to $499.9M 206 130 58.5% 70.6 46.8 50.9% 23.2<br />
$100M to $249.9M 381 247 54.3% 60.9 38.8 57.0% 23.7<br />
$50M to $99.9M 348 225 54.7% 24.7 15.5 59.4% 27.1<br />
$25M to $49.9M 342 285 20.0% 12.2 10.1 20.8% 13.6<br />
$10M to $24.9M 429 416 3.1% 6.9 6.7 3.0% 20.7<br />
Under $10M 888 1,072 -17.2% 2.9 3.3 -12.1% 18.0<br />
Undisclosed 6,414 5,081 26.2% N/A N/A N/A N/A<br />
Total 9,331 7,619 22.5% $797.5 $554.3 43.9% 24.6<br />
M&A at a Glance<br />
Average P/E<br />
Average Premium<br />
30.0x<br />
90.0%<br />
25.0x<br />
20.0x<br />
24.4x<br />
26.6x<br />
80.0%<br />
70.0%<br />
60.0%<br />
85.1%<br />
15.0x<br />
10.0x<br />
5.0x<br />
15.2x<br />
50.0%<br />
40.0%<br />
30.0%<br />
20.0%<br />
10.0%<br />
38.3%<br />
32.9%<br />
0.0x<br />
0.0%<br />
1q09 2q09 3q09 4q09 1q10 2q10 3q10 4q10 L3M<br />
1q09 2q09 3q09 4q09 1q10 2q10 3q10 4q10 L3M<br />
<strong>US</strong> Middle Market Monitor .<br />
Average EV/EBITDA<br />
Average Premium<br />
12.0x<br />
100.0%<br />
10.0x<br />
8.0x<br />
6.0x<br />
7.3x<br />
9.8x<br />
8.8x<br />
90.0%<br />
80.0%<br />
70.0%<br />
60.0%<br />
50.0%<br />
89.3%<br />
4.0x<br />
40.0%<br />
30.0%<br />
41.4%<br />
38.7%<br />
2.0x<br />
20.0%<br />
10.0%<br />
0.0x<br />
0.0%<br />
1q09 2q09 3q09 4q09 1q10 2q10 3q10 4q10 L3M<br />
1q09 2q09 3q09 4q09 1q10 2q10 3q10 4q10 L3M<br />
* Middle Market defined as deals valued between $1 million <strong>and</strong> $500 million, plus undisclosed deals.<br />
FactSet Flashwire <strong>US</strong> Monthly Staff: VP, Director-Bryan Adams, CFA (badams@factset.com); Research Manager-Kenneth Woo (kwoo@factset.com).<br />
Subscription: Contact Business Valuation Resources at (888) 287-8258. Media: Media quotation with source attribution is encouraged. Reporters requesting<br />
additional information or editorial comment should contact Kenneth Woo at (650) 287-4824. Mergerstat gathers its data from sources it considers reliable;<br />
however, it does not guarantee the accuracy or completeness of the information provided in this publication. Copyright 2011 FactSet Research Systems Inc.<br />
All rights reserved. It is illegal under federal copyright law to reproduce or redistribute this publication or any portion of its contents without written<br />
authorization of the publisher.<br />
www.factset.com March 2011 Copyright © 2011 FactSet Research Systems Inc. All rights reserved. 2
<strong>US</strong> Industry Activity & Value Comparisons .<br />
Industry by Activity<br />
Industry by Value<br />
Target Industry<br />
L3M 02/28/11<br />
Deal Count<br />
L3M 02/28/10<br />
Deal Count<br />
Diff<br />
($Mil)<br />
Target Industry<br />
L3M 02/28/11<br />
Value<br />
L3M 02/28/10<br />
Value<br />
Diff<br />
Miscellaneous Services 317 231 86 Brokerage, Investment & Mgmt. Consult $33,750.4 $17,427.7 $16,322.7<br />
Real Estate 42 13 29 Banking & Finance 15,887.5 1,350.6 14,536.9<br />
Electronics 55 28 27 Electric, Gas Water & Sanitary Services 17,464.6 7,450.2 10,014.4<br />
Food Processing 42 22 20 Real Estate 9,949.0 137.0 9,812.0<br />
Instruments & Photographic Equipment 54 35 19 Health Services 9,439.1 783.3 8,655.8<br />
Brokerage, Investment & Mgmt. Consult 176 158 18 Mining & Minerals 13,034.6 5,067.8 7,966.8<br />
Insurance 94 76 18 Retail 12,071.9 5,253.7 6,818.2<br />
Energy Services 32 15 17 Transportation 5,550.1 202.3 5,347.8<br />
Electrical Equipment 44 29 15 Computer Software, Supplies & Services 10,645.5 6,038.2 4,607.3<br />
Chemicals, Paints & Coatings 42 28 14 Agricultural Production 5,164.8 561.7 4,603.1<br />
Health Services 105 92 13 Wholesale & Distribution 5,993.9 1,391.1 4,602.8<br />
Transportation 35 22 13 Electronics 5,815.0 1,260.6 4,554.4<br />
Plastics & Rubber 24 13 11 Packaging & Containers 3,926.5 0.0 3,926.5<br />
Industrial & Farm Equip & Machinery 49 40 9 Instruments & Photographic Equipment 11,234.3 7,394.0 3,840.3<br />
Construction Contractors & Eng. Svcs. 94 86 8 Communications 4,024.0 443.7 3,580.3<br />
Aerospace, Aircraft & Defense 14 7 7 Valves, Pumps & Hydraulics 3,542.5 25.6 3,516.9<br />
Banking & Finance 93 86 7 Oil & Gas 4,150.2 804.1 3,346.1<br />
Packaging & Containers 8 1 7 Construction Contractors & Eng. Svcs. 3,357.4 962.7 2,394.7<br />
Agricultural Production 19 14 5 Chemicals, Paints & Coatings 3,239.3 1,500.7 1,738.6<br />
Electric, Gas Water & Sanitary Services 50 45 5 Food Processing 6,635.0 4,900.8 1,734.2<br />
Fabricated Metal Products 24 19 5 Electrical Equipment 3,264.0 1,660.8 1,603.2<br />
Leisure & Entertainment 63 58 5 Miscellaneous Services 5,455.2 4,255.3 1,199.9<br />
Valves, Pumps & Hydraulics 8 3 5 Plastics & Rubber 728.1 135.2 592.9<br />
Beverages 14 11 3 Printing & Publishing 953.9 529.1 424.8<br />
Drugs, Medical Supplies & Equipment 73 70 3 Aerospace, Aircraft & Defense 283.9 18.1 265.8<br />
Printing & Publishing 32 29 3 Apparel 269.2 77.8 191.4<br />
Furniture 2 0 2 Household Goods 534.4 433.6 100.8<br />
Toiletries & Cosmetics 5 4 1 Automotive Products & Accessories 384.4 299.3 85.1<br />
Miscellaneous Manufacturing 13 13 0 Furniture 16.0 0.0 16.0<br />
Paper 9 9 0 Paper 34.4 18.5 15.9<br />
Stone, Clay & Glass 8 8 0 Textiles 0.0 0.0 0.0<br />
Timber & Forest Products 5 5 0 Timber & Forest Products 0.0 0.0 0.0<br />
Apparel 16 17 (1) Industrial & Farm Equip & Machinery 786.0 809.4 (23.4)<br />
Textiles 4 5 (1) Stone, Clay & Glass 6.8 235.4 (228.6)<br />
Toys & Recreational Products 9 10 (1) Fabricated Metal Products 254.6 513.1 (258.5)<br />
Automotive Products & Accessories 10 12 (2) Autos & Trucks 0.0 284.6 (284.6)<br />
Broadcasting 12 14 (2) Office Equipment & Computer Hardware 1,159.2 1,511.5 (352.3)<br />
Building Products 2 4 (2) Building Products 17.9 474.5 (456.6)<br />
Retail 68 70 (2) Toys & Recreational Products 103.4 570.0 (466.6)<br />
Oil & Gas 17 20 (3) Miscellaneous Manufacturing 55.1 632.3 (577.2)<br />
Primary Metal Processing 19 22 (3) Toiletries & Cosmetics 9.5 588.5 (579.0)<br />
Communications 32 36 (4) Primary Metal Processing 18.4 708.9 (690.5)<br />
Office Equipment & Computer Hardware 8 12 (4) Insurance 2,198.8 3,284.0 (1,085.2)<br />
Mining & Minerals 23 28 (5) Leisure & Entertainment 1,256.8 2,526.8 (1,270.0)<br />
Autos & Trucks 1 7 (6) Drugs, Medical Supplies & Equipment 6,848.1 8,464.3 (1,616.2)<br />
Household Goods 10 17 (7) Construct Mining & Oil Equip & Mach. 11.5 1,649.9 (1,638.4)<br />
Construct Mining & Oil Equip & Mach. 4 12 (8) Beverages 336.8 4,246.1 (3,909.3)<br />
Wholesale & Distribution 101 112 (11) Broadcasting 2,858.5 12,443.1 (9,584.6)<br />
Computer Software, Supplies & Services 393 428 (35) Energy Services 7,769.6 41,721.1 (33,951.5)<br />
Total 2,374 2,096 278 Total $220,490.1 $151,047.0 $69,443.1<br />
www.factset.com March 2011 Copyright © 2011 FactSet Research Systems Inc. All rights reserved. 3
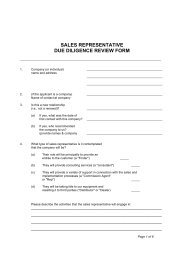
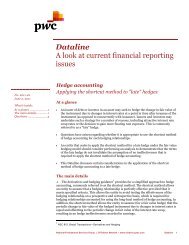
Industry Spotlight: Retail .<br />
It appears as though the holiday shopping has continued past the traditional “Black Friday”<br />
<strong>and</strong> post-holiday sales for the Retail sector in the M&A markets. With particular interest led<br />
by Private Equity buyers, activity resurfaced late in 2010 <strong>and</strong> has continued into 2011. A<br />
combination between companies having improved their balance sheets <strong>and</strong> posting stronger<br />
sales <strong>and</strong> Private Equity buyers sitting on hoards of cash has led the resurgence. So while<br />
signs indicate that financial buyers believe the retailers have reached the bottom of the cycle,<br />
can this resurgence continue?<br />
Symbolically, within the Retail business, when bargains can be found, shoppers will line up<br />
for the sales. In this instance, the Private Equity firms became the buyers, <strong>and</strong> consumer<br />
br<strong>and</strong> staples have become the feature item. Setting the pace was the acquisition of The<br />
Gymboree Corp by Bain Capital LLC for $1.8 billion, announced in October 2010. The<br />
following month saw the acquisition by TPG Capital LP <strong>and</strong> LGP Management Inc of J Crew<br />
Group Inc for $2.8 billion, <strong>and</strong> subsequently in December, the acquisition by Leonard Green<br />
& Partners LP of Jo-Ann Stores Inc for $1.6 billion.<br />
Trickling into 2011, February’s unsolicited offer by Trian Fund Management LP to acquire<br />
the remaining 92.1% stake in Family Dollar Stores Inc for $6.9 billion reinforces the<br />
sector’s attractiveness to Private Equity buyers. The transaction ranks as the second largest<br />
buy-out in 2011, which also holds hope the activity in this sector points to a rebound in the<br />
economy, as retail expenditures directly aligns with consumer discretionary spending.<br />
Providing support for future activity, buyers will look for a continued rebound in consumer<br />
spending through the rest of 2011, opportunities within the global marketplace, <strong>and</strong><br />
continued attractive valuations.<br />
As with the Retail industry, sellers can’t just focus on a singular demographic for sales. Not to<br />
be outdone by their Private Equity counterparts, strategic buyers have plunged into the<br />
acquisition spree as well. In February alone, DSW Inc announced the pending acquisition of<br />
Retail Ventures Inc for $780 million, shortly followed by Nordstrom Inc’s acquisition of<br />
HauteLook Inc for $270 million.<br />
With the recent upsurge in activity, rumors of other deals in the pipeline are of<br />
plenty. One such rumor is the sale of BJ’s Wholesale Club Inc, which the<br />
company also announced that it hired Morgan Stanley to explore a possible sale.<br />
Leonard Green & Partners LP was mentioned as a possible suitor <strong>and</strong> may partake<br />
in a purchase should the company go to auction. Another c<strong>and</strong>idate, teenage<br />
apparel retailer dELiA’s has also been rumored to have put itself on the auction<br />
block, soliciting interest from strategic buyers as well as Private Equity firms.<br />
Although the headlines have been filled with fashionable names in recent<br />
transactions, 2010 figures compiled by FactSet Mergerstat LLC indicate the<br />
sector’s appeal to the marketplace may indeed be en vogue to all buyers. In 2010,<br />
the Retail sector increased activity by 30%, with 360 announced transactions,<br />
compared with the 276 transactions from the year prior. The overall value in the<br />
marketplace spiked to $31.6 billion in 2010, up substantially from $7.5 billion in<br />
2009. Looking deeper into the statistics within the industry, we see that deal<br />
multiples have stayed relatively consistent despite the upsurge, suggesting that<br />
valuations are still attractive. EBITDA multiples in 2009 averaged 10.6 times, while<br />
2010 figures were 10.59 times. Retailer shops also sold for a revenue multiple of 1<br />
times sales in 2009, climbing moderately higher in 2010 to 1.18 times. Lastly,<br />
despite a rising stock market, 5 day premium multiples decreased 29.1% in 2010<br />
to 21.5%, down from 30.31% in 2009, suggesting bargains are still to be found.<br />
So while retail sales figures have increased – culminating from a renewed vigor in<br />
consumer spending – deal multiples have remained largely in check, making this<br />
industry particular attractive. As Private Equity firms continue shopping for retail<br />
bargains, strategic buyers aren’t sitting idle either. With consumers slowly<br />
returning to the marketplace, it may be the PE firms <strong>and</strong> strategic shoppers doing<br />
most of the buying.<br />
Kenneth Woo<br />
kwoo@factset.com<br />
$9,000<br />
$8,000<br />
$7,000<br />
$6,000<br />
$5,000<br />
$4,000<br />
$3,000<br />
$2,000<br />
$1,000<br />
$0<br />
Retail Activity <strong>and</strong> Value: Last 15 Months<br />
Aggregate Deal Value ($Mil)<br />
Volume<br />
FactSet Research Systems Inc © 2011<br />
$8,355.9<br />
45<br />
44<br />
36<br />
33<br />
31 31<br />
32<br />
26 $3,542.8<br />
26<br />
$3,672.0<br />
25<br />
25<br />
$3,221.6<br />
23<br />
$2,873.1<br />
$2,633.2 21<br />
23<br />
$2,271.7<br />
17<br />
$1,573.9<br />
$1,231.3<br />
$994.8<br />
$747.8<br />
$1,851.4<br />
$9.4<br />
$112.4<br />
$192.6<br />
Dec-09 Jan-10 Feb-10 Mar-10 Apr-10 May-10 Jun-10 Jul-10 Aug-10 Sep-10 Oct-10 Nov-10 Dec-10 Jan-11 Feb-11<br />
50<br />
45<br />
40<br />
35<br />
30<br />
25<br />
20<br />
15<br />
10<br />
5<br />
-<br />
Top Advisors: LTM Ending 02/28/11<br />
Transaction<br />
Transaction<br />
Financial Advisor<br />
Value ($Mil) Volume Legal Advisor<br />
Value ($Mil) Volume<br />
Morgan Stanley $14,638.0 10 Cleary Gottlieb Steen & Hamilton LLP $7,816.4 2<br />
Goldman Sachs & Co. 6,332.1 8 Skadden, Arps, Slate, Meagher & Flom LLP 4,788.1 4<br />
JPMorgan Chase & Co., Inc. 5,905.1 6 Vinson & Elkins LLP 3,664.9 2<br />
Barclays 3,974.5 3 Baker Botts LLP 3,364.9 1<br />
Deutsche Bank 3,390.3 5 Dechert LLP 2,550.0 2<br />
Robert W. Baird 3,364.9 3 Paul, Weiss, Rifkind, Wharton & Garrison LLP 2,371.7 2<br />
Tudor Pickering Holt & Co. LLC 3,364.9 1 Latham & Watkins LLP 2,152.8 4<br />
Bank of America Merrill Lynch 2,502.8 5 Wachtell, Lipton, Rosen & Katz 1,966.1 2<br />
Rothschild 2,166.3 3 Weil, Gotshal & Manges LLP 1,913.8 4<br />
Lazard 2,102.1 3 Gibson, Dunn & Crutcher LLP 1,872.8 4<br />
www.factset.com March 2011 Copyright © 2011 FactSet Research Systems Inc. All rights reserved. 4
<strong>US</strong> Strategic Buyer Report .<br />
Merger Stats<br />
Number of Deals<br />
Agg. Base Equity ($Bil)<br />
12 Months Ended 12 Months Ended Average<br />
Deal Size 02/28/11 02/28/10 Change 02/28/11 02/28/10 Change<br />
P/E<br />
$1 Billion + 96 54 77.8% $286.1 $265.9 7.6% 30.6<br />
$500M to $999.9M 98 47 108.5% 69.1 31.4 120.1% 31.5<br />
$250M to $499.9M 132 75 76.0% 44.6 26.9 65.8% 24.0<br />
$100M to $249.9M 245 154 59.1% 39.6 24.6 61.0% 21.5<br />
$50M to $99.9M 245 135 81.5% 17.3 9.4 84.0% 21.4<br />
$25M to $49.9M 246 196 25.5% 8.7 7.0 24.3% 15.5<br />
$10M to $24.9M 321 297 8.1% 5.1 4.8 6.3% 24.6<br />
Under $10M 643 796 -19.2% 2.1 2.4 -12.5% 16.8<br />
Undisclosed 4,740 3,742 26.7% N/A N/A N/A N/A<br />
Total 6,766 5,496 23.1% $472.6 $372.4 26.9% 25.0<br />
Public Buyer Index: LTM 02/28/11<br />
$400<br />
$334.0<br />
$325.0<br />
$360.0<br />
$350<br />
$297.0 $291.0 $286.0<br />
$292.0<br />
$298.0<br />
$295.0<br />
$263.0<br />
$256.0<br />
$264.0<br />
$300<br />
$250<br />
$200<br />
$150<br />
$100<br />
$50 45 39 31 31 31 29 40 26 34 40 59 40<br />
$0<br />
Mar-10 Apr-10 May-10 Jun-10 Jul-10 Aug-10 Sep-10 Oct-10 Nov-10 Dec-10 Jan-11 Feb-11<br />
70<br />
60<br />
50<br />
40<br />
30<br />
20<br />
10<br />
-<br />
<strong>US</strong> Private Equity Report .<br />
Indices Top Private Equity Fundraisings: YTD 2011<br />
PE Buyer Index: LTM 02/28/11 Open Date Value ($Mil) Fund (Private Equity Sponsor)<br />
Value ($Bil)<br />
$16<br />
140<br />
$14.4<br />
$14.4<br />
$14.0<br />
$14<br />
$11.4<br />
$11.8<br />
120<br />
$12<br />
100<br />
$8.5<br />
$10<br />
$7.7<br />
80<br />
$8<br />
$6.4<br />
$5.4<br />
$5.5<br />
$4.3<br />
$4.3<br />
60<br />
$6<br />
$4<br />
40<br />
$2 76 83 66 110 107 88 93 80 86 115 111 64<br />
20<br />
$0<br />
-<br />
Mar-10 Apr-10 May-10 Jun-10 Jul-10 Aug-10 Sep-10 Oct-10 Nov-10 Dec-10 Jan-11 Feb-11<br />
Going Private Index: LTM 02/28/11<br />
$14.0<br />
Value ($Bil)<br />
$13.2<br />
14<br />
$12.0<br />
$10.6 12<br />
$10.0<br />
$8.2<br />
10<br />
$8.0<br />
$5.8<br />
8<br />
$4.8<br />
$6.0<br />
$4.0<br />
6<br />
$2.7<br />
$4.0<br />
$2.2<br />
$1.6<br />
$1.8<br />
4<br />
$0.7<br />
$1.0<br />
$2.0<br />
2<br />
8 6 7 6 7 3 5 9 13 4 5 8<br />
$0.0<br />
-<br />
Mar-10 Apr-10 May-10 Jun-10 Jul-10 Aug-10 Sep-10 Oct-10 Nov-10 Dec-10 Jan-11 Feb-11<br />
21-Feb-11 2,000.0 RRJ Capital Master Fund I LP<br />
RRJ Capital Ltd<br />
08-Jan-11 1,600.0 ABRY Partners VII LP<br />
ABRY Partners LLC<br />
12-Jan-11 1,300.0 ABRY Advanced Securities Fund II LP<br />
ABRY Partners LLC<br />
28-Jan-11 818.0 Niam V Investments KB<br />
Niam AB<br />
11-Jan-11 600.0 Saints Capital Vii LP<br />
Saints Ventures LLC<br />
12-Jan-11 300.0 True North Venture Partners LP<br />
True North Management Partners LLC<br />
31-Jan-11 300.0 NAMF Fund II<br />
Decorum Capital Partners (Pty) Ltd.<br />
20-Jan-11 234.7 Diana Capital II FCR<br />
Diana Capital SGECR SA<br />
09-Feb-11 150.0 Monroe Capital Corp<br />
Monroe Capital LLC<br />
04-Feb-11 150.0 Tagua Capital Fund<br />
Tagua Capital<br />
www.factset.com March 2011 Copyright © 2011 FactSet Research Systems Inc. All rights reserved. 5
Top <strong>US</strong> Advisors .<br />
Financial Advisor<br />
Based on <strong>US</strong> Announced Deals – Ranked by Transaction Value: YTD 2011<br />
Transaction<br />
Value ($Mil)*<br />
Total<br />
Deals**<br />
1. JPMorgan Chase & Co., Inc. $75,251.0 17<br />
2. Morgan Stanley 52,732.7 19<br />
3. Deutsche Bank AG 45,819.8 19<br />
4. Goldman Sachs & Co. 43,712.4 23<br />
5. Lazard 40,497.7 7<br />
6. Bank of America Merrill Lynch 39,024.1 22<br />
7. Barclays Plc 33,992.2 8<br />
8. Citigroup 25,954.8 11<br />
9. Credit Suisse 21,306.2 14<br />
10. UBS AG 13,587.6 10<br />
11. Wells Fargo & Co. 13,573.0 6<br />
12. Moelis & Co. Holdings LLC 11,537.1 4<br />
13. Perella Weinberg Partners LP 10,276.3 2<br />
14. Societe Generale SA 10,127.1 2<br />
14. BNP Paribas SA 10,127.1 1<br />
16. Bank of Montreal 6,413.3 4<br />
17. RBC Capital Markets 6,042.4 5<br />
18. Nordea Bank AB 5,955.6 1<br />
19. Centerview Partners LLC 5,679.4 1<br />
20. GMP Capital, Inc. 4,269.9 1<br />
21. Royal Bank of Scotl<strong>and</strong> Group PLC 3,486.6 3<br />
22. Qatalyst Group 3,418.4 2<br />
23. Jefferies Group 3,063.8 12<br />
24. Rothschild 2,667.0 4<br />
25. S<strong>and</strong>ler O'Neill & Partners LP 1,695.1 4<br />
26. Houlihan Lokey 1,104.1 8<br />
27. Keefe, Bruyette & Woods, Inc. 972.9 10<br />
28. HSBC Holdings PLC 935.0 2<br />
29. Macquarie Group 787.8 2<br />
30. Berenson & Co. 622.2 2<br />
31. Raymond James Financial, Inc. 579.4 6<br />
32. Nomura Securities Co., Ltd. 560.8 2<br />
32. Sumitomo Mitsui Financial Group, Inc. 560.8 1<br />
34. Greene Holcomb & Fisher LLC 540.0 2<br />
35. Methuselah Advisors LLC 505.0 1<br />
36. Gleacher & Co., Inc. 494.0 1<br />
37. Endicott Group 477.3 1<br />
38. William Blair & Co. LLC 452.1 10<br />
39. Oppenheimer & Co., Inc. 442.4 3<br />
40. Kim Eng Holdings Ltd. 364.4 1<br />
41. Tudor Pickering Holt & Co. LLC 320.0 1<br />
42. CB Richard Ellis Group, Inc. 313.5 1<br />
43. Canaccord Financial, Inc. 292.8 2<br />
44. Guggenheim Capital LLC 270.0 2<br />
45. B. Riley & Co. 260.4 1<br />
46. Berkshire Capital 244.5 3<br />
47. Valence Group 180.0 2<br />
48. O'Sullivan Pullini 165.6 1<br />
49. Advanced Equities Financial Corp. 150.0 1<br />
50. Lincoln International LLC 149.8 6<br />
Legal Advisor<br />
Transaction<br />
Value ($Mil)*<br />
Total<br />
Deals**<br />
1. Wachtell, Lipton, Rosen & Katz $ 72,441.6 11<br />
2. Skadden, Arps, Slate, Meagher & Flom LLP 55,288.1 16<br />
3. Latham & Watkins LLP 37,777.5 21<br />
4. Dewey & LeBoeuf LLP 30,059.1 9<br />
5. Simpson Thacher & Bartlett LLP 28,974.6 14<br />
6. Cleary Gottlieb Steen & Hamilton LLP 27,365.7 8<br />
7. Hunton & Williams LLP 25,657.7 2<br />
8. Sullivan & Cromwell LLP 21,865.5 21<br />
9. Shearman & Sterling LLP 18,964.0 15<br />
10. Davis Polk & Wardwell LLP 18,491.9 4<br />
11. Cravath, Swaine & Moore LLP 11,720.9 6<br />
12. Covington & Burling LLP 11,266.5 5<br />
13. King & Spalding LLP 11,040.1 7<br />
14. Milbank, Tweed, Hadley & McCloy LLP 10,303.1 3<br />
15. Linklaters LLP 10,127.1 2<br />
15. Stibbe 10,127.1 1<br />
17. Greenberg & Traurig LLP 10,085.3 2<br />
18. Mayer Brown LLP 9,515.0 7<br />
19. Freehills 9,400.0 1<br />
20. Baker & McKenzie 8,594.3 2<br />
21. Baker Botts LLP 8,541.7 1<br />
22. Troutman S<strong>and</strong>ers LLP 7,914.3 1<br />
23. Willkie Farr & Gallagher LLP 7,583.2 5<br />
24. Blake, Cassels & Graydon LLP 5,980.9 2<br />
25. Plesner & Gronborg 5,955.6 2<br />
25. Carter, Ledyard & Milburn LLP 5,955.6 1<br />
25. Crowell & Moring LLP 5,955.6 1<br />
28. Jones Day LP 5,641.7 32<br />
29. Fraser Milner Casgrain LLP 4,387.6 2<br />
30. Cassels Brock & Blackwell LLP 4,269.9 1<br />
31. Weil, Gotshal & Manges LLP 4,178.6 8<br />
32. Stikeman Elliott LLP 4,052.6 3<br />
33. Alston & Bird LLP 3,736.6 6<br />
34. Kirkl<strong>and</strong> & Ellis LLP 3,624.2 9<br />
35. Slaughter & May 3,555.1 5<br />
36. Allen & Overy LLP 3,437.9 3<br />
37. Andrews Kurth LLP 3,367.3 3<br />
38. Pillsbury Winthrop Shaw Pittman LLP 3,111.5 1<br />
39. Vinson & Elkins LLP 3,111.0 2<br />
40. Debevoise & Plimpton Ltd. 2,901.3 2<br />
40. Kaye Scholer LLP 2,901.3 1<br />
42. Arnall Golden Gregory LLP 2,400.0 1<br />
42. Arnold & Porter LLP 2,400.0 1<br />
42. Shumaker Loop & Kendrick LLP 2,400.0 1<br />
42. Sidley Austin LLP 2,400.0 1<br />
42. Williams Mullen PC 2,400.0 1<br />
47. Advokatfirmaet Thommessen AS 2,001.8 1<br />
47. Selmer 2,001.8 1<br />
49. Akin, Gump, Strauss, Hauer & Feld LLP 1,987.6 2<br />
50. O'Melveny & Myers LLP 1,866.8 11<br />
* Transaction Value is the aggregate base equity plus the target’s net debt, where applicable. ** Total Deals includes deals that reported a deal value as well as those that did not.<br />
If you would like to participate in our league table rankings or have questions about league table criteria, please contact advisors@factset.com or:<br />
North America:<br />
Kenneth Woo<br />
E-Mail: kwoo@factset.com<br />
Tel: +1.650.287.4824<br />
Global: Anita Abbas<br />
E-Mail: aabbas@factset.com<br />
Tel: +1.650.287.4811<br />
www.factset.com March 2011 Copyright © 2011 FactSet Research Systems Inc. All rights reserved. 6
Top <strong>US</strong> Deals Scoreboard .<br />
Seller (Unit Sold) Buyer Transaction<br />
Financial Advisor Financial Advisor Value**<br />
Rank Legal Advisor Legal Advisor ($Mil) Seller Industry<br />
1<br />
Progress Energy, Inc.<br />
Barclays<br />
Lazard<br />
Hunton & Williams LLP<br />
Latham & Watkins LLP<br />
Skadden, Arps, Slate, Meagher & Flom LLP<br />
Duke Energy Corp.<br />
Bank of America Merrill Lynch<br />
JPMorgan Chase & Co., Inc.<br />
Dewey & LeBoeuf LLP<br />
Skadden, Arps, Slate, Meagher & Flom LLP<br />
Wachtell, Lipton, Rosen & Katz<br />
$13,614.7 Electric, Gas Water & Sanitary Services<br />
2<br />
NYSE Euronext<br />
BNP Paribas SA<br />
Goldman Sachs & Co.<br />
Morgan Stanley<br />
Perella Weinberg Partners LP<br />
Cleary Gottlieb Steen & Hamilton LLP<br />
Covington & Burling LLP<br />
Milbank, Tweed, Hadley & McCloy LLP<br />
Stibbe<br />
Wachtell, Lipton, Rosen & Katz<br />
Deutsche Börse AG<br />
Credit Suisse<br />
Deutsche Bank<br />
JPMorgan Chase & Co., Inc.<br />
Société Générale SA<br />
Davis Polk & Wardwell LLP<br />
Linklaters LLP<br />
Simpson Thacher & Bartlett LLP<br />
$10,127.1 Brokerage, Investment & Mgmt.<br />
Consulting<br />
3<br />
Centro Properties Group Ltd.<br />
(Centro Properties Group United States)<br />
JPMorgan Chase & Co., Inc.<br />
Lazard<br />
Moelis & Co. LLC<br />
Freehills<br />
Skadden, Arps, Slate, Meagher & Flom LLP<br />
Blackstone Group LP<br />
Deutsche Bank<br />
Wells Fargo & Co.<br />
Simpson Thacher & Bartlett LLP<br />
$9,400.0 Real Estate<br />
4<br />
ProLogis<br />
Morgan Stanley<br />
Greenberg & Traurig LLP<br />
Mayer Brown LLP<br />
AMB Property Corp.<br />
JPMorgan Chase & Co., Inc.<br />
Davis Polk & Wardwell LLP<br />
Wachtell, Lipton, Rosen & Katz<br />
$8,364.7 Brokerage, Investment & Mgmt.<br />
Consulting<br />
5<br />
Pride International, Inc.<br />
Goldman Sachs & Co.<br />
Baker Botts LLP<br />
Shearman & Sterling LLP<br />
Sullivan & Cromwell LLP<br />
Wachtell, Lipton, Rosen & Katz<br />
Ensco Plc<br />
Citigroup, Inc.<br />
Deutsche Bank<br />
Baker & McKenzie<br />
$7,309.7 Energy Services<br />
6<br />
Massey Energy Co.<br />
UBS AG<br />
Cravath, Swaine & Moore LLP<br />
Troutman S<strong>and</strong>ers LLP<br />
Alpha Natural Resources, Inc.<br />
Citigroup, Inc.<br />
Morgan Stanley<br />
Cleary Gottlieb Steen & Hamilton LLP<br />
$7,080.0 Mining & Minerals<br />
7<br />
Family Dollar Stores, Inc.<br />
Morgan Stanley<br />
Cleary Gottlieb Steen & Hamilton LLP<br />
Trian Fund Management LP $6,984.9 Retail<br />
8<br />
Beckman Coulter, Inc.<br />
Goldman Sachs & Co.<br />
Latham & Watkins LLP<br />
Danaher Corp.<br />
Morgan Stanley<br />
King & Spalding LLP<br />
Wachtell, Lipton, Rosen & Katz<br />
$5,782.2 Instruments & Photographic Equipment<br />
9<br />
Nationwide Health Properties, Inc.<br />
JPMorgan Chase & Co., Inc.<br />
Simpson Thacher & Bartlett LLP<br />
Skadden, Arps, Slate, Meagher & Flom LLP<br />
Ventas, Inc.<br />
Centerview Partners LLC<br />
Wachtell, Lipton, Rosen & Katz<br />
Willkie Farr & Gallagher LLP<br />
$5,679.4 Brokerage, Investment & Mgmt.<br />
Consulting<br />
10<br />
Danisco A/S<br />
Deutsche Bank<br />
Carter, Ledyard & Milburn LLP<br />
E.I. du Pont de Nemours & Co.<br />
Goldman Sachs & Co.<br />
JPMorgan Chase & Co., Inc.<br />
Nordea Bank AB<br />
Crowell & Moring LLP<br />
Plesner & Gronborg<br />
Skadden, Arps, Slate, Meagher & Flom LLP<br />
$5,526.7 Food Processing<br />
Total Market Value of Top 10 Deals $79,869.5<br />
www.factset.com March 2011 Copyright © 2011 FactSet Research Systems Inc. All rights reserved. 7