Quality Measure/ Indicator Utilization Process Indicator - Arkansas ...
Quality Measure/ Indicator Utilization Process Indicator - Arkansas ...
Quality Measure/ Indicator Utilization Process Indicator - Arkansas ...

You also want an ePaper? Increase the reach of your titles
YUMPU automatically turns print PDFs into web optimized ePapers that Google loves.
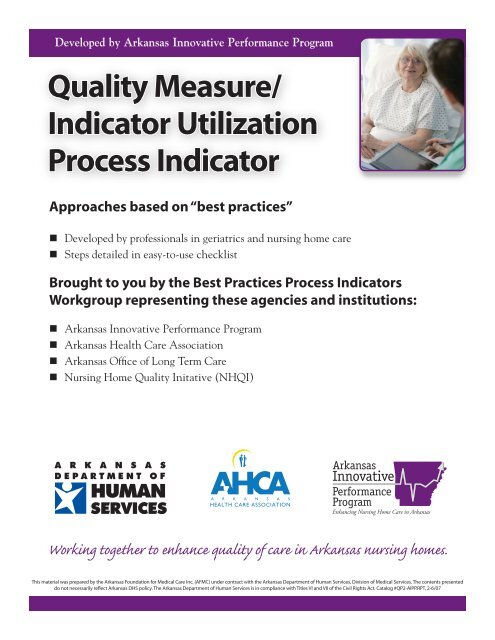
Developed by <strong>Arkansas</strong> Innovative Performance Program<br />
<strong>Quality</strong> <strong>Measure</strong>/<br />
<strong>Indicator</strong> <strong>Utilization</strong><br />
<strong>Process</strong> <strong>Indicator</strong><br />
Approaches based on “best practices”<br />
• Developed by professionals in geriatrics and nursing home care<br />
• Steps detailed in easy-to-use checklist<br />
Brought to you by the Best Practices <strong>Process</strong> <strong>Indicator</strong>s<br />
Workgroup representing these agencies and institutions:<br />
• <strong>Arkansas</strong> Innovative Performance Program<br />
• <strong>Arkansas</strong> Health Care Association<br />
• <strong>Arkansas</strong> Office of Long Term Care<br />
• Nursing Home <strong>Quality</strong> Initative (NHQI)<br />
A R K A N S A S<br />
HEALTH CARE ASSOCIATION<br />
<strong>Arkansas</strong><br />
Innovative<br />
Performance<br />
Program<br />
Enhancing Nursing Home Care in <strong>Arkansas</strong><br />
Working together to enhance quality of care in <strong>Arkansas</strong> nursing homes.<br />
This material was prepared by the <strong>Arkansas</strong> Foundation for Medical Care Inc. (AFMC) under contract with the <strong>Arkansas</strong> Department of Human Services, Division of Medical Services. The contents presented<br />
do not necessarily reflect <strong>Arkansas</strong> DHS policy. The <strong>Arkansas</strong> Department of Human Services is in compliance with Titles VI and VII of the Civil Rights Act. Catalog #QP2-AIPP.RPT, 2-6/07
QUALITY MEASURE / INDICATOR REPORT UTILIZATION<br />
PROCESS INDICATOR<br />
OVERVIEW<br />
In 1984, the Institute of Medicine (IOM) began a two-year study of nursing home quality. The 1986<br />
report, Improving the <strong>Quality</strong> of Care in Nursing Homes, resulted in Congress mandating in the Omnibus<br />
Reconciliation Act of 1987, several provisions intended to improve nursing home care. These provisions<br />
included developing the Minimum Data Set for Resident Assessment and Care Screening (MDS),<br />
mandating routine use of the MDS and its companion care planning process for all nursing home<br />
residents, and requiring that a quality assurance and assessment process be used in all nursing homes to<br />
improve quality of care. This standardized resident assessment process was envisioned to improve<br />
resident care through the formulation of a resident-specific care plan: to provide nursing home<br />
management with resident level data for monitoring case mix, staffing, and quality of care performance;<br />
and to provide regulators with data for case mix, sampling for survey processes, monitoring resident<br />
outcomes and utilization review for Medicare or Medicaid eligibility.<br />
The Centers for Medicare & Medicaid Services offers a quality measure / indicator (QM/QI) report for<br />
use by facilities as the foundation for continuous quality improvement. These reports are a way to review<br />
processes and outcomes. <strong>Process</strong>es are the steps or actions used to arrive at a predetermined goal. An<br />
outcome is the result of applying the process. The QM/QI reports provide very valuable information about<br />
the outcomes of care in the facility. They offer a snap shot of your facility at a point in time and allow<br />
you to compare your QM/QI scores to other facilities in the state and the nation.<br />
QM/QI reports are also used in the survey process. They are not definite measures of quality of care, but<br />
are “pointers” that indicate potential problem areas that need further review and investigation. The<br />
QM/QIs are not absolute measurements of quality. They are findings that point to potentially poor care or<br />
identify potentially good care.<br />
The key to analyzing the facility’s data regarding the QM/QIs is in the understanding of definitions. Each<br />
QM/QI has its own unique definition based on the MDS item response(s) from which it is derived. In<br />
some cases, the definition would seem to be obvious on the face of it, but further investigation reveals that<br />
it is important not to make assumptions about definitions. The keys to success with the QM/QIs, clearly,<br />
are accurate MDS data and resident care systems that foster excellent outcomes.<br />
The process that surveyors use during the licensing and certification survey can be a sound basis for QI<br />
activities in the facility. The initial sample is selected via the QM/QI reports during off-site preparation,<br />
although changes may be made at the facility. For the initial selection, surveyors must focus on any<br />
Sentinel Health Event, any other QM/QI that is at the 90 th percentile, and any QM/QI at 75 th percentile or<br />
greater. In the process, MDS items are checked for accuracy to verify that the resident’s condition is<br />
accurately represented. At least two QM/QIs for each resident must be verified using the QM/QI<br />
definitions and chart documentation.<br />
ARKANSAS INNOVATIVE PERFORMANCE PROGRAM Page 1 of 8
With the 2005 merger to the QM/QI reporting system, a total of seven reports are available through the<br />
Certification and Survey Provider Enhanced Reporting (CASPER) system. Surveyors utilize these<br />
reports on the off-site preparation phase of the survey as one source of information about the facility’s<br />
resident population and about possible resident care problems. Nursing homes should also utilize these<br />
reports to identify potential areas of concern for <strong>Quality</strong> Improvements action and to identify and select a<br />
resident sample for quality improvement review.<br />
MDS QM/QI Package Report<br />
• Facility <strong>Quality</strong> <strong>Measure</strong>/ <strong>Indicator</strong> Report<br />
• Resident Level <strong>Quality</strong> <strong>Measure</strong>/<strong>Indicator</strong> Report: Chronic Care Sample<br />
• Resident Level <strong>Quality</strong> <strong>Measure</strong>/<strong>Indicator</strong> Report: Post Acute Care Sample<br />
• Resident Listing Report: Chronic Care Sample<br />
• Resident Listing Report: Post Acute Care Sample<br />
• Facility Characteristic Reports<br />
• <strong>Quality</strong> <strong>Measure</strong>/<strong>Indicator</strong> Monthly Trend Report (New)<br />
Facility <strong>Quality</strong> <strong>Measure</strong>/<strong>Indicator</strong> Report<br />
This report shows each QM/QI, the facility percentage and how the facility compares with other facilities<br />
in the state and the nation.<br />
• Numerator: The number of facility residents who actually triggered a QM/QI. These are the residents<br />
who “have” the QM/QI.<br />
• Denominator: The number of facility residents who could have triggered the QM/QI.<br />
• Observed Percent: The numerator divided by the denominator multiplied by 100.<br />
• Percentile: A facility’s state rank, expressed as a percentage, on a given QM/QI. If a facility’s state<br />
percentile is 85%, it means that 85% of the facilities in the state had a QM/QI less than or equal to the<br />
facility’s score.<br />
• Incidence <strong>Measure</strong>s are conditions that have developed over the course of two assessments – a<br />
comparison of two assessments. This type of measures compares two points in time.<br />
• Prevalence <strong>Measure</strong>s are based upon a single assessment (rather than a change across two assessments –<br />
actual number. This type of measure/indicator provides information about a specific point in time.<br />
• Thresholds: A set point for each QM/QI at which the likelihood of a problem is sufficient to warrant<br />
emphasis or at least investigation by the facility or a survey team. <strong>Measure</strong>s that exceed these<br />
thresholds are “flagged” with an asterisk on the Facility <strong>Quality</strong> <strong>Measure</strong>/<strong>Indicator</strong> Report. The logic is<br />
as follows:<br />
Sentinel events are flagged if the numerator is greater than zero. All other measures / indicators are<br />
flagged if their state percentile is greater than or equal to 90. This does not mean that there is an automatic<br />
assumption of a problem. It only means that here is a concern that should be investigated to see whether a<br />
problem exists and how it is being addressed.<br />
ARKANSAS INNOVATIVE PERFORMANCE PROGRAM Page 2 of 8
• Sentinel Health Events are QM/QI’s that should occur very infrequently, if at all, in a facility. The<br />
nature of these indicators is serious enough to warrant investigation, even if it occurs only once.<br />
There are three Sentinel event measures:<br />
• Prevalence of Fecal Impaction<br />
• Prevalence of Dehydration<br />
• Prevalence of Pressure Ulcer occurring in a Low Risk Population.<br />
• Technically not all residents are used in the QM/QI calculation on the Facility <strong>Quality</strong><br />
<strong>Measure</strong>/<strong>Indicator</strong> Report.<br />
Admission assessments are used on Incidence BUT NOT on Prevalence QM/QI’s, since<br />
conditions present on admission are not likely to reflect care in the facility.<br />
• Residents who were physically restrained ONLY includes trunk restraints, limb restraints, or a chair that<br />
prevents rising. Side Rails are NOT included in this percentage.<br />
• Residents who lose too much weight measure exclude hospice residents.<br />
• Some facilities have a higher number of residents who are frailer and sicker. In order to take this fact<br />
into account, some of the QM/QI’s are “risk adjusted”, taking into consideration other health<br />
characteristics.<br />
These are:<br />
o Residents who have/had a catheter inserted and left in bladder<br />
o Residents who have moderate to severe pain<br />
o Residents whose ability to move in and around their room got worse<br />
o Short-stay residents with delirium<br />
o Short-stay residents with pressure ulcers<br />
Statistics reported on QM/QI reports are updated weekly. Because the date report can be generated for<br />
sequential time frames, they are useful to track trends.<br />
BEST PRACTICE:<br />
-Carefully Review the Following Reports<br />
-Customize Report Period for Past Three Months.<br />
Resident Level <strong>Quality</strong> <strong>Measure</strong>/<strong>Indicator</strong> Report: Chronic Care Sample<br />
This report contains data for those residents who are included in the chronic care sample, because they<br />
have an OBRA assessment (AA8a) in the report period given in the header or requested.<br />
• It is possible for residents to be included in both the chronic care and post acute care samples if they<br />
have a qualifying OBRA and post-acute assessments during the target period.<br />
• This report can be used in two ways:<br />
• To identify residents that trigger a particular QM/QI<br />
• To identify residents who trigger multiple QM/QIs. Such residents may<br />
merit consideration or more intensive review.<br />
• Review all residents with clinically linked QM/QIs to identify negative outcomes. (i.e., Depression No<br />
Tx/Weight Loss, Mod/Severe Pain/Pressure Ulcer, Restraints/Little Activity/Decline in ROM, etc…)<br />
Resident Level <strong>Quality</strong>/<strong>Measure</strong> <strong>Indicator</strong> Report: Post Acute Care Sample<br />
ARKANSAS INNOVATIVE PERFORMANCE PROGRAM Page 3 of 8
Contains data for residents who had a 14-day SNF PPS assessment during the target period, otherwise it<br />
parallels the chronic care report.<br />
Resident Listing Report: Chronic Care Sample<br />
This report lists those residents who are in the chronic care sample, because they have an OBRA<br />
assessment during the requested period.<br />
• This report can be utilized to identify assessments that are not timely OR LATE!<br />
o Report period must be requested for the previous six month time frame. If only pulled for a three<br />
month period, late assessments would not be included because they would not have been completed<br />
in the requested report period.<br />
• Example : Report Period 03/01/2006 – 09/01/2006<br />
o Resident has Target Assessment date of 04/01/2006 in A3a<br />
o Report period ended 09/01/2006<br />
o Resident has no Discharge Date Identified!<br />
This would indicate that this resident has not had an assessment completed since April and the<br />
report period ended in September. The assessment on this resident should have been completed<br />
prior to July. One of two things has occurred, the assessment was obviously not submitted,<br />
may have transmitted but not accepted, or if the resident has been discharged, then no<br />
Discharge Tracking Assessment was completed and submitted. One key point to remember is<br />
to compare your Resident Listing Report: Acute Care Sample to identify a PPS Assessment that<br />
could have been completed on this resident, however, the Chronic Care Report would also<br />
show this under AA8a/AA8b column.<br />
MDS schedules MUST BE MERGED – OBRA AND PPD, (Regulatory and Medicare), if necessary they<br />
should be DUALLY CODED!<br />
Resident Listing Report: Post Acute Care Sample<br />
This report parallels the chronic care Resident Listing Report described above. It lists the residents who<br />
had a 14-day SNF PPS assessment during the requested period.<br />
Facility Characteristics Report<br />
Facilities characteristics may indicate a need to concentrate a review on certain resident groups.<br />
Examples:<br />
• A very old population.<br />
• An unusually high percentage of male residents.<br />
o Activities are not adequate for this gender.<br />
• A higher that average percentage of Medicare residents, indicating an emphasis on rehab or a<br />
more acutely ill population.<br />
• A higher than average percentage or psychiatric and mentally retarded residents.<br />
• A higher than average percentage of residents receiving hospice care.<br />
• A higher than average percentage of admission assessments or significant change assessments.<br />
ALSO, if low, could signal lack of change of condition identification.<br />
<strong>Quality</strong> <strong>Measure</strong> / <strong>Indicator</strong> Monthly Trend Report<br />
This report lists those residents who are included in the chronic care sample, because they have an OBRA<br />
assessment during the requested period.<br />
ARKANSAS INNOVATIVE PERFORMANCE PROGRAM Page 4 of 8
FACILITY QM/QI REVIEW PROCESS<br />
Step 1 Review the QM/QI reports and select measures to review, looking for areas that are out<br />
of range. (Remember low scores are good, so give yourself credit for hard work.)<br />
Areas to consider:<br />
• Review should be conducted by the ICP Team members who have a<br />
clear understanding of the QM/QI calculation and the implications of the<br />
scores themselves.<br />
• The percentile rank and comparison group facility percentages. (QM/QI<br />
scores at the 75 th percentile or above.) The facility needs to be proactive<br />
to anticipate problem areas and improve performance prior to a change in<br />
the QM/QI percentage report.<br />
• Clinically linked QM/QIs to identify facility wide areas for review.<br />
• Areas identified on previous regulatory survey as deficiencies.<br />
• All sentinel events should be selected for further analysis of scores that<br />
are trending upward.<br />
• Verify MDS coding is correct<br />
Step 2 Select a separate sample of residents for each QM/QI that will be reviewed for potential<br />
problems from the Resident Level <strong>Quality</strong> <strong>Measure</strong>/<strong>Indicator</strong> Report. This is crucial in<br />
order to carry out the next step in the review which will be a detailed chart review to<br />
verify accuracy of the MDS coding that contributed to the QM/QI. This is a crucial step<br />
because the resident outcomes can be the very best, but if the MDS data is not accurate,<br />
the QM/QI scores can tell a very different story.<br />
• Residents from all units<br />
• Residents with several flagged QM/QIs<br />
• Residents with clinically linked QM/QIs<br />
• Select at least five residents, if possible, to determine if there is a pattern<br />
Step 3 Once the accuracy of the MDS is validated and it is determined that the resident did have<br />
the QM/QI condition, the focus must shift to the care of the resident.<br />
• Review the care for each of the selected residents.<br />
Step 4 Analyze findings about the quality of care for each resident and QM/QI reviewed.<br />
Step 5 Decide if there is a facility-wide QM/QI problem after reviewing the care for each of the<br />
residents.<br />
• If undesirable outcomes are identified, were they a result of actions by<br />
individual staff members or are improvements needed in the processes of<br />
care related to the QM/QI condition.<br />
Step 6 Report findings of the review to the QA & A Committee to develop an action plan to<br />
address the problems. In most cases, implementation of your plan of action will begin by<br />
educating your staff about the problem and the needed changes.<br />
Step 7 Evaluate the effectiveness of the improvement plan based on continuous, ongoing review<br />
of subsequent QM/QI reports. Update policy and procedure manuals to reflect the<br />
improvement, if indicated. Remember, quality improvement is a process not an end<br />
result. Systems will constantly need to be evaluated and changed to allow for the best<br />
resident outcomes. And, while, it is very important to monitor and analyze the QM/QI<br />
ARKANSAS INNOVATIVE PERFORMANCE PROGRAM Page 5 of 8
data in order to identify opportunities to continuously improve care and services, it is<br />
important to note that the QM/QIs always are looking back in time. It is perhaps even<br />
more important to have effective monitoring systems in place to be able to identify that a<br />
problem is starting – before it becomes a trend that shows up on the QM/QI reports.<br />
ASSESSMENT – Accuracy and Decision Making<br />
• The MDS for each resident must match all items in the QM/QI reports.<br />
• The resident’s condition must be verified by evidence other than the MDS.<br />
• If the assessment information is inaccurate, is the quality of care for this resident<br />
affected?<br />
CARE PLANNING/ RAPs<br />
• Is the condition on the QM/QI addressed in the resident’s care plan, if not has the<br />
decision to not intervene been documented (RAP statement).<br />
• Is there a problem with the care plan interventions for this resident related to the QM/QI?<br />
IMPLEMENTATION<br />
• Are interventions being implemented that are described in the resident’s care plan?<br />
• Is there interdisciplinary understanding and input?<br />
EVALUATION AND MONTIORING<br />
• Has the resident’s care plan been changed as needed to promote the best outcome for the<br />
resident based on an accurate and current assessment?<br />
FACILITY LEVEL REVIEW<br />
• Was there a pattern of inaccuracy with the QM/QI Reports?<br />
• Considering the entire sample, is there a problem across the facility with an issue<br />
identified by this review?<br />
• Are there urgent problems that need immediate action?<br />
CONCLUSION<br />
Remember, that just because a QI has flagged (exceeded a threshold) does not mean that there is an<br />
automatic assumption of a problem. It means that the information suggests that there is a concern that<br />
should be reviewed to see whether a problem exists and how it is being addressed. Also remember, just<br />
because a facility does not flag does not mean that there is no problem with the quality of care in that<br />
area. You need to consider all of the information provided, and use your best clinical judgment. The QI<br />
information is only one of many tools for surveyors and facility staff to use. It is not used exclusively for<br />
quality assurance/improvement activities or to make assumptions about care.<br />
ARKANSAS INNOVATIVE PERFORMANCE PROGRAM Page 6 of 8
QM/QI <strong>Utilization</strong> Review Checklist<br />
Assessment Data Yes No N/A<br />
1. Specific QM/QI’s selected for review?<br />
2. A minimum of five sample residents<br />
selected?<br />
3. Detailed chart review of sample residents<br />
completed?<br />
4. Accuracy of MDS on sample residents<br />
validated?<br />
5. Reviewed care of each of the sample<br />
residents?<br />
6. Identify any problem areas from review<br />
process?<br />
7. Does a facility-wide problem exist?<br />
8. Findings reported to QA & A Committee?<br />
9. If appropriate, the effectiveness of the<br />
<strong>Quality</strong> Improvement Plan evaluated?<br />
10. Subsequent reviews completed as<br />
indicated?<br />
Enhancing Nursing Home Care in <strong>Arkansas</strong><br />
ARKANSAS INNOVATIVE PERFORMANCE PROGRAM Page 7 of 8
RESOURCES<br />
www.afmc.org<br />
www.ahca.org<br />
www.qtso.org<br />
www.chrsa.wisc.edu<br />
www.cms.hhs.gov<br />
www.amda.org<br />
www.ahrq.gov<br />
www.medicare.gov/Nhcompare/Home.asp<br />
www.cms.hhs.gov/NursingHome<strong>Quality</strong>Inits/20 NHQIMDS20.asp#TopOfPage<br />
ARKANSAS INNOVATIVE PERFORMANCE PROGRAM Page 8 of 8