Regional Beach Sand Project EIR/EA - CHL - U.S. Army
Regional Beach Sand Project EIR/EA - CHL - U.S. Army
Regional Beach Sand Project EIR/EA - CHL - U.S. Army

Create successful ePaper yourself
Turn your PDF publications into a flip-book with our unique Google optimized e-Paper software.
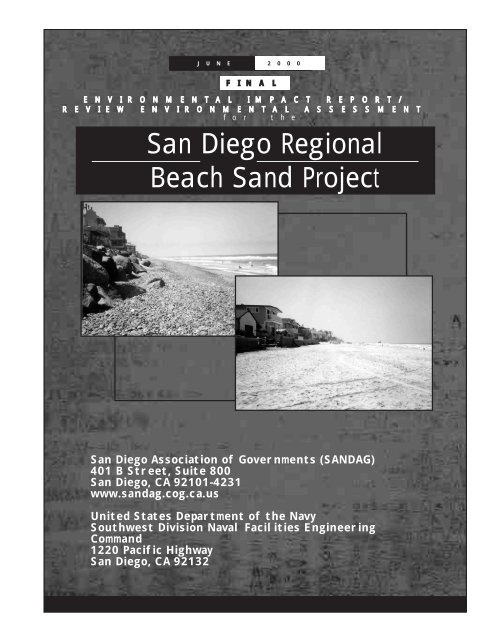
J U N E 2 0 0 0<br />
F I N A L<br />
E N V I R O N M E N T A L I M P A C T R E P O R T /<br />
R E V I E W E N V I R O N M E N T A L A S S E S S M E N T<br />
f o r t h e<br />
San Diego <strong>Regional</strong><br />
<strong>Beach</strong> <strong>Sand</strong> <strong>Project</strong><br />
San Diego Association of Governments (SANDAG)<br />
401 B Street, Suite 800<br />
San Diego, CA 92101-4231<br />
www.sandag.cog.ca.us<br />
United States Department of the Navy<br />
Southwest Division Naval Facilities Engineering<br />
Command<br />
1220 Pacific Highway<br />
San Diego, CA 92132
THE SAN DIEGO<br />
REGIONAL B<strong>EA</strong>CH SAND PROJECT<br />
FINAL ENVIRONMENTAL IMPACT REPORT/<br />
ENVIRONMENTAL ASSESSMENT<br />
June 2000<br />
State Clearinghouse Number 1999041104<br />
MEMBER AGENCIES: Cities of Carlsbad, Chula Vista, Coronado, Del Mar, El Cajon, Encinitas, Escondido, Imperial <strong>Beach</strong>, La Mesa<br />
Lemon Grove, National City, Oceanside, Poway, San Diego, San Marcos, Santee, Solana <strong>Beach</strong>, Vista, and County of San Diego.<br />
ADVISORY/LIAISON MEMBERS: California Department of Transportation, Metropolitan Transit Development Board,<br />
North San Diego County Transit Development Board, U.S. Department of Defense, San Diego Unified Port District,<br />
San Diego County Water Authority, and Tijuana/Baja California/Mexico
Board of Directors<br />
SAN DIEGO ASSOCIATION OF GOVERNMENTS<br />
The 18 cities and county government are SANDAG serving as the forum<br />
for regional decision-making. The Association builds consensus, makes<br />
strategic plans, obtains and allocates resources, and provides information on a<br />
broad range of topics pertinent to the region’s quality of life.<br />
CHAIRMAN: Hon. Art Madrid<br />
VICE CHAIR: Hon. Ramona Finnila<br />
SECRETARY-EXECUTIVE DIRECTOR: Kenneth E. Sulzer<br />
CITY OF CARLSBAD<br />
Hon. Ramona Finnila, Councilmember<br />
(A) Hon. Bud Lewis, Mayor<br />
(A) Hon. Matt Hall, Mayor Pro Tem<br />
CITY OF CHULA VISTA<br />
Hon. Shirley Horton, Mayor<br />
(A) Hon. Mary Salas, Councilmember<br />
CITY OF CORONADO<br />
Hon. Thomas Smisek, Mayor<br />
(A) Hon. Chuck Marks, Councilmember<br />
CITY OF DEL MAR<br />
Hon. Richard Earnest, Councilmember<br />
(A) Hon. Crystal Crawford, Deputy Mayor<br />
CITY OF EL CAJON<br />
Hon. Richard Ramos, Councilmember<br />
(A) Hon. Mark Lewis, Mayor<br />
CITY OF ENCINITAS<br />
Hon. Dennis Holz, Councilmember<br />
(A) Hon. Christy Guerin, Councilmember<br />
CITY OF ESCONDIDO<br />
Hon. Keith Beier, Mayor Pro Tem<br />
(A) Hon. June Rady, Councilmember<br />
CITY OF IMPERIAL B<strong>EA</strong>CH<br />
Hon. Diane Rose, Mayor<br />
(A) Hon. Mayda Winter, Councilmember<br />
(A) Hon. Patricia McCoy, Mayor Pro Tem<br />
CITY OF LA MESA<br />
Hon. Art Madrid, Mayor<br />
(A) Hon. Barry Jantz, Councilmember<br />
(A) Hon. Jay La Suer, Vice Mayor<br />
CITY OF LEMON GROVE<br />
Hon. Mary Sessom, Mayor<br />
(A) Hon. Jill Greer, Councilmember<br />
CITY OF NATIONAL CITY<br />
Hon. Ron Morrison, Councilmember<br />
(A) Hon. George H. Waters, Mayor<br />
CITY OF OC<strong>EA</strong>NSIDE<br />
Hon. Carol McCauley, Deputy Mayor<br />
(A) Hon. Colleen O’Harra, Councilmember<br />
CITY OF POWAY<br />
Hon. Don Higginson, Deputy Mayor<br />
(A) Hon. Mickey Cafagna, Mayor<br />
(A) Hon. Robert Emery, Councilmember<br />
CITY OF SAN DIEGO<br />
Hon. Susan Golding, Mayor<br />
(A) Hon. Byron Wear, Councilmember<br />
(A) Hon. Valerie Stallings, Councilmember<br />
CITY OF SAN MARCOS<br />
Hon. Hal Martin, Councilmember<br />
(A) Hon. Pia Harris-Ebert, Vice Mayor<br />
CITY OF SANTEE<br />
Hon. Jack Dale, Mayor<br />
(A) Hon. Hal Ryan, Vice Mayor<br />
(A) Hon. Jim Bartell, Councilmember<br />
CITY OF SOLANA B<strong>EA</strong>CH<br />
Hon. Marion Dodson, Councilmember<br />
(A) Hon. Joe Kellejian, Mayor<br />
(A) Hon. Marcia Smerican, Councilmember<br />
CITY OF VISTA<br />
Hon. Gloria E. McClellan, Mayor<br />
(A) Hon. Judy Ritter, Mayor Pro Tem<br />
COUNTY OF SAN DIEGO<br />
Hon. Pam Slater, Supervisor<br />
(A) Hon. Greg Cox, Supervisor<br />
STATE DEPARTMENT OF TRANSPORTATION<br />
(Advisory Member)<br />
JoÑe Medina, Director<br />
(A) Gary Gallegos, District 11 Director<br />
METROPOLITAN TRANSIT DEVELOPMENT BOARD<br />
(Advisory Member)<br />
NORTH SAN DIEGO COUNTY TRANSIT<br />
DEVELOPMENT BOARD<br />
(Advisory Member)<br />
U.S. DEPARTMENT OF DEFENSE<br />
(Liaison Member)<br />
CAPT Robert L. Phillips, CEC, USN<br />
Commander, Southwest Division<br />
Naval Facilities Engineering Command<br />
(A) CAPT Robert Schenk, CEC, USN<br />
SAN DIEGO UNIFIED PORT DISTRICT<br />
(Advisory Member)<br />
Jess Van Deventer, Commissioner<br />
SAN DIEGO COUNTY WATER AUTHORITY<br />
(Advisory Member)<br />
Frank Chenelle<br />
(A) John Fowler<br />
TIJUANA/BAJA CALIFORNIA/MEXICO<br />
(Advisory Member)<br />
Hon. Gabriela Torres Ramirez<br />
Consul General of Mexico<br />
Revised March 6, 2000
ACKNOWLEDGMENTS<br />
The San Diego <strong>Regional</strong> <strong>Beach</strong> <strong>Sand</strong> <strong>Project</strong> Final Environmental Impact Report/Review<br />
Environmental Assessment was prepared by K<strong>EA</strong> Environmental for SANDAG and the U.S.<br />
Navy. The Shoreline Erosion Committee advises SANDAG on coastal issues, and has guided<br />
the development of the <strong>Regional</strong> <strong>Beach</strong> <strong>Sand</strong> <strong>Project</strong>. The Shoreline Erosion Committee<br />
membership is:<br />
Hon. Ann Kulchin, Chair, City of Carlsbad<br />
Hon. Chuck Marks, City of Coronado<br />
Hon. Crystal Crawford, City of Del Mar<br />
Hon. James Bond, City of Encinitas<br />
Hon. Dan Malcolm, City of Imperial <strong>Beach</strong><br />
Hon. Colleen O’Hara, City of Oceanside<br />
Hon. Harry Mathis, City of San Diego<br />
Hon. Joe Kellejian, City of Solana <strong>Beach</strong><br />
Hon. Pam Slater, County of San Diego<br />
Comm. Jess Van Deventer, San Diego Unified Port District<br />
Dan Muslin, U.S. Navy<br />
The following staff of the San Diego Association of Governments participated in the<br />
environmental document process:<br />
Rob Rundle, Senior Planner, <strong>Project</strong> Manager<br />
Steve Sachs, Senior Planner<br />
Greg Smith, Intern<br />
The environmental document was prepared by:<br />
K<strong>EA</strong> Environmental<br />
MEC Analytical Systems<br />
Moffatt and Nichol Engineers<br />
GeoArch Marine Archaeology Consultants
FINAL ENVIRONMENTAL IMPACT REPORT (F<strong>EIR</strong>)/<br />
ENVIRONMENTAL ASSESSMENT (<strong>EA</strong>)<br />
FOR THE REGIONAL B<strong>EA</strong>CH SAND PROJECT<br />
SAN DIEGO REGION, CALIFORNIA<br />
Lead Agency for the <strong>EIR</strong>:<br />
Lead Agency for the <strong>EA</strong>:<br />
Title of Proposed Action:<br />
Affected Jurisdictions:<br />
San Diego Association of Governments (SANDAG)<br />
Department of the Navy<br />
<strong>Regional</strong> <strong>Beach</strong> <strong>Sand</strong> <strong>Project</strong><br />
Cities of Oceanside, Carlsbad, Encinitas, Solana <strong>Beach</strong>, Del Mar,<br />
San Diego, and Imperial <strong>Beach</strong>, all<br />
located in the State of California<br />
Designation:<br />
State Clearinghouse #: 1999041104<br />
Final <strong>EIR</strong>/<strong>EA</strong> Submitted Pursuant to Public Resources Code 21000 et seq.,<br />
14 California Code Regulations 15000 et seq., and 42 U.S.C. 4332(2)(C)<br />
ABSTRACT<br />
This joint <strong>EIR</strong>/<strong>EA</strong> has been prepared in accordance with California Environmental Quality Act (CEQA) and<br />
National Environmental Policy Act (NEPA) statutes and guidelines to dredge and place approximately 2<br />
million cubic yards (cy) of sand on a maximum of 13 receiver sites in the San Diego region. The local CEQA<br />
project evaluated in this <strong>EIR</strong>/<strong>EA</strong> is the proposed dredging and replenishment of up to 13 receiver sites with<br />
beach-quality sand. The NEPA federal action is necessary because a majority of the project’s funding<br />
derives from the federal government, as appropriated by Congress in fiscal year 1998 Supplemental<br />
Appropriations and Recission Act.<br />
The <strong>EIR</strong>/<strong>EA</strong> evaluates two alternatives. Alternative 1 would involve replenishment of 12 receiver sites using<br />
approximately 2 million cy of dredged sediment from six borrow sites. There would be two possible<br />
construction variations: (a) would occur on a 24-hour, 7-day per week schedule and (b) would occur with<br />
restrictions on construction times and days consistent with local noise ordinances, where applicable.<br />
Alternative 2 would involve replenishment of nine receiver sites using approximately 2 million cy of dredged<br />
sediment from six borrow sites (one of the receiver sites proposed under Alternative 2 is not proposed under<br />
Alternative 1). There would also be two possible construction variations as described for Alternative 1. Also<br />
evaluated is the No Action Alternative, in which no beach replenishment or dredging activities would be<br />
implemented. This <strong>EIR</strong>/<strong>EA</strong> analyzes potential environmental impacts relating to geology and soils, coastal<br />
wetlands, water resources, biological resources, cultural resources, land and water use, aesthetics,<br />
socioeconomics, public health and safety, structures and utilities, traffic, air quality, and noise. Although no<br />
long-term significant impacts are expected, a post-construction monitoring plan would be implemented to<br />
verify no significant impacts to marine biological resources, lagoons, and underwater archaeological<br />
resources.<br />
The SANDAG contact person is Rob Rundle, Senior <strong>Regional</strong> Planner, SANDAG, 401 B Street, Suite 800,<br />
San Diego, CA 92101-4231. Telephone: (619) 595-5649, fax: (619) 595-5305, and email:<br />
rru@sandag.cog.ca.us.
DATE: July 17, 2000<br />
TO:<br />
FROM:<br />
SUBJECT:<br />
Interested Agencies, Organizations, and Individuals<br />
SANDAG Staff<br />
Changes Incorporated into the Final Environmental Impact Report/Environmental<br />
Assessment (<strong>EIR</strong>/<strong>EA</strong>) for the San Diego <strong>Regional</strong> <strong>Beach</strong> <strong>Sand</strong> <strong>Project</strong> (RBSP)<br />
Following the public review period on the Draft <strong>EIR</strong>/<strong>EA</strong>, clarifications and corrections were made to the<br />
text of the Final <strong>EIR</strong>/<strong>EA</strong>. The following table identifies the locations of key changes to the text, tables and<br />
graphics and a brief description of the changes. Text changes in the Final <strong>EIR</strong>/<strong>EA</strong> are noted with a letter<br />
“R” in the margin. Note that some minor changes are not reflected in this table but are identified in the text<br />
margin. Copies of all the letters received by SANDAG regarding the Draft <strong>EIR</strong>/<strong>EA</strong> and the responses to<br />
the comments are found in Appendix G.<br />
Summary Table of Changes Made to the Final <strong>EIR</strong>/<strong>EA</strong> for the RBSP<br />
Location in Final <strong>EIR</strong><br />
Description<br />
Sections ES-1, ES-2, 1.1.1, 5.1 Expanded description of Shoreline Preservation Strategy (SANDAG 1993).<br />
Figures ES-2, ES-3, 2-1 and 2-2<br />
Remove SO-4 which was incorrectly shown on these figures.<br />
Sections ES-3, 1.3 and 2.4.1 Address schedule change from late summer 2000 to spring 2001.<br />
Sections ES-4, 1.3, 2.4.1, 3.6,<br />
3.10, and 4.10; Figure 2-11<br />
Sections ES-4, 2.4.1, 3.1 and 3.3;<br />
Figures 2-15 and 2-16; Tables<br />
ES-4, ES-5, and Table 2-5<br />
Sections ES-4 and 2.4.1<br />
Sections ES-5, 2.5 and 4.4.2;<br />
Table ES-7<br />
Sections ES-5 and 2.5.2<br />
Sections ES-5 and 2.5.1; Table<br />
ES-7<br />
Sections ES-5 and 2.5<br />
Sections ES-5 and 2.5<br />
Sections ES-5 and 2.5.1<br />
Table ES-7<br />
Table ES-7<br />
Revised map, land use description and impact for Del Mar receiver site since<br />
footprint moved approximately 300 feet to the south.<br />
Possible expansion of dredge area at SO-7 if SO-9 in and SO-6 not utilized.<br />
Revised description for the North Carlsbad receiver site since footprint moved<br />
approximately 35 feet to the riprap at the back of beach.<br />
Clarification that grunion monitoring would continue for at least 14 days, until<br />
the eggs hatch, and/or surveys show no subsequent spawning and identified<br />
the CDFG pamphlet to guide annual grunion run dates for monitoring.<br />
Expanded description of ongoing coastal monitoring program funded by<br />
SANDAG.<br />
Added text to guide reader to Section 2.4.1 regarding construction monitoring<br />
during dredge to address fishing gear compensation.<br />
Clarify that resource/regulatory agencies make the determination regarding<br />
need for mitigation based on review of monitoring reports.<br />
Clarify use of estimated sedimentation volumes in Appendix C for determining<br />
project impacts if monitoring results not clear and for negotiating funding.<br />
Expanded description of 401 certification requirements.<br />
Under Cultural Resources for Alternative 1A, added text to indicate that any<br />
known historic sites have been avoided by design.<br />
Under Land Use for Alternative 1a, clarified text to indicate no significiant<br />
long-term impacts “at the borrow sites.”<br />
Page 1 of 3
Location in Final <strong>EIR</strong><br />
Table ES-7<br />
Table ES-7<br />
Table ES-7<br />
Section 2.3.2<br />
Section 2.3.7<br />
Sections 2.4.1 and 2.7<br />
Section 2.4.1; Figure 2-20<br />
Section 2.5<br />
Section 2.5.1<br />
Section 2.5.4; Table 2.8<br />
Section 2.6<br />
Section 2.7<br />
Tables 2-8, 2-9, 2-10<br />
Table 2-11 (previously 2-10)<br />
Figure 2-15<br />
Figure 2-16<br />
Section 3.1.1<br />
Sections 3.1, 3.4<br />
Section 3.2<br />
Section 3.3<br />
Section 3.4<br />
Sections 3.4, 3.6, 4.4, 4.6<br />
Description<br />
Under Public Health and Safety for Alternative 1a, revised text to read<br />
“discharge” pipelines rather than “conveyor” pipelines.<br />
Under Traffic for Alternative 1a, added text to clarify that traffic and parking<br />
could increase after sand placement since beaches would become more<br />
attractive to recreational users.<br />
Under Air Quality for Alternatives 1a and 2a, expanded description of General<br />
Conformity threshold values.<br />
New section added regarding possible onshore sources of sand and the<br />
reasons for their elimination.<br />
Expanded by adding estimated cost for extending north jetty at Agua<br />
Hedionda Lagoon.<br />
Finalize permit requirements for North Carlsbad site per historic mean high tide<br />
line determination and changes to be made in final design.<br />
Further clarification regarding design features to avoid indirect impacts to<br />
CDFG artificial reefs from vessel transiting. Clarification on beach building<br />
method at cobble receiver sites. Expand description of dredge operation<br />
characteristics. Modify discharge pipe placement near Tijuana Slough National<br />
Wildlife Refuge.<br />
Expanded text on the discussion of the annual lagoon monitoring program.<br />
Clarify duration/frequency of turbidity monitoring.<br />
Added new section and table with a summary of all project design features,<br />
monitoring commitments and possible mitigation measures.<br />
Added text regarding the environmentally superior alternative.<br />
Expanded text for the coastal permit process.<br />
Added new Table 2-8 so these become 2-9, 2-10 and 2-11 respectively.<br />
Changed permits required to reflect no permits necessary from City of<br />
Carlsbad.<br />
Added four inshore artificial reefs at Oceanside Artificial Reef No. 2. Decrease<br />
dredge area at SO-9 to provide 350' buffer from relocated experimental rock<br />
scatter.<br />
Modify discharge line placement to avoid crossing artificial reefs near SO-7.<br />
Defined “critical erosion areas” per the USACOE CCSTWS study.<br />
Describe previously unknown scattered rock reef experiment at SO-9 as that<br />
had not been relocated following placement, was not mapped by CDFG.<br />
Text added to discussion of Buena Vista, Agua Hedionda, and Batiquitos<br />
Lagoons regarding tidewater goby and light-footed clapper rail, plus correct<br />
Batiquitos Lagoon description after enhancement project.<br />
Clarified section and tables in Appendix D where more water quality analysis<br />
could be located and added text to guide reader to locations in the <strong>EIR</strong>/<strong>EA</strong><br />
where methods of water quality and sediment sampling were described.<br />
Corrected nesting season for western snowy plover. Added text discussing<br />
W-2 plover nesting colony at Batiquitos. Expanded discussion of nesting<br />
behavior of western snowy plover. Expanded discussion on sand depth<br />
measurement techniques.<br />
Added location and description of Encinitas City Marine Life Reserve and<br />
evaluated potential impacts.<br />
Page 2 of 3
Location in Final <strong>EIR</strong><br />
Section 3.5<br />
Section 3.6<br />
Sections 3.10 and 4.10<br />
Section 3.12<br />
Section 4.0<br />
Sections 4.1 through 4.13<br />
Section 4.1<br />
Section 4.3<br />
Section 4.4<br />
Section 4.4<br />
Section 4.4<br />
Section 4.6<br />
Section 4.12<br />
Section 7.0<br />
Appendix A<br />
Description<br />
Described scattered rock at SO-9 and clarified they were not historic resources.<br />
Expand description of artificial reefs at SO-7. Clarified language regarding the<br />
San Diego Unified Port District and sovereign lands at the Imperial <strong>Beach</strong><br />
receiver site. Clarified language regarding sovereign lands granted to the City<br />
of San Diego at the MB-1 borrow site.<br />
The description for access at the Del Mar receiver site was revised to<br />
acknowledge two ramps.<br />
Provided table with General Conformity thresholds.<br />
Added matrix to explain relationship between alternatives in <strong>EIR</strong>/<strong>EA</strong> and<br />
various technical reports.<br />
Analysis of potential impacts associated with spring construction start date<br />
instead of late summer.<br />
Additional text added to expand discussion on the effects of sand loss with<br />
regard to timing of sand replenishment activities. New Table 4.1-2 added.<br />
Description of why turbidity plume calculations are worst-case. Incorporation<br />
of turbidity analysis with combined effects from receiver and borrow site<br />
activity.<br />
Clarification regarding surfgrass significance criteria and method of<br />
significance determination. Expanded discussion of potential turbidity impacts<br />
to foraging California least tern during spring nesting season and to plover<br />
foraging.<br />
Added impacts of dredging if SO-7 is expanded and SO-9/SO-6 are eliminated.<br />
Expanded description of potential impacts to artificial reefs at SO-7.<br />
The discussion under SO-9 was revised to increase the number of artificial<br />
reefs from 8 to 12.<br />
Clarification regarding dredge vessel and pump ARB Registration replacing<br />
Permit to Operate and Authority to Construct. Disclosed dredge and slurry<br />
engine emissions.<br />
Incorporate two agency meetings during public review period for the Draft<br />
<strong>EIR</strong>/<strong>EA</strong>.<br />
Description of federal requirements requiring analysis of Essential Fish Habitat<br />
and agreement between National Marine Fisheries Service and US Navy,<br />
Southwest Division regarding process for satisfying requirements.<br />
99069\List-of-edits Memo.wpd<br />
Page 3 of 3
Acronyms and Abbreviations<br />
ACRONYMS AND ABBREVIATIONS<br />
APCD<br />
APE<br />
ARB<br />
ATS&F<br />
San Diego Air Pollution Control District<br />
area of potential effect<br />
Air Resources Board<br />
Amtrak/Coaster<br />
B.P.<br />
BOZ<br />
before present<br />
<strong>Beach</strong> Overlay Zone<br />
CCD Coastal Consistency Determination<br />
CCSTWS Coast of California Storm and Tidal Waves Study<br />
CEQ Council on Environmental Quality<br />
CEQA California Environmental Quality Act of 1970<br />
CNEL Community Noise Equivalent Level<br />
CO carbon monoxide<br />
CSLC California State Lands Commission<br />
cy<br />
cubic yards<br />
dB<br />
DGPS<br />
DoD<br />
DON<br />
decibels<br />
Differential Global Positioning System<br />
Department of Defense<br />
Department of the Navy<br />
<strong>EA</strong><br />
EFH<br />
<strong>EIR</strong>/<strong>EA</strong><br />
EIS<br />
ER-L<br />
ER-M<br />
Environmental Assessment<br />
Essential Fish Habitat<br />
Environmental Impact Report/Environmental Assessment<br />
Environmental Impact Statement<br />
Effects Range-Low<br />
Effects Range-Median<br />
FMP<br />
FONSI<br />
Fisheries Management Plan<br />
Finding of No Significant Impact<br />
<strong>Regional</strong> <strong>Beach</strong> <strong>Sand</strong> <strong>Project</strong> <strong>EIR</strong>/<strong>EA</strong><br />
99-69\sect-toc.wpd 7/17/00<br />
Page i
Acronyms and Abbreviations<br />
GENESIS<br />
GIS<br />
Generalized Model for Simulating Shoreline Change<br />
Geographic Information System<br />
HDPE<br />
HDPE The line may be a combination of plastic<br />
LCP<br />
L dn or DNL<br />
LUP<br />
Local Coastal Program<br />
Day-Night Average noise level<br />
Land Use Plan<br />
MBAR<br />
MCB<br />
mg/l<br />
MLLW<br />
MMS<br />
MSL<br />
Mission Bay Artificial Reef<br />
Unites States Marine Corps Base<br />
milligrams per liter<br />
mean lower low water<br />
Mineral Management Service<br />
mean sea level<br />
NAAQS national ambient air quality standards<br />
Navy Department of the Navy<br />
NEPA National Environmental Policy Act of 1969<br />
NHPA National Historic Preservation Act<br />
NMFS National Marine Fisheries Service<br />
NO 2 nitrogen dioxide<br />
NOAA National Oceanographic and Atmospheric Administration<br />
NOP Notice of Preparation<br />
NO x oxides of nitrogen<br />
NRHP National Register of Historic Places<br />
NTU national turbidity units<br />
O 3<br />
ozone<br />
PAHs<br />
Pb<br />
PCBs<br />
PM 10<br />
polycyclic aromatic hydrocarbons<br />
lead<br />
polychlorinated biphenyls<br />
particulate matter equal to or less than 10 microns in size<br />
Page ii<br />
<strong>Regional</strong> <strong>Beach</strong> <strong>Sand</strong> <strong>Project</strong> <strong>EIR</strong>/<strong>EA</strong><br />
99-69\sect-toc.wpd 7/17/00
Acronyms and Abbreviations<br />
PM 2.5<br />
ppm<br />
ppt<br />
fine particulate matter equal to or less than 2.5 microns in size<br />
parts per million<br />
parts per thousand<br />
RAQS<br />
RONA<br />
ROV<br />
RWQCB<br />
<strong>Regional</strong> Air Quality Strategies<br />
Record of Non-Applicability<br />
remotely operated vehicle<br />
<strong>Regional</strong> Water Quality Control Board<br />
SANDAG<br />
SCE<br />
SDAB<br />
SDUPD<br />
SEC<br />
SIP<br />
SO 2<br />
SONGS<br />
SPCC<br />
SWPPP<br />
San Diego Association of Governments<br />
Southern California Edison<br />
San Diego Air Basin<br />
San Diego Unified Port District<br />
Shoreline Erosion Committee<br />
State Implementation Plan<br />
sulfur dioxide<br />
San Onofre Nuclear Generating Station<br />
Spill Prevention Control and Counter-Measure Plan<br />
Stormwater Pollution Prevention Plan<br />
TIN<br />
triangulated irregular network<br />
USACOE<br />
USEPA<br />
USFWS<br />
U.S. <strong>Army</strong> Corps of Engineers<br />
U.S. Environmental Protection Agency<br />
U.S. Fish and Wildlife Service<br />
VOC<br />
[µm]<br />
volatile organic compounds<br />
microns<br />
<strong>Regional</strong> <strong>Beach</strong> <strong>Sand</strong> <strong>Project</strong> <strong>EIR</strong>/<strong>EA</strong><br />
99-69\sect-toc.wpd 7/17/00<br />
Page iii
Executive Summary<br />
EXECUTIVE SUMMARY<br />
ES-1<br />
INTRODUCTION/BACKGROUND<br />
This joint Environmental Impact Report/Environmental Assessment (<strong>EIR</strong>/<strong>EA</strong>) addresses the potential<br />
environmental consequences of the <strong>Regional</strong> <strong>Beach</strong> <strong>Sand</strong> <strong>Project</strong> which proposes dredging and placement<br />
of sand on numerous potential receiver sites in the San Diego region. This document has been prepared<br />
jointly by the San Diego Association of Governments (SANDAG) (local lead agency) and the U.S.<br />
Department of the Navy (federal lead agency) in accordance with the California Environmental Quality Act<br />
of 1970 (CEQA) statutes (Cal. Pub. Res. Code, § 21000 et seq., as amended) and implementing<br />
guidelines (Cal. Code Regs., Title 14, § 15000 et seq. (1998)); the National Environmental Policy Act of<br />
1969 (NEPA) (42 U.S.C. § 4332 (1994)) in accordance with the Council on Environmental Quality<br />
(CEQ) regulations implementing NEPA (40 C.F.R. §§1500-1508); and U.S. Navy regulations<br />
implementing NEPA (32 C.F.R. Part 775).<br />
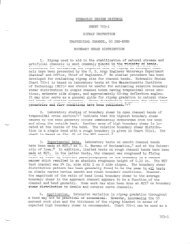
The proposed action is to replenish approximately 2 million cubic yards (cy) of clean beach-quality sand<br />
on up to 13 receiver sites in the San Diego region. The receiver sites are located from Oceanside in the<br />
north to Imperial <strong>Beach</strong> in the south. <strong>Sand</strong> would be dredged from up to six offshore borrow sites. A<br />
regional location map, including the proposed receiver sites and sand borrow sites, is shown in Figure ES-<br />
1.<br />
In 1993, SANDAG prepared the Shoreline Preservation Strategy for the San Diego Region, which<br />
identified regional coastal areas with critical shoreline problems and recommended a strategy to address<br />
the issue. That strategy involved various components including beach replenishment, sand retention<br />
structures, property protection structures, and policies regarding the use of the shoreline and bluff tops.<br />
Independent of that report, the Navy began to analyze a separate action in the Final Environmental<br />
Impact Statement (EIS) for the Development of Facilities in San Diego/ Coronado to Support the<br />
Homeporting of One NIMITZ Class Aircraft Carrier (Department of the Navy 1995). In order to<br />
accommodate the carrier, the Navy proposed to dredge the carrier berthing area, turning basin, and the<br />
San Diego Bay navigation channel. A portion of the dredged sediment was initially believed to be suitable<br />
for beach replenishment. As one option to dispose of the dredged material from the Homeporting project,<br />
the Navy evaluated nine beach receiver sites in the San Diego region in that EIS.<br />
R<br />
R<br />
<strong>Regional</strong> <strong>Beach</strong> <strong>Sand</strong> <strong>Project</strong> <strong>EIR</strong>/<strong>EA</strong><br />
99-69\SANDAG <strong>EIR</strong><strong>EA</strong> es.wpd 7/17/00<br />
Page ES-1
Executive Summary<br />
The Navy subsequently prepared two <strong>EA</strong>s as tiered analyses to the EIS due to subsequent changes in the<br />
location of beach receiver sites. These two <strong>EA</strong>s are Environmental Assessment for <strong>Beach</strong><br />
Replenishment at South Oceanside and Cardiff/Solana <strong>Beach</strong>, California (Department of the Navy<br />
1997a) and Environmental Assessment for <strong>Beach</strong> Replenishment at North Carlsbad, South Carlsbad,<br />
Encinitas, and Torrey Pines (Department of the Navy 1997b). As a result of the Homeporting project<br />
and subsequent <strong>EA</strong>s, permits were issued to the Navy to place approximately 5.5 million cy of sand<br />
dredged from San Diego Bay, both onshore and nearshore, at 11 receiver sites along the San Diego region<br />
coastline (Table ES-1). During beach replenishment in Oceanside, however, munitions were found in the<br />
dredged materials from San Diego Bay and beach replenishment efforts were halted. Prior to the halting<br />
of the beach replenishment disposal, approximately 284,000 cy of sediment were placed on three receiver<br />
sites; specifically, Oceanside, Del Mar, and Mission <strong>Beach</strong>. Oceanside received 102,000 cy (onshore),<br />
Del Mar received 170,000 cy (nearshore), and Mission <strong>Beach</strong> received 12,000 cy (nearshore).<br />
Table ES-1<br />
Comparison of <strong>Sand</strong> Replenishment for<br />
Navy Homeporting <strong>Project</strong> and San Diego <strong>Regional</strong> <strong>Beach</strong> <strong>Sand</strong> <strong>Project</strong><br />
Receiver site<br />
Homeporting <strong>Project</strong><br />
(cubic yards)<br />
<strong>Regional</strong> <strong>Beach</strong> <strong>Sand</strong> <strong>Project</strong> (1)<br />
(cubic yards)<br />
Oceanside Onshore 1,044,298 Onshore 380,000<br />
Carlsbad<br />
Encinitas<br />
North Carlsbad Onshore 445,526 Onshore 240,000<br />
South Carlsbad, North Onshore 251,164 Onshore 160,000<br />
South Carlsbad, South Onshore 503,080 Onshore 0<br />
Batiquitos 0 Onshore 118,000<br />
Leucadia 0 Onshore 130,000<br />
Moonlight <strong>Beach</strong> 0 Onshore 88,000<br />
Cardiff Onshore 283,501 Onshore 104,000<br />
Solana <strong>Beach</strong> Onshore 178,227 Onshore 140,000<br />
Del Mar Nearshore 450,027 Onshore 180,000<br />
Torrey Pines<br />
Torrey Pines North Onshore 296,172 Onshore 0<br />
Torrey Pines South Onshore 230,359 Onshore 240,000<br />
Mission <strong>Beach</strong> Nearshore 860,051 Onshore 100,000<br />
Imperial <strong>Beach</strong> Nearshore 915,665 Onshore 120,000<br />
Total 5,458,070 2,000,000 (1)<br />
(1)<br />
Reflects quantity of sand based on Alternative 1. One other alternative analyzed in detail in this <strong>EIR</strong>/<strong>EA</strong><br />
would result in a maximum of 2.04 million cy of sand to be replenished with fewer receiver sites and a greater<br />
amount of material at some remaining sites.<br />
Page ES-2<br />
<strong>Regional</strong> <strong>Beach</strong> <strong>Sand</strong> <strong>Project</strong> <strong>EIR</strong>/<strong>EA</strong><br />
99-69\SANDAG <strong>EIR</strong><strong>EA</strong> es.wpd 7/17/00
4.0 Environmental Consequences<br />
B<strong>EA</strong>CH REPLENISHMENT SITES<br />
OFFSHORE BORROW SITES<br />
SAND DELIVERY PIPELINES<br />
SAN DIEGO<br />
COUNTY<br />
Source: SANDAG<br />
Figure ES-1<br />
<strong>Regional</strong> Location Map<br />
NORTH<br />
<strong>Regional</strong> <strong>Beach</strong> <strong>Sand</strong> <strong>Project</strong> <strong>EIR</strong>/<strong>EA</strong><br />
9969 SANDAG <strong>Beach</strong> Replenishment/Figures/Fig ES-1 Reg Loc map 9/15/99<br />
Page ES-3
Executive Summary<br />
The proposed <strong>Regional</strong> <strong>Beach</strong> <strong>Sand</strong> <strong>Project</strong> proposes placement of less total material (2 million vs. 5.5<br />
million cy) over generally the same receiver sites as the Navy’s permitted project. The proposed project<br />
does differ in that the sand source has changed from dredged material in San Diego Bay to dredged<br />
material from six offshore borrow sites, and additional receiver site locations have been added. Table ES-1<br />
provides a comparison between the Homeporting project which was permitted and partially implemented,<br />
and the alternative under the <strong>Regional</strong> <strong>Beach</strong> <strong>Sand</strong> <strong>Project</strong> with the maximum number of receiver sites.<br />
ES-2<br />
PURPOSE AND NEED<br />
The purpose of the proposed beach replenishment project is to replenish beaches in accordance with the<br />
request submitted to the Navy by SANDAG’s Shoreline Erosion Committee (SEC) in 1996. The 1993<br />
Shoreline Preservation Strategy for the San Diego Region (SANDAG 1993) identified regional coastal<br />
areas with critical shoreline erosion problems. The Shoreline Preservation Strategy is a strategy with a<br />
menu of solutions to address shoreline erosion including beach building by placing large amounts of sand<br />
on eroded beaches, structures such as groin fields to help hold sand in place, structures such as seawalls<br />
and sand berms to protect property, and policies and regulations regarding the use of the shoreline and its<br />
development such as bluff top building setbacks. Further, these tactics are divided into regional scale<br />
actions (beach building, redistributing sand via groins, breakwaters, etc.) and local scale methods (requiring<br />
setbacks, bluff top erosion management via irrigation controls, seawalls and revetments). The SEC has<br />
used this strategy as a basis for identifying up to 13 receiver sites which have experienced erosion and need<br />
replenishment. The proposed action would provide immediate benefit by placing suitable beach fill directly<br />
onto the region’s beaches rather than placing some of it in the nearshore zone. The proposed action would<br />
serve four main functions: 1) to replenish the three littoral cells and receiver sites with suitable beach sand;<br />
2) to provide enhanced recreational opportunities and access at the receiver sites; 3) to enhance the tourism<br />
potential of the San Diego region; and 4) to increase protection of public property and infrastructure.<br />
R<br />
R<br />
R<br />
R<br />
R<br />
R<br />
R<br />
As the project has evolved, it has become apparent that predicting sand movement in the highly dynamic<br />
ocean system is difficult. Another project feature is to establish replenishment sites which can be useful in<br />
evaluating the predictions of the state-of-the-art modeling used in this process and thereby assist with any<br />
future beach replenishment efforts in the region.<br />
ES-3<br />
PROPOSED ACTION<br />
The proposed action is beach replenishment of the San Diego region’s eroding beaches using<br />
approximately 2 million cy of dredged sediment from six offshore borrow sites. The project was originally<br />
R<br />
Page ES-4<br />
<strong>Regional</strong> <strong>Beach</strong> <strong>Sand</strong> <strong>Project</strong> <strong>EIR</strong>/<strong>EA</strong><br />
99-69\SANDAG <strong>EIR</strong><strong>EA</strong> es.wpd 7/17/00
Executive Summary<br />
scheduled to start in late summer 2000. The schedule has since been modified to spring 2000 based on<br />
the recommendation of the SEC at their May 2000 meeting. The Draft <strong>EIR</strong>/<strong>EA</strong> evaluated a possible<br />
construction schedule of late summer/early fall. Both construction schedules are now addressed in Chapter<br />
4.0. Based on the recommendation of the SEC, one replenishment action would involve up to 12 receiver R<br />
sites using dredged sediment from six borrow sites. This is the SEC’s preferred alternative. This document<br />
also evaluates, at an equal level of detail, one possible alternative for replenishment at nine receiver sites<br />
and the same six offshore borrow sites. Between the two alternatives, a total of 13 receiver sites are<br />
proposed. Most of the 13 possible receiver sites are within suburban areas of the San Diego region and<br />
are bordered by residential, commercial, or light industrial uses. All or portions of the beaches in Carlsbad,<br />
Encinitas, and San Diego are State <strong>Beach</strong>es. All of the proposed borrow sites are surrounded by ocean<br />
water; the primary recreational activities occurring nearby are boating, sailing, and diving pursuits.<br />
R<br />
R<br />
R<br />
ES-4<br />
ALTERNATIVES<br />
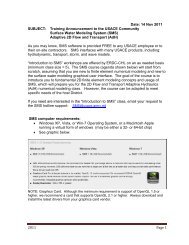
Based on the thorough alternatives evaluation process completed to date, two alternatives were selected<br />
for detailed evaluation in this <strong>EIR</strong>/<strong>EA</strong>. Both would result in placement of approximately 2 million cy of sand<br />
along the San Diego region coastline. Table ES-2 illustrates the sand quantities at each beach receiver site<br />
under both alternatives and the borrow site which would provide material for each receiver site. Figures<br />
ES-2 and ES-3 illustrate the receiver sites associated with each alternative<br />
Additionally, there are two possible construction variations – one involves the potential for construction<br />
seven days a week, 24 hours a day (7/24) and the other involves some restrictions on construction times<br />
and days consistent with local noise ordinances, where applicable. These two construction schedules are<br />
addressed as variations (a) and (b) for each alternative. The vast majority of dredge operations utilize a<br />
7/24 time frame to increase efficiency, maximize sand replenishment at each receiver site, and minimize<br />
cost. Given the fixed budget for this project, any increase in construction cost would translate to a<br />
decrease in sand volume placed at each receiver site. Generally, adherence to applicable noise ordinances<br />
would result in construction duration increasing 30 percent and the volume of sand reducing by up to 50<br />
percent. Finally, the No Action Alternative is evaluated.<br />
A more detailed description of the individual receiver sites under each alternative is provided below.<br />
<strong>Regional</strong> <strong>Beach</strong> <strong>Sand</strong> <strong>Project</strong> <strong>EIR</strong>/<strong>EA</strong><br />
99-69\SANDAG <strong>EIR</strong><strong>EA</strong> es.wpd 7/17/00<br />
Page ES-5
X.X Section Name<br />
SO-9<br />
South<br />
Oceanside<br />
(380,000 cy)<br />
North Carlsbad<br />
(240,000 cy)<br />
South Carlsbad North<br />
(160,000 cy)<br />
SO-7<br />
SO-6<br />
SO-5<br />
SO-4<br />
Batiquitos (118,000 cy)<br />
Leucadia (130,000 cy)<br />
Moonlight <strong>Beach</strong> (88,000 cy)<br />
Cardiff (104,000 cy)<br />
Solana <strong>Beach</strong><br />
(140,000 cy)<br />
Del Mar<br />
(180,000 cy)<br />
Torrey Pines<br />
(240,000 cy)<br />
Mission <strong>Beach</strong><br />
(100,000 cy)<br />
MB-1<br />
OFFSHORE BORROW SITE<br />
ONSHORE RECEIVER SITE<br />
SO:<br />
MB:<br />
SOUTH OC<strong>EA</strong>NSIDE LITTORAL CELL BORROW SITE<br />
MISSION B<strong>EA</strong>CH LITTORAL CELL BORROW SITE<br />
SS-1<br />
Imperial <strong>Beach</strong><br />
(120,000 cy)<br />
SS:<br />
SILVER STRAND LITTORAL CELL BORROW SITE<br />
Source: DoN 1993<br />
NORTH<br />
CALIF<br />
PROJECT LOCATION<br />
Figure ES-2<br />
Alternative 1<br />
Borrow and Receiver Sites<br />
<strong>Regional</strong> <strong>Beach</strong> <strong>Sand</strong> <strong>Project</strong> <strong>EIR</strong>/<strong>EA</strong><br />
9969 SANDAG <strong>Beach</strong> Replenishment\Figures\Fig ES-2 Sites 1/11/00<br />
Page ES-6
X.X Section Name<br />
South<br />
Oceanside<br />
(570,000 cy)<br />
SO-9<br />
South Carlsbad North<br />
(218,000 cy)<br />
South Carlsbad South<br />
(142,000 cy)<br />
SO-7<br />
SO-6<br />
SO-5<br />
SO-4<br />
Cardiff<br />
(104,000 cy)<br />
Solana <strong>Beach</strong><br />
(140,000 cy)<br />
Del Mar<br />
(180,000 cy)<br />
Torrey Pines<br />
(360,000 cy)<br />
Mission <strong>Beach</strong><br />
(150,000 cy)<br />
MB-1<br />
OFFSHORE BORROW SITE<br />
ONSHORE RECEIVER SITE<br />
SO:<br />
MB:<br />
SOUTH OC<strong>EA</strong>NSIDE LITTORAL CELL BORROW SITE<br />
MISSION B<strong>EA</strong>CH LITTORAL CELL BORROW SITE<br />
SS-1<br />
Imperial <strong>Beach</strong><br />
(180,000 cy)<br />
SS:<br />
SILVER STRAND LITTORAL CELL BORROW SITE<br />
Source: DoN 1993<br />
NORTH<br />
CALIF<br />
PROJECT LOCATION<br />
Figure ES-3<br />
Alternative 2<br />
Borrow and Receiver Sites<br />
Page ES-7<br />
<strong>Regional</strong> <strong>Beach</strong> <strong>Sand</strong> <strong>Project</strong> <strong>EIR</strong>/<strong>EA</strong><br />
9969 SANDAG <strong>Beach</strong> Replenishment\Figures\Fig ES-3 Sites 1/11/00
Executive Summary<br />
Table ES-2<br />
<strong>Sand</strong> Quantities Proposed Under Each Alternative<br />
Receiver Site<br />
Borrow Site<br />
Alternative 1<br />
(cubic yards)<br />
Alternative 2<br />
(cubic yards)<br />
Oceanside<br />
380,000 570,000<br />
SO-9<br />
North Carlsbad 240,000 —<br />
South Carlsbad North<br />
160,000 218,000<br />
South Carlsbad South — 142,000<br />
Batiquitos SO-7<br />
118,000 —<br />
Leucadia 130,000 —<br />
Moonlight <strong>Beach</strong> 88,000 —<br />
Cardiff SO-6 104,000 104,000<br />
Solana <strong>Beach</strong><br />
140,000 140,000<br />
Del Mar SO-5<br />
180,000 180,000<br />
Torrey Pines 240,000 360,000<br />
Mission <strong>Beach</strong> MB-1 100,000 150,000<br />
Imperial <strong>Beach</strong> SS-1 120,000 180,000<br />
Total 2,000,000 2,044,000<br />
Alternative 1<br />
Alternative 1 would involve beach replenishment with approximately 2 million cy of sand to be deposited<br />
at 12 receiver sites. Table ES-3 shows the sand quantities at each receiver site under both production<br />
scenarios.<br />
Alternative 1a<br />
Receiver Sites<br />
<strong>Beach</strong> replenishment at South Oceanside would involve onshore placement of sand from just south of<br />
Forster Street to Kelly Street for a total length of approximately 4,100 feet (0.8 mile). Dredged sediment<br />
would be placed on the existing sand beach and graded to form a berm. The top of the berm would be<br />
constructed to an elevation of approximately 13 feet above mean lower low water (MLLW, which is the<br />
average of the lower low water height of each tidal day observed over time) and would be flat and 135 feet<br />
Page ES-8<br />
<strong>Regional</strong> <strong>Beach</strong> <strong>Sand</strong> <strong>Project</strong> <strong>EIR</strong>/<strong>EA</strong><br />
99-69\SANDAG <strong>EIR</strong><strong>EA</strong> es.wpd 7/17/00
Executive Summary<br />
wide. The beach fill would then extend seaward approximately 250 feet at a slope of 20:1 (horizontal<br />
distance:vertical distance).<br />
Table ES-3<br />
Alternative 1 – Schedule and Production<br />
Borrow<br />
Site<br />
SO-9<br />
SO-7<br />
Receiver<br />
Site<br />
Alternative 1a<br />
(Assumes 7-day/24-hour work schedule)<br />
Quantity<br />
(cy)<br />
Replenishment<br />
Site<br />
Construction (1)<br />
(estimated<br />
days)<br />
Duration of<br />
Pipeline<br />
Activity (2)<br />
(estimated<br />
days)<br />
Quantity<br />
(cy)<br />
Alternative 1b<br />
(Adheres to Noise Ordinances) (3)<br />
Replenishmen<br />
t Site<br />
Construction (1)<br />
(estimated<br />
days)<br />
Duration<br />
of Pipeline<br />
Activity (2)<br />
(estimated<br />
days)<br />
Applicable<br />
Noise<br />
Ordinance?<br />
S. Oceanside 380,000 30<br />
190,000 44<br />
Yes<br />
N. Carlsbad 240,000 20<br />
50<br />
120,000 30<br />
74<br />
Yes<br />
S. Carlsbad N. 160,000 15<br />
160,000 15<br />
No<br />
S. Carlsbad S. n/a 0<br />
15<br />
0 0<br />
15<br />
No<br />
Batiquitos 118,000 12<br />
118,000 12<br />
Leucadia 130,000 13 35 130,000 13 35<br />
No<br />
Moonlight 88,000 10 88,000 10 No<br />
SO-6 Cardiff 104,000 11 11 104,000 11 11 No<br />
SO-5<br />
Solana <strong>Beach</strong> 140,000 13 13 70,000 18 18 Yes<br />
Del Mar 180,000 16<br />
90,000 24<br />
Yes<br />
Torrey Pines 240,000 20<br />
36<br />
120,000 28<br />
52<br />
Yes (4)<br />
MB-1 Mission <strong>Beach</strong> 100,000 11 11 50,000 16 16 Yes<br />
SS-1<br />
Imperial<br />
<strong>Beach</strong><br />
120,000 12 12 60,000 18 18 Yes<br />
Total 2,000,000 183 183 1,300,000 239 239<br />
Average Production Rate 15,000 cy/day 5,000 cy/day<br />
No<br />
Assumptions: Noise limits would allow only one shift of production per day (instead of three) with no construction on Sundays or<br />
holidays. Production would take three times longer. Production rates are average and similar for any type of dredge equipment.<br />
(1)<br />
Includes 2 to 4 days for mobilization prior to sand placement and 2 to 4 days for demobilization post placement, depending on<br />
borrow source.<br />
(2)<br />
Maximum number of working days pipeline would be on the beach where a single borrow site serves more than one receiver site.<br />
(3)<br />
Assumes a working schedule from 7:00 a.m. to 7:00 p.m. Monday through Friday, limited working hours on Saturday, and no<br />
working hours on Sundays and holidays.<br />
(4)<br />
The Torrey Pines conveyance plan includes use of Del Mar’s beach for pipeline conveyance of sand and a booster pump would be<br />
necessary. The use of the City of Del Mar’s beach for this purpose may necessitate conformance with the City of Del Mar noise<br />
ordinance even though the Torrey Pines receiver site is within State Park’s jurisdiction.<br />
<strong>Beach</strong> replenishment at North Carlsbad would involve onshore placement of sand from just south of the<br />
Buena Vista Lagoon to south of Carlsbad Village Drive (Elm Avenue), a distance of approximately 3,000<br />
feet (0.6 mile). Dredged sediment would be placed on the existing sand beach and graded to form a berm.<br />
<strong>Regional</strong> <strong>Beach</strong> <strong>Sand</strong> <strong>Project</strong> <strong>EIR</strong>/<strong>EA</strong><br />
99-69\SANDAG <strong>EIR</strong><strong>EA</strong> es.wpd 7/17/00<br />
Page ES-9
Executive Summary<br />
The top of the berm would be constructed to an elevation of approximately 12 feet above MLLW and<br />
would be flat, with a width of approximately 150 feet. The beach fill would then slope seaward<br />
approximately 150 feet at a slope of 10:1. The North Carlsbad receiver site would be moved back<br />
approximately 35 feet to the rip-rap at the back of the beach during final design.<br />
R<br />
R<br />
<strong>Beach</strong> replenishment at the South Carlsbad North site would consist of the placement of dredged sediment<br />
near the Palomar Airport Road intersection with Carlsbad Boulevard, stretching to the south for 2,100 feet<br />
(0.4 mile) near the Encinas Creek outlet. A berm would be constructed to an elevation of approximately<br />
12 feet above MLLW. The berm would be flat with a width of approximately 170 feet. The beach fill<br />
would then slope seaward approximately 100 feet at a slope of 10:1.<br />
<strong>Beach</strong> replenishment at Batiquitos would involve the placement of dredged sediment from a point<br />
approximately 850 feet south of the Batiquitos Lagoon, into the community of Leucadia and Leucadia State<br />
<strong>Beach</strong>, a distance of approximately 1,390 feet (0.3 mile). The northern part of the site is known as<br />
“Ponto.” A berm would be constructed to an elevation of approximately 12 feet above MLLW and would<br />
have a width of approximately 110 feet. The beach fill would then slope seaward approximately 375 feet<br />
at a slope of 20:1.<br />
The Leucadia beach fill plan would include creation of a berm of approximately 12 feet above MLLW,<br />
extending seaward approximately 70 feet. The top of the berm would be flat. The beach fill would then<br />
slope seaward approximately 125 feet at a slope of 10:1. The proposed receiver site at the Leucadia site<br />
extends approximately 2,700 feet (0.5 mile) from just south of the Grandview access stairs to Glaucus<br />
Street.<br />
The Moonlight <strong>Beach</strong> receiver site’s berm would be constructed to a height of approximately 12 feet above<br />
MLLW. The beach fill would be relatively flat and would extend seaward approximately 130 feet seaward<br />
and would then slope seaward at a slope of 20:1. Toward the north, the slope would extend approximately<br />
150 feet, while at the southern part of the berm, the slope would extend approximately 250 feet. The<br />
proposed receiver site would be approximately 770 feet (0.1 mile) long.<br />
<strong>Beach</strong> replenishment at the Cardiff site would consist of the placement of dredged sediment along 780 feet<br />
(0.1 mile) of Cardiff State <strong>Beach</strong> south of the San Elijo Lagoon inlet and Restaurant Row. A berm would<br />
be constructed at this location to an elevation of approximately 12 feet above MLLW. The beach fill would<br />
be flat and extend seaward approximately 115 feet. The beach fill would then slope seaward<br />
approximately 350 feet at a slope of 20:1.<br />
Page ES-10<br />
<strong>Regional</strong> <strong>Beach</strong> <strong>Sand</strong> <strong>Project</strong> <strong>EIR</strong>/<strong>EA</strong><br />
99-69\SANDAG <strong>EIR</strong><strong>EA</strong> es.wpd 7/17/00
Executive Summary<br />
<strong>Beach</strong> replenishment at the Solana <strong>Beach</strong> site would consist of the placement of dredged sediment along<br />
approximately 1,800 feet (0.3 mile) of the beach. The northern boundary of the proposed fill site starts just<br />
south of Fletcher Cove and extends southward. A berm would be constructed at this location to an<br />
elevation of approximately 12 feet above MLLW. The berm would be flat and extend seaward<br />
approximately 100 feet. The beach fill would then slope seaward approximately 135 feet at a slope of<br />
10:1.<br />
The berm at Del Mar’s receiver site would be built to a height of approximately 11 feet above MLLW and<br />
would extend seaward approximately 170 feet. The beach fill would then slope seaward approximately R<br />
150 feet at a slope of 10:1. The receiver site extends from just north of 27 th Street to Powerhouse Park, R<br />
a distance of approximately 3,110 feet (0.6 mile).<br />
The beach replenishment berm at the Torrey Pines site would be constructed to an elevation of<br />
approximately 11 feet above MLLW, and would extend for approximately 1,620 feet (0.3 mile). The berm<br />
would be flat with a width of approximately 300 feet. The beach fill would then slope seaward<br />
approximately 200 feet at a slope of 10:1.<br />
The Mission <strong>Beach</strong> receiver site would be constructed to create a berm of approximately 10 feet above<br />
MLLW and approximately 150 feet wide, stretching approximately 1,590 feet (0.3 mile) from Nantasket<br />
Court to Santa Barbara Place. The beach fill would then slope seaward at a slope of 20:1. The width of<br />
the slope would be approximately 125 feet at the northern end and 250 feet to the south, where the<br />
underwater slope is more gradual.<br />
In Imperial <strong>Beach</strong>, the beach replenishment berm would be built to approximately 10 feet above MLLW<br />
and would be approximately 120 feet wide, stretching from just Admiralty Way to approximately 600 feet<br />
south of Encanto Avenue. The total length would be approximately 2,310 feet (0.4 mile). The beach fill<br />
would then slope seaward approximately 125 feet at a slope of 20:1.<br />
Borrow Sites<br />
R<br />
The six borrow sites would be located offshore along the coast from Oceanside to Imperial <strong>Beach</strong>, in<br />
relative proximity to each receiver site. The term borrow site refers to a larger location that has been<br />
investigated as part of this project in terms of sediment characteristics, marine resources, ocean surface,<br />
etc. Within that large area, a smaller dredge area has been identified and evaluated where the actual<br />
material would be removed. Table ES-4 provides a summary of borrow site characteristics including the<br />
<strong>Regional</strong> <strong>Beach</strong> <strong>Sand</strong> <strong>Project</strong> <strong>EIR</strong>/<strong>EA</strong><br />
99-69\SANDAG <strong>EIR</strong><strong>EA</strong> es.wpd 7/17/00<br />
Page ES-11
Executive Summary<br />
volume of material to be dredged, the surface area affected, the depth of dredge, and the water depth.<br />
Subsequent to the issuance of the Draft <strong>EIR</strong>/<strong>EA</strong>, engineers have recommended decreasing the dredge area<br />
or eliminating borrow sites SO-9 and SO-6. Additional material may be removed from SO-7 instead.<br />
This modification would not change any significance conclusion in the Final <strong>EIR</strong>/<strong>EA</strong>.<br />
R<br />
R<br />
R<br />
Table ES-4<br />
Alternative 1 – Borrow Site Characteristics<br />
(1)<br />
Borrow Sites<br />
SO-9 (1)<br />
SO-7 (3)<br />
Volume of <strong>Sand</strong> to<br />
be Dredged (in cy)<br />
Approx. Surface<br />
Area to be Dredged<br />
(in acres)<br />
Depth of Dredge<br />
(in feet)<br />
Water Depth<br />
(in feet, MLLW)<br />
706,000 (2) 63 Max. 15 45 to 55<br />
R<br />
496,000 70 1 to 11 60 to 85 R<br />
SO-6 104,000 29 3 to 4 60 to 80<br />
SO-5 656,000 (2) 127 Max. 6 50 to 80<br />
MB-1 100,000 19 Max. 6 68 to 75<br />
SS-1 120,000 22 Max. 6 40 to 53<br />
With dredge area modified to provide a larger buffer between previously unmapped artificial reef areas, R<br />
the dredge area would be reduced by approximately 25 percent. The borrow site may be eliminated<br />
R<br />
during final design.<br />
R<br />
(2)<br />
Volume includes overfill factor (Moffatt & Nichol 2000c). R<br />
(3)<br />
Possible expansion to 1.5 million cy with total surface area of 150 acres if SO-9 and SO-6 are eliminated. R<br />
Maximum depth of dredge would be 15 feet.<br />
R<br />
Alternative 1b<br />
Under Alternative 1b, the proposed action would be implemented at the same receiver sites using the same<br />
borrow sites as described for Alternative 1a; however, adherence to applicable noise ordinances would<br />
limit the hours and number of days per week that beach replenishment could occur. Table ES-3 identifies<br />
which receiver sites would be subject to local noise ordinances and provides a comparison of the schedule<br />
and production capability under either construction variation. As shown, the overall quantity of sand would<br />
be 1.3 million cy under Alternative 1b versus 2 million cubic yards under Alternative 1a.<br />
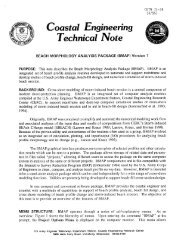
Alternative 2<br />
Alternative 2 would involve sand replenishment at nine beach receiver sites, all but one of which would be<br />
associated with Alternative 1. The same six borrow sites would provide the material for replenishment and<br />
the dredging and discharge plan would be the same, except where some receiver sites would be eliminated.<br />
Individual receiver sites are described below as they would vary from Alternative 1.<br />
Page ES-12<br />
<strong>Regional</strong> <strong>Beach</strong> <strong>Sand</strong> <strong>Project</strong> <strong>EIR</strong>/<strong>EA</strong><br />
99-69\SANDAG <strong>EIR</strong><strong>EA</strong> es.wpd 7/17/00
Executive Summary<br />
Alternative 2a<br />
Receiver sites<br />
Alternative 2 would have eight beach receiver sites common to Alternative 1 and one new site (South<br />
Carlsbad South) for a total of nine. In three of the sites, the quantity and location of replenishment would<br />
be identical to Alternative 1, and they would be built to the same specifications (e.g., height, slope). Five<br />
of the sites would be similar in location as under Alternative 1, although the sand quantity would increase.<br />
Accordingly, the length of the footprint would increase. Below is a description of the boundaries of each<br />
receiver site.<br />
Under this maximum length alternative, beach replenishment at South Oceanside would involve onshore<br />
placement of sand from Seagaze Drive to Vista Way, a distance of approximately two miles. The berm<br />
elevation would be the same, but the width would decrease to 75 feet.<br />
<strong>Beach</strong> replenishment at the South Carlsbad North site would consist of the placement of dredged sediment<br />
near the Palomar Airport Road intersection with Carlsbad Boulevard, stretching to the south for 2,800 feet<br />
(0.5 mile) near the Encinitas Creek outlet. Other characteristics of the proposed fill would be similar to<br />
Alternative 1.<br />
The South Carlsbad South receiver site begins just south of the South Carlsbad North receiver site and the<br />
Encinas Creek outlet. The site is approximately 1,830 feet (0.3 mile) in length. A berm would be<br />
constructed to an elevation of approximately 12 feet above MLLW. The berm would be flat with a width<br />
of approximately 170 feet. The beach fill would then slope seaward approximately 100 feet at a slope of<br />
10:1.<br />
<strong>Beach</strong> replenishment at the Cardiff, Solana <strong>Beach</strong>, and Del Mar receiver sites would be identical to that<br />
proposed under Alternative 1a.<br />
The Torrey Pines receiver site would stretch approximately 2,470 feet (0.5 mile) and is located on Torrey<br />
Pines State <strong>Beach</strong>. The northern boundary of the fill site would be identical to Alternative 1. Other<br />
characteristics of the proposed fill would be similar to Alternative 1.<br />
<strong>Regional</strong> <strong>Beach</strong> <strong>Sand</strong> <strong>Project</strong> <strong>EIR</strong>/<strong>EA</strong><br />
99-69\SANDAG <strong>EIR</strong><strong>EA</strong> es.wpd 7/17/00<br />
Page ES-13
Executive Summary<br />
The Mission <strong>Beach</strong> receiver site would stretching from Ostend Court to Santa Barbara Place, a distance<br />
of approximately 2,380 feet (0.5 mile). The southern boundary of the fill site would be identical to<br />
Alternative 1. Other characteristics of the proposed fill would be similar to Alternative 1.<br />
In Imperial <strong>Beach</strong>, the beach replenishment berm would be built along approximately 3,470 feet (0.7 mile)<br />
of beach, from Imperial <strong>Beach</strong> Boulevard to approximately 1,000 feet south of Encanto Avenue. This<br />
receiver site footprint would be longer than proposed under Alternative 1 at both the north and south ends.<br />
Other characteristics of the proposed fill would be similar to Alternative 1.<br />
Borrow Sites<br />
Under this alternative, the borrow site locations would remain as under Alternative 1, but the sand quantity<br />
would change and the number of receiver sites would decrease. Overall, the surface area extent would<br />
remain the same under Alternative 1 and Alternative 2, but the depth of dredge would increase at borrow<br />
sites MB-1 and SS-1. Table ES-5 summarizes pertinent characteristics of the dredge areas under this<br />
alternative.<br />
Borrow Sites<br />
Table ES-5<br />
Alternative 2 – Borrow Site Characteristics<br />
Volume of <strong>Sand</strong> to<br />
be Dredged (in cy)<br />
Approx. Surface<br />
Area to be Dredged<br />
(in acres)<br />
Depth of Dredge<br />
(in feet)<br />
Water Depth<br />
(in feet, MLLW)<br />
SO-9 (1) 627,000 (2) 63 Max. 15 45 to 55<br />
SO-7 (3) 360,000 70 1 to 11 60 to 85<br />
SO-6 104,000 29 3 to 4 60 to 80<br />
SO-5 788,000 (2) 127 Max. 6 50 to 80<br />
MB-1 150,000 19 Max. 10 68 to 75<br />
SS-1 180,000 22 Max. 7 40 to 53<br />
(1)<br />
With dredge area modified to provide a larger buffer between previously unmapped artificial reef areas, R<br />
the dredge area would be reduced by approximately 25 percent. The borrow site may be eliminated<br />
R<br />
during final design.<br />
R<br />
(2)<br />
Volume includes overfill factor (Moffatt & Nichol 2000c). R<br />
(3)<br />
Possible expansion to 1.5 million cy with total surface area of 150 acres if SO-9 and SO-6 are eliminated. R<br />
Maximum depth of dredge would be 15 feet.<br />
R<br />
Page ES-14<br />
<strong>Regional</strong> <strong>Beach</strong> <strong>Sand</strong> <strong>Project</strong> <strong>EIR</strong>/<strong>EA</strong><br />
99-69\SANDAG <strong>EIR</strong><strong>EA</strong> es.wpd 7/17/00
Executive Summary<br />
Alternative 2b<br />
This alternative would be implemented at the same receiver sites and using the same borrow sites as<br />
described for Alternative 2a; however, adherence to applicable, local noise ordinances would limit the<br />
hours and number of days per week that beach replenishment could occur. The construction schedules<br />
and associated sand quantities associated with variations 2a and 2b are shown in Table ES-6. The overall<br />
quantity of sand would be 1.25 million cy under Alternative 2b versus 2.04 million cy under Alternative 2a.<br />
Table ES-6<br />
Alternative 2 – Schedule and Production<br />
Borrow<br />
Site<br />
SO-9<br />
SO-7<br />
Receiver<br />
Site<br />
Alternative 2a<br />
(Assumes 7-day/24-hour work schedule)<br />
Quantity<br />
(cy)<br />
Replenishment<br />
Site<br />
Construction (1)<br />
(estimated days)<br />
Duration of<br />
Pipeline<br />
Activity (2)<br />
(estimated<br />
days)<br />
Quantity<br />
(cy)<br />
Alternative 2b<br />
(Adheres to Noise Ordinances) (3)<br />
Replenishment<br />
Site<br />
Construction (1)<br />
(estimated days)<br />
Duration of<br />
Pipeline<br />
Activity (2)<br />
(estimated<br />
days)<br />
Applicable<br />
Noise<br />
Ordinance?<br />
S. Oceanside 570,000 42<br />
285,000 63<br />
Yes<br />
42<br />
63<br />
N. Carlsbad 0 0 0 0 N/A<br />
S. Carlsbad N. 218,000 19<br />
218,000 19<br />
No<br />
32<br />
32<br />
S. Carlsbad S. 142,000 13 142,000 13 No<br />
Batiquitos 0 0<br />
0 0<br />
Leucadia 0 0 0<br />
0 0 0<br />
N/A<br />
Moonlight 0 0 0 0 N/A<br />
SO-6 Cardiff 104,000 11 11 104,000 11 11 No<br />
SO-5<br />
MB-1<br />
SS-1<br />
Solana <strong>Beach</strong> 140,000 13 13 70,000 18 18 Yes<br />
Del Mar 180,000 16<br />
90,000 24<br />
Yes<br />
44<br />
64<br />
Torrey Pines 360,000 28 180,000 40 Yes (4)<br />
Mission<br />
<strong>Beach</strong><br />
Imperial<br />
<strong>Beach</strong><br />
150,000 14 14 75,000 21 21 Yes<br />
180,000 16 16 90,000 24 24 Yes<br />
Total 2,044,000 172 172 1,254,000.00 233 233<br />
Average Production Rate 15,000 cy/day 5,000 cy/day<br />
N/A<br />
Assumptions: Noise limits would allow only one shift of production per day with no construction on Sundays or holidays. This would<br />
limit volume by 50 percent due to cost constraints and production to 1/3 (3 times longer). Production rates are average and similar for<br />
either hopper or cutterhead dredge.<br />
(1)<br />
Includes 2 to 4 days for mobilization prior to sand placement and 2 to 4 days for demobilization post placement, depending on borrow<br />
source.<br />
(2)<br />
Maximum number of working days pipeline would be on the beach where a single borrow site serves more than one receiver site.<br />
(3)<br />
Assumes a working schedule from 7:00 a.m. to 7:00 p.m. Monday through Friday, limited working hours on Saturday, and no working<br />
hours on Sundays and holidays.<br />
(4)<br />
The Torrey Pines conveyance plan includes use of Del Mar’s beach for pipeline conveyance of sand. The use of the City of Del Mar’s<br />
beach for this purpose may necessitate conformance with the noise ordinance.<br />
<strong>Regional</strong> <strong>Beach</strong> <strong>Sand</strong> <strong>Project</strong> <strong>EIR</strong>/<strong>EA</strong><br />
99-69\SANDAG <strong>EIR</strong><strong>EA</strong> es.wpd 7/17/00<br />
Page ES-15
Executive Summary<br />
No Action Alternative<br />
Under the No Action Alternative, no dredging or beach replenishment activities would occur, and erosion<br />
at the region’s beaches would continue without intervention. This would result in failure to enhance<br />
recreational opportunities, enhance tourism value, or achieve property and infrastructure protection at<br />
specific receiver sites. It would also preclude the addition of sand in the three littoral cells which could<br />
thereby indirectly enhance other beach locations. Finally, it would not provide the opportunity to monitor<br />
the post-project condition for purposes of increasing knowledge regarding the state-of-the-art modeling<br />
process. While all these failures would be specific to the proposed specific receiver sites, there is a regionwide<br />
benefit that would also be lost.<br />
ES-5<br />
MONITORING AND MITIGATION FRAMEWORK<br />
Although sand replenishment has occurred along the San Diego region coastline for well over 50 years<br />
(USACOE 1991), the effects of sand transport have not been effectively monitored to date. While there<br />
are coastal engineering models to predict sand transport from beach replenishment, there is little local data<br />
available to verify how the actual conditions compare to the predicted. As part of the permits issued to the<br />
Navy for their beach replenishment project, a Coastal Monitoring Plan was approved by the U.S. <strong>Army</strong><br />
Corps of Engineers in 1997. That plan described a monitoring program to be implemented subsequent to<br />
sand placement and for a four-year period following the action. The intent of the monitoring was to verify<br />
that there were no long-term, significant impacts to sensitive biological resources. If impacts were<br />
identified, then mitigation would be required. While sand placement was halted prior to completion, the<br />
required monitoring continued by the Navy as required by the permit until 2001. Since the projects are<br />
substantially the same, except with respect to sand source and less sand volume than the Navy’s project,<br />
a similar monitoring program would be implemented for the <strong>Regional</strong> <strong>Beach</strong> <strong>Sand</strong> <strong>Project</strong>. A mitigation<br />
commitment would also be necessary in case long-term, significant impacts are identified during monitoring.<br />
This section summarizes the framework for monitoring and mitigation for the <strong>Regional</strong> <strong>Beach</strong> <strong>Sand</strong> <strong>Project</strong>.<br />
The final details are most appropriately determined upon selection of an alternative and negotiation of<br />
permit conditions with the resource agencies. Items such as exact monitoring locations would depend on<br />
the alternative to be implemented.<br />
Monitoring can be considered in terms of “during construction” and “post-construction.” Monitoring during<br />
construction would be required to verify that specified site-specific, resources are not adversely impacted<br />
Page ES-16<br />
<strong>Regional</strong> <strong>Beach</strong> <strong>Sand</strong> <strong>Project</strong> <strong>EIR</strong>/<strong>EA</strong><br />
99-69\SANDAG <strong>EIR</strong><strong>EA</strong> es.wpd 7/17/00
Executive Summary<br />
(e.g., grunion). Post-construction monitoring will be required to understand the long-term ramifications of<br />
project implementation, which is especially pertinent because of the highly dynamic ocean system.<br />
Monitoring During Construction<br />
SANDAG is committed to coordinating with commercial fishermen to avoid gear loss in the transit and<br />
dredge areas. As described in Section 2.4.1, an observer would be aboard the dredge to document any<br />
fishing gear in these areas and determine compensation responsibility if gear is lost. Other specifics of the<br />
noticing procedure prior to and during construction are in that section.<br />
R<br />
R<br />
R<br />
R<br />
Construction monitoring would be performed to verify water quality (turbidity) remains within parameters<br />
established by the <strong>Regional</strong> Water Quality Control Board (RWQCB) 401 Certification of Waste Discharge<br />
Requirements. The 401 Certification requirement will establish the frequency and duration of monitoring.<br />
R<br />
Monitoring would also occur during discharge operations at those receiver sites with suitable grunion habitat<br />
to establish a buffer around observed grunion spawning locals. The buffer would remain in place for 14<br />
days to allow grunion eggs to hatch, and surveys show no subsequent spawning has occurred in the same<br />
area. A schematic drawing of the diked buffer area would be submitted to the resource and regulatory<br />
agencies. Construction could continue elsewhere in the receiver site during this period. Monitoring by a<br />
qualified biologist would only occur during the spawning season (March through August) and during the<br />
dates specified by the California Department of Fish and Game in their annual pamphlet Expected Grunion<br />
Runs.<br />
R<br />
R<br />
R<br />
R<br />
R<br />
R<br />
While the dredge areas have been located to avoid locations high probability for underwater cultural<br />
resources as much as possible, monitoring will be required at all receiver sites fed to verify no substantial<br />
disturbance to resources occurs. If disturbance occurs, that portion of the borrow site would be<br />
permanently avoided, a 250-foot buffer established, and the site recorded. Additionally, potential side-scan<br />
targets at SO-9 and MB-1 would be investigated prior to dredging (by diver or remotely operated vehicle<br />
(ROV)). If they are historic features they would be avoided and a suitable buffer established. Complete<br />
side-scan will be obtained and interpreted at SO-9 and SS-1 to verify no historic targets and to ensure no<br />
damage to the dredge.<br />
<strong>Regional</strong> <strong>Beach</strong> <strong>Sand</strong> <strong>Project</strong> <strong>EIR</strong>/<strong>EA</strong><br />
99-69\SANDAG <strong>EIR</strong><strong>EA</strong> es.wpd 7/17/00<br />
Page ES-17
Executive Summary<br />
Post-Construction Monitoring<br />
The RBSP monitoring program will continue at as many of the existing Navy sites as practicable, while<br />
verifying no long-term impacts at the locations where this project predicts possible sand deposition. While<br />
the exact monitoring locations will be finalized in concert with the resource and regulatory agencies,<br />
tentative locations include Point Loma (control) and Cardiff (test) for rocky intertidal habitat; Cardiff, North<br />
Carlsbad and Leucadia (test) and one new site north of Table Tops or Swami’s (control) for subtidal<br />
habitat; and a new location off North Carlsbad, Solana <strong>Beach</strong>/Cardiff, Batiquitos, Moonlight<br />
<strong>Beach</strong>/Boneyards (test) and Point Loma, possibly Swami’s (control) for kelp habitat. A new transect<br />
perpendicular to the coast would be implemented at North Carlsbad under subtidal to verify no impacts<br />
to surfgrass. Current baseline data is available for existing Navy monitoring sites, but where new test and<br />
control sites would be selected, baseline monitoring would be completed prior to project initiation. Possible<br />
new sites that would require baseline monitoring include the perpendicular transect at North Carlsbad, the<br />
selected control site for subtidal habitat, and Batiquitos, Moonlight <strong>Beach</strong>/Boneyards and North Carlsbad<br />
test sites for kelp habitat.<br />
R<br />
R<br />
R<br />
R<br />
R<br />
R<br />
R<br />
R<br />
R<br />
R<br />
R<br />
R<br />
R<br />
The monitoring program for rocky intertidal habitat would involve periodic checks of fixed plots and fixed<br />
transects to observe identified target species of vegetation, barnacles, and sea stars. Species abundance<br />
would be estimated based on counts and measurements within those fixed sample locations. Timed<br />
searches and reconnaissance surveys would also be conducted, including video-recording. Surveys would<br />
occur twice a year (spring and fall) for four years. Sample reports would be provided after each survey<br />
and a yearly report would be required after each full year of monitoring. A final report would be prepared<br />
at the completion of the four-year monitoring effort.<br />
The subtidal monitoring would involve establishment of fixed transects inside a fixed quadrant within which<br />
the substrate would be characterized in terms of percentage of sand, rock, rock type, vertical relief and<br />
depth of sand cover. Within that quadrant, the biologist would census abundance of key indicator species.<br />
Habitat type and species abundance along each transect would be mapped and digitized into a GIS<br />
database. Persistence or change in habitat over time would be documented. Sediment markers would be<br />
permanently established and monitored as well. It will be important in the monitoring plan to design a<br />
standard method for accurately recording changes in sand depth. Surveys would occur twice annually in<br />
spring and fall. Annual reports would be provided, as well as a final report at the end of four years.<br />
Kelp monitoring would be performed using divers at the study reefs to sample the kelp and reef biota within<br />
established areas. Transects would be established and substrate mapped to characterize the percentage<br />
Page ES-18<br />
<strong>Regional</strong> <strong>Beach</strong> <strong>Sand</strong> <strong>Project</strong> <strong>EIR</strong>/<strong>EA</strong><br />
99-69\SANDAG <strong>EIR</strong><strong>EA</strong> es.wpd 7/17/00
Executive Summary<br />
of sand, rock, rock type, vertical relief and depth of sand cover. Key indicator species (plants and<br />
invertebrates) would be inventoried for type and abundance. Photographs and video would be used for<br />
recordation. Sediment markers and buoys would be established. For the first two years, monitoring would<br />
occur periodically and thereafter annually. Sampling reports would be required as surveyed, annual reports<br />
every year, and then a final report at the conclusion of monitoring (after four years).<br />
The Navy committed to a four-year lagoon monitoring program at Agua Hedionda Lagoon, Batiquitos<br />
Lagoon, San Elijo Lagoon, San Dieguito Lagoon, and Los Peñasquitos Lagoon to evaluate lagoon mouth<br />
closures and/or increased sand accumulation rates. SANDAG is currently participating in an annual lagoon<br />
monitoring program as part of that program. The intent of lagoon monitoring would be to determine to what<br />
extent sand deposition and lagoon mouth closures are related to the <strong>Regional</strong> <strong>Beach</strong> <strong>Sand</strong> <strong>Project</strong> versus<br />
other sand sources and coastal processes. The determination would be made by the USACOE in<br />
consultation with the resource agencies. <strong>Project</strong> monitoring would rely on a comparison of surveyed beach<br />
transects which bracket each lagoon mouth between current year changes and historical data, comparison<br />
of triangulated irregular network (TIN) maps and transects to recent lagoon monitoring, aerial overflights,<br />
as well as an evaluation of non-project inputs (i.e., other beach replenishment projects including<br />
maintenance dredging) versus project inputs to determine how much of the material in the lagoon, if any,<br />
is project-related. This monitoring effort would also occur for four years subsequent to the action. If the<br />
monitoring effort is unable to determine to the satisfaction of the resource agencies, the project impact at<br />
a specific lagoon, then quantities up to the potential, worst-case sedimentation derived in Appendix C may<br />
be used.<br />
R<br />
R<br />
R<br />
R<br />
Post-<strong>Project</strong> Mitigation (If Necessary)<br />
If monitoring documents a significant, long-term adverse impact to sensitive marine resources resulting from<br />
discharge activities based on the resource agency/SANDAG consultation and review of the monitoring<br />
reports (twice yearly and at project completion), then restoration of like habitat at a 1:1 ratio would be<br />
proposed as a first priority. Consideration would be given to the construction of artificial reefs as mitigation<br />
to offset project impacts at a 1:1 ratio if like habitat restoration efforts were not feasible as determined by<br />
the USACOE, in consultation with the resource agencies. Like the Navy, SANDAG would negotiate a<br />
“not-to-exceed” cap on mitigation costs as a key part of the permit conditions related to mitigation. The<br />
potential worst-case acreage for 1:1 enhancement/replacement is similar in size to the prior Navy project<br />
and a similar mitigation fund ($1.1 million) would likely be negotiated.<br />
R<br />
R<br />
R<br />
R<br />
R<br />
<strong>Regional</strong> <strong>Beach</strong> <strong>Sand</strong> <strong>Project</strong> <strong>EIR</strong>/<strong>EA</strong><br />
99-69\SANDAG <strong>EIR</strong><strong>EA</strong> es.wpd 7/17/00<br />
Page ES-19
Executive Summary<br />
If the monitoring effort is unable to determine to the satisfaction of the resource agencies, the project impact<br />
at a specific lagoon, then potential, worst-case sedimentation quantities as derived in Appendix C may be<br />
utilized. If the lagoons experience sand input above typical conditions, which are related to the RBSP,<br />
funding would be provided to allow for sediment removal or additional mouth opening in concert with other<br />
on-going maintenance efforts at each lagoon. This determination would be made in consultation with<br />
SANDAG/Resource agencies based on review of the monitoring reports (twice yearly and at project<br />
completion). Funding will be identified for potential mitigation, and a not-to-exceed cap negotiated, as part<br />
of the permit process.<br />
R<br />
R<br />
R<br />
R<br />
R<br />
R<br />
R<br />
R<br />
ES-6<br />
AFFECTED ENVIRONMENT<br />
This <strong>EIR</strong>/<strong>EA</strong> provides a description of the existing environmental conditions in the project areas. This<br />
document describes existing conditions for the following resource categories: geology and soils; coastal<br />
wetlands; water resources; biological resources; cultural resources; land and water use; aesthetics;<br />
socioeconomics; public health and safety; structures and utilities; traffic; air quality; and noise.<br />
ES-7<br />
ENVIRONMENTAL CONSEQUENCES<br />
No long-term significant impacts are expected to occur from implementation of the project given the<br />
monitoring and mitigation program as defined in subsection ES-5. As noted in that section, monitoring<br />
would occur during construction to satisfy permit conditions and ensure avoidance of site-specific resources<br />
(e.g., grunion). Monitoring would also occur for four years subsequent to the action to verify no significant<br />
impacts to coastal lagoons and marine biological resources. If significant long-term impacts do occur, then<br />
SANDAG would implement action to mitigate those impacts, generally lagoon dredging/mouth openings(s)<br />
and/or reef restoration/creation. Table ES-7 summarizes the potential effects under all three alternatives<br />
and both construction variations.<br />
ES-8<br />
CUMULATIVE IMPACTS<br />
California guidelines implementing CEQA require a discussion of significant environmental impacts that<br />
would result when the incremental effects of a project are considerable when viewed in combination with<br />
the effects of “past, present, and probable future projects ” or in relation to “a summary of projections<br />
contained in an adopted general plan or related planning document” (Cal. Code Regs., Title 14, § 15065(c)<br />
and § 15130(b)(1)(A)(B)). Federal guidelines implementing NEPA define a cumulative impact as one that<br />
would result from the incremental impact of an action when added to other past, present, and reasonably<br />
foreseeable actions (40 C.F.R. § 1508.7).<br />
Page ES-20<br />
<strong>Regional</strong> <strong>Beach</strong> <strong>Sand</strong> <strong>Project</strong> <strong>EIR</strong>/<strong>EA</strong><br />
99-69\SANDAG <strong>EIR</strong><strong>EA</strong> es.wpd 7/17/00
Executive Summary<br />
GEOLOGY AND SOILS<br />
Table ES-7<br />
Summary of Environmental Consequences<br />
Alternative 1 Alternative 2 No Action<br />
Alternative 1a. After placement of sand onto a receiver site, the<br />
existing beach area north and south of the receiver site would widen<br />
as a result of longshore and cross-shore spreading. No long-term<br />
significant impacts to coastal geology are anticipated due to<br />
sediment transport or the increased sediment thickness at the<br />
existing, seasonal offshore bar. No significant geology and soils<br />
impacts are anticipated to occur to the dredge borrow sites with<br />
implementation of Alternative 1.<br />
Alternative 2a. Under this alternative, nine receiver sites would<br />
receive sand. At these receiver sites, impacts would be similar<br />
for those described for Alternative 1. The same borrow sites<br />
would be used under this alternative but at different quantities.<br />
However, no significant impacts are anticipated.<br />
Alternative 2b. This alternative would not change the impact<br />
analysis described above for Alternative 2a.<br />
No significant impacts would occur to geology<br />
and soils; however, the receiver beaches would<br />
continue to erode undeterred by the<br />
replenishment project and the project benefits<br />
would not occur.<br />
Alternative 1b. Impacts would be less than significant and no<br />
mitigation measures would be necessary.<br />
COASTAL WETLANDS<br />
Alternative 1a. Turbidity plumes would be localized; if projectrelated<br />
turbidity did enter any of the various lagoons, particulate<br />
concentrations would be low given the distance to the lagoon and<br />
rapid settling rate of the predominantly sandy material. Impacts<br />
would not be significant. The proposed project may incrementally<br />
increase the volume of sedimentation over that which occurs<br />
currently for several lagoons, but the lagoon monitoring program<br />
would be implemented as part of this project to verify no<br />
significant impacts or implement fair-share maintenance dredging<br />
or lagoon mouth opening. Therefore significant impacts would not<br />
result (refer to Section ES-5).<br />
Alternative 1b. Potential effects at individual lagoons would not be<br />
any greater under this construction variation. The monitoring<br />
program in Section ES-5 would be implemented to verify no<br />
significant impact or implement corrective action, as necessary.<br />
WATER RESOURCES<br />
Alternative 1a. None of the fill material would exceed the criteria<br />
established in the California Ocean Plan for bacteria, dissolved<br />
oxygen, contaminants and sulfides, nutrients or pH and there would<br />
be no impacts associated with placement of fill material at the<br />
receiver sites. Due to the localized nature of turbidity plumes, and<br />
the presence of training dikes, there would be no significant<br />
impacts to water quality at the receiver sites. No violation of the<br />
California Ocean Plan objectives would occur from dredging any of<br />
the borrow sites. Based on the relatively localized nature of the<br />
dredge turbidity plumes<br />
Alternative 2a. Although depositional patterns would differ<br />
when compared to Alternative 1, no significant impacts are<br />
anticipated. The monitoring program in Section ES-5 would be<br />
implemented to verify no significant impact or implement<br />
corrective action, as necessary.<br />
Alternative 2b. Potential effects at individual lagoons would not<br />
be any greater under this construction variation. The monitoring<br />
program in Section ES-5 would be implemented to verify no<br />
significant impact or implement corrective action, as necessary.<br />
Alternative 2a. Construction at several receiver sites would take<br />
incrementally longer under this alternative than Alternative 1<br />
because they would receive more sand. Still, the impacts would<br />
remain localized and training dikes would help reduce turbidity.<br />
No significant impacts to water quality would occur at any<br />
receiver sites. Significant elevations in turbidity would not result<br />
in significant impacts to water quality at any of the borrow sites<br />
given the relative localized nature of the turbidity plumes, and<br />
rapid diluting capacity of the open ocean. Some monitoring<br />
would be required consistent with the RWQCB permit.<br />
There would be no increased potential for<br />
change to lagoon sedimentation volumes or<br />
lagoon mouth closures above the current<br />
patterns.<br />
As no dredging or replenishment activities are<br />
proposed under this alternative. No change to<br />
water quality would result.<br />
Page ES-22<br />
<strong>Regional</strong> <strong>Beach</strong> <strong>Sand</strong> <strong>Project</strong> <strong>EIR</strong>/<strong>EA</strong><br />
99-69\SANDAG <strong>EIR</strong><strong>EA</strong> es.wpd 7/17/00
Executive Summary<br />
Table ES-7. Continued<br />
Alternative 1 Alternative 2 No Action<br />
and rapid diluting capacity of the open ocean, turbidity would not<br />
result in significant impacts to water quality at any of the borrow<br />
sites. Water quality monitoring would be required as part of the<br />
RWQCB 401 Certification Order. If monitoring indicates that<br />
suspended particulate concentrations outside the zone of initial<br />
dilution exceeds background concentrations by more than 20<br />
percent, the dredging operation will be suspended and appropriate<br />
measures taken to ensure compliance with the California Ocean<br />
Plan.<br />
Alternative 2b. There would be longer construction periods for<br />
several receiver and borrow sites when compared to Alternative<br />
2a. Although the construction period would be longer at these<br />
receiver and borrow sites, the same construction practices (e.g.,<br />
training dikes) and monitoring would be performed. Construction<br />
would also still be short-term, and no significant impacts to water<br />
quality would result with implementation of this alternative.<br />
Some monitoring would be required consistent with the RWQCB<br />
permit as described in Section 2.5.<br />
Alternative 1b. Although the construction period would be longer<br />
at several receiver and borrow sites, the same construction<br />
practices (e.g., training dikes) and monitoring would be performed<br />
as under Alternative 1a. Construction would also still be shortterm,<br />
and no significant impacts to water quality would result with<br />
implementation of this alternative.<br />
BIOLOGICAL RESOURCES<br />
Alternative 1a. There would be no significant direct impacts from<br />
sand placement as biological resources at those locations are<br />
adapted to seasonal burial and would quickly recolonize. A<br />
monitoring program has been designed for the period of sand<br />
placement to ensure no significant impacts to grunion. There<br />
would be no significant indirect impacts due to turbidity or to<br />
shorebird foraging. Sediment transport patterns predicted by the<br />
model indicate areas of higher sedimentation risk (based on<br />
duration and depth) at locations near Oceanside, North Carlsbad,<br />
Batiquitos, Moonlight <strong>Beach</strong>, Solana <strong>Beach</strong> and Del Mar. Under<br />
the worst-case, partial sedimentation is predicted on up to 3.2 acres<br />
of reefs, near three receiver sites, which support some giant kelp,<br />
0.27 acre of reef with feather boa, and 0.24 acre of reef with<br />
surfgrass. Sedimentation would not result in significant, long-term<br />
indirect impacts because the surfgrass leaves would extend well<br />
above the predicted sediment layer and allow for long-term<br />
recovery, and the kelp areas to be impacted areas are either sparse,<br />
subject to only short-term coverage and/or not within the historic<br />
areas of kelp persistence. Dredging would impact up to 330 acres of<br />
surface area which is less than two percent of the available shelf<br />
habitat. Biota in these locations would recover quickly and the<br />
impact would not be significant. Dredging would create localized<br />
turbidity plumes but buffers have been provided between the dredge<br />
area and marine resources and the amount of turbidity reaching<br />
reefs/kelp would be expected to be within normal ranges. There<br />
would be no significant impacts.<br />
Alternative 2a. As with Alternative 1a, there would be no<br />
significant direct impacts from sand placement or indirect<br />
impacts due to turbidity or shorebird foraging. Sediment<br />
transport patterns suggest areas of higher sedimentation risk<br />
(based on duration and depth) at locations near Oceanside, North<br />
Carlsbad, Solana <strong>Beach</strong> and Del Mar. Under the worst-case,<br />
partial sedimentation is predicted on less than 1.78 acres of reef,<br />
near two receiver sites, which support some giant kelp and less<br />
than 0.24 acre of reef with surfgrass. These values are based in<br />
part on worst-case, but unlikely, sediment deposition near North<br />
Carlsbad from sand transported south from South Oceanside.<br />
This partial sedimentation would not result in long-term,<br />
significant indirect impacts because surfgrass leaves would extend<br />
well above the sediment layer and allow for long-term recovery,<br />
and the kelp areas to be impacted areas are either sparse, subject<br />
to only short-term coverage, and/or not within the historic areas<br />
of kelp persistence. No direct impacts would occur from<br />
dredging at the same borrow sites as proposed under Alternative<br />
1.<br />
No change to onshore, nearshore or offshore<br />
biological resources would occur. There would be<br />
no opportunity to improve shore bird and<br />
grunion habitat in currently cobble beaches.<br />
R<br />
<strong>Regional</strong> <strong>Beach</strong> <strong>Sand</strong> <strong>Project</strong> <strong>EIR</strong>/<strong>EA</strong><br />
99-69\SANDAG <strong>EIR</strong><strong>EA</strong> es.wpd 7/17/00<br />
Page ES-23
Executive Summary<br />
Table ES-7. Continued<br />
CULTURAL RESOURCES<br />
Alternative 1 Alternative 2 No Action<br />
Alternative 1a. While the borrow sites have been designed to avoid<br />
locations of high probability for cultural resources as much as<br />
possible, there are sediments of moderate to high probability within<br />
the dredge footprint of all borrow sites. Any known historic sites<br />
have been avoided by design. There are also unidentified side-scan<br />
sonar targets in SO-9 and MB-1 that need to be investigated for<br />
historic resources. To verify that no significant impacts would<br />
occur, a monitoring program would be undertaken prior to and<br />
during dredging as described in Section ES-5.<br />
Alternative 2a. Under Alternative 2 borrow sites MB-1 and SS-1<br />
would be dredged to a greater depth thereby increasing potential<br />
for entering sediments with probability for cultural resources.<br />
To verify that no significant impacts would occur, a monitoring<br />
program would be undertaken prior to and during dredging as<br />
described in Section ES-5.<br />
Alternative 2b. This alternative’s impacts would be similar to<br />
Alternative 2a, and no significant impacts would occur.<br />
No significant impacts to cultural resources<br />
would occur.<br />
R<br />
R<br />
Alternative 1b. This alternative’s impacts would be similar to<br />
Alternative 1a, and no significant impacts would occur.<br />
LAND AND WATER USE<br />
Alternative 1a. This alternative would result in a beneficial impact<br />
by enhancing/creating new recreational beach area, totaling 378<br />
acres (including existing beach area plus new area postconstruction).<br />
There would not be significant, long-term impacts<br />
to surfing or other recreational pursuits. Due to the short-term<br />
nature of dredging and distance from underwater resources, no<br />
significant long-term impacts are anticipated at the borrow sites.<br />
The replenishment action would not preclude the viability of any<br />
planned land use, either onshore or offshore.<br />
Alternative 1b. No significant long-term impacts to land and water<br />
use are anticipated.<br />
Alternative 2a. Under this alternative, land use and recreation<br />
impacts would be similar to those described for Alternative 1,<br />
although the length of time and locations of receiver site access<br />
restriction would vary. New/enhanced recreational beach area<br />
would total 345 acres (existing beach area plus new area postconstruction).<br />
At the borrow sites, water use and recreation<br />
impacts would be similar to those described for Alternative 1.<br />
The overall impact would be short-term and less than significant.<br />
Alternative 2b. Land use and recreation impacts would be similar<br />
to those described for Alternative 1. There would be less relative<br />
benefit under this alternative as the sand quantity would be less.<br />
There would be no land and water use or<br />
recreation impacts under this alternative. No<br />
recreational benefits would occur since no sand<br />
would be replenished at beaches in the San Diego<br />
region.<br />
R<br />
AESTHETICS<br />
Alternative 1a. Because operations would be short-term overall,<br />
the daily construction area would travel down the beach which<br />
would reduce the visual contrast to any one sensitive viewer, and<br />
the end result would be enhancement of the region’s beaches, visual<br />
impact would be considered less than significant. Any discoloration<br />
of the sediment would be short-term (USACOE 1984) and no<br />
permanent adverse visual conditions would result from the<br />
discoloration of fill materials at any of the receiver beaches.<br />
Dredging activity at the borrow sites will not be highly evident or<br />
dominate the landscape, and the impact would not be regarded as<br />
significant.<br />
Alternative 1b. While there would be less sand overall to replenish<br />
at the receiver sites, there would still be an improvement to the<br />
existing degraded condition. Dredging activity would occur over a<br />
longer duration at borrow sites SO-9, SO-5, MB-1 and SS-1.<br />
Alternative 2a. <strong>Beach</strong> replenishment activities at the Cardiff,<br />
Solana <strong>Beach</strong> and Del Mar receiver sites would be identical to<br />
Alternative 1a and the impacts would be identical. There would<br />
be short-term views of construction but long-term beach<br />
enhancement so the impact would be less than significant. Four<br />
other receiver sites would have a larger footprint under this<br />
alternative, and construction would occur over a longer period of<br />
time, but impacts would remain less than significant. Visual<br />
impacts associated with borrow sites would be similar to<br />
Alternative 1 (i.e., less than significant).<br />
Alternative 2b. Under this alternative, construction at some<br />
sites would occur over a longer time period. The reduction in<br />
sand volume associated with this alternative would result in<br />
reduced long-term visual benefits. No significant impacts are<br />
anticipated.<br />
With the No Action Alternative, the beaches<br />
would not be enhanced. Where there are visible<br />
cobbles they would remain and where the beach<br />
overall is narrow it would not be widened.<br />
Adjacent residents and beach users would not<br />
experience disturbance during construction or<br />
views of the pipeline; however, they would not<br />
experience the benefits of more scenic beaches.<br />
Page ES-24<br />
<strong>Regional</strong> <strong>Beach</strong> <strong>Sand</strong> <strong>Project</strong> <strong>EIR</strong>/<strong>EA</strong><br />
99-69\SANDAG <strong>EIR</strong><strong>EA</strong> es.wpd 7/17/00
Executive Summary<br />
Table ES-7. Continued<br />
Because of the distance between borrow sites and viewers, the<br />
relatively small size of dredge area when viewed in the ocean<br />
horizon, and the other boating activity that is also visible, there<br />
would be no permanent significant visual impact.<br />
SOCIOECONOMICS<br />
Alternative 1 Alternative 2 No Action<br />
Alternative 1a. There would be no significant direct impacts to the<br />
commercial fishery as a result of area preclusion of fishing effort,<br />
long-term damage to target species populations as a result of<br />
sedimentation of nursery habitat areas for commercial species, or<br />
loss of fishing gear as a result of dredging or sand placement<br />
operations. In terms of the regional fishery, there would be no<br />
Alternative 2a. Impacts resulting from Alternative 2a would be<br />
similar to those identified for Alternative 1a, but somewhat<br />
smaller in area and different in specific location. While<br />
temporary adverse impacts to commercial fisheries target species<br />
may occur on a localized basis, or at the individual fishing<br />
operation level due to temporary displacement from favored<br />
The benefits of enhanced beaches for recreation,<br />
property protection and tourism would not<br />
occur. There would be no change to current<br />
fisheries fluctuations.<br />
significant impact to the overall fishery. Individual lobster<br />
fishermen and, to a lesser extent, urchin and live trap (primarily<br />
crab and sheephead) fishermen may experience temporary adverse<br />
impacts from short-term displacement from favored small area<br />
fishing locations. Nursery habitat may experience short-term<br />
localized adverse impacts but the relative size of potentially<br />
affected areas (0.24 acre surfgrass, 0.3 acre of feather boa, and 3.2<br />
acres kelp) would be insignificant to the overall available habitat.<br />
The potential for impacts resulting from gear loss will be<br />
minimized through a pro-active effort to coordinate with<br />
commercial fishermen in advance of, and during, dredging<br />
operations for the borrow site and transit areas. In addition to<br />
onshore restricted access, an offshore area would be restricted to<br />
allow proper anchoring of the dredge and pumping operations and<br />
protect public safety. Each of the dredge locations would be<br />
publicized via a U.S. Coast Guard Notice to Mariners. At the<br />
initiation of dredge activities, an observer would be aboard the<br />
dredge to document any fishing gear in the noticed transit or dredge<br />
areas. Gear within these areas, if damaged or destroyed, would not<br />
require compensation. If gear outside of the noticed dredge areas<br />
or transit corridors is damaged or destroyed, compensation would be<br />
the responsibility of the contractor. Impacts to kelp harvesting<br />
activities will be less than significant given the small area of kelp<br />
coverage that will experience partial temporary sedimentation and<br />
the generally poor quality of kelp habitat within the affected<br />
littoral cell. Impacts to sport fishermen and divers will be less than<br />
significant. Short-term adverse impacts may be experienced by<br />
dive operations in the “Wreck Alley” area off of Mission <strong>Beach</strong><br />
during the 11 days of dredging operations at the adjacent borrow<br />
site, and there may be temporary impacts to sport fishing and<br />
diving resulting from localized turbidity plumes at borrow and<br />
receiver sites.<br />
fishing sites, no significant commercial fisheries impacts are<br />
identified.<br />
R<br />
<strong>Regional</strong> <strong>Beach</strong> <strong>Sand</strong> <strong>Project</strong> <strong>EIR</strong>/<strong>EA</strong><br />
99-69\SANDAG <strong>EIR</strong><strong>EA</strong> es.wpd 7/17/00<br />
Page ES-25
Executive Summary<br />
Table ES-7. Continued<br />
PUBLIC H<strong>EA</strong>LTH AND SAFETY<br />
Alternative 1 Alternative 2 No Action<br />
Alternative 1a. During beach replenishment operations, safety<br />
measures would be implemented in the vicinity of the receiver<br />
beaches, including fencing, barricades, and flag personnel, as<br />
necessary. During replenishment operations, the discharge<br />
pipelines (outside the construction zone) would be covered with<br />
sand at key access points to create pedestrian bridges and ensure<br />
public access. Public health and safety benefits would temporarily<br />
result from sand placement at eroded areas adjacent fragile bluffs.<br />
A sand, cobble, or earthen ramp would allow for access from<br />
lifeguard stations, over the land pipeline, and to the ocean as<br />
necessary. SANDAG would coordinate with the respective<br />
jurisdiction to temporarily relocate non-permanent lifeguard towers<br />
during construction. Near permanent lifeguard towers, the line-ofsight<br />
from tower viewing platforms would be preserved. Sediment<br />
characterization analyses confirmed that replenishment material is<br />
clean beach-quality material and would not pose a threat to public<br />
health and safety. <strong>Beach</strong> fill would not be placed above the height<br />
of the existing beach berm so increased scarp heights would not<br />
occur. For vessel safety, an approximate 500- by 500-foot buffer<br />
area would be maintained around the dredge offshore waters, to<br />
allow proper anchoring and pump line operation, and the anchoring<br />
area would be included in the Notice to Mariners, which is overseen<br />
by the U.S. Coast Guard. No significant impacts would result to<br />
public health and safety.<br />
Alternative 2a. Public health and safety impacts under this<br />
alternative would be similar to those described for Alternative 1.<br />
The South Carlsbad South receiver site proposed under this<br />
alternative also has temporary lifeguard towers in place during<br />
summer months. If sand replenishment occurs during the<br />
summer season when the temporary lifeguard towers are onsite,<br />
SANDAG would coordinate with the respective jurisdiction to<br />
temporarily relocate the towers during construction. Temporary<br />
relocation would not impair the ability of lifeguards to ensure<br />
public safety since this portion of the beach would be closed to<br />
the public during construction activities. The towers would be<br />
replaced after sand placement, before the beach is reopened for<br />
recreational uses. This alternative would incrementally benefit<br />
those areas threatened by bluff failure (although temporarily).<br />
However, Encinitas beaches near fragile bluffs (i.e., Batiquitos,<br />
Leucadia, and Moonlight receiver sites) would not receive this<br />
incremental benefit under Alternative 2. Impacts would be less<br />
than significant.<br />
Alternative 2b. Although this alternative would take longer to<br />
implement, it would still be short-term, and no significant<br />
impacts are anticipated.<br />
No dredging or replenishment activities would<br />
occur. At some receiver beaches, waves would<br />
continue to erode fragile bluffs that support<br />
property and structures. This erosion would<br />
continue unabated.<br />
R<br />
Alternative 1b. Public access to the actual zones of construction<br />
would be closed for a longer period of time when compared to<br />
Alternative 1a. Also, lifeguard towers would be moved for a longer<br />
period of time until construction is completed. Although this<br />
alternative would take longer to implement, it would still be shortterm<br />
overall and no significant impacts are anticipated.<br />
STRUCTURES AND UTILITIES<br />
Alternative 1a. At all receiver sites, any sand placed around storm<br />
drain outlets would be dug out to allow proper drainage. The<br />
bottom of public stairs and public access ramps may be covered by<br />
the fill, which would tend to stabilize the stairways. <strong>Sand</strong> at the base<br />
of lifeguard towers would provide additional protection against<br />
storm surge damage and would temporarily benefit the lifeguard<br />
towers. Overall, impacts would be less than significant.<br />
Alternative 1b. As with Alternative 1a, replenishment would result<br />
in a beneficial impact to structures and utilities by stabilizing them;<br />
no significant impacts to structures and utilities are anticipated.<br />
Alternative 2a. Implementation of this alternative would result<br />
in similar effects to structures and utilities as analyzed for<br />
Alternative 1. <strong>Sand</strong> placement is beneficial for structures since it<br />
provides additional support and protection against erosion and<br />
storm damage during winter months.<br />
Alternative 2b. As with Alternative 2a, replenishment would<br />
result in a beneficial impact to structures and utilities by<br />
stabilizing them; no significant impacts to structures and utilities<br />
are anticipated.<br />
There would be no impacts to structures and<br />
utilities. The beneficial effect of stabilizing<br />
structures such as stairways and outfalls would<br />
not occur under this alternative.<br />
R<br />
Page ES-26<br />
<strong>Regional</strong> <strong>Beach</strong> <strong>Sand</strong> <strong>Project</strong> <strong>EIR</strong>/<strong>EA</strong><br />
99-69\SANDAG <strong>EIR</strong><strong>EA</strong> es.wpd 7/17/00
Executive Summary<br />
Table ES-7. Continued<br />
TRAFFIC<br />
Alternative 1 Alternative 2 No Action<br />
Alternative 1a. <strong>Beach</strong> replenishment activities would not<br />
significantly affect traffic, as Alternative 1 would generate very<br />
few trips. Personnel would park in public parking areas and would<br />
not create significant parking impacts given the small size of the<br />
land-side beach construction crew (approximately 12 persons).<br />
Traffic and parking could increase after sand placement at some<br />
locations, as beaches would become more attractive to recreational<br />
users. However, sand is not expected to last for the long-term, and<br />
congestion at beaches is an accepted occurrence. There would be<br />
no significant impacts to traffic.<br />
Alternative 1b. With implementation of the longer construction<br />
schedule proposed under Alternative 1b, construction vehicles<br />
would require vicinity parking and access for a slightly longer<br />
period of time. Impacts would still be less than significant due to<br />
the short-term nature of this alternative and the very small number<br />
of trips.<br />
AIR QUALITY<br />
Alternative 1a. The sand would be quite moist, and the potential<br />
for dust generation would be very low; impacts would be less than<br />
significant. The emissions of CO, ROC and NO x from dredge and<br />
construction equipment would be less than the General Conformity<br />
Rules threshold values, and much less than ten percent of the air<br />
basin emissions. Therefore, the proposed action is presumed to<br />
conform to the State Implementation Plan (SIP), and a formal<br />
conformity determination is not required. Emissions would not<br />
expose sensitive receptors to pollutant concentrations. Air quality<br />
impacts would be less than significant.<br />
Alternative 1b. While the duration of construction would be longer<br />
overall, the total emissions would not increase because there would<br />
be no emissions during the period when construction was not<br />
occurring. Impacts would be less than significant.<br />
NOISE<br />
Alternative 1a. While dredging activity and placement of the<br />
conveyor pipe and sand distribution at the receiver sites would<br />
generate noise, the impact would be less than significant.<br />
Nighttime and weekend work at receiver beaches would be<br />
performed under variance from the local noise ordinance where<br />
required. Residents of homes near the receiver sites would be<br />
notified prior to the work, and adverse nighttime noise events<br />
would occur for no more than three consecutive days within 200<br />
Alternative 2a. Alternative 2 would result in similar impacts to<br />
those described for Alternative 1. Impacts would be less than<br />
significant.<br />
Alternative 2b. Because dredging and replenishment activities<br />
would take a longer amount of time, construction vehicles would<br />
require vicinity parking and access to the receiver sites for a<br />
longer period of time. Impacts would be less than significant due<br />
to the short-term nature of construction and small number of<br />
trips.<br />
Alternative 2a. <strong>Project</strong>-related emissions are less than the<br />
General Conformity Rules threshold values and the proposed<br />
action is presumed to conform with the SIP. There is a very low<br />
potential for dust generation because the material being moved is<br />
extremely wet. Therefore there would be no significant air<br />
quality impacts.<br />
Alternative 2b. While the duration of construction would be<br />
longer overall, the total emissions would not increase because<br />
there would be no emissions during the period when construction<br />
was not occurring. The minimal amount of traffic and lack of<br />
fugitive dust, plus conformity with the SIP would support the<br />
conclusion of no significant impact.<br />
Alternative 2a. While dredging activity and placement of the<br />
conveyor pipe and sand distribution at the receiver sites would<br />
generate noise, the impact would be less than significant.<br />
Nighttime and weekend work at receiver beaches would be<br />
performed under variance from the local noise ordinance where<br />
required. Residents of homes near the receiver sites would be<br />
notified prior to the work, and adverse nighttime noise events<br />
would occur for no more than three consecutive days within 200<br />
As no beach replenishment activities would<br />
occur, no trips would be generated.<br />
As no construction would occur, no air quality<br />
impacts would result.<br />
There would be no change to current noise<br />
levels.<br />
R<br />
R<br />
R<br />
<strong>Regional</strong> <strong>Beach</strong> <strong>Sand</strong> <strong>Project</strong> <strong>EIR</strong>/<strong>EA</strong><br />
99-69\SANDAG <strong>EIR</strong><strong>EA</strong> es.wpd 7/17/00<br />
Page ES-27
Executive Summary<br />
Table ES-7. Continued<br />
Alternative 1 Alternative 2 No Action<br />
feet of the homes. Booster pumps would be electric motor driven<br />
or diesel engines that would be shielded to attenuate noise to less<br />
than significant levels.<br />
feet of the homes. Booster pumps would be electric motor<br />
driven or diesel engines that would be shielded to attenuate noise<br />
to less than significant levels.<br />
Alternative 1b. Noise generation would be the same as Alternative<br />
1a. No noise ordinance variances would be required. Short-term<br />
nighttime and weekend impacts would not occur at receiver beaches<br />
where nighttime and weekend work is prohibited. Other impacts<br />
and noise reduction measures would be the same as for Alternative<br />
1a. Impacts would be less than significant.<br />
Alternative 2b. Noise generation would be the same as<br />
Alternative 2a. No noise ordinance variances would be required.<br />
Short-term nighttime and weekend impacts would not occur at<br />
receiver beaches where nighttime and weekend work is<br />
prohibited. Other impacts and noise reduction measures would be<br />
the same as for Alternative 1a. Impacts would be less than<br />
significant.<br />
Page ES-28<br />
<strong>Regional</strong> <strong>Beach</strong> <strong>Sand</strong> <strong>Project</strong> <strong>EIR</strong>/<strong>EA</strong><br />
99-69\SANDAG <strong>EIR</strong><strong>EA</strong> es.wpd 7/17/00
Executive Summary<br />
Cumulative impacts were analyzed in consideration of other reasonably foreseeable projects in the vicinity<br />
of project areas. Cumulative projects considered in the analysis consist of other ongoing or proposed<br />
beach nourishment projects adjacent to the receiver sites; capital improvement or development projects<br />
proposed adjacent to receiver sites; and proposed actions adjacent to the borrow sites. The analysis<br />
concludes that no significant cumulative impacts would result with implementation of Alternatives 1, 2, or<br />
the No Action Alternative.<br />
ES-9<br />
OTHER NEPA/CEQA CONSIDERATIONS<br />
This section of the EIS/<strong>EIR</strong> addresses various other topics required by NEPA and CEQA.<br />
Significant Unavoidable Adverse Effects<br />
The <strong>EIR</strong>/<strong>EA</strong> evaluated the proposed alternatives with respect to numerous issues. None of the potential<br />
impacts associated with the proposed project, as defined to include the monitoring and mitigation plan<br />
described in subsection ES-5, would be considered significant.<br />
Short-term Uses and Long-term Productivity<br />
Implementation of the proposed action would not result in any environmental impacts that would<br />
significantly narrow the range of beneficial uses of the environment or pose long-term risks to health, safety,<br />
or the general welfare of the public communities surrounding the receiver sites. Rather, the project would<br />
provide for future beneficial beach resources (e.g., recreational activities, sandy shoreline habitat).<br />
Irreversible/Irretrievable Commitments of Resources<br />
The proposed action would result in the consumptive use of nonrenewable energy sources and labor<br />
required to operate dredges, trucks, pumping equipment, and grading equipment. The proposed action<br />
would not result in the use of a substantial amount of resources and would be short-term in nature.<br />
Additionally, no natural resources would be permanently destroyed and beach replenishment would be<br />
considered beneficial to the region.<br />
<strong>Regional</strong> <strong>Beach</strong> <strong>Sand</strong> <strong>Project</strong> <strong>EIR</strong>/<strong>EA</strong><br />
99-69\SANDAG <strong>EIR</strong><strong>EA</strong> es.wpd 7/17/00<br />
Page ES-29
Executive Summary<br />
Growth Inducement<br />
The proposed action would result in a temporary increase in beach area and sand cover at up to 12<br />
receiver sites. A benefit of the project would be enhancement or continuation of the recreational usage of<br />
each of the receiver sites. The resulting temporary recreational benefits derived from the additional beach<br />
area would not be expected to increase the demand for public services and utilities, nor create a need for<br />
additional recreational facilities above current projections.<br />
Effects Found Not to Be Significant<br />
The Initial Study prepared for project evaluated several issues found not to be significant, and were<br />
therefore not analyzed in this <strong>EIR</strong>/<strong>EA</strong>. These issues were hazards and hazardous materials, mineral<br />
resources, public services, agricultural resources, and population and housing. The remainder of the issue<br />
areas listed in the Initial Study form were evaluated in detail in this document in Chapter 4.0. This analysis<br />
determined that the proposed San Diego <strong>Regional</strong> <strong>Beach</strong> <strong>Sand</strong> <strong>Project</strong>, as defined to include the monitoring<br />
and mitigation program in subsection ES-5, would not have a long-term significant effect on any of the<br />
evaluated issue areas.<br />
Protection of Children from Environmental Health Risks and Safety Risks<br />
There would be no disproportionate impacts to children during implementation of the proposed sand<br />
replenishment project. No significant impacts would occur and there is no indication that any impacts<br />
would disproportionately accrue to children. Areas of replenishment would be restricted during project<br />
implementation for safety reasons and no long-term effects would occur after the beach areas were<br />
reopened for public use.<br />
Environmental Justice<br />
The proposed sand replenishment project would not have a disproportionate impact on minority<br />
populations or low-income populations because the areas encompassed by the replenishment sites do not<br />
include disproportionately high minority populations or low-income populations compared to the contiguous<br />
cities or the county.<br />
Page ES-30<br />
<strong>Regional</strong> <strong>Beach</strong> <strong>Sand</strong> <strong>Project</strong> <strong>EIR</strong>/<strong>EA</strong><br />
99-69\SANDAG <strong>EIR</strong><strong>EA</strong> es.wpd 7/17/00
Executive Summary<br />
Essential Fish Habitat<br />
The project action would not result in long-term or significant effects to sustainable fisheries present in the<br />
Coastal Pelagics or Pacific Groundfish Fish Management Plans. During dredging activities, fish would<br />
move from the area of active dredge, but these species would not be lost to the ecosystem nor would<br />
migration patterns be affected. Fish that feed on benthic biota would experience short-term loss of prey,<br />
but because the active area of dredge would be small, the affect would not be significant. All dredging<br />
operations would be performed in conformance with the permit conditions established by the 401 permit<br />
issued by the RWQCB to control turbidity.<br />
ES-10 AGENCY COORDINATION<br />
Federal, state, and local agencies were consulted prior to and during the preparation of this <strong>EIR</strong>/<strong>EA</strong>.<br />
Agencies were notified of dredging and replenishment plans for closure and disposal activities by mailings;<br />
by scheduled public meetings; and by publication of an NOP announcing preparation of a Draft <strong>EIR</strong>/<strong>EA</strong>,<br />
as required by CEQA and NEPA. The agencies’ viewpoints were solicited with regard to activities within<br />
their jurisdiction. In addition, close coordination has occurred among SANDAG, the Navy, local<br />
jurisdictions and regulatory agencies since the inception of this project. The alternatives analyzed in this<br />
document are the result of an iterative process to present information to the resource agencies, obtain their<br />
input, incorporate modifications into project design, and present the revised plan. Numerous interactive<br />
meetings were held between March 1999 and May 2000 to facilitate this process.<br />
R<br />
<strong>Regional</strong> <strong>Beach</strong> <strong>Sand</strong> <strong>Project</strong> <strong>EIR</strong>/<strong>EA</strong><br />
99-69\SANDAG <strong>EIR</strong><strong>EA</strong> es.wpd 7/17/00<br />
Page ES-31
1.0 Introduction<br />
CHAPTER 1.0<br />
INTRODUCTION<br />
1.1 BACKGROUND<br />
This Environmental Impact Report (<strong>EIR</strong>)/Environmental Assessment (<strong>EA</strong>) addresses the potential<br />
environmental consequences of the San Diego Association of Governments’ (SANDAG) proposed<br />
<strong>Regional</strong> <strong>Beach</strong> <strong>Sand</strong> <strong>Project</strong>. SANDAG proposes to replenish approximately 2 million cubic yards (cy)<br />
of clean beach-quality sand on up to 13 receiver sites in the San Diego region. The receiver sites are<br />
located from Oceanside in the north to Imperial <strong>Beach</strong> in the south. <strong>Sand</strong> would be dredged from six<br />
offshore borrow sites. A regional location map, including the proposed receiver sites and sand borrow<br />
sites, is shown in Figure 1-1.<br />
SANDAG is the state lead agency responsible for compliance with the California Environmental Quality<br />
Act of 1970 (CEQA) statutes (Cal. Pub. Res. Code § 21 et seq., as amended) and implementing guidelines<br />
(Cal. Code Regs., Title 14, § 15000 et seq. (1998); and the Department of the Navy (Navy) is the federal<br />
lead agency responsible for compliance with the National Environmental Quality Act of 1969 (NEPA) (42<br />
U.S.C. § 4332 (1994)) in accordance with the Council on Environmental Quality (CEQ) regulations<br />
implementing NEPA (40 C.F.R. §§ 1500-1508) and U.S. Navy regulations implementing NEPA (32<br />
C.F.R. Part 775). The two agencies have agreed to prepare a joint <strong>EIR</strong>/<strong>EA</strong> pursuant to both CEQA and<br />
NEPA. The Navy will be contributing funds for this project as appropriated by Congress in fiscal year<br />
1998 Supplemental Appropriations and Recission Act. An overview of NEPA and CEQA and other<br />
applicable environmental laws and regulations is provided in Appendix A.<br />
1.1.1 <strong>Project</strong> Background<br />
The San Diego region’s beaches and seacliffs have been steadily eroding for several decades. The region<br />
is experiencing a net loss of sand at numerous beaches along its coastline. The Coast of California Storm<br />
and Tidal Waves Study (CCSTWS), a six-year, $6 million scientific evaluation of the San Diego region’s<br />
shoreline conducted by the U.S. <strong>Army</strong> Corps of Engineers (USACOE) documented the factors causing<br />
shoreline erosion and projected trends of increasing beach loss and property damage in the future<br />
(USACOE 1991).<br />
<strong>Regional</strong> <strong>Beach</strong> <strong>Sand</strong> <strong>Project</strong> <strong>EIR</strong>/<strong>EA</strong> Page 1-1<br />
99-69\SANDAG <strong>EIR</strong><strong>EA</strong> 3.4.wpd 7/17/00
1.0 Introduction<br />
<strong>Beach</strong> sand is a product of weathering of the land. The primary natural source for the region’s beaches<br />
is sediment carried from inland areas by rivers and streams. Over the past half century, human actions have<br />
been the major influence affecting the shoreline. Through urban development activities, including water<br />
reservoir and dam building, flood control systems and sand mining, natural sediment transport has been<br />
hindered or eliminated. Most major coastal streams have at least one dam and reservoir. Much of the<br />
fresh water that naturally flowed to coastal wetlands is diverted to farms and cities. These dams reduce<br />
the size of flood flows and thus reduce the flushing of sediment from estuaries. They also trap sand that<br />
would otherwise nourish coastal beaches. This beach sand is the primary buffer protecting seacliffs and<br />
coastal development from erosion and storm damage. To offset the loss of natural sand sources no longer<br />
reaching the shoreline, previous projects have built “man made” beaches. Most of the sand for this purpose<br />
has come from the massive harbor dredging projects in San Diego Bay and Oceanside Harbor. While the<br />
likelihood is low that sources of sand as large as these dredging projects will be available in the future, sand<br />
replenishment projects would help to offset the gradual thinning and disappearance of the region’s beaches;<br />
loss of environmental, recreational, economic, and aesthetic benefits; and the increasing destruction of<br />
coastal property and development.<br />
The natural sand cycle is a seasonal process. Typically for the San Diego region, beach sand loss occurs<br />
in the winter due to large storms and waves, followed by a period of sand gain during the summer’s gentler<br />
storms and surf. During the winter, sand shifts from the beach above the mean sea level to the larger<br />
portion of the beach offshore covered by seawater. These combined seasonal processes, including both<br />
winter and summer sand shifts, comprise a complete sedimentation cycle.<br />
A coastal segment that contains a complete sedimentation cycle is defined as a littoral cell. It is the dynamic<br />
interface between the ocean and the land. Along the San Diego region’s coast, there are three littoral cells<br />
that cycle sand on and off the beaches (Figure 1-2). Bounded on one side by the landward limit of the<br />
beach and extending seaward beyond the area of breaking waves, a littoral cell is the region where wave<br />
energy dissipates. Littoral cells are physically interconnected; occurrences in one part of a littoral cell will<br />
ultimately have an impact on other parts. The three littoral zones off of the San Diego region include the<br />
southern half of the Oceanside Littoral Cell, the Mission Bay Littoral Cell, and the Silver Strand Littoral<br />
Cell. The southern half of the Oceanside Littoral Cell stretches from Oceanside to La Jolla 1 and includes<br />
the shorelines of the cities of Oceanside, Carlsbad, Encinitas, Solana <strong>Beach</strong>, Del Mar, and San Diego. The<br />
Mission Bay Littoral Cell includes Ocean, Mission, and Pacific beaches in the City of San Diego. The<br />
1 The northern half of the Oceanside Littoral Cell extends from Oceanside to Dana Point in Orange County.<br />
Page 1-2<br />
<strong>Regional</strong> <strong>Beach</strong> <strong>Sand</strong> <strong>Project</strong> <strong>EIR</strong>/<strong>EA</strong><br />
99-69\SANDAG <strong>EIR</strong><strong>EA</strong> 3.4.wpd 7/17/00
4.0 Environmental Consequences<br />
B<strong>EA</strong>CH REPLENISHMENT SITES<br />
OFFSHORE BORROW SITES<br />
SAND DELIVERY PIPELINES<br />
Source: SANDAG<br />
Figure 1-1<br />
<strong>Regional</strong> Location Map<br />
NORTH<br />
<strong>Regional</strong> <strong>Beach</strong> <strong>Sand</strong> <strong>Project</strong> <strong>EIR</strong>/<strong>EA</strong><br />
9969 SANDAG <strong>Beach</strong> Replenishment/Figures/Fig 1-1 Reg Loc map 9/15/99<br />
Page 1-3
X.X Section Name<br />
Oceanside Littoral Cell<br />
Pacific<br />
Mission Bay Littoral Cell<br />
Silver Strand Littoral Cell<br />
Source: Moffatt & Nichol Engineers<br />
NORTH<br />
0<br />
10 Miles<br />
Figure 1-2<br />
Littoral Cells<br />
in the San Diego Region<br />
<strong>Regional</strong> <strong>Beach</strong> <strong>Sand</strong> <strong>Project</strong> <strong>EIR</strong>/<strong>EA</strong><br />
9969 <strong>Sand</strong> Replenishment\Figures\Fig 1-2 Littoral Cells 8/19/99<br />
Page 1-4
1.0 Introduction<br />
Silver Strand Littoral Cell extends from south of the international border to the Zuniga Jetty at San Diego<br />
Bay and includes the shorelines of the cities of Imperial <strong>Beach</strong> and Coronado.<br />
Within the littoral cell, sand can move up and down the coast as well as on and offshore. <strong>Sand</strong> can also<br />
be carried by littoral drift into submerged canyons. For example, it has been estimated that Scripps<br />
Submarine Canyon near La Jolla may, in some years, receives 220,000 cy of sand from littoral drift<br />
(Moffatt & Nichol 2000a). <strong>Sand</strong> that drifts into submerged canyons essentially exits the littoral cell, and<br />
it is no longer available to replenish beaches during the summer. The seaward edge of an active littoral cell<br />
is defined as its “depth of closure.” Substantial quantities of sand from coastal littoral cells do not usually<br />
travel outside of this depth and into the deeper ocean. Correspondingly, sand outside the depth of closure<br />
does not move back into the littoral cell. In San Diego, the depth of closure ranges from approximately -26<br />
to -46 feet (Moffatt & Nichol 2000a). The proposed dredging activities would take sand from borrow<br />
sites 2 outside (deeper than) the depth of closure and place sand within the three littoral cells. The new sand<br />
being introduced to the system is expected to remain within the respective littoral cells and enter the<br />
seasonal cycle of beach loss and gain. Conversely, dredging inside (shallower than) the depth of closure<br />
would merely relocate sand material already within the littoral cell. (More information on littoral processes<br />
and coastal geology is found in Sections 3.1 and 4.1 of this <strong>EIR</strong>/<strong>EA</strong>.)<br />
In response to the concerns about erosion voiced by citizens and communities up and down the coast, and<br />
documented by the CCSTWS, SANDAG worked with member agencies to prepare the Shoreline<br />
Preservation Strategy for the San Diego Region (SANDAG 1993). The Shoreline Preservation<br />
Strategy is a strategy with a menu of solutions to address shoreline erosion including beach building by<br />
placing large amounts of sand on eroded beaches, structures such as groin fields to help hold sand in place,<br />
structures such as seawalls and sand berms to protect property, and policies and regulations regarding the<br />
use of the shoreline and its development such as bluff top building setbacks. Further, these tactics are<br />
divided into regional scale actions (beach building, redistributing sand via groins, breakwaters, etc.) and<br />
local scale methods (requiring setbacks, bluff top erosion management via irrigation controls, seawalls and<br />
revetments).<br />
The Shoreline Preservation Strategy recommends further engineering, economic and environmental<br />
design studies. It does not identify generalized locations for structures such as groins, but it does contain<br />
recommendations for sand volumes to be placed in each of the three littoral cells along the San Diego<br />
R<br />
R<br />
R<br />
R<br />
R<br />
R<br />
R<br />
R<br />
R<br />
R<br />
R<br />
R<br />
R<br />
R<br />
2<br />
The term “borrow” refers to material to be taken from one location to be used as fill at another location.<br />
<strong>Regional</strong> <strong>Beach</strong> <strong>Sand</strong> <strong>Project</strong> <strong>EIR</strong>/<strong>EA</strong> Page 1-5<br />
99-69\SANDAG <strong>EIR</strong><strong>EA</strong> 3.4.wpd 7/17/00
1.0 Introduction<br />
region. A total of up to 30 million cy is identified in an initial beach building phase with a capital cost of R<br />
approximately $150 million, to be supplemented by yearly maintenance. These estimates are qualified that R<br />
any future design study could “recommend a less extensive, less costly program.”<br />
R<br />
R<br />
Funding sources to implement the Shoreline Preservation Strategy are identified in concept, anticipating R<br />
that state and federal funds would cover only a portion of the total financing needs and that a major portion R<br />
would have to come from local and regional sources. To date, the coastal cities have assessed themselves R<br />
approximately $70,000 yearly to fund a coastal monitoring program. Other, one-time-only, funds totaling R<br />
$14.3 million have been provided by the Navy and California Department of Boating and Waterways R<br />
(Section 2.1.4). While the SEC continues to solicit funds to implement portions of the strategy, they have R<br />
not been successful to date. In April 2000, a grant application for $64,000 to support a study on possible R<br />
sand retention features was submitted to several state and federal entities for funding. All responded R<br />
negatively.<br />
R<br />
1.1.2 Previous Environmental Documentation<br />
In 1993, SANDAG prepared the Shoreline Preservation Strategy for the San Diego Region, which<br />
identified regional coastal areas with critical shoreline problems and recommended a strategy to address<br />
the issue. Independent of that report, the Navy began to analyze a separate action in the Final<br />
Environmental Impact Statement (EIS) for the Development of Facilities in San Diego/ Coronado<br />
to Support the Homeporting of One NIMITZ Class Aircraft Carrier (Department of the Navy 1995).<br />
In order to accommodate the carrier, the Navy proposed to dredge the carrier berthing area, turning basin,<br />
and the San Diego Bay navigation channel. A portion of the dredged sediment was initially believed to be<br />
suitable for beach replenishment. As one option to dispose of the dredged material from the Homeporting<br />
project, the Navy evaluated nine beach receiver sites in the San Diego region in this EIS.<br />
The Navy subsequently prepared two <strong>EA</strong>s as tiered analyses to the EIS due to subsequent changes in the<br />
location of beach receiver sites. These two <strong>EA</strong>s are Environmental Assessment for <strong>Beach</strong><br />
Replenishment at South Oceanside and Cardiff/Solana <strong>Beach</strong>, California (Department of the Navy<br />
1997a) and Environmental Assessment for <strong>Beach</strong> Replenishment at North Carlsbad, South Carlsbad,<br />
Encinitas, and Torrey Pines (Department of the Navy 1997b). As a result of the Homeporting project<br />
and subsequent <strong>EA</strong>s, permits were issued to the Navy to place approximately 5.5 million cy of sand<br />
dredged from San Diego Bay, both onshore and nearshore, at 11 receiver sites along the San Diego region<br />
coastline (Table 1-1). During beach replenishment in Oceanside, however, munitions were found in the<br />
Page 1-6<br />
<strong>Regional</strong> <strong>Beach</strong> <strong>Sand</strong> <strong>Project</strong> <strong>EIR</strong>/<strong>EA</strong><br />
99-69\SANDAG <strong>EIR</strong><strong>EA</strong> 3.4.wpd 7/17/00
1.0 Introduction<br />
dredged materials from San Diego Bay and replenishment efforts were halted. For safety reasons, the<br />
dredged material was relocated to LA-5, a disposal site approved by the U.S. Environmental Protection<br />
Agency (USEPA). This disposal site is located in 600 feet of water approximately 6.4 nautical miles<br />
southwest of Point Loma. Prior to the halting of the beach replenishment disposal, approximately 284,000<br />
cy of sediment were placed on three receiver sites; specifically, Oceanside, Del Mar, and Mission <strong>Beach</strong>.<br />
Oceanside received 102,000 cy (onshore), Del Mar received 170,000 cy (nearshore), and Mission <strong>Beach</strong><br />
received 12,000 cy (nearshore).<br />
Table 1-1<br />
Comparison of <strong>Sand</strong> Replenishment for<br />
Navy Homeporting <strong>Project</strong> and San Diego <strong>Regional</strong> <strong>Beach</strong> <strong>Sand</strong> <strong>Project</strong><br />
Receiver Site<br />
Homeporting <strong>Project</strong><br />
(cubic yards)<br />
<strong>Regional</strong> <strong>Beach</strong> <strong>Sand</strong> <strong>Project</strong> (1)<br />
(cubic yards)<br />
Oceanside Onshore 1,044,298 Onshore 380,000<br />
Carlsbad<br />
Encinitas<br />
North Carlsbad Onshore 445,526 Onshore 240,000<br />
South Carlsbad, North Onshore 251,164 Onshore 160,000<br />
South Carlsbad, South Onshore 503,080 Onshore 0<br />
Batiquitos 0 Onshore 118,000<br />
Leucadia 0 Onshore 130,000<br />
Moonlight <strong>Beach</strong> 0 Onshore 88,000<br />
Cardiff Onshore 283,501 Onshore 104,000<br />
Solana <strong>Beach</strong> Onshore 178,227 Onshore 140,000<br />
Del Mar Nearshore 450,027 Onshore 180,000<br />
Torrey Pines<br />
Torrey Pines North Onshore 296,172 Onshore 0<br />
Torrey Pines South Onshore 230,359 Onshore 240,000<br />
Mission <strong>Beach</strong> Nearshore 860,051 Onshore 100,000<br />
Imperial <strong>Beach</strong> Nearshore 915,665 Onshore 120,000<br />
Total 5,458,070 2,000,000 (1)<br />
(1)<br />
Reflects quantity of sand based on Alternative 1. One other alternative analyzed in detail in this <strong>EIR</strong>/<strong>EA</strong><br />
would result in a maximum of 2.04 million cy of sand to be replenished with fewer receiver sites and a greater<br />
amount of material at some remaining sites.<br />
<strong>Regional</strong> <strong>Beach</strong> <strong>Sand</strong> <strong>Project</strong> <strong>EIR</strong>/<strong>EA</strong> Page 1-7<br />
99-69\SANDAG <strong>EIR</strong><strong>EA</strong> 3.4.wpd 7/17/00
1.0 Introduction<br />
The proposed <strong>Regional</strong> <strong>Beach</strong> <strong>Sand</strong> <strong>Project</strong> proposes placement of less total material (2 million vs. 5.5<br />
million cy) over generally the same receiver sites as the Navy’s permitted project. The proposed project<br />
does differ, however, because the sand source has changed from dredged material in San Diego Bay to<br />
dredged material from six offshore borrow sites, and additional receiver site locations have been added.<br />
Table 1-1 provides a comparison between the Homeporting project which was permitted and partially<br />
implemented, and the alternative under the <strong>Regional</strong> <strong>Beach</strong> <strong>Sand</strong> <strong>Project</strong> with the maximum number of<br />
receiver sites. Existing data from the Navy’s prior analyses are used, where applicable, throughout this<br />
<strong>EIR</strong>/<strong>EA</strong> and the monitoring program established by the Navy project permits is used as a framework for<br />
designing the monitoring program for this project.<br />
1.2 PURPOSE AND NEED<br />
The purpose of the proposed beach replenishment project is to replenish beaches in accordance with the<br />
Shoreline Preservation Strategy. This document identified regional coastal areas with critical shoreline<br />
problems. SANDAG’s Shoreline Erosion Committee (SEC) has used this as a basis for identifying up to<br />
13 receiver sites which have experienced erosion and need replenishment. The proposed action would<br />
provide immediate benefit by placing suitable beach fill directly onto the region’s beaches rather than<br />
placing some of it in the nearshore zone. The proposed action would serve four main functions: 1) to<br />
replenish the three littoral cells and receiver sites with suitable beach sand; 2) to provide enhanced<br />
recreational opportunities and access at the receiver sites; 3) to enhance the tourism potential of the San<br />
Diego region; and 4) to increase protection of public property and infrastructure.<br />
As the project has evolved, it has become apparent that predicting sand movement in the highly dynamic<br />
ocean system is difficult. Another project feature is to establish replenishment sites which can be useful in<br />
evaluating the predictions of the state-of-the-art modeling used in this process and thereby assist with any<br />
future beach replenishment efforts in the region.<br />
1.3 PROPOSED ACTION<br />
The proposed action is beach replenishment of the San Diego region’s eroding beaches using<br />
approximately 2 million cy of dredged sediment from offshore borrow sites located outside of the depth<br />
of closure (i.e., outside of the respective littoral cells). Based on the recommendation of the SEC, one<br />
replenishment action would involve up to 12 receiver sites using dredged sediment from six borrow sites.<br />
This is the SEC’s preferred alternative. This document also evaluates, at an equal level of detail, one<br />
Page 1-8<br />
<strong>Regional</strong> <strong>Beach</strong> <strong>Sand</strong> <strong>Project</strong> <strong>EIR</strong>/<strong>EA</strong><br />
99-69\SANDAG <strong>EIR</strong><strong>EA</strong> 3.4.wpd 7/17/00
1.0 Introduction<br />
possible alternative for replenishment at nine receiver sites and the same six borrow sites. Between the two<br />
alternatives, a total of 13 receiver sites are proposed and, along with the six proposed borrow sites, are<br />
introduced below. A complete description of both alternatives is found in Section 2.4. The project was<br />
originally scheduled to start in late summer 2000 but the schedule has been modified to spring 2000 based<br />
on the recommendation of the SEC at their May 2000 meeting.<br />
R<br />
R<br />
R<br />
Implementation of Alternative 1 would occur on the following 12 beaches in the San Diego region: South<br />
Oceanside, North Carlsbad, South Carlsbad North, Batiquitos, Leucadia, Moonlight, Cardiff, Fletcher<br />
Cove, Del Mar, Torrey Pines, Mission <strong>Beach</strong>, and Imperial <strong>Beach</strong>. In addition, a receiver site at South<br />
Carlsbad South is proposed under Alternative 2 that is not associated with Alternative 1 (refer to Figure<br />
1-1). Most of the 13 possible receiver sites are within suburban areas of the San Diego region and are<br />
bordered by residential, commercial, or light industrial uses. All or portions of the beaches in Carlsbad,<br />
Encinitas, and San Diego are State <strong>Beach</strong>es. The locations of all the potential receiver sites (north to south)<br />
are identified briefly below. The locations reflect the receiver site footprint with the maximum length under<br />
either alternative. Refer to Section 2.4 for a detailed description of receiver sites under each alternative.<br />
The South Oceanside receiver site is near Buccaneer <strong>Beach</strong> and stretches for approximately two miles from<br />
Seagaze Drive to Vista Way under the maximum length alternative. The proposed receiver site consists<br />
of a narrow, eroded beach with rip-rap (large boulders) slopes from the back of existing residences to the<br />
approximate high tide mark. The receiver site gently slopes from the high tide mark into the surf zone.<br />
Because the immediate area has not been developed, there is a sandy beach approximately 150 feet wide<br />
and 125 feet from the road to the line of rip-rap which protects homes to the north and south of Buccaneer<br />
<strong>Beach</strong>.<br />
The North Carlsbad receiver site is located south of the Buena Vista Lagoon and extends for over 3,000<br />
feet (0.6 mile) to just south of Carlsbad Village Drive (Elm Avenue). This beach segment consists of a<br />
predominantly flat and narrow sandy beach, extending from the surf line to rip-rap slopes and sea walls that<br />
protect existing beach front residences and fragile bluffs.<br />
The South Carlsbad receiver sites, both North and South, are adjacent to the Carlsbad State <strong>Beach</strong><br />
campground facilities near Encinas Creek. These beach segments cover approximately 0.4 mile and 0.3<br />
mile, respectively. The existing beach in this area consists of an eroded and flat sandy beach with scattered<br />
cobbles and vegetated bluffs. The proposed receiver sites lie at the base of a steep slope varying in height<br />
from approximately 60 to 80 feet.<br />
<strong>Regional</strong> <strong>Beach</strong> <strong>Sand</strong> <strong>Project</strong> <strong>EIR</strong>/<strong>EA</strong> Page 1-9<br />
99-69\SANDAG <strong>EIR</strong><strong>EA</strong> 3.4.wpd 7/17/00
1.0 Introduction<br />
The Batiquitos receiver site is located approximately 1,000 feet south of the Batiquitos Lagoon (the area<br />
is also known as “Ponto”), stretching for approximately 1,390 feet (0.3 mile) into the community of<br />
Leucadia and Leucadia State <strong>Beach</strong>. At the northern part of the receiver site, a relatively flat, sandy and<br />
cobbly beach exists. Steep cliffs abut the southern portion of the proposed receiver site, where a gently<br />
sloping sand beach with scattered rocks, cobbles, and rip-rap exists. During high tide, the beach is<br />
completely washed over by incoming surf. Several residences are located on the bluff above.<br />
The proposed receiver site at Leucadia extends approximately 2,700 feet (0.5 mile) from just south of the<br />
Grandview access stairs to Glaucus Street. The Leucadia receiver site is similar to the southern end of the<br />
Batiquitos receiver site in that steep cliffs abut the beach. The beach consists of a gently sloping sand beach<br />
with scattered rocks, cobbles, and rip-rap. At high tide waves crash against the bluffs. Several residences<br />
are located on the bluff above.<br />
The proposed Moonlight <strong>Beach</strong> receiver site is located at the foot of Encinitas Boulevard at Moonlight<br />
State <strong>Beach</strong>. The proposed receiver site is approximately 770 feet long (0.1 mile) and is adjacent to<br />
residential uses. Moonlight State <strong>Beach</strong> consists of a gently sloping beach with sand and cobbles.<br />
The Cardiff receiver site is located south of the San Elijo Lagoon mouth and also south of Restaurant Row<br />
along Coast Highway 101. The receiver site extends approximately 780 feet (0.1 mile). The severely<br />
eroded beach is mostly cobbles and is steeply sloping. The beach and surfing area is also known as<br />
George’s.<br />
The Solana <strong>Beach</strong> receiver site’s northern boundary is just south of Fletcher Cove <strong>Beach</strong> Park, and<br />
extends approximately 1,800 feet (0.3 mile) to the south. Steep cliffs abut the receiver site and the beach<br />
consists of a gently sloping sand beach with scattered rocks and cobbles. Rip-rap and other revetments<br />
line the cliffs in an ongoing effort to slow wave-induced erosion. At high tide the beach is not visible along<br />
the majority of the receiver site as waves crash directly against the cliffs. The only exception is the small<br />
sandy beach at Fletcher Cove which sits above the high tide mark.<br />
The Del Mar receiver site consists of a gently sloping and relatively wide sandy beach. Residential uses<br />
abut the receiver site, which extends from 27 th Street to Powerhouse Park, a distance of approximately<br />
3,110 feet (0.6 mile). R<br />
Page 1-10<br />
<strong>Regional</strong> <strong>Beach</strong> <strong>Sand</strong> <strong>Project</strong> <strong>EIR</strong>/<strong>EA</strong><br />
99-69\SANDAG <strong>EIR</strong><strong>EA</strong> 3.4.wpd 7/17/00
1.0 Introduction<br />
The Torrey Pines receiver site, located within the City of San Diego, is bordered by the Los Peñasquitos<br />
Lagoon and Torrey Pines State Reserve. The receiver site, under the maximum length alternative, stretches<br />
for approximately 2,470 feet (0.5 mile) and is located on Torrey Pines State <strong>Beach</strong>. The beach is a gently<br />
sloping thin sand beach with scattered cobbles and high bluffs along Torrey Pines State Reserve. During<br />
high tide, waves crash against the bluffs along the southern portion of the receiver site. There is also rip-rap<br />
in some areas to protect North Torrey Pines Road from storm wave action.<br />
The Mission <strong>Beach</strong> receiver site, also within the City of San Diego, is north of the Mission Bay Entrance<br />
Channel. Under the maximum length alternative, the proposed receiver site extends approximately 2,380<br />
feet (0.5 mile) from Ostend Court to Santa Barbara Place and is a gently sloping, relatively wide sandy<br />
beach. The Boardwalk abuts the proposed receiver site.<br />
The Imperial <strong>Beach</strong> receiver site is adjacent to the Tijuana Slough National Wildlife Park and<br />
predominantly residential development. The receiver site, under the maximum length alternative, extends<br />
for approximately 3,470 feet (0.7 mile) from Imperial <strong>Beach</strong> Boulevard to approximately 1,000 feet south<br />
of Encanto Avenue. The northern end of the receiver site, from Imperial <strong>Beach</strong> Boulevard to <strong>Beach</strong><br />
Avenue, has some sand and cobble, but south of <strong>Beach</strong> Avenue the beach consists entirely of cobble.<br />
All of the proposed borrow sites are surrounded by ocean water; the primary recreational activities<br />
occurring nearby are boating, sailing, and diving pursuits.<br />
1.4 PUBLIC INVOLVEMENT PROCESS<br />
To identify key issues and concerns relevant to the scope of the <strong>EIR</strong>/<strong>EA</strong>, SANDAG and the Navy<br />
encouraged participation in the environmental review process from public agencies, special interest groups,<br />
and the general public. A major component of this process is public scoping. Scoping is a public process<br />
designed to determine the breadth of issues to be addressed in the <strong>EIR</strong>/<strong>EA</strong>. The different aspects of the<br />
public scoping discussed in this section include the Notice of Preparation (NOP), and areas of controversy<br />
identified as a result of public scoping.<br />
<strong>Regional</strong> <strong>Beach</strong> <strong>Sand</strong> <strong>Project</strong> <strong>EIR</strong>/<strong>EA</strong> Page 1-11<br />
99-69\SANDAG <strong>EIR</strong><strong>EA</strong> 3.4.wpd 7/17/00
1.0 Introduction<br />
1.4.1 Notice of Preparation (NOP)<br />
Both NEPA and CEQA regulations require an early and open process for determining the scope of issues<br />
that should be addressed prior to implementation of a proposed action. SANDAG initiated the 30-day<br />
scoping process on April 21, 1999. NEPA does not require public notification for preparation of an <strong>EA</strong>.<br />
The NOP provides formal notification to all federal, state, and local agencies involved with funding or<br />
approval of the project, and to other interested organizations and members of the public, that an <strong>EIR</strong>/<strong>EA</strong><br />
will be prepared for the project. The NOP is intended to encourage interagency communication concerning<br />
the proposed action and provide sufficient background information about the proposed action so that<br />
agencies, organizations, and individuals can respond with specific comments and questions on the scope<br />
and content of the <strong>EIR</strong>/<strong>EA</strong>. As part of the NOP, an Initial Study was prepared. Copies of the NOP and<br />
Initial Study are included in Appendix B.<br />
1.4.2 Comments Received During Scoping<br />
During the 30-day public scoping period, a total of 17 written comment letters were received. All are<br />
reproduced in Appendix B. Various issues raised during this process are summarized below by topic.<br />
Description of Proposed Action and Alternatives<br />
• need more information on timing of the proposed action<br />
• clear description of project including schedule for beach replenishment<br />
• need more information on how the construction training dikes will operate<br />
• the proposed dikes should include design dimensions as well as construction and removal details<br />
• indicate how offshore activity and piping will meet Coast Guard, U.S. Marine Corps, and navigational<br />
requirements<br />
Coastal Wetlands<br />
• clearly describe potential impacts to all coastal wetlands<br />
• include a description of any monitoring programs at coastal lagoons<br />
• impacts from accumulation of sediments at lagoon inlets and creek and river outlets should be<br />
addressed<br />
Page 1-12<br />
<strong>Regional</strong> <strong>Beach</strong> <strong>Sand</strong> <strong>Project</strong> <strong>EIR</strong>/<strong>EA</strong><br />
99-69\SANDAG <strong>EIR</strong><strong>EA</strong> 3.4.wpd 7/17/00
1.0 Introduction<br />
Water Resources<br />
• drainage in and around pipelines needs to be addressed at all storm drain areas<br />
• describe any debris from discharge points that would end up on the beach<br />
Biological Resources<br />
• impacts to plants, fish, and wildlife populations and their habitats, energy supplies, and reproductive<br />
requirements<br />
• impacts to vegetated intertidal and subtidal areas should be addressed<br />
• impacts to fisheries and clamming in and adjacent to the project area should be addressed<br />
• impacts resulting from increased turbidity to biological resources and commercial invertebrate species<br />
(e.g., lobster, urchins, crabs, and abalone) in their larval and post-larval invertebrate settlement stages<br />
should be addressed<br />
• impacts and mitigation for the Pismo clam (particularly in the Mission <strong>Beach</strong> and Silver Strand areas)<br />
should be addressed<br />
• impacts and mitigation for the California least tern, California brown pelican, and snowy plover should<br />
be addressed<br />
• the project should include a multi-year monitoring program for impacts to offshore marine resources<br />
as well as a mitigation proposal to address any adverse impacts to marine habitat in the event they are<br />
shown by the monitoring to occur<br />
• need to locate, identify and describe all seagrass ecosystems and biological resources within the project<br />
location<br />
Cultural Resources<br />
• impacts should be evaluated on prehistoric cultural resources, especially from the following offshore<br />
borrow sites: AH-1, SO-7, SO-6 and SO-4<br />
• mitigation should be provided for any found cultural materials during dredging activities<br />
Land and Water Use<br />
• impacts to State Lands Commission sovereign lands should be addressed<br />
• a coastal development permit is needed per Coastal Act for all development within the coastal zone<br />
• impacts to public access, recreation, small craft use, swimming, surfing should be addressed<br />
<strong>Regional</strong> <strong>Beach</strong> <strong>Sand</strong> <strong>Project</strong> <strong>EIR</strong>/<strong>EA</strong> Page 1-13<br />
99-69\SANDAG <strong>EIR</strong><strong>EA</strong> 3.4.wpd 7/17/00
1.0 Introduction<br />
• include a table listing potential lengths of closure for each affected beach<br />
• environmental impacts of the two different dredge types should be addressed<br />
• identify the need for coastal development permits from the California Coastal Commission for both<br />
dredging and disposal activities<br />
• impacts to artificial reef site off of Mission <strong>Beach</strong> should be addressed<br />
• address as applicable the potential impacts to County of Orange Coastal <strong>Regional</strong> Recreation Facilities<br />
as a result of littoral drift, water quality impacts, and marine biology, with appropriate mitigation<br />
measures<br />
• recreation impacts to beach users should be addressed<br />
• the discharge pipe network including submerged and floating segments should be mapped to assess<br />
impacts to recreational beach and surf zone uses<br />
• no construction should occur during special events at receiver sites<br />
Aesthetics<br />
• if nighttime pumping or lighting on the beach is contemplated, please include an analysis of potential<br />
impacts to residents and conformance with the City of Oceanside Light Pollution Ordinance<br />
Socioeconomics<br />
• impacts to the livelihood of the San Diego region fishing community engaged in the commercial fisheries<br />
of lobster, urchin, sheephead, and/or shrimp should be addressed<br />
• turbidity effects on sea urchin industry fisheries should be addressed<br />
Public Health and Safety<br />
• the transition from offshore to onshore piping should be in a location and manner that meets public<br />
safety, emergency access, and public access needs<br />
• the sand discharge area needs to be staffed at all times and warning signs placed appropriately<br />
• address impacts to lifeguard services<br />
Noise<br />
• evaluate construction and dredging/discharge equipment noise impacts<br />
• include a noise analysis of the sand pumping operation<br />
Page 1-14<br />
<strong>Regional</strong> <strong>Beach</strong> <strong>Sand</strong> <strong>Project</strong> <strong>EIR</strong>/<strong>EA</strong><br />
99-69\SANDAG <strong>EIR</strong><strong>EA</strong> 3.4.wpd 7/17/00
1.0 Introduction<br />
• the location, size and sound level of pumping activities and onshore heavy equipment should be<br />
analyzed relative to the nearest sensitive receptors (residences)<br />
• include the time period for pumping activities<br />
• show location of any onshore staging areas and type of equipment/materials to be stored in these areas<br />
• odor assessments and concerns should be addressed<br />
1.4.3 Areas of Special Concern to Commentors<br />
Members of the public and agencies have expressed concern about the potential effects to biological<br />
resources, coastal wetlands, commercial fisheries, water quality, and recreation. These concerns are<br />
addressed in the project objectives and analyzed in detail in Chapter 4.0 (Environmental Consequences)<br />
of this document.<br />
1.5 INTERAGENCY COORDINATION<br />
The lead agency for this proposed action is SANDAG in cooperation with the Navy. The agencies listed<br />
below have been coordinating with the lead agencies on the proposed action. Numerous representatives<br />
of other non-agency interest groups have been contacted as part of project. A more detailed description<br />
of the extensive agency and public coordination undertaken as part of this project is provided in Chapter<br />
7.0.<br />
U.S. <strong>Army</strong> Corps of Engineers<br />
U.S. Environmental Protection Agency<br />
U.S. Fish and Wildlife Service<br />
National Marines Fisheries Service<br />
California Coastal Commission<br />
California Department of Fish and Game<br />
California Department of Parks and<br />
Recreation<br />
California <strong>Regional</strong> Water Quality Control<br />
Board (San Diego, Region 9)<br />
California State Lands Commission<br />
California Department of Boating and<br />
Waterways<br />
City of Oceanside<br />
City of Carlsbad<br />
City of Encinitas<br />
City of Solana <strong>Beach</strong><br />
City of Del Mar<br />
City of San Diego<br />
City of Coronado<br />
City of Imperial <strong>Beach</strong><br />
County of San Diego<br />
Port of San Diego<br />
<strong>Regional</strong> <strong>Beach</strong> <strong>Sand</strong> <strong>Project</strong> <strong>EIR</strong>/<strong>EA</strong> Page 1-15<br />
99-69\SANDAG <strong>EIR</strong><strong>EA</strong> 3.4.wpd 7/17/00
2.0 Alternatives Considered<br />
CHAPTER 2.0<br />
ALTERNATIVES CONSIDERED<br />
This section discusses alternatives to satisfy the purpose and need. CEQA and NEPA require that an<br />
<strong>EIR</strong>/<strong>EA</strong> evaluate a “reasonable” range of alternatives. According to the CEQA Guidelines, “...an <strong>EIR</strong> shall<br />
describe a range of reasonable alternatives to the project, or to the location of the project, which would<br />
feasibly attain most of the basic objectives of the project but would avoid or substantially lessen any of the<br />
significant effects of the project, and evaluate the comparative merits of the alternatives”(Cal. Code Regs.,<br />
Title 14, § 15126.6(a)). Under NEPA, reasonable alternatives are those that are practical or feasible from<br />
a technical or economic perspective, and based on common sense (46 Fed. Reg. 18026, as amended, 51<br />
Fed. Reg 15618). Under CEQA, the factors that can determine feasibility are site suitability, economic<br />
limitations, General Plan consistency, other plan or regulatory limitations, and jurisdictional boundaries. An<br />
<strong>EIR</strong> need not consider an alternative whose effects cannot be reasonably ascertained and whose<br />
implementation is remote and speculative.<br />
This chapter of the <strong>EIR</strong>/<strong>EA</strong> is organized into seven primary sections. Section 2.1 discusses the alternative<br />
selection criteria. Section 2.2 briefly describes the process undertaken to generate and evaluate<br />
alternatives, including a brief overview of the modeling process used to predict sand transport with<br />
implementation of the project. Alternatives eliminated from detailed review in this <strong>EIR</strong>/<strong>EA</strong> and the reasons<br />
for their elimination are addressed in Section 2.3. Section 2.4 provides detailed descriptions of the<br />
alternatives evaluated in this <strong>EIR</strong>/<strong>EA</strong>. As with the Navy’s previous sand disposal project, monitoring would<br />
be required to understand how the nearby ocean system responds to the introduction of this material over<br />
time and mitigation commitments are identified given various outcomes. The framework for monitoring and<br />
mitigation is provided in Section 2.5. A summary comparison of the potential impacts for each alternative<br />
is provided in Section 2.6. Section 2.7 provides a list of permits and approvals required for the proposed<br />
action.<br />
2.1 ALTERNATIVE SELECTION CRITERIA<br />
Various alternatives for beach replenishment were established based on the following selection criteria. In<br />
total, up to a maximum of six sites were selected for dredging activities, and up to 13 sites were selected<br />
for beach sand replenishment.<br />
<strong>Regional</strong> <strong>Beach</strong> <strong>Sand</strong> <strong>Project</strong> <strong>EIR</strong>/<strong>EA</strong> Page 2-1<br />
99-69\SANDAG <strong>EIR</strong><strong>EA</strong> 3.4.wpd 7/17/00
2.0 Alternatives Considered<br />
2.1.1 Consistency With SANDAG Shoreline Preservation Strategy<br />
SANDAG has developed the Shoreline Preservation Strategy for the San Diego Region (1993), which<br />
identifies regional coastal areas with critical shoreline problems. Based on this study and input from local<br />
communities, beaches in critical need of replenishment were identified. The SANDAG study was used to<br />
determine site-specific alternatives for beach replenishment. Implementation of the proposed action reflects<br />
the critical need for sand at the proposed receiver sites.<br />
2.1.2 Avoidance of Sensitive Marine Resources<br />
<strong>Beach</strong> sites along the San Diego coast were analyzed for onshore beach replenishment suitability. Areas<br />
with significant sensitive marine resources, such as rocky intertidal reefs, subtidal vegetated reefs with<br />
feather boa kelp, surfgrass, or sea palm, or nearshore reefs with giant kelp were avoided for direct sand<br />
placement.<br />
2.1.3 Compatibility of Material Between Receiver and Borrow Sites<br />
<strong>Beach</strong> replenishment using dredged sediments is generally considered beneficial, assuming the dredged<br />
material does not contain contaminants and consists primarily of sand of acceptable grain size (i.e., similar<br />
to that of the beach to be nourished). The USACOE and U.S. Environmental Protection Agency (USEPA)<br />
generally require a minimum of 80 percent or greater sand composition for beach replenishment. To<br />
determine if beach replenishment is feasible, core samples of the material to be dredged are compared to<br />
samples from the existing beach replenishment sites. Compatible material can be placed directly onshore.<br />
Based on results of grain-size analysis and sampling of the sediments within the proposed dredge footprints,<br />
over 30 million cy of dredged sediment from six offshore borrow sites would be considered suitable for<br />
beach replenishment. This volume does not consider environmental or engineering constraints which would<br />
limit the actual quantity available for replenishment (Sea Surveyor 1999).<br />
2.1.4 Budget Considerations<br />
The funding for the <strong>Regional</strong> <strong>Beach</strong> <strong>Sand</strong> <strong>Project</strong> consists of $14.3 million from two sources. The federal<br />
government has committed $9.63 million and the State of California has committed $4.7 million. The funds<br />
from the state are authorized by special legislation. The funds from the federal government were<br />
Page 2-2<br />
<strong>Regional</strong> <strong>Beach</strong> <strong>Sand</strong> <strong>Project</strong> <strong>EIR</strong>/<strong>EA</strong><br />
99-69\SANDAG <strong>EIR</strong><strong>EA</strong> 3.4.wpd 7/17/00
2.0 Alternatives Considered<br />
appropriated by Congress in fiscal year 1998 Supplemental Appropriations and Recission Act. The Navy<br />
and the California Department of Boating and Waterways are the respective federal and state agencies<br />
administering the funds. This funding source is providing for all engineering design and construction plans;<br />
all environmental compliance costs, including CEQA/NEPA documentation, monitoring, and mitigation (if<br />
necessary); all permitting activities; and construction.<br />
2.2 PROCESS BY WHICH ALTERNATIVES WERE DERIVED<br />
When the engineering design and environmental process was initiated in spring 1999, the SEC’s goal was<br />
to replenish regional beaches with as much sand as they could achieve within the budget. Given the<br />
available funds, estimated cost for environmental compliance, engineering design plan and costs for<br />
dredging, an estimated range of 2 to 3 million cy was calculated. To achieve that goal, it was necessary<br />
to design a project that minimized potential impacts to sensitive resources. By designing such a project,<br />
SANDAG could more readily obtain necessary permit approvals, minimize costs for post-construction<br />
monitoring and mitigation, and maximize funds to pay for dredging, thereby maximizing sand quantity.<br />
SANDAG initiated an iterative process of identifying sensitive resources, defining appropriate borrow sites<br />
and dredge locations, modeling sand transport and designing appropriate receiver sites and footprints.<br />
Throughout this process, the resource agencies were consulted and their input utilized (Sections 1.5 and<br />
7.0). The SEC was kept informed and provided guidance at key decision points. Over time, some<br />
potential borrow sites were eliminated from further consideration, dredge locations were altered, receiver<br />
site footprints were modified, and sand quantities varied.<br />
To define appropriate borrow sites, ten potential offshore borrow sites were evaluated for beach<br />
replenishment suitability based on grain size and sediment analysis (Sea Surveyor 1999). Of those, four<br />
were eliminated. Within the remaining six borrow sites, the dredge locations were refined over time to<br />
avoid resources that were identified during the environmental process, e.g., artificial reefs and underwater<br />
archaeological sites. The borrow sites which were eliminated and/or modified are described in Section 2.3.<br />
To predict the movement of sand once placed on the various receiver sites, and therefore potential impacts<br />
to sensitive resources, both analytical and numerical modeling were performed. (Appendix C contains<br />
more detailed information about both types of modeling.) Analytical modeling (diffusion method) was used<br />
on receiver sites at Mission <strong>Beach</strong> and Imperial <strong>Beach</strong>. The diffusion method is a simplified condition that<br />
assumes an idealized straight shoreline. Given the location of the beach fill and breaking wave height, sand<br />
<strong>Regional</strong> <strong>Beach</strong> <strong>Sand</strong> <strong>Project</strong> <strong>EIR</strong>/<strong>EA</strong> Page 2-3<br />
99-69\SANDAG <strong>EIR</strong><strong>EA</strong> 3.4.wpd 7/17/00
2.0 Alternatives Considered<br />
is dispersed up and down the shoreline. This simplified model is appropriate for these sites because they<br />
are geographically isolated from other fills, they have relatively straight coastlines, and lack sensitive<br />
resources.<br />
Numerical modeling was used for the remaining receiver sites because the northern coast of the San Diego<br />
region is more varied with coves, promontories, lagoons, and built structures, and there would be multiple<br />
beach fills in close proximity with overlapping effects. The model used for this project, the Generalized<br />
Model for Simulating Shoreline Change (GENESIS), predicts sand movement up and down the coast only<br />
(longshore) and does not predict on and offshore movement. Instead it assumes that sediment movement<br />
on and off the beach (cross-shore) is seasonal and averages over the long-term and therefore, there would<br />
be no long-term change in the beach profile. The GENESIS model is the most current technology. There<br />
is no available model to simultaneously consider both longshore and seasonal cross-shore sediment<br />
transport, which is the natural process.<br />
GENESIS is intended to provide a generalized long-term trend in shoreline response. The results can<br />
indicate anticipated general areas of sand gain (deposition) or erosion at orders of magnitude over large<br />
scales. While modeling shoreline change over time is inherently imperfect, there is no better or more<br />
accurate alternative available at this time. The modeling of longshore sediment transport was supplemented<br />
by GENESIS with analysis of seasonal beach profile changes using an analytical method. The method<br />
involves converting the new mean sea level position predicted by GENESIS into a new beach profile at<br />
each beach profile location. The purpose of the work was to quantify the depth of sand cover in the<br />
nearshore zone in the vicinity of the beach fills to assess potential effects to biota. A depth of sand cover<br />
was calculated over the average winter profile at each location (for winter conditions) and over the average<br />
summer profile at each location (for summer conditions). This was done at six month intervals for five years<br />
after project construction to represent end of winter conditions (May) and end of summer conditions<br />
(October) for each year. Once the depth of sand cover was calculated at each beach profile location, the<br />
depth of cover at areas in between the profiles was interpolated from that at the profiles. A computer<br />
program was prepared to calculate the depth of sand cover in between the profiles using a relationship that<br />
was developed for all North County beaches between predicted changes in shoreline position and the depth<br />
of sand cover along the length of the profile.<br />
The modeling results were used in this process to guide the development of alternative receiver sites,<br />
alternative footprint locations and to assist in estimating potential sedimentation impacts to marine biological<br />
resources. Model-prediction in this inherently dynamic system are estimates only and cannot be considered<br />
Page 2-4<br />
<strong>Regional</strong> <strong>Beach</strong> <strong>Sand</strong> <strong>Project</strong> <strong>EIR</strong>/<strong>EA</strong><br />
99-69\SANDAG <strong>EIR</strong><strong>EA</strong> 3.4.wpd 7/17/00
2.0 Alternatives Considered<br />
definitive. Actual project impacts can only be determined based on post-project monitoring. However,<br />
sensitivity analyses were performed to understand how results could vary based on input parameters and<br />
a comparison of results with empirical data was performed to help understand the model predictions in this<br />
context. The predictions were found to be relatively consistent with empirical data, and likely conservative<br />
(Moffatt & Nichol 2000b). Also, when interpreting the results of the model, this analysis has consistently<br />
utilized the worst-case, most conservative output.<br />
Based on the results of initial modeling, four receiver sites were modified in length and location to avoid<br />
direct impact to resources, typically reefs (Section 2.3). Modeling was performed again with a maximum<br />
3 million cy alternative and the refined receiver sites. Potential worst-case impacts to sensitive marine<br />
resources were quantified. In an attempt to further reduce impacts, two scenarios were generated with less<br />
sand overall (2 million cubic yards). In October 1999, the SEC authorized their consideration. Under one<br />
scenario, the total volume of sand at each receiver site was reduced by one-third (Scenario 1). Under the<br />
other scenario (Scenario 2), reallocation of sand away from more sensitive beaches was reevaluated to<br />
further reduce impacts. As a result, Moonlight <strong>Beach</strong> and Cardiff receiver sites were eliminated and that<br />
sand placed at alternate northern beaches. The intent was to reduce potential impacts to marine resources<br />
by decreasing the amount of sand introduced to the system and by avoiding direct sand placement at<br />
offshore sensitive receiver sites. Based on additional sand transport modeling and evaluation of sand<br />
deposition patterns, potential worst-case impacts to biological resources were again estimated.<br />
Both of the 2 million cy scenarios, as well as the 3 million cy alternative, were presented to the SEC on<br />
December 9, 1999. Based on direction from the SEC, both scenarios were modified slightly to increase<br />
sand volume at the North Carlsbad receiver site from 160,000 cy to 240,00 cy. Preliminary evaluation<br />
indicated that potential impacts to marine resources would be very similar in scale under either 2 million cy<br />
scenario. At the December 1999 SEC meeting, Scenario 1 was selected as preferred, and the SEC<br />
directed the evaluation of that scenario in this <strong>EIR</strong>/<strong>EA</strong>.<br />
Subsequent to the December 1999 meeting, a preliminary evaluation of mitigation and monitoring<br />
requirements was prepared using the previous Navy project’s permit requirements as a guide. That<br />
evaluation identified monitoring requirements during construction as well as post-construction, and provided<br />
preliminary cost estimates. Based on the high cost to mitigate impacts to reefs, another alternative was<br />
generated. The modeling of various alternatives consistently predicted areas of persistent sand deposition<br />
off North Carlsbad and Moonlight <strong>Beach</strong>. The depositional areas were located where mapping was not<br />
available. Based on worst-case, conservative assumptions, the potential indirect impacts to reefs would<br />
<strong>Regional</strong> <strong>Beach</strong> <strong>Sand</strong> <strong>Project</strong> <strong>EIR</strong>/<strong>EA</strong> Page 2-5<br />
99-69\SANDAG <strong>EIR</strong><strong>EA</strong> 3.4.wpd 7/17/00
2.0 Alternatives Considered<br />
be cost-prohibitive in terms of mitigation. Given the need to reduce potential impacts, receiver sites which<br />
contributed to impacts at these two locations were eliminated. Therefore the North Carlsbad receiver site<br />
was eliminated. Based on the shape of the coastline and subsequent longshore sand transport patterns,<br />
most of the sand placed at receiver sites in Encinitas contributed to the deposition at Moonlight <strong>Beach</strong>, and<br />
therefore the Batiquitos, Leucadia and Moonlight <strong>Beach</strong> receiver sites were eliminated.<br />
At the SEC meeting in January 2000, the Committee directed preparation of the <strong>EIR</strong>/<strong>EA</strong> with two<br />
alternatives. One was the 2 million cy alternative selected as preferred at the December 1999 meeting.<br />
The other was the modified 2 million cy alternative generated subsequent to that meeting.<br />
2.3 ALTERNATIVES ELIMINATED FROM DETAILED REVIEW<br />
The following text provides more description of various alternatives originally considered for the proposed<br />
action but eliminated from further detailed review in this environmental document. As described in Section<br />
2.2, numerous alternatives were initially considered for borrow sites and receiver sites. Additionally, there<br />
were various options for pipeline routes and sand placement (i.e., nearshore versus onshore or feeder<br />
beaches). Methods to retain sand were also considered. As described in Section 2.2, various alternatives<br />
have been modeled, evaluated in the technical reports, and presented to the SEC. Those that have been<br />
eliminated from further detailed review are identified below.<br />
2.3.1 Preliminary Offshore Borrow Sites<br />
Under preliminary plans for beach replenishment, ten offshore borrow sites were tested for beach<br />
replenishment suitability (Sea Surveyor 1999). Four of these borrow sites were eliminated as described<br />
below.<br />
SO-8 is located off Oceanside, south of the northernmost borrow site, SO-9. The site was tested to be<br />
used as source material to replenish the South Oceanside and North Carlsbad receiver sites. Based on<br />
testing of the borrow material, the material was determined to be too fine and silty and thus unsuitable.<br />
Some suitable sand was found in a second layer of sediment, but would be too difficult and costly to dredge<br />
in comparison to the suitable sediment available at S0-9 (Sea Surveyor 1999). Because SO-9 was found<br />
to contain suitable dredge material for beach replenishment for the two receiver sites, SO-8 was eliminated<br />
from further review.<br />
Page 2-6<br />
<strong>Regional</strong> <strong>Beach</strong> <strong>Sand</strong> <strong>Project</strong> <strong>EIR</strong>/<strong>EA</strong><br />
99-69\SANDAG <strong>EIR</strong><strong>EA</strong> 3.4.wpd 7/17/00
2.0 Alternatives Considered<br />
Similar to SO-8, AH-1 is located off of Oceanside, and would have served the South Oceanside and<br />
North Carlsbad receiver sites. The material to be dredged from AH-1 was found to be too silty and fine<br />
for beach replenishment purposes (Sea Surveyor 1999). Given the suitability of dredge material from SO-<br />
9, AH-1 was dropped from further consideration.<br />
SO-4, located off of Torrey Pines State Reserve/<strong>Beach</strong>, was originally considered for the source of borrow<br />
material to replenish the Torrey Pines receiver site. Based on grain-size analysis, the material to be dredged<br />
was too fine to match existing sand at the receiver site (Sea Surveyor 1999). Also, SO-4 has only a small<br />
area with only two core samples that were deemed suitable for beach fill, and it therefore could not have<br />
provided the quantity needed for replenishment. The SO-5 borrow site, located to the north off of Del<br />
Mar, would contain enough material for deposition at the Torrey Pines receiver site in addition to the<br />
Solana <strong>Beach</strong> and Del Mar receiver sites. Therefore, the SO-4 borrow site was eliminated from further<br />
review.<br />
Borrow site SS-2 was also considered for replenishment of the Imperial <strong>Beach</strong> receiver site. This borrow<br />
site is located off of Imperial <strong>Beach</strong>, northwest of SS-1. During preliminary examination of the dredge<br />
material from SS-2, approximately 0.7 million cy was found to be suitable for beach replenishment;<br />
however, approximately 1.0 million cy of unsuitable material overlies the suitable sand. As a result,<br />
dredging costs would be prohibitive at this borrow site, and the site was deemed unacceptable for beach<br />
replenishment.<br />
In addition to borrow sites being eliminated, other borrow sites were refined to obtain the best quality of<br />
sediment or to avoid sensitive resources. For instance, after further review of sediment testing results at<br />
SO-9, the dredge area was reduced in size because some of the material would be too fine for beach<br />
replenishment purposes at the South Oceanside and North Carlsbad receiver sites. The preliminary dredge<br />
areas at SO-7 and MB-1 were relocated to avoid direct impacts to artificial reefs created by the California<br />
Department of Fish and Game (see Sections 3.6 and 4.6). Finally, the SS-1 dredge area was revised to<br />
avoid the City of San Diego’s ocean outfall.<br />
Further revisions to several borrow site footprints were made in order to avoid, to the maximum extent<br />
possible, areas with a high probability of containing underwater archaeological resources. At SO-9, the<br />
originally proposed footprint was relocated to the east and extended to the north and south. SO-7's dredge<br />
area footprint was reduced. At SO-6, the footprint for dredging was relocated slightly to the east to avoid<br />
a known shipwreck in the vicinity.<br />
<strong>Regional</strong> <strong>Beach</strong> <strong>Sand</strong> <strong>Project</strong> <strong>EIR</strong>/<strong>EA</strong> Page 2-7<br />
99-69\SANDAG <strong>EIR</strong><strong>EA</strong> 3.4.wpd 7/17/00
2.0 Alternatives Considered<br />
2.3.2 Onshore Borrow Sites and Other <strong>Sand</strong> Sources R<br />
R<br />
Onshore sources of material were also considered including: (1) dredging sand from behind Henshaw Dam, R<br />
or other dams that act as sediment “sinks”; (2) removing dams that currently interrupt river-borne sediment; R<br />
or (3) terminating regional sand mining activities that prevent sand from reaching the shoreline. Dredging R<br />
sand from behind any dam and transporting that material to the shoreline would involve the use of trucks R<br />
for transportation. A typical truck carries 14 cy of material. Receiver sites for this action would vary in R<br />
size from 100,000 to 570,000 cy resulting in over 7,140 trips for the smallest site and over 40,700 truck R<br />
trips for the largest site. Transportation and construction from onshore borrow sites would result in air R<br />
emissions, noise impacts and conflicts with beach users for parking and access that resulted in its R<br />
elimination.<br />
R<br />
R<br />
San Diego is a semi-arid region and precipitation is highly variable. The need for a consistent source of R<br />
water has lead to the construction of dams on all major water courses in the region, except the Santa R<br />
Margarita River. Since the late 1940s, local water sources have been supplemented by imported water R<br />
which has been stored in reservoirs created by those dams (Pryde 1992). The local supply of water is R<br />
limited and efforts continue to increase the amount of water storage and improve the delivery system. The R<br />
San Diego County Water Authority is currently implementing the Emergency Water Storage <strong>Project</strong>, which R<br />
will provide additional local water supplies by constructing a new dam in Olivenhain as well as raise the R<br />
height of the dam at the San Vicente Reservoir. The need for local water supplies for the growing R<br />
population would make it infeasible to remove dams in the region and allow sediment to flow naturally to R<br />
the ocean.<br />
R<br />
R<br />
<strong>Sand</strong> and aggregate mining in San Diego County is used to support the construction industry and provides R<br />
raw material for making concrete, preparing road beds, and other uses. It is a necessary raw material also R<br />
for road maintenance. The California Division of Mines and Geology Special Report 153 (n.d.) estimates R<br />
a need for approximately 760 million tons of aggregate in San Diego County through the year 2030. If sand R<br />
mining in San Diego were halted, or reduced, other sources would have to be found, mostly likely from R<br />
Riverside and San Bernardino counties. This would necessitate additional truck trips to carry the material R<br />
resulting in air and noise impacts, and there may not be enough material to support the local demand. Given R<br />
the economic importance of the construction industry, it would not be feasible to interrupt the local supply R<br />
and wait for local material to make its way down the river system to the ocean.<br />
R<br />
Page 2-8<br />
<strong>Regional</strong> <strong>Beach</strong> <strong>Sand</strong> <strong>Project</strong> <strong>EIR</strong>/<strong>EA</strong><br />
99-69\SANDAG <strong>EIR</strong><strong>EA</strong> 3.4.wpd 7/17/00
2.0 Alternatives Considered<br />
2.3.3 Preliminary Receiver Sites<br />
Modeling was initially performed for expanded footprints at four receiver sites – North Carlsbad, Leucadia,<br />
Solana <strong>Beach</strong>, and Torrey Pines. The expanded footprints aimed to place sand along a longer or different<br />
stretch of these receiver sites, but results indicated that sensitive biological resources would be directly<br />
impacted. Therefore, these receiver sites were redesigned to avoid the offshore resources. Below is a<br />
description of the four preliminary receiver sites and how they differ from the footprints now proposed.<br />
The North Carlsbad receiver site was initially located south of the Buena Vista Lagoon and extended for<br />
approximately 6,420 feet (1.2 miles) to just south of Juniper Avenue. The initial receiver site extended<br />
approximately 2,000 feet farther south than the site currently proposed (refer to Section 2.4). The initial<br />
beach segment consisted of a predominantly flat sandy beach, extending from the surf line to rip-rap slopes<br />
and sea walls that protect existing beach front residences and fragile bluffs.<br />
The initial receiver site at the Leucadia site extended approximately 4,500 feet (0.9 mile) from Jasper Street<br />
to south of South El Portal Street, which is farther south and 1,800 feet longer than the site currently<br />
proposed. The Leucadia receiver site was similar to the southern end of the Batiquitos site in that steep<br />
cliffs abut the beach. The beach consists of a gently sloping sand beach with scattered rocks, cobbles, and<br />
rip-rap. Several residences are located on the bluff above.<br />
<strong>Beach</strong> replenishment at the initial Solana <strong>Beach</strong> receiver site would have consisted of the placement of<br />
dredged sediment along approximately 4,160 feet of the beach, including Fletcher Cove. The receiver site<br />
extended from the foot of Cliff Street to south of Dahlia Street, stretching farther north and 2,360 feet<br />
longer than the site currently proposed. Steep cliffs abutted the receiver site and the area consisted of a<br />
gently sloping sand beach with scattered rocks and cobbles. Several residences and condominiums are<br />
located on the bluff above.<br />
The initial Torrey Pines receiver site, located within the City of San Diego, is bordered by the Los<br />
Peñasquitos Lagoon and Torrey Pines State Reserve. The site stretched for approximately 4,860 feet (0.9<br />
mile) and was located on Torrey Pines State <strong>Beach</strong>. The currently proposed receiver site under the<br />
maximum length alternative is approximately 2,390 feet shorter in length. The beach is a gently sloping sand<br />
beach with scattered cobbles and high bluffs along Torrey Pines State Reserve. There is also rip-rap in<br />
some areas to protect North Torrey Pines Road from storm wave action.<br />
<strong>Regional</strong> <strong>Beach</strong> <strong>Sand</strong> <strong>Project</strong> <strong>EIR</strong>/<strong>EA</strong> Page 2-9<br />
99-69\SANDAG <strong>EIR</strong><strong>EA</strong> 3.4.wpd 7/17/00
2.0 Alternatives Considered<br />
2.3.4 Preliminary Pipeline Routes<br />
The S0-9 discharge pipeline was originally designed to make landfall at the closest point to the borrow site.<br />
Under this scenario, landfall would have occurred to the north of the Oceanside Harbor, within the<br />
boundary of the Unites States Marine Corps Base (MCB) Camp Pendleton. The discharge pipeline would<br />
then have to be submerged underneath the harbor and routed south to the South Oceanside and North<br />
Carlsbad receiver sites. Instead, the landfall location was moved south, which would facilitate sand delivery<br />
without interfering with the harbor or the military base.<br />
2.3.5 Nearshore Fill Placement<br />
Nearshore placement of fill was originally discussed at four sites: Oceanside, Del Mar, Mission <strong>Beach</strong>, and<br />
Imperial <strong>Beach</strong>. Placing sediment in the nearshore zone would introduce material to the littoral cell, which<br />
would be beneficial, but would not be as beneficial as direct onshore placement. The amount of sand that<br />
would actually occur on the intended receiver sites is unknown and the benefits of nearshore placement are<br />
more uncertain. Also, as only four sites in the entire San Diego region were considered, the project was<br />
not truly “regional” by nature. Because this method of sand replenishment would not have the same<br />
immediate benefits to an intended receiver site, and would not fulfill the regional purpose and need of the<br />
project, it was eliminated from further consideration.<br />
2.3.6 Feeder <strong>Beach</strong> Replenishment<br />
Under this alternative, sand would be replenished at Oceanside and Carlsbad, and then travel south in the<br />
Oceanside Littoral Cell to replenish other north county beaches. <strong>Sand</strong> would also be placed at the Mission<br />
<strong>Beach</strong> and Imperial <strong>Beach</strong> receiver sites to feed their respective littoral cells. In 1996, 2.1 million cy were<br />
placed on Ponto <strong>Beach</strong> in southern Carlsbad. That action would be similar to this alternative. While this<br />
previous replenishment project did introduce sand to the Oceanside littoral cell and did enhance that<br />
specific location, the regional benefits have been difficult to quantify. Because the benefits of beach<br />
replenishment at the southern reaches of the Oceanside Littoral Cell would also be difficult to quantify, and<br />
there would not be immediate benefits at specific receiver sites, it is unlikely that this alternative would fulfill<br />
the project’s regional objectives or desire to address specific beaches identified by the SEC with critical<br />
erosion problems.<br />
Page 2-10<br />
<strong>Regional</strong> <strong>Beach</strong> <strong>Sand</strong> <strong>Project</strong> <strong>EIR</strong>/<strong>EA</strong><br />
99-69\SANDAG <strong>EIR</strong><strong>EA</strong> 3.4.wpd 7/17/00
2.0 Alternatives Considered<br />
2.3.7 <strong>Sand</strong> Retention<br />
Early in the alternatives development process, sand retention strategies from a regional perspective were<br />
considered, including the incorporation of retention reefs, groins, jetties, and artificial headlands (Moffatt<br />
& Nichol 1999). However, the high cost of constructing sand retention devices along the coastline made<br />
them questionable from a cost-effectiveness standpoint, and would detract from the volume of sand to be<br />
placed at each of the receiver sites, given the proposed action’s fixed budget. For example, the estimated<br />
cost of extending the north jetty at Agua Hedionda Lagoon by 150 feet was $5.2 million, not considering<br />
environmental or permitting costs. Consequently, the focus of the proposed action was defined only as<br />
sand replenishment. While regional sand retention may possibly be considered in the future as one element<br />
of a shoreline protection strategy, it is too speculative to carry forward for detailed analysis in this <strong>EIR</strong>/<strong>EA</strong>.<br />
R<br />
R<br />
R<br />
2.3.8 3 Million CY Alternative<br />
The SEC’s original goals was to replenish regional beaches with the maximum quantity of sand possible.<br />
As described in Section 2.2, sand transport modeling was performed on an alternative with 13 receiver<br />
sites and 3 million cy of sand dredged from six borrow sites to predict locations and duration of sand<br />
deposition for the purposes of having data for permit application submittal. Technical reports supporting<br />
this document (Appendices C and D) contain the analysis. However, as the environmental and engineering<br />
process evolved, it became apparent that the cost of dredging and possible mitigation (potential worst-case<br />
as preliminary identified in January 2000) would be prohibitive. Given the total project budget of $14.3<br />
million, this alternative would not be feasible and was therefore eliminated from further consideration<br />
(SANDAG 2000).<br />
2.3.9 Reduced Quantity Alternative<br />
As described in Section 2.2, two scenarios were generated with less sand overall (2 million cy) in an<br />
attempt to reduce impacts associated with the 3 million cy alternative. Under either scenario, potential<br />
worst-case biological impacts would be very similar in scale (see Appendix D). At the December 1999<br />
SEC meeting, Scenario 1 was selected as preferred. Since Scenario 2 reflected only a slight variation in<br />
impact and would not enhance the range of alternatives, it was eliminated from further review in this<br />
document.<br />
<strong>Regional</strong> <strong>Beach</strong> <strong>Sand</strong> <strong>Project</strong> <strong>EIR</strong>/<strong>EA</strong> Page 2-11<br />
99-69\SANDAG <strong>EIR</strong><strong>EA</strong> 3.4.wpd 7/17/00
2.0 Alternatives Considered<br />
2.4 DETAILED DESCRIPTION OF ALTERNATIVES<br />
Based on the thorough alternatives evaluation process completed to date, two alternatives were selected<br />
for detailed evaluation in this <strong>EIR</strong>/<strong>EA</strong>. Both would result in placement of approximately 2 million cy of sand<br />
along the San Diego region coastline. Alternative 1 is the 2 million cy alternative identified as preferred by<br />
the SEC on December 9, 1999. It includes most of the receiver sites selected as having critical need per<br />
the 1993 Shoreline Erosion Preservation Strategy for the San Diego Region. Alternative 2 was<br />
derived subsequent to the December 1999 recommendation and would have fewer receiver sites. Table<br />
2-1 illustrates the sand quantities at each receiver site under both alternatives and the borrow site which<br />
would provide material for each receiver site (Figures 2-1 and 2-2).<br />
Table 2-1<br />
<strong>Sand</strong> Quantities Proposed Under Each Alternative<br />
Receiver Site<br />
Borrow Site<br />
Alternative 1<br />
(cubic yards)<br />
Alternative 2<br />
(cubic yards)<br />
Oceanside<br />
SO-9<br />
380,000 570,000<br />
North Carlsbad 240,000 —<br />
South Carlsbad North<br />
160,000 218,000<br />
South Carlsbad South — 142,000<br />
Batiquitos<br />
SO-7<br />
118,000 —<br />
Leucadia 130,000 —<br />
Moonlight <strong>Beach</strong> 88,000 —<br />
Cardiff SO-6 104,000 104,000<br />
Solana <strong>Beach</strong><br />
140,000 140,000<br />
Del Mar<br />
SO-5<br />
180,000 180,000<br />
Torrey Pines 240,000 360,000<br />
Mission <strong>Beach</strong> MB-1 100,000 150,000<br />
Imperial <strong>Beach</strong> SS-1 120,000 180,000<br />
Total 2,000,000 2,044,000<br />
Page 2-12<br />
<strong>Regional</strong> <strong>Beach</strong> <strong>Sand</strong> <strong>Project</strong> <strong>EIR</strong>/<strong>EA</strong><br />
99-69\SANDAG <strong>EIR</strong><strong>EA</strong> 3.4.wpd 7/17/00
X.X Section Name<br />
SO-9<br />
South<br />
Oceanside<br />
(380,000 cy)<br />
North Carlsbad<br />
(240,000 cy)<br />
South Carlsbad North<br />
(160,000 cy)<br />
SO-7<br />
SO-6<br />
SO-5<br />
Batiquitos (118,000 cy)<br />
Leucadia (130,000 cy)<br />
Moonlight <strong>Beach</strong> (88,000 cy)<br />
Cardiff (104,000 cy)<br />
Solana <strong>Beach</strong><br />
(140,000 cy)<br />
Del Mar<br />
(180,000 cy)<br />
Torrey Pines<br />
(240,000 cy)<br />
Mission <strong>Beach</strong><br />
(100,000 cy)<br />
MB-1<br />
OFFSHORE BORROW SITE<br />
ONSHORE RECEIVER SITE<br />
SO:<br />
MB:<br />
SOUTH OC<strong>EA</strong>NSIDE LITTORAL CELL BORROW SITE<br />
MISSION B<strong>EA</strong>CH LITTORAL CELL BORROW SITE<br />
SS-1<br />
Imperial <strong>Beach</strong><br />
(120,000 cy)<br />
SS:<br />
SILVER STRAND LITTORAL CELL BORROW SITE<br />
Source: DoN 1993<br />
NORTH<br />
CALIF<br />
PROJECT LOCATION<br />
Figure 2-1<br />
Alternative 1<br />
Borrow and Receiver Sites<br />
<strong>Regional</strong> <strong>Beach</strong> <strong>Sand</strong> <strong>Project</strong> <strong>EIR</strong>/<strong>EA</strong><br />
9969 SANDAG <strong>Beach</strong> Replenishment\Figures\Fig 2-1 Sites 1/11/00<br />
Page 2-13
X.X Section Name<br />
South<br />
Oceanside<br />
(570,000 cy)<br />
SO-9<br />
South Carlsbad North<br />
(218,000 cy)<br />
South Carlsbad South<br />
(142,000 cy)<br />
SO-7<br />
SO-6<br />
SO-5<br />
Cardiff<br />
(104,000 cy)<br />
Solana <strong>Beach</strong><br />
(140,000 cy)<br />
Del Mar<br />
(180,000 cy)<br />
Torrey Pines<br />
(360,000 cy)<br />
Mission <strong>Beach</strong><br />
(150,000 cy)<br />
MB-1<br />
OFFSHORE BORROW SITE<br />
ONSHORE RECEIVER SITE<br />
SO:<br />
MB:<br />
SOUTH OC<strong>EA</strong>NSIDE LITTORAL CELL BORROW SITE<br />
MISSION B<strong>EA</strong>CH LITTORAL CELL BORROW SITE<br />
SS-1<br />
Imperial <strong>Beach</strong><br />
(180,000 cy)<br />
SS:<br />
SILVER STRAND LITTORAL CELL BORROW SITE<br />
Source: DoN 1993<br />
NORTH<br />
CALIF<br />
PROJECT LOCATION<br />
Figure 2-2<br />
Alternative 2<br />
Borrow and Receiver Sites<br />
Page 2-14<br />
<strong>Regional</strong> <strong>Beach</strong> <strong>Sand</strong> <strong>Project</strong> <strong>EIR</strong>/<strong>EA</strong><br />
9969 SANDAG <strong>Beach</strong> Replenishment\Figures\Fig 2-2 Sites 1/11/00
2.0 Alternatives Considered<br />
Additionally, there are two possible construction variations – one involves the potential for construction<br />
seven days a week, 24 hours a day (7/24) and the other involves some restrictions on construction times<br />
and days consistent with local noise ordinances, where applicable. These two variations are addressed as<br />
variations (a) and (b) for each alternative. The vast majority of dredge operations utilize a 7/24 timeframe<br />
to increase efficiency and minimize cost. Given the fixed budget for this project, any increase in<br />
construction cost would translate to a decrease in sand volume. Generally, adherence to applicable noise<br />
ordinances would result in construction duration increasing 30 percent and the volume of sand reducing by<br />
up to 50 percent. Finally, the No Action Alternative is evaluated.<br />
The description of Alternative 1 is structured as follows. First the receiver sites and borrow sites are<br />
described in detail. <strong>Sand</strong> volumes are indicated based on the 7/24 construction practice (Alternative 1a).<br />
Then, Alternative 1b is described where adherence to the applicable noise ordinance would affect length<br />
of construction and sand quantity at some receiver sites. Following the description of these two variations<br />
is a detailed description of the construction method – how the dredging would be performed, how beach<br />
building would occur, location of staging areas and booster pumps, length of beach closures, etc.<br />
Alternative 2 is also described in terms of variation (a) or (b) given the construction scenarios.<br />
Construction methods would not vary under Alternative 2, although staging areas and booster pump<br />
locations are identified as appropriate.<br />
2.4.1 Alternative 1<br />
Alternative 1 is beach replenishment in the San Diego region with up to 2 million cy of sand to be deposited<br />
at 12 receiver sites. The receiver sites are located from Oceanside to Imperial <strong>Beach</strong>. <strong>Sand</strong> would be<br />
dredged from 6 possible offshore borrow sites.<br />
Alternative 1a<br />
Receiver Sites<br />
The general process for sand dredging, delivery, and spreading is similar for all receiver sites. After sand<br />
is dredged from a borrow site, it is pumped through dredge discharge lines to the shore. Existing sand is<br />
used to build a dike between the ocean and receiver site and the dredge material is placed behind the dike<br />
to help reduce turbidity. As the material deposits, it is spread along the shore to create a berm higher than<br />
the existing sand area. The berm would slope gently back to the existing beach elevation to form a berm<br />
<strong>Regional</strong> <strong>Beach</strong> <strong>Sand</strong> <strong>Project</strong> <strong>EIR</strong>/<strong>EA</strong> Page 2-15<br />
99-69\SANDAG <strong>EIR</strong><strong>EA</strong> 3.4.wpd 7/17/00
2.0 Alternatives Considered<br />
using bulldozers and training dikes are constructed around the berms help to reduce turbidity. The sand<br />
is spread using bulldozers and up to 12 crew persons. The construction scenario is described in further<br />
detail below, following the detailed description of receiver sites and borrow sites.<br />
For each receiver site, berm construction may be adjusted during fill placement depending on actual field<br />
conditions. The measurements indicated for the width of each berm are the initial post-placement widths.<br />
The berms would be immediately subject to the forces of the waves and weather once constructed, and<br />
would most likely reduce in size.<br />
Under Alternative 1a, implementation of the proposed action would occur around the clock, on a<br />
7-day/24-hour basis. The longer construction hours would result in more efficient construction and greater<br />
production rates, and would allow for more sand to be placed on some of the receiver sites (refer to Table<br />
2-2). These construction hours would necessitate a noise variance from several jurisdictions<br />
(i.e., Oceanside, Solana <strong>Beach</strong>, Del Mar, San Diego, and Imperial <strong>Beach</strong>).<br />
<strong>Beach</strong> replenishment at South Oceanside would involve onshore placement of sand from just south of<br />
Forster Street to Kelly Street for a total length of approximately 4,100 feet (0.8 mile), as shown in Figure<br />
2-3. Dredged sediment would be placed on the existing sand beach and graded to form a berm. The top<br />
of the berm would be constructed to an elevation of approximately 13 feet above mean lower low water<br />
(MLLW), and would be flat and 135 feet wide. (MLLW is the average of the lower low water height of<br />
each tidal day observed over time. A positive number indicates elevation above MLLW and a negative<br />
number is below MLLW.) The beach fill would then extend seaward approximately 250 feet at a slope<br />
of 20:1 (horizontal distance:vertical distance).<br />
<strong>Beach</strong> replenishment at North Carlsbad would involve onshore placement of sand from just south of the<br />
Buena Vista Lagoon to south of Carlsbad Village Drive (Elm Avenue), a distance of approximately 3,000<br />
feet (0.6 mile) (Figure 2-4). Dredged sediment would be placed on the existing sand beach and graded<br />
to form a berm. The top of the berm would be constructed to an elevation of approximately 12 feet above<br />
MLLW and would be flat, with a width of approximately 125 feet. The beach fill would then slope<br />
seaward approximately 150 feet at a slope of 10:1. The site would also have a slope to the east of the<br />
berm at a slope of approximately 5:1 extending 35 feet back to the mean high tide line. The sand<br />
placement, as described in this <strong>EIR</strong>/<strong>EA</strong>, would not extend from the existing revetment to the water edge.<br />
However, as disclosed in Section 2.7, during the final design phase, the fill site would be redesigned to<br />
flatten the berm at mid-beach and extend the material to the existing revetment. The footprint analyzed in<br />
this document represents a worst-case evaluation for visual quality for purposes of disclosure.<br />
R<br />
R<br />
R<br />
R<br />
Page 2-16<br />
<strong>Regional</strong> <strong>Beach</strong> <strong>Sand</strong> <strong>Project</strong> <strong>EIR</strong>/<strong>EA</strong><br />
99-69\SANDAG <strong>EIR</strong><strong>EA</strong> 3.4.wpd 7/17/00
<strong>Regional</strong> <strong>Beach</strong> <strong>Sand</strong> <strong>Project</strong> <strong>EIR</strong>/<strong>EA</strong><br />
9969 <strong>Beach</strong> Replenishment\Figures\Fig 2-3 South Oceanside Fill 8/31/99<br />
ALTERNATIVE 1<br />
Seagaze Drive<br />
TOP OF SLOPE<br />
Oceanside Blvd<br />
4,100’<br />
TOE OF SLOPE<br />
Kelly St<br />
Vista Way<br />
<strong>Beach</strong> Fill Elevation = +13 MLLW<br />
<strong>Beach</strong> Width = 135’<br />
X.X Section Name<br />
Seagaze Drive<br />
Oceanside Blvd<br />
Kelly St<br />
Vista Way<br />
TOP OF SLOPE<br />
9,900<br />
TOE OF SLOPE<br />
<strong>Beach</strong> Fill Elevation = +13 MLLW<br />
<strong>Beach</strong> Width = 75’<br />
ALTERNATIVE 2<br />
Page 2-17<br />
Source: Moffatt & Nichol Engineers<br />
NORTH<br />
0<br />
750 Feet<br />
TOP OF BERM<br />
SLOPE OF BERM<br />
Figure 2-3<br />
South Oceanside <strong>Beach</strong> Fill Plan<br />
Alternatives 1 and 2
Page 2-18<br />
State St<br />
X.X Section Name<br />
Carlsbad Blvd<br />
Ocean St<br />
Grand Av<br />
Oak Av<br />
Pine Av<br />
Chestnut Av<br />
TOP OF SLOPE<br />
3,000<br />
<strong>Beach</strong> Fill Elevation = + 12’ MLLW<br />
<strong>Beach</strong> Width = 155’<br />
<strong>Regional</strong> <strong>Beach</strong> <strong>Sand</strong> <strong>Project</strong> <strong>EIR</strong>/<strong>EA</strong><br />
9969 <strong>Beach</strong> Replenishment\Figures\Fig 2-4 N Carlsbad Fill 8/31/99<br />
Source: Moffatt & Nichol Engineers<br />
NORTH<br />
0<br />
750 Feet<br />
TOP OF BERM<br />
SLOPE OF BERM<br />
Figure 2-4<br />
North Carlsbad <strong>Beach</strong> Fill Plan--Alternative 1<br />
(Site Not Proposed Under Alternative 2)
2.0 Alternatives Considered<br />
Table 2-2<br />
Alternative 1 – Schedule and Production<br />
Borrow<br />
Site<br />
SO-9<br />
SO-7<br />
Receiver<br />
Site<br />
Alternative 1a<br />
(Assumes 7-day/24-hour work schedule)<br />
Quantity<br />
(cy)<br />
Replenishment<br />
Site<br />
Construction (1)<br />
(estimated<br />
days)<br />
Duration of<br />
Pipeline<br />
Activity (2)<br />
(estimated<br />
days)<br />
Quantity<br />
(cy)<br />
Alternative 1b<br />
(Adheres to Noise Ordinances) (3)<br />
Replenishment<br />
Site<br />
Construction (1)<br />
(estimated days)<br />
Duration of<br />
Pipeline<br />
Activity (2)<br />
(estimated<br />
days)<br />
Applicable<br />
Noise<br />
Ordinance?<br />
S. Oceanside 380,000 30<br />
50<br />
190,000 44<br />
74<br />
Yes<br />
N. Carlsbad 240,000 20 120,000 30 Yes<br />
S. Carlsbad N. 160,000 15<br />
160,000 15<br />
No<br />
S. Carlsbad S. 0 0<br />
15<br />
0 0<br />
15<br />
No<br />
Batiquitos 118,000 12<br />
118,000 12<br />
Leucadia 130,000 13 35 130,000 13 35<br />
No<br />
Moonlight 88,000 10 88,000 10 No<br />
SO-6 Cardiff 104,000 11 11 104,000 11 11 No<br />
SO-5<br />
Solana <strong>Beach</strong> 140,000 13 13 70,000 18 18 Yes<br />
Del Mar 180,000 16<br />
90,000 24<br />
Yes<br />
36<br />
52<br />
Torrey Pines 240,000 20 120,000 28 Yes (4)<br />
MB-1 Mission <strong>Beach</strong> 100,000 11 11 50,000 16 16 Yes<br />
SS-1<br />
Imperial<br />
<strong>Beach</strong><br />
120,000 12 12 60,000 18 18 Yes<br />
Total 2,000,000 183 183 1,300,000 239 239<br />
No<br />
Average Production Rate 15,000 cy/day 5,000 cy/day<br />
Assumptions: Noise limits would allow only one shift of production per day (instead of three) with no construction on Sundays or<br />
holidays. Production would take three times longer. Production rates are average and similar for any type of dredge equipment.<br />
(1)<br />
Includes 2 to 4 days for mobilization prior to sand placement and 2 to 4 days for demobilization post placement, depending on<br />
borrow source.<br />
(2)<br />
Maximum number of working days pipeline would be on the beach where a single borrow site serves more than one receiver site.<br />
(3)<br />
Assumes a working schedule from 7:00 a.m. to 7:00 p.m. Monday through Friday, limited working hours on Saturday, and no<br />
working hours on Sundays and holidays.<br />
(4)<br />
The Torrey Pines conveyance plan includes use of Del Mar’s beach for pipeline conveyance of sand and a booster pump would be<br />
necessary. The use of the City of Del Mar’s beach for this purpose may necessitate conformance with the City of Del Mar noise<br />
ordinance even though the Torrey Pines receiver site is within State Park’s jurisdiction.<br />
<strong>Beach</strong> replenishment at the South Carlsbad North site would consist of the placement of dredged sediment<br />
near the Palomar Airport Road intersection with Carlsbad Boulevard, stretching to the south for 2,100 feet<br />
(0.4 mile) near the Encinas Creek outlet (Figure 2-5). A berm would be constructed to an elevation of<br />
approximately 12 feet above MLLW. The beach fill would be flat with a width of approximately 170 feet.<br />
The beach fill would then slope seaward approximately 100 feet at a slope of 10:1.<br />
<strong>Regional</strong> <strong>Beach</strong> <strong>Sand</strong> <strong>Project</strong> <strong>EIR</strong>/<strong>EA</strong> Page 2-19<br />
99-69\SANDAG <strong>EIR</strong><strong>EA</strong> 3.4.wpd 7/17/00
X.X Section Name<br />
Page 2-20<br />
Palomar Airport Rd<br />
Avenida Encinas<br />
Carlsbad South Blvd<br />
Carlsbad North Blvd<br />
TOP OF SLOPE<br />
TOE OF SLOPE<br />
2,100’<br />
B<strong>EA</strong>CH FILL ELEVATION = +12’ MLLW<br />
B<strong>EA</strong>CH WIDTH = 170’<br />
ALTERNATIVE 1<br />
Avenida Encinas<br />
<strong>Regional</strong> <strong>Beach</strong> <strong>Sand</strong> <strong>Project</strong> <strong>EIR</strong>/<strong>EA</strong><br />
9969 <strong>Beach</strong> Replenishment\Figures\Fig 2-5 South Carlsbad N Fill 8/31/99<br />
Source: Moffatt & Nichol Engineers<br />
NORTH<br />
Palomar Airport Rd<br />
ALTERNATIVE 2<br />
0<br />
750 Feet<br />
TOP OF SLOPE<br />
Carlsbad South Blvd<br />
2,800’<br />
TOP OF BERM<br />
SLOPE OF BERM<br />
170’<br />
Carlsbad North Blvd<br />
TOE OF SLOPE<br />
B<strong>EA</strong>CH FILL ELEVATION = +12’ MLLW<br />
B<strong>EA</strong>CH WIDTH = 170’<br />
Figure 2-5<br />
South Carlsbad North <strong>Beach</strong> Fill Plan<br />
Alternatives 1 and 2
2.0 Alternatives Considered<br />
<strong>Beach</strong> replenishment at Batiquitos would involve the placement of dredged sediment from a point<br />
approximately 850 feet south of the Batiquitos Lagoon, into the community of Leucadia and Leucadia State<br />
<strong>Beach</strong>, a distance of approximately 1,390 feet (0.3 mile). The northern part of the site is known as<br />
“Ponto.” A berm would be constructed to an elevation of approximately 12 feet above MLLW and would<br />
have a width of approximately 110 feet (Figure 2-6). The beach fill would then slope seaward<br />
approximately 375 feet at a slope of 20:1.<br />
The Leucadia beach fill plan would include creation of a berm of approximately 12 feet above MLLW,<br />
extending seaward approximately 70 feet (Figure 2-7). The top of the beach fill would be flat. The berm<br />
would then slope seaward approximately 125 feet at a slope of 10:1. The proposed receiver site at the<br />
Leucadia site extends approximately 2,700 feet (0.5 mile) from just south of the Grandview access stairs<br />
to Glacus Street.<br />
The Moonlight <strong>Beach</strong> receiver site’s berm would be constructed to a height of approximately 12 feet above<br />
MLLW. The beach fill would be relatively flat and would extend seaward approximately 130 feet seaward<br />
and would then slope seaward at a slope of 20:1. Toward the north, the slope would extend approximately<br />
150 feet, while at the southern part of the berm, the slope would extend approximately 250 feet. The<br />
proposed receiver site would be approximately 770 feet (0.1 mile) long (Figure 2-8).<br />
<strong>Beach</strong> replenishment at the Cardiff site (Figure 2-9) would consist of the placement of dredged sediment<br />
along 780 feet (0.1 mile) of Cardiff State <strong>Beach</strong> south of the San Elijo Lagoon inlet and Restaurant Row.<br />
A berm would be constructed at this location to an elevation of approximately 12 feet above MLLW. The<br />
berm would be flat and extend seaward approximately 115 feet. The beach fill would then slope seaward<br />
approximately 350 feet at a slope of 20:1.<br />
<strong>Beach</strong> replenishment at the Solana <strong>Beach</strong> site would consist of the placement of dredged sediment along<br />
approximately 1,800 feet (0.3 mile) of the beach (Figure 2-10). The northern boundary of the proposed<br />
fill site starts just south of Fletcher Cove and extends southward. A berm would be constructed at this<br />
location to an elevation of approximately 12 feet above MLLW. The berm would be flat and extend<br />
seaward approximately 100 feet. The beach fill would then slope seaward approximately 135 feet at a<br />
slope of 10:1.<br />
The berm at Del Mar’s receiver site would be built to a height of approximately 11 feet above MLLW and<br />
would extend seaward approximately 170 feet (Figure 2-11). The beach fill would then slope seaward<br />
R<br />
R<br />
<strong>Regional</strong> <strong>Beach</strong> <strong>Sand</strong> <strong>Project</strong> <strong>EIR</strong>/<strong>EA</strong> Page 2-21<br />
99-69\SANDAG <strong>EIR</strong><strong>EA</strong> 3.4.wpd 7/17/00
Page 2-22<br />
Batiquitos Lagoon<br />
Carlsbad Blvd<br />
Haymarket Rd<br />
Wilton Rd<br />
Kennington Rd<br />
Aldersgate Rd<br />
X.X Section Name<br />
Parliament Rd<br />
Tattenhorn Rd<br />
<strong>Beach</strong> Fill Elevation = +12’ MLLW<br />
<strong>Beach</strong> Width = 110’<br />
TOP OF SLOPE<br />
TOE OF SLOPE<br />
1,390’<br />
<strong>Regional</strong> <strong>Beach</strong> <strong>Sand</strong> <strong>Project</strong> <strong>EIR</strong>/<strong>EA</strong><br />
9969 <strong>Beach</strong> Replenishment\Figures\Fig 2-6 Batiquitos Fill 8/31/99<br />
Source: Moffatt & Nichol Engineers<br />
NORTH<br />
0<br />
750 Feet<br />
TOP OF BERM<br />
SLOPE OF BERM<br />
Figure 2-6<br />
Batiquitos <strong>Beach</strong> Fill Plan--Alternative 1<br />
(Site Not Proposed Under Alternative 2)
X.X Section Name<br />
<strong>Regional</strong> <strong>Beach</strong> <strong>Sand</strong> <strong>Project</strong> <strong>EIR</strong>/<strong>EA</strong><br />
9969 <strong>Beach</strong> Replenishment\Figures\Fig 2-7 Leucadia Fill 8/31/99<br />
Sea Bluffe<br />
Grandview St<br />
Avocado St<br />
Jupiter St<br />
Neptune Ave<br />
Glaucus St<br />
Diana St<br />
Jasper<br />
St<br />
<strong>Beach</strong> Fill Elevation = + 12’ MLLW<br />
<strong>Beach</strong> Width = 70’<br />
TOP OF SLOPE<br />
TOE OF SLOPE<br />
2,700’<br />
Page 2-23<br />
Source: Moffatt & Nichol Engineers<br />
NORTH<br />
0<br />
750 Feet<br />
TOP OF BERM<br />
SLOPE OF BERM<br />
Figure 2-7<br />
Leucadia <strong>Beach</strong> Fill Plan--Alternative 1<br />
(Site Not Proposed Under Alternative 2)
X.X Section Name<br />
Page 2-24<br />
A St<br />
4th St 4th St<br />
B St<br />
D St<br />
E St<br />
Moonlight<br />
<strong>Beach</strong><br />
4th St<br />
TOP OF SLOPE<br />
<strong>Beach</strong> Fill Elevation = +12’ MLLW<br />
<strong>Beach</strong> Width = 130’<br />
TOE OF SLOPE<br />
770’<br />
<strong>Regional</strong> <strong>Beach</strong> <strong>Sand</strong> <strong>Project</strong> <strong>EIR</strong>/<strong>EA</strong><br />
9969 <strong>Beach</strong> Replenishment\Figures\Fig 2-8 Moonlight <strong>Beach</strong> Fill 8/31/99<br />
Source: Moffatt & Nichol Engineers<br />
NORTH<br />
0<br />
750 Feet<br />
TOP OF BERM<br />
SLOPE OF BERM<br />
Figure 2-8<br />
Moonlight <strong>Beach</strong> Fill Plan--Alternative 1<br />
(Site Not Proposed Under Alternative 2)
<strong>Regional</strong> <strong>Beach</strong> <strong>Sand</strong> <strong>Project</strong> <strong>EIR</strong>/<strong>EA</strong><br />
9969 <strong>Beach</strong> Replenishment\Figures\Fig 2-9 Cardiff <strong>Beach</strong> Fill 8/31/99<br />
TOE OF SLOPE<br />
Restaurant Row<br />
San Elijo Lagoon<br />
<strong>Beach</strong> Fill Elevation = +12’ MLLW<br />
<strong>Beach</strong> Width = 115’<br />
S Coast Highway 101<br />
X.X Section Name<br />
780’<br />
Seaside Reef<br />
Parking Lot<br />
Source: Moffatt & Nichol Engineers<br />
Page 2-25<br />
NORTH<br />
0<br />
750 Feet<br />
TOP OF BERM<br />
SLOPE OF BERM<br />
Figure 2-9<br />
Cardiff <strong>Beach</strong> Fill Plan<br />
Alternatives 1 and 2
X.X Section Name<br />
Page 2-26<br />
Lomas Santa Fe<br />
S Cedros Av<br />
S Highway 101<br />
Dahlia Dr<br />
S Sierra Av<br />
Clark St<br />
Helix Av<br />
Del Mar Shores<br />
Plaza St<br />
TOP OF SLOPE<br />
TOE OF SLOPE<br />
1,800’<br />
<strong>Beach</strong> Fill Elevation = +12 MLLW<br />
<strong>Beach</strong> Width = 135’<br />
<strong>Regional</strong> <strong>Beach</strong> <strong>Sand</strong> <strong>Project</strong> <strong>EIR</strong>/<strong>EA</strong><br />
9969 <strong>Beach</strong> Replenishment\Figures\Fig 2-10 Solana <strong>Beach</strong> Fill 8/31/99<br />
Source: Moffatt & Nichol Engineers<br />
NORTH<br />
0<br />
750 Feet<br />
TOP OF BERM<br />
SLOPE OF BERM<br />
Figure 2-10<br />
Solana <strong>Beach</strong> Fill Plan<br />
Alternatives 1 and 2
<strong>Regional</strong> <strong>Beach</strong> <strong>Sand</strong> <strong>Project</strong> <strong>EIR</strong>/<strong>EA</strong><br />
9969 <strong>Beach</strong> Replenishment\Figures\Fig 2-11 Del Mar <strong>Beach</strong> Fill 8/31/99<br />
29th St<br />
27th St<br />
26th St<br />
25th St<br />
24th St<br />
23rd St<br />
22nd St<br />
TOP OF SLOPE<br />
TOE OF SLOPE<br />
17th St<br />
Camino Del Mar<br />
Coast Blvd<br />
15th St<br />
Stratford Ct<br />
X.X Section Name<br />
3,110<br />
<strong>Beach</strong> Fill Elevation = +11 MLLW<br />
<strong>Beach</strong> Width = 170’<br />
Source: Moffatt & Nichol Engineers<br />
Page 2-27<br />
NORTH<br />
0<br />
750 Feet<br />
TOP OF BERM<br />
SLOPE OF BERM<br />
Figure 2-11<br />
Del Mar <strong>Beach</strong> Fill Plan<br />
Alternatives 1 and 2
2.0 Alternatives Considered<br />
approximately 150 feet at a slope of 10:1. The receiver site extends from just north of 27 th Street to<br />
Powerhouse Park, a distance of approximately 3,110 feet (0.6 mile). This footprint is slightly longer and<br />
wider than the footprint evaluated in the Draft <strong>EIR</strong>/<strong>EA</strong>, but there would be no difference in impact<br />
conclusions (refer to Appendix F).<br />
R<br />
R<br />
R<br />
R<br />
The beach replenishment berm at the Torrey Pines site (Figure 2-12) would be constructed to an elevation<br />
of approximately 11 feet above MLLW, and would extend for approximately 1,620 feet (0.3 mile). The<br />
berm would be flat with a width of approximately 300 feet. The beach fill would then slope seaward<br />
approximately 200 feet at a slope of 10:1.<br />
The Mission <strong>Beach</strong> receiver site would be constructed to create a berm of approximately 10 feet above<br />
MLLW and approximately 150 feet wide, stretching approximately 1,590 feet (0.3 mile) from Nantasket<br />
Court to Santa Barbara Place (Figure 2-13). The beach fill would then slope seaward at a slope of 20:1.<br />
The width of the slope would be approximately 125 feet at the northern end and 250 feet to the south,<br />
where the underwater slope is more gradual.<br />
In Imperial <strong>Beach</strong>, the beach replenishment berm would be built to approximately 10 feet above MLLW<br />
and would be approximately 120 feet wide, stretching from just Admiralty Way to approximately 600 feet<br />
south of Encanto Avenue (Figure 2-14). The total length would be approximately 2,310 feet (0.4 mile).<br />
The beach fill would then slope seaward approximately 125 feet at a slope of 20:1.<br />
Borrow Sites<br />
The six borrow sites would be located offshore along the coast from Oceanside to Imperial <strong>Beach</strong>, in<br />
relative proximity to each receiver site but far enough offshore to be outside the littoral cell depth of closure.<br />
The term borrow site refers to a larger location that has been investigated as part of this project in terms<br />
of sediment characteristics, marine resources, ocean surface, etc. Within that large area, a smaller dredge<br />
area has been identified where the actual material would be removed. The impact analyses evaluate the<br />
direct impacts of activity in the smaller dredge area, but the term “borrow site” is used when discussing this<br />
project feature as a category, i.e., instead of receiver sites. Where a further distinction is necessary, it is<br />
noted in the analysis. Table 2-3 provides a summary of borrow site characteristics including the volume<br />
of material to be dredged, the surface area affected, the depth of dredge, and the water depth.<br />
Figures 2-15 through 2-20 illustrate the dredge location and discharge plan for each of the six borrow sites.<br />
As shown, temporary pipelines to carry replenishment material would be constructed to the shoreline and<br />
then material would be pumped up and down the coast, as necessary, to various receiver sites.<br />
Page 2-28<br />
<strong>Regional</strong> <strong>Beach</strong> <strong>Sand</strong> <strong>Project</strong> <strong>EIR</strong>/<strong>EA</strong><br />
99-69\SANDAG <strong>EIR</strong><strong>EA</strong> 3.4.wpd 7/17/00
<strong>Regional</strong> <strong>Beach</strong> <strong>Sand</strong> <strong>Project</strong> <strong>EIR</strong>/<strong>EA</strong><br />
9969 <strong>Beach</strong> Replenishment\Figures\Fig 2-12 Leucadia Fill 8/31/99<br />
North Torrey Pines Rd<br />
TOP OF SLOPE<br />
1,620’<br />
B<strong>EA</strong>CH FILL ELEVATION = +11’ MLLW<br />
B<strong>EA</strong>CH WIDTH = 300’<br />
TOE OF SLOPE<br />
Torrey Pines<br />
State Reserve<br />
X.X Section Name<br />
ALTERNATIVE 1<br />
Torrey Pines<br />
State Reserve<br />
North Torrey Pines Rd<br />
B<strong>EA</strong>CH FILL ELEVATION = +11’ MLLW<br />
B<strong>EA</strong>CH WIDTH = 300’<br />
TOE OF SLOPE<br />
TOP OF SLOPE<br />
2,470’<br />
ALTERNATIVE 2<br />
Source: Moffatt & Nichol Engineers<br />
Page 2-29<br />
NORTH<br />
0<br />
750 Feet<br />
TOP OF BERM<br />
SLOPE OF BERM<br />
Figure 2-12<br />
Torrey Pines <strong>Beach</strong> Fill Plan<br />
Alternatives 1 and 2
Page 2-30<br />
San Juan<br />
Place<br />
Santa Clara Place Ostend Court<br />
1,590’<br />
Nantasket Court<br />
El Carmel Place<br />
Santa Barbara Place<br />
Mission Blvd<br />
X.X Section Name<br />
TOP OF SLOPE<br />
TOE OF SLOPE<br />
ALTERNATIVE 1<br />
B<strong>EA</strong>CH FILL ELEVATION = +10’ MLLW<br />
B<strong>EA</strong>CH WIDTH = 150’<br />
Santa Clara Place<br />
Ostend Court<br />
San Juan Place<br />
Nantasket Court<br />
Santa Barbara Place<br />
El Carmel Place<br />
<strong>Regional</strong> <strong>Beach</strong> <strong>Sand</strong> <strong>Project</strong> <strong>EIR</strong>/<strong>EA</strong><br />
9969 <strong>Beach</strong> Replenishment\Figures\Fig 2-13 Mission <strong>Beach</strong> Fill 8/31/99<br />
Source: Moffatt & Nichol Engineers<br />
NORTH<br />
0<br />
ALTERNATIVE 1<br />
ALTERNATIVE 2<br />
750 Feet<br />
TOP OF SLOPE<br />
2,380’<br />
TOP OF BERM<br />
SLOPE OF BERM<br />
TOE OF SLOPE<br />
Mission Blvd<br />
B<strong>EA</strong>CH FILL ELEVATION = +10’ MLLW<br />
B<strong>EA</strong>CH WIDTH = 150’<br />
Figure 2-13<br />
Mission <strong>Beach</strong> Fill Plan<br />
Alternatives 1 and 2<br />
ALTERNATIVE 2
<strong>Regional</strong> <strong>Beach</strong> <strong>Sand</strong> <strong>Project</strong> <strong>EIR</strong>/<strong>EA</strong><br />
9969 <strong>Beach</strong> Replenishment\Figures\Fig 2-14 Imperial <strong>Beach</strong> Fill 8/31/99<br />
Evergreen Av<br />
Elder Av<br />
Elkwood Av<br />
Ebony Av<br />
Ocean Ln<br />
ALTERNATIVE 1<br />
Imperial <strong>Beach</strong> Blvd<br />
Admiralty Wy<br />
<strong>Beach</strong> Av<br />
Ocean Ln<br />
TOP OF SLOPE<br />
Cortez Av<br />
Decansa Av<br />
2,310’<br />
Seacoast Dr<br />
Encanto Av<br />
TOE OF SLOPE<br />
Tijuana Slough<br />
National<br />
Wildlife Park<br />
B<strong>EA</strong>CH FILL Elevation = +10’ MLLW<br />
B<strong>EA</strong>CH WIDTH = 120’<br />
X.X Section Name<br />
Evergreen Av<br />
Elder Av<br />
Elkwood Av<br />
Ebony Av<br />
Imperial <strong>Beach</strong> Blvd<br />
Admiralty Wy<br />
Ocean Ln<br />
<strong>Beach</strong> Av<br />
Cortez Av<br />
Decansa Av<br />
Seacoast Dr<br />
Encanto Av<br />
Tijuana Slough<br />
National<br />
Wildlife Park<br />
Ocean Ln<br />
TOP OF SLOPE<br />
TOE OF SLOPE<br />
B<strong>EA</strong>CH FILL Elevation = +10’ MLLW<br />
B<strong>EA</strong>CH WIDTH = 120’<br />
3,470’<br />
ALTERNATIVE 2<br />
Page 2-31<br />
Source: Moffatt & Nichol Engineers<br />
NORTH<br />
0 500 Feet<br />
ALTERNATIVE 2<br />
TOP OF BERM<br />
SLOPE OF BERM<br />
Figure 2-14<br />
Imperial <strong>Beach</strong> Fill Plan<br />
Alternatives 1 and 2
Rock Scatter<br />
Previously Unmapped<br />
SO-9<br />
# 4A<br />
# 3A<br />
# 2A<br />
# 1A<br />
4B<br />
#<br />
# 3B<br />
2B #<br />
# 1B<br />
# 4C<br />
# 3C<br />
# 2C<br />
# 1C<br />
Dredge Area<br />
(Note: Dredge area<br />
reduced in F<strong>EIR</strong>/<strong>EA</strong><br />
by approximately<br />
25 percent)<br />
Ocea nsid e Harbor<br />
Borrow<br />
Site<br />
Dredge<br />
Discharge Line<br />
-50<br />
-40<br />
-20<br />
South Oceanside<br />
Receiver Site<br />
(M aximum Length)<br />
South Carlsbad N orth<br />
Receiver Site<br />
<<br />
Encina W astewa te r Au th ority<br />
App roximate S ewer L ine L oca tio n<br />
to a De pth of -1 80 '<br />
<<br />
South Carlsbad South<br />
R eceiver Site<br />
(Alternative 2 Only)<br />
Dred ge Disch arg e Lin e<br />
-20<br />
-10<br />
-40<br />
-60<br />
-90<br />
-80<br />
-30<br />
-100<br />
-50<br />
-70<br />
Dredge Area<br />
Possible D redge<br />
Expansion Area<br />
SO-7<br />
# 1<br />
# 9 5# # 2<br />
# 10 # 6 #<br />
# 11<br />
3<br />
7 #<br />
# 4<br />
# #<br />
12 8<br />
Batiquitos<br />
Receiver Site<br />
(Alternative 1 Only)<br />
Leucadia<br />
Receiver Site<br />
(Alternative 1 Only)<br />
Borrow Site<br />
Dre dg e<br />
Discharge L ine<br />
<<br />
# CDFG ARTIFICIAL RE EFS<br />
M oonlight <strong>Beach</strong><br />
Receiver Site<br />
(Alternative 1 Only)<br />
<<br />
Sou rce: Moffatt & Nich ol En gin eers<br />
360 0 0 360 0 Fe et<br />
Figure 2-16<br />
SO-7 Dredging<br />
and Discharge Plan<br />
<strong>Regional</strong> <strong>Beach</strong> <strong>Sand</strong> <strong>Project</strong> <strong>EIR</strong>/<strong>EA</strong><br />
9969.1 SANDAG\GIS\ Fig 2-16 so7.apr 3/14/00<br />
Page 2-33
Card iff<br />
by th e<br />
Se a<br />
Cardiff<br />
Receiver Site<br />
Dredge Area<br />
Borrow Site<br />
S0-6<br />
Dredge<br />
Discharge Line<br />
<<br />
San Elijo<br />
Lag oo n<br />
<<br />
Sa n Elijo<br />
Se wer O utfall<br />
Loca tion to a<br />
Depth o f -148 '<br />
Sou rce: Moffatt & Nich ol En gin eers<br />
150 0 0 150 0 Fe et<br />
Figure 2-17<br />
SO-6 Dredging<br />
and Discharge Plan<br />
Page 2-34<br />
<strong>Regional</strong> <strong>Beach</strong> <strong>Sand</strong> <strong>Project</strong> <strong>EIR</strong>/<strong>EA</strong><br />
9969.1 SANDAG\GIS\ Fig 2-17 so6.apr 3/14/00
City of So lan a Be ach<br />
Solana <strong>Beach</strong><br />
Receiver Site<br />
Dre dg e<br />
Discharge L ine<br />
<<br />
Dredge Area<br />
S0-5<br />
De l Mar<br />
Receive r Site<br />
Borrow Site<br />
City of Del Ma r<br />
<<br />
-70<br />
-60<br />
-50<br />
-40<br />
-30<br />
-10<br />
-20<br />
Dre dg e<br />
Discharge L ine<br />
-90<br />
-80<br />
-100<br />
<<br />
Torrey Pines<br />
Receiver Site<br />
Torrey Pin es<br />
State Rese rve<br />
Sou rce: Moffatt & Nich ol En gin eers<br />
415 0 0 415 0 Fe et<br />
Figure 2-18<br />
SO-5 Dredging<br />
and Discharge Plan<br />
<strong>Regional</strong> <strong>Beach</strong> <strong>Sand</strong> <strong>Project</strong> <strong>EIR</strong>/<strong>EA</strong><br />
9969.1 SANDAG\GIS\ Fig 2-18 s05.apr 3/14/00<br />
Page 2-35
Pro pose d<br />
S an Die go<br />
Unde rwate r<br />
Recre ation A re a<br />
-10<br />
-30<br />
-50<br />
-20<br />
-70<br />
-40<br />
-90<br />
-60<br />
-80<br />
Mission<br />
Ba y<br />
Propo sed<br />
Yuko n Site<br />
Mission <strong>Beach</strong><br />
Receiver Site<br />
#<br />
Dredge Area<br />
Dredg e<br />
Discharge L ine<br />
<<br />
MB-1<br />
Missio n Ba y<br />
Brid ge W recka ge 1<br />
#<br />
NOS C<br />
To wer<br />
Borrow Site<br />
Ruby E<br />
#<br />
#<br />
Missio n Ba y<br />
Brid ge W recka ge 2<br />
El Rey<br />
#<br />
#<br />
#<br />
#<br />
Sho oters'<br />
Fa ntasy<br />
Mission B ay<br />
Ceme nt<br />
CDFG Missio n Ba y<br />
A rtificial Re ef<br />
(MB AR)<br />
#<br />
CDFG<br />
Concrete Ree f<br />
Sou rce : M of fat t & Nich ol En gine ers<br />
Page 2-36<br />
250 0 0 250 0 Fe et<br />
Figure 2-19<br />
M B-1 Dredging<br />
and Discharge Plan<br />
<strong>Regional</strong> <strong>Beach</strong> <strong>Sand</strong> <strong>Project</strong> <strong>EIR</strong>/<strong>EA</strong><br />
9969.1 SANDAG\GIS\Fig 2-19 mb1.apr 3/14/00
-4 0<br />
-10<br />
-20<br />
-30<br />
-50<br />
-90<br />
-80<br />
-70<br />
-60<br />
City o f<br />
Imp erial B each<br />
Imperial <strong>Beach</strong><br />
R eceiver Site<br />
<<br />
#0<br />
Dredge Area<br />
Line<br />
Dredge Discharge<br />
Tijua na<br />
Rive r<br />
Estu ary<br />
City Of Sa n Dieg o<br />
Ocea n Mon itoring S ites<br />
<<br />
App roximate Lo cation of th e<br />
City of Sa n Dieg o Ou tfa ll<br />
#0<br />
SS-1<br />
Borrow Site<br />
Sou rce: Moffatt & Nich ol En gin eers<br />
400 0 0 400 0 Fe et<br />
Figure 2-20<br />
SS-1 Dredging<br />
and Discharge Plan<br />
<strong>Regional</strong> <strong>Beach</strong> <strong>Sand</strong> <strong>Project</strong> <strong>EIR</strong>/<strong>EA</strong><br />
9969.1 SANDAG\GIS\ Fig 2-20 ss1.apr 3/14/00<br />
Page 2-37
2.0 Alternatives Considered<br />
Table 2-3<br />
Alternative 1 – Borrow Site Characteristics<br />
(1)<br />
(2)<br />
(3)<br />
Borrow Sites<br />
SO-9 (1)<br />
SO-7 (3)<br />
Volume of <strong>Sand</strong> to<br />
be Dredged (in cy)<br />
Approx. Surface<br />
Area to be<br />
Dredged<br />
(in acres)<br />
Depth of Dredge<br />
(in feet)<br />
Water Depth<br />
(in feet, MLLW)<br />
706,000 (2) 63 Max. 15 45 to 55<br />
R<br />
496,000 70 1 to 11 60 to 85<br />
SO-6 104,000 29 3 to 4 60 to 80<br />
SO-5 656,000 (2) 127 Max. 6 50 to 80 R<br />
MB-1 100,000 19 Max. 6 68 to 75<br />
SS-1 120,000 22 Max. 6 40 to 53<br />
With dredge area modified to provide a larger buffer between previously unmapped artificial reef areas,<br />
the dredge area would be reduced by approximately 25 percent. The borrow site may be eliminated<br />
during final design.<br />
Volume includes overfill factor (Moffatt & Nichol 2000c).<br />
Possible expansion to 1.5 million cy with total surface area of 150 acres if SO-9 and SO-6 are eliminated.<br />
Depth of dredge would be maximum 15 feet.<br />
R<br />
R<br />
R<br />
R<br />
R<br />
R<br />
R<br />
While SO-9 and SO-6 are shown as possible borrow sites, they may be eliminated and additional material<br />
may be removed from SO-7. Figure 2-16 illustrates the possible expansion dredge area at SO-7.<br />
R<br />
R<br />
Alternative 1b<br />
Under Alternative 1b, the proposed action would be implemented at the same receiver sites using the same<br />
borrow sites as described for Alternative 1a; however, adherence to applicable noise ordinances would<br />
limit the hours and number of days per week that beach replenishment could occur. For instance,<br />
operations on Sundays and construction after 7:00 p.m. is prohibited in some jurisdictions. Receiver sites<br />
located on land within the State Parks system or administered by the State would not be subject to local<br />
noise ordinances and construction could continue on the 7/24 schedule even under this alternative. This<br />
applies to the South Carlsbad North receiver site. All receiver sites in Encinitas would be exempt from the<br />
City’s Noise Abatement Ordinance as a “federal or state pre-empted activity” (Municipal Code Section<br />
9.32.417(c)). While the Torrey Pines receiver site is within the State Park land and would be exempt, a<br />
booster pump would likely be required in the Del Mar jurisdiction. For purposes of disclosure and<br />
comparison, this receiver site is considered constrained under Alternative 1b. Because the construction<br />
schedule would be limited, the proposed replenishment would take longer. Also, less sand would be<br />
delivered to some of the receiver sites due to budgetary constraints. Table 2-2 identifies which receiver<br />
Page 2-38<br />
<strong>Regional</strong> <strong>Beach</strong> <strong>Sand</strong> <strong>Project</strong> <strong>EIR</strong>/<strong>EA</strong><br />
99-69\SANDAG <strong>EIR</strong><strong>EA</strong> 3.4.wpd 7/17/00
2.0 Alternatives Considered<br />
sites would be subject to local noise ordinances and provides a comparison of the schedule and production<br />
capability under either construction variation. As shown, the overall quantity of sand would be 1.3 million<br />
cy under Alternative 1b versus 2 million cubic yards under Alternative 1a.<br />
Construction Methods/Design Features to Avoid Impacts<br />
R<br />
The information is provided to provide a clear understanding of how sand would be dredged, delivered to<br />
the receiver site, and then manipulated to be suitable for public use. It also identifies the design<br />
features/specific methods to be incorporated into final design or the contractor’s specifications to avoid<br />
potential impacts.<br />
R<br />
R<br />
R<br />
Construction would consist of:<br />
1. Dredging the offshore borrow sites with either a cutterhead suction dredge or hopper dredge;<br />
2. Pumping sand through floating/submerged discharge lines to the beach and through discharge lines<br />
placed along the higher portions of the beach to the receiver sites (use of booster pumps as<br />
necessary);<br />
3. Discharging the sand at the appropriate receiving beach within training dikes; and<br />
4. Redistributing the sand as needed with earthmoving equipment, such as scrapers, and grading the<br />
beach fills to required dimensions with bulldozers.<br />
Dredging Operations<br />
<strong>Beach</strong> replenishment operations would include the use of dredge vessels which would dredge sediment<br />
from the offshore borrow sites and transfer the sediment to the proposed receiver sites. The contractors<br />
may use one of two types of dredge vessels, a hopper dredge or a cutterhead suction dredge and both are<br />
described below. Regardless of the dredge type, the Coast Guard would post a Notice to mariners with<br />
the coordinates of dredging activity so that ocean users can avoid the activity.<br />
<strong>Regional</strong> <strong>Beach</strong> <strong>Sand</strong> <strong>Project</strong> <strong>EIR</strong>/<strong>EA</strong> Page 2-39<br />
99-69\SANDAG <strong>EIR</strong><strong>EA</strong> 3.4.wpd 7/17/00
2.0 Alternatives Considered<br />
Hopper Dredge<br />
The hopper dredge is a self-contained vessel that loads sediment from an offshore borrow site then moves<br />
to a receiver site for sand placement. The hopper dredge contains two large arms that have the ability to<br />
drag along the ocean floor and collect sediment. The drag heads are about 10 feet square. The hopper<br />
dredge moves along the ocean surface with its arms extended, making passes back and forth until its hull<br />
is fully loaded with sediment. The vessel can hold approximately 2,000 to 5,000 cy of sediment per load.<br />
The hopper dredge can generally reach within approximately 0.5 mile of shore to offload, unless booster<br />
pumps are placed along the beach that can increase its pumping distance. At this position, the hopper<br />
dredge connects to a floating or submerged pump line from shore. The vessel then discharges a mixture<br />
of sediment and sea water onto the receiver site. Submerged lines are encased by several large tractor tires<br />
to prevent abrasion of the ocean floor or reefs.<br />
R<br />
The hopper dredge can also connect to a floating platform called a mono buoy, which is used to<br />
interconnect the floating pump line with a steel sinker pipeline that would run the rest of the distance to the<br />
beach. The mono buoy is generally anchored to the seabed at an appropriate depth and location to serve<br />
the project needs, depending on locations of sensitive resources and engineering considerations. For this<br />
project the mano bouy would be anchored in at least 25 feet of water. The contractor would also be<br />
conditioned to avoid sensitive resources such as kelp, reefs, and structures such as outfalls. An anchor plan<br />
would be prepared for each mono buoy for submittal to the resource agencies prior to construction<br />
illustrating any or all sensitive resources and the relationship between anchors on the ocean floor.<br />
R<br />
R<br />
R<br />
R<br />
R<br />
Cutterhead Suction Dredge<br />
A cutterhead suction dredge is similar to a hopper dredge in that it uses a long arm that extends down to<br />
the sea floor to dredge sediment. A rotating head about eight feet in diameter sweeps an area about 300<br />
feet wide. However, a cutterhead dredge breaks up sediment material along the seafloor, then uses a<br />
vacuum mechanism to suck up sediment into an intake line and pump it directly to shore through a discharge<br />
line. The cutterhead dredge anchors above a borrow site while its arm swings back and forth to dredge<br />
up sediment, and pumps a mixture of sediment and sea water through a floating discharge line directly onto<br />
the receiver site. The discharge line would either be assembled afloat and connected to the cutterhead<br />
suction dredge to land by tugboats, or assembled on land and dragged offshore to the dredge by tugboat.<br />
Unlike the hopper dredge, the cutterhead dredge remains at the dredge site for the entire operation while<br />
pipelines carry the material.<br />
R<br />
R<br />
Page 2-40<br />
<strong>Regional</strong> <strong>Beach</strong> <strong>Sand</strong> <strong>Project</strong> <strong>EIR</strong>/<strong>EA</strong><br />
99-69\SANDAG <strong>EIR</strong><strong>EA</strong> 3.4.wpd 7/17/00
2.0 Alternatives Considered<br />
For both dredge vessels, the floating portion of the dredge discharge line would be marked and lighted for<br />
navigation safety and a Notice to Mariners would be issued through the U.S. Coast Guard. The discharge<br />
line would be trucked or floated in segments to the appropriate placement locations and assembled using<br />
cranes and other equipment. The line may be a combination of plastic (HDPE) and steel materials<br />
depending on need and availability, and would be approximately 30 inches in diameter.<br />
Booster pumps would be used approximately every 10,000 feet on longer reaches. One offshore booster<br />
pump may be necessary for the offshore length from SO-9 to the Oceanside receiver site; however, it is<br />
possible that the dredge itself could move the material the entire distance to shore. Booster pumps would<br />
be necessary where onshore pipelines would convey material to the receivers site(s) and the total onshore<br />
distance would be approximately 10,000 feet. An onshore booster pump would be necessary along the<br />
length from the Oceanside to North Carlsbad receiver sites. Onshore booster pumps would also be<br />
necessary to convey material to South Carlsbad North, Moonlight <strong>Beach</strong>, and Torrey Pines. The exact<br />
locations of pumps are not known at this time.<br />
For all pipeline delivery routes, the floating and submerged portions of the dredge discharge line would be<br />
routed to avoid sensitive resources to the maximum extent feasible. For instance, the discharge line would<br />
extend westward beyond kelp beds to prevent dredge vessels from traversing kelp beds. The contractor<br />
would also be conditioned to avoid traversing the CDFG artificial reefs near SO-9 (Figure 2-15), SO-7<br />
(Figure 2-16) and MB-1 (Figure 2-19). That means no hopper dredge (empty or full) or discharge lines<br />
may traverse these three artificial reef locations. As shown in Figure 2-16, the possible northern dredge<br />
discharge pipeline path at SO-7 would be floating above CDFG artificial reefs 9 and 1. This floating pipe<br />
would not affect the submerged reefs, but it has been sited to make landfall in the nearshore location without<br />
reefs or surfgrass. The contractor would also be conditioned to avoid any discharge pipe placement within<br />
the Tijuana Slough National Wildlife Refuge, that means any discharge pipe would make landfall north of<br />
the terminus of Seacoast Boulevard in Imperial <strong>Beach</strong>.<br />
R<br />
R<br />
R<br />
R<br />
R<br />
R<br />
R<br />
R<br />
R<br />
Discharge Line Management and Maintenance<br />
Assuming use of a cutterhead suction dredge, the discharge line would require management and<br />
maintenance activities during the construction period. After replenishment was complete, all pipelines<br />
would be removed. The line would be placed along the back of the beach (i.e., eastward) to minimize its<br />
exposure to wave forces. At locations with no existing shore protection or bluffs, the discharge line would<br />
lie along the highest landward portion of the existing beach or cobble berm. These locations include North<br />
Oceanside, Buccaneer <strong>Beach</strong>, Buena Vista Lagoon, South Carlsbad, Batiquitos, Leucadia, Moonlight<br />
<strong>Regional</strong> <strong>Beach</strong> <strong>Sand</strong> <strong>Project</strong> <strong>EIR</strong>/<strong>EA</strong> Page 2-41<br />
99-69\SANDAG <strong>EIR</strong><strong>EA</strong> 3.4.wpd 7/17/00
2.0 Alternatives Considered<br />
<strong>Beach</strong>, Cardiff, portions of Del Mar, Torrey Pines, Mission <strong>Beach</strong>, and portions of Imperial <strong>Beach</strong>. At<br />
locations with existing shore protection (revetment or seawalls), the line would be placed along the toe of<br />
the protective device. Sites with shore protection include South Oceanside, portions of North Carlsbad,<br />
Leucadia, Del Mar, and portions of Imperial <strong>Beach</strong>. At locations with bluffs behind the beach, the<br />
discharge line would lie along the bluff toe. <strong>Beach</strong>es backed by bluffs include North Carlsbad, South<br />
Carlsbad, Leucadia, Solana <strong>Beach</strong>, and Torrey Pines.<br />
The discharge line would be placed on top of the existing sand or cobbles and be buried at intervals to<br />
provide for pipe anchoring and for beach access to the public. Areas of active construction, i.e., where<br />
sand is being emitted from the pipe and redistributed by earthmoving equipment, would be cordoned off<br />
from the public with signs. Construction crews would also be onsite to monitor the construction site to<br />
prohibit public access. All other areas of the discharge line would be open to public use.<br />
Maintenance of the discharge line would occur as necessary. The line may be affected by waves and tides<br />
and may periodically require added support, protection, or relocation. Earthmoving equipment and cranes<br />
may be used to maintain the line. Figures 2-21 and 2-22 show photographs of the dredge discharge line<br />
from a previous beach replenishment project at South Carlsbad State <strong>Beach</strong> (Ponto) to illustrate a recent<br />
example of this type of operation.<br />
More frequent line maintenance may be required along areas with a narrow existing beach backed by<br />
bluffs such as South Carlsbad, Leucadia, Solana <strong>Beach</strong>, and Torrey Pines. Little room exists for line<br />
placement and protection at these sites. The line may be more exposed to waves and may be affected<br />
during high tides or waves. However, the intent of maintenance is to provide safety and security for these<br />
temporary features.<br />
Training Dikes<br />
Training dikes would be constructed to reduce turbidity and aid in the retention of pumped sand at receiving<br />
beaches. The material coming from the dredge material discharge pipeline is a slurry mix of sand and<br />
water. Once the water flows back to the ocean the heavier sand settles onto the beach. The training dike<br />
system consist of two dikes – one that is perpendicular to the beach connected to one that is parallel to the<br />
beach, forming an “L” with the long end parallel to shore. The dikes would be constructed using two<br />
bulldozers. <strong>Sand</strong> would be placed at a single discharge point behind (i.e., landward) the dikes. The dikes<br />
would be used to direct the flow of the discharge and slow down the water flow thereby allowing more<br />
sediment to settle onto the beach instead of washing back into the surf zone. Where sand is not<br />
Page 2-42<br />
<strong>Regional</strong> <strong>Beach</strong> <strong>Sand</strong> <strong>Project</strong> <strong>EIR</strong>/<strong>EA</strong><br />
99-69\SANDAG <strong>EIR</strong><strong>EA</strong> 3.4.wpd 7/17/00
X.X Section Name<br />
Dredge Discharge Lines<br />
Photo A- Dredge discharge line placement on the beach berm at the South Carlsbad North<br />
receiver site in December of 1995.<br />
<strong>Sand</strong> Training Dike<br />
Dredge Discharge Line<br />
Containment Area<br />
Photo B- The end of the discharge line is shown in the foreground. <strong>Sand</strong> is discharged<br />
into a diked-off area to minimize turbidity and control sand deposition.<br />
Source: Modified Nardin, et al, 1981<br />
Figure 2-21<br />
<strong>Beach</strong> Building Operations<br />
<strong>Regional</strong> <strong>Beach</strong> <strong>Sand</strong> <strong>Project</strong> <strong>EIR</strong>/<strong>EA</strong><br />
9969 <strong>Beach</strong> Replenishment\Figures\Fig 12-21Building Operations 8/23/99<br />
Page 2-43
X.X Section Name<br />
Discharge Line<br />
Containment Area<br />
Photo C- <strong>Sand</strong> is shown pumped into the containment area in the distance, with the<br />
discharge line lying along the beach in the foreground.<br />
Dredge Discharge Lines<br />
Photo D- Earthmoving equipment spreading sand discharged from the line.<br />
Source: Modified Nardin, et al, 1981<br />
Figure 2-22<br />
<strong>Beach</strong> Building Operations<br />
Page 2-44<br />
<strong>Regional</strong> <strong>Beach</strong> <strong>Sand</strong> <strong>Project</strong> <strong>EIR</strong>/<strong>EA</strong><br />
9969 <strong>Beach</strong> Replenishment\Figures\Fig 12-22 Building Operations 8/23/99
2.0 Alternatives Considered<br />
present on the existing beach (e.g., Cardiff), an initial quantity of sand would be discharged on the highest<br />
portion of the beach at low tide for use in building the dikes.<br />
<strong>Beach</strong> Building<br />
<strong>Beach</strong>es would be formed by deposition of sand from the dredge discharge line along the training dikes.<br />
<strong>Sand</strong> would be graded and spread along the beach using two bulldozers. One crane may be used to move<br />
the discharge pipeline line. A maximum of 12 crew persons would help to distribute the sand during beach<br />
building operations. Prior to beach building activities, SANDAG would notify the local jurisdiction and the<br />
local print media of the activity. Those entities would publicize the upcoming activity. SANDAG will also<br />
maintain a project website with current information regarding ongoing and soon-to-be-initiated project<br />
events (http://www.sandag.cog.ca.us).<br />
<strong>Sand</strong> placement around stationary lifeguard towers would be conducted by placing sand around the towers<br />
without removing them. The line-of-sight would not be blocked as sand would be excavated to preserve<br />
lifeguard views if the fill is placed higher than the tower. <strong>Sand</strong> placement around storm drain outlets would<br />
be designed to allow proper drainage. Photographs of beach building operations are shown in Figures 2-<br />
21 and 2-22.<br />
Equipment Management/Personnel Parking<br />
Because beach replenishment activities would occur on a constant basis at the site and using only the few<br />
machines necessary, there would not be a need for equipment storage. During replenishment activities, the<br />
vehicles would either be active or temporarily idle on the receiver site itself. Any fueling or maintenance<br />
activities would occur at the nearest public street or parking lot. Construction personnel would park near<br />
the receiver sites in public parking areas. The contractor will be required to prepare a plan for hazardous<br />
spill containment.<br />
Schedule<br />
<strong>Sand</strong> placement operations for the proposed action are scheduled to occur beginning in spring 2001 per<br />
the action of the SEC at their May 2000 meeting. The Draft <strong>EIR</strong>/<strong>EA</strong> was prepared considering a<br />
construction start date in late summer 2000. The change in schedule is addressed for every issue area in<br />
Chapter 4.0.<br />
R<br />
R<br />
R<br />
R<br />
<strong>Regional</strong> <strong>Beach</strong> <strong>Sand</strong> <strong>Project</strong> <strong>EIR</strong>/<strong>EA</strong> Page 2-45<br />
99-69\SANDAG <strong>EIR</strong><strong>EA</strong> 3.4.wpd 7/17/00
2.0 Alternatives Considered<br />
The exact timing for particular receiver sites would depend on the contractor selected to implement the<br />
dredging and disposal activities, the alternative selected for implementation, and coordination with the<br />
resource agencies regarding nesting season. However, scheduling would be coordinated to the maximum<br />
extent possible to avoid conflicts with national holidays and scheduled major beach events.<br />
R<br />
R<br />
R<br />
Public Safety/<strong>Beach</strong> Closures<br />
Due to construction activities associated with beach replenishment operations (e.g., pumping sand onto the<br />
beach, grading, line moving and maintenance), portions of the identified receiver sites would be temporarily<br />
closed to public access. Table 2-4 shows the approximate length of each receiver site that would be closed<br />
to the public per day, depending on the unique beach site characteristics (e.g., width of existing beach,<br />
presence of bluffs, rip-rap) at each receiver site. Closure would be maintained on a 24-hour basis during<br />
the scheduled project operation time.<br />
Table 2-4<br />
Receiver Site Closures During Construction<br />
Receiver Site<br />
Approximate Length of Receiver<br />
Site Closed per Day (feet)<br />
South Oceanside 175<br />
North Carlsbad (1) 250<br />
South Carlsbad North 200<br />
South Carlsbad South (2) 200<br />
Batiquitos (1) 175<br />
Leucadia (1) 325<br />
Moonlight <strong>Beach</strong> (1) 150<br />
Cardiff 125<br />
Solana <strong>Beach</strong> 200<br />
Del Mar 250<br />
Torrey Pines 100<br />
Mission <strong>Beach</strong> 250<br />
Imperial <strong>Beach</strong> 300<br />
(1)<br />
(2)<br />
Receiver site under Alternative 1 only.<br />
Receiver site under Alternative 2 only.<br />
Page 2-46<br />
<strong>Regional</strong> <strong>Beach</strong> <strong>Sand</strong> <strong>Project</strong> <strong>EIR</strong>/<strong>EA</strong><br />
99-69\SANDAG <strong>EIR</strong><strong>EA</strong> 3.4.wpd 7/17/00
2.0 Alternatives Considered<br />
During beach replenishment activities, a 100-foot buffer zone would be maintained between the operational<br />
area and open public beaches. The contractor selected to perform the beach building operations would<br />
provide and maintain safety measures in the vicinity of the receiver sites including fencing, barricades, and<br />
flag personnel as necessary.<br />
Offshore Closures/Coordination with Commercial Fishermen<br />
In addition to onshore restricted access, an offshore area would be restricted to allow proper anchoring<br />
of the dredge and pumping operations and protect public safety. Each of the dredge locations would be<br />
publicized via a U.S. Coast Guard Notice to Mariners. Within that larger area, the Notice to Mariners<br />
would identify that a 500 foot buffer must be maintained around the active dredge equipment. That 500<br />
foot buffer would vary throughout the day as the active dredge location shifted within the overall dredge<br />
area. A 500 foot restricted buffer would also be provided around the mono buoy where the hopper dredge<br />
(if used) would connect to the discharge line. The Notice to Mariners would also identify the radio<br />
frequency used by the dredge operator to allow other boat operators to coordinate directly with the<br />
operator. This would be particularly useful around the mono buoy where the buffer may only be necessary<br />
for the few hours in a day where it would be utilized. When not in use, the buffer would not be necessary<br />
and boating activity could occur nearby.<br />
A pro-active effort would be made to coordinate with the commercial fishermen in advance of dredging<br />
and during dredge operations to avoid conflicts and fishing gear loss. Transit corridors for the dredge<br />
would be defined in consultation with a representative of the commercial fishermen and this transit corridor<br />
would also be noticed. Transit corridors would be defined from the harbor to the dredge location and from<br />
the dredge area to the mono buoy (if used). The noticing process for the transit corridor and dredge<br />
location would involve Notice to Mariners, written notices to local fishing representatives, posted notices<br />
in local harbors, and incorporation of these notices into a project website. The website would include a<br />
current overall project schedule with on-going and soon-to-be-initiated project events. This website would<br />
serve the general public as well.<br />
At the initiation of dredge activities, an observer would be aboard the dredge to document any fishing gear<br />
in the noticed transit or dredge areas. Gear within these areas, if damaged or destroyed, would not require<br />
compensation. If gear outside of the noticed dredge areas or transit corridors is damaged or destroyed,<br />
compensation would be the responsibility of the contractor.<br />
<strong>Regional</strong> <strong>Beach</strong> <strong>Sand</strong> <strong>Project</strong> <strong>EIR</strong>/<strong>EA</strong> Page 2-47<br />
99-69\SANDAG <strong>EIR</strong><strong>EA</strong> 3.4.wpd 7/17/00
2.0 Alternatives Considered<br />
The lobster season generally runs from mid-October through mid-March. At the close of the season, all<br />
legal lobster traps would be removed and there would be no need for continued monitoring for lobster<br />
traps. There is still some trapping effort associated with the crab fishery, which has no seasonal restriction,<br />
but the number of crab traps would be many times less than lobster. Accordingly, the coordination effort<br />
during non-lobster season could be reduced.<br />
R<br />
R<br />
R<br />
R<br />
R<br />
Coordination With Resource Agencies<br />
R<br />
Based on comments received on the Draft <strong>EIR</strong>/<strong>EA</strong> from the resource agencies, and the SEC<br />
recommendation to schedule project construction in Spring 2001, SANDAG has initiated Section 7<br />
consultation under the Endangered Species Act. Consultation will continue after certification of the <strong>EIR</strong><br />
and selection of an alternative, to negotiate specific details for project construction that results in “no may<br />
effect” to the California least tern and the western snowy plover, two bird species federally-listed as<br />
endangered and threatened, respectively. Possible design elements consist of scheduling sensitive receiver<br />
sites prior to, or early in, the nesting season, identifying construction processes to reduce turbidity, and<br />
instituting predator control. SANDAG is committed to continued coordination with the U.S. Fish and<br />
Wildlife Service (USFWS) to identify and institute appropriate measures to avoid significant impacts to<br />
either bird species.<br />
R<br />
R<br />
R<br />
R<br />
R<br />
R<br />
R<br />
R<br />
R<br />
R<br />
2.4.2 Alternative 2<br />
Alternative 2 would involve sand replenishment at nine receiver sites, all but one of which would be<br />
associated with Alternative 1. The same six borrow sites would provide the material for replenishment and<br />
the dredging and discharge plan would be the same, except where some receiver sites would be eliminated.<br />
The receiver sites and borrow sites are described below for Alternative 2a followed by the description of<br />
Alternative 2b.<br />
Alternative 2a<br />
Receiver Sites<br />
Alternative 2 would have eight receiver sites common to Alternative 1 and one new site (South Carlsbad<br />
South) for a total of nine. In three of the sites, the quantity and location of replenishment would be identical<br />
to Alternative 1, and they would be built to the same specifications (e.g., height, slope). Five of the sites<br />
Page 2-48<br />
<strong>Regional</strong> <strong>Beach</strong> <strong>Sand</strong> <strong>Project</strong> <strong>EIR</strong>/<strong>EA</strong><br />
99-69\SANDAG <strong>EIR</strong><strong>EA</strong> 3.4.wpd 7/17/00
2.0 Alternatives Considered<br />
would be similar in location as under Alternative 1, although the sand quantity would increase. Accordingly,<br />
the length of the footprint would increase. Below is a description of the boundaries of each receiver site.<br />
Plan views of the beach fill at applicable receiver sites were presented in the description of Alternative 1.<br />
Those graphics clearly indicate where beach fill plans would vary under each alternative. A beach fill plan<br />
is provided in this section for the South Carlsbad South receiver site that is not proposed under Alternative<br />
1.<br />
Under this alternative, beach replenishment at South Oceanside would involve onshore placement of sand<br />
from Seagate Drive to Vista Way, a distance of approximately two miles. Refer to Figure 2-3. The final<br />
configuration of this site may be shortened during the permitting process. This document evaluates the<br />
maximum footprint to disclose worst-case impacts (refer to Section 2.5).<br />
<strong>Beach</strong> replenishment at the South Carlsbad North site would consist of the placement of dredged sediment<br />
near the Palomar Airport Road intersection with Carlsbad Boulevard, stretching to the south for 2,800 feet<br />
(0.5 mile) near the Encinitas Creek outlet. Refer to Figure 2-4.<br />
The South Carlsbad South receiver site (Figure 2-23) begins just south of the South Carlsbad North<br />
receiver site and the Encinas Creek outlet. The site is approximately 1,830 feet (0.3 mile) in length. A berm<br />
would be constructed to an elevation of approximately 12 feet above MLLW. The berm would be flat<br />
with a width of approximately 170 feet. The berm would then slope seaward approximately 100 feet at<br />
a slope of 10:1.<br />
<strong>Beach</strong> replenishment at the Cardiff, Solana <strong>Beach</strong>, and Del Mar receiver sites would be identical to that<br />
proposed under Alternative 1a. They are illustrated in Figures 2-9, 2-10, and 2-11, respectively.<br />
The Torrey Pines receiver site would stretch approximately 2,470 feet (0.5 mile) and is located on Torrey<br />
Pines State <strong>Beach</strong>. The northern boundary of the fill site would be identical to Alternative 1. The footprints<br />
of both alternatives are shown in Figure 2-12.<br />
The Mission <strong>Beach</strong> receiver site would stretching from Ostend Court to Santa Barbara Place, a distance<br />
of approximately 2,380 feet (0.5 mile). Figure 2-13 illustrates both footprints.<br />
<strong>Regional</strong> <strong>Beach</strong> <strong>Sand</strong> <strong>Project</strong> <strong>EIR</strong>/<strong>EA</strong> Page 2-49<br />
99-69\SANDAG <strong>EIR</strong><strong>EA</strong> 3.4.wpd 7/17/00
X.X Section Name<br />
Page 2-50<br />
Avenida Encinas<br />
Carlsbad Blvd North<br />
TOP OF SLOPE<br />
1,830’<br />
TOE OF SLOPE<br />
<strong>Beach</strong> Fill Elevation = + 12’ MLLW<br />
<strong>Beach</strong> Width = 170’<br />
<strong>Regional</strong> <strong>Beach</strong> <strong>Sand</strong> <strong>Project</strong> <strong>EIR</strong>/<strong>EA</strong><br />
9969 <strong>Beach</strong> Replenishment\Figures\Fig 2-23 South Carlsbad S Fill 8/31/99<br />
Source: Moffatt & Nichol Engineers<br />
NORTH<br />
0<br />
750 Feet<br />
TOP OF BERM<br />
SLOPE OF BERM<br />
Figure 2-23<br />
South Carlsbad South <strong>Beach</strong> Fill Plan--Alternative 2<br />
(Site Not Proposed Under Alternative 1)
2.0 Alternatives Considered<br />
In Imperial <strong>Beach</strong>, the beach replenishment berm would be built along approximately 3,470 feet (0.7 mile)<br />
of beach, from Imperial <strong>Beach</strong> Boulevard to approximately 1,000 feet south of Encanto Avenue. This<br />
receiver site footprint would be longer than proposed under Alternative 1 (Figure 2-14).<br />
Borrow Sites<br />
Under this alternative, the borrow site locations would remain as under Alternative 1, but the sand quantity<br />
would change and the number of receiver sites would decrease. Figures 2-15 through 2-20 also illustrate<br />
the dredge location and discharge plans as they apply to this alternative. As under Alternative 1, temporary<br />
pipelines would carry replenishment material to the shoreline and then up and down the coast to the various<br />
receiver sites. Also, borrow sites SO-9 and SO-6 may be eliminated and additional material removed from<br />
SO-7 instead. Table 2-5 summarizes pertinent characteristics of the borrow sites under this alternative.<br />
R<br />
R<br />
Table 2-5<br />
Alternative 2 – Borrow Site Characteristics<br />
Borrow Sites<br />
Volume of <strong>Sand</strong> to be<br />
Dredged (in cy)<br />
Approx. Surface Area<br />
to be Dredged<br />
(in acres)<br />
Depth of Dredge<br />
(in feet)<br />
Water Depth<br />
(in feet, MLLW)<br />
SO-9 (1) 627,000 (2) 63 Max. 15 45 to 55<br />
SO-7 (3) 360,000 70 1 to 11 60 to 85<br />
SO-6 104,000 29 3 to 4 60 to 80<br />
SO-5 788,000 (2) 127 Max. 6 50 to 80<br />
MB-1 150,000 19 Max. 10 68 to 75<br />
SS-1 180,000 22 Max. 7 40 to 53<br />
(1)<br />
With dredge area modified to provide a larger buffer between previously unmapped artificial reef areas, R<br />
the dredge area would be reduced by approximately 25 percent. The borrow site may be eliminated during<br />
R<br />
final design.<br />
R<br />
(2)<br />
Volume includes overfill factor (Moffatt & Nichol 2000c).<br />
(3)<br />
Possible expansion to 1.5 million cy with total surface area of 150 acres if SO-9 and SO-6 are eliminated. R<br />
Depth of dredge would be maximum 15 feet.<br />
R<br />
Alternative 2b<br />
This alternative would be implemented at the same receiver sites and using the same borrow sites as<br />
described for Alternative 2a; however, adherence to applicable, local noise ordinances would limit the<br />
hours and number of days per week that beach replenishment could occur. The construction schedules<br />
<strong>Regional</strong> <strong>Beach</strong> <strong>Sand</strong> <strong>Project</strong> <strong>EIR</strong>/<strong>EA</strong> Page 2-51<br />
99-69\SANDAG <strong>EIR</strong><strong>EA</strong> 3.4.wpd 7/17/00
2.0 Alternatives Considered<br />
and associated sand quantities associated with variations 2a and 2b are shown in Table 2-6. The overall<br />
quantity of sand would be 1.25 million cy under Alternative 2b versus 2.04 million cy under Alternative 2a.<br />
Table 2-6<br />
Alternative 2 – Schedule and Production<br />
Borrow<br />
Site<br />
SO-9<br />
SO-7<br />
Receiver<br />
Site<br />
Alternative 2a<br />
(Assumes 7-day/24-hour work schedule)<br />
Quantity<br />
(cy)<br />
Replenishment<br />
Site<br />
Construction (1)<br />
(estimated<br />
days)<br />
Duration of<br />
Pipeline<br />
Activity (2)<br />
(estimated<br />
days)<br />
Quantity<br />
(cy)<br />
Alternative 2b<br />
(Adheres to Noise Ordinances) (3)<br />
Replenishmen<br />
t Site<br />
Construction (1)<br />
(estimated<br />
days)<br />
Duration of<br />
Pipeline<br />
Activity (2)<br />
(estimated<br />
days)<br />
Applicable<br />
Noise<br />
Ordinanc<br />
e?<br />
S. Oceanside 570,000 42<br />
285,000 63<br />
Yes<br />
N. Carlsbad 0 0<br />
42<br />
0 0<br />
63<br />
N/A<br />
S. Carlsbad N. 218,000 19<br />
218,000 19<br />
No<br />
S. Carlsbad S. 142,000 13<br />
32<br />
142,000 13<br />
32<br />
No<br />
Batiquitos 0 0<br />
0 0<br />
Leucadia 0 0 0<br />
0 0 0<br />
N/A<br />
Moonlight 0 0 0 0 N/A<br />
SO-6 Cardiff 104,000 11 11 104,000 11 11 No<br />
SO-5<br />
Solana <strong>Beach</strong> 140,000 13 13 70,000 18 18 Yes<br />
Del Mar 180,000 16<br />
90,000 24<br />
Yes<br />
Torrey Pines 360,000 28<br />
44<br />
180,000 40<br />
64<br />
Yes (4)<br />
MB-1 Mission <strong>Beach</strong> 150,000 14 14 75,000 21 21 Yes<br />
SS-1<br />
Imperial<br />
<strong>Beach</strong><br />
180,000 16 16 90,000 24 24 Yes<br />
Total 2,044,000 172 172<br />
1,254,000.0<br />
0<br />
Average Production Rate 15,000 cy/day 5,000 cy/day<br />
233 233<br />
N/A<br />
Assumptions: Noise limits would allow only one shift of production per day (instead of three) with no construction on Sundays or<br />
holidays. Production would take three times longer. Production rates are average and similar for either type of dredge equipment.<br />
(1)<br />
Includes 2 to 4 days for mobilization prior to sand placement and 2 to 4 days for demobilization post placement, depending on<br />
borrow source.<br />
(2)<br />
Maximum number of working days pipeline would be on the beach where a single borrow site serves more than one receiver site.<br />
(3)<br />
Assumes a working schedule from 7:00 a.m. to 7:00 p.m. Monday through Friday, limited working hours on Saturday, and no<br />
working hours on Sundays and holidays.<br />
(4)<br />
The Torrey Pines conveyance plan includes use of Del Mar’s beach for pipeline conveyance of sand. The use of the City of Del<br />
Mar’s beach for this purpose may necessitate conformance with the noise ordinance.<br />
Page 2-52<br />
<strong>Regional</strong> <strong>Beach</strong> <strong>Sand</strong> <strong>Project</strong> <strong>EIR</strong>/<strong>EA</strong><br />
99-69\SANDAG <strong>EIR</strong><strong>EA</strong> 3.4.wpd 7/17/00
2.0 Alternatives Considered<br />
Construction Methods/Features<br />
Under Alternative 2, the dredge operations, discharge line maintenance/maintenance, training dikes, beach<br />
building, staging areas, and scheduling would be identical in process to Alternative 1. However, there<br />
would be a difference in the need for booster pumps. At SO-9, there would likely be one onshore booster<br />
pump only to convey material to the southern extent of the footprint. Onshore booster pumps would also<br />
be required to move material to the South Carlsbad North and Torrey Pines sites. <strong>Beach</strong> closures to<br />
protect public safety would be the same in length per day under this alternative as under Alternative 1,<br />
although there would be no closure at North Carlsbad, Batiquitos, Leucadia or Moonlight <strong>Beach</strong> receiver<br />
sites (Table 2-4).<br />
2.4.3 No Action Alternative<br />
Under the No Action Alternative, no dredging or beach replenishment activities would occur, and erosion<br />
at the region’s beaches would continue without intervention. This would result in failure to achieve property<br />
protection, enhance recreational opportunities, or enhance tourism value at specific receiver sites. It would<br />
also preclude the addition of sand in the three littoral cells which could thereby indirectly enhance other<br />
beach locations. Finally, it would not provide the opportunity to monitor the post-project condition for<br />
purposes of increasing knowledge regarding the state-of-the-art modeling process. While all these failures<br />
would be specific to the proposed specific receiver sites, there is a region-wide benefit that would also<br />
remain unaddressed.<br />
To assist in effective and appropriate decision-making regarding the utilization of the coastline, the State<br />
of the Coast Report, San Diego Region (USACOE 1991) evaluated the natural and man-made coastal<br />
processes. This document stated that during the next 50 years, the San Diego region “is on a collision<br />
course. With sandy beaches backed by sea cliffs, beach erosion and failure of the sea cliffs must be<br />
anticipated. Extensive damage and loss of property will occur.” While the amount of erosion is dependent<br />
upon sea level change, as well as the wave climate, particularly severe storm events, the report concludes<br />
that...<br />
all the beaches of the San Diego region are threatened with erosion. The apparent stability<br />
of the beaches is belied by rigorous examination of the historical beach profiles and<br />
summation of previous beach nourishment. Without the earlier massive input of beachfill,<br />
the shoreline of the San Diego Region would exhibit nearly continuous erosion from Dana<br />
<strong>Regional</strong> <strong>Beach</strong> <strong>Sand</strong> <strong>Project</strong> <strong>EIR</strong>/<strong>EA</strong> Page 2-53<br />
99-69\SANDAG <strong>EIR</strong><strong>EA</strong> 3.4.wpd 7/17/00
2.0 Alternatives Considered<br />
Point to the international border. New sources of beach-quality sand need to be readied<br />
for beach nourishment following severe storm events and for long-term protection from<br />
rising sea level (page 9-27).<br />
To assist in understanding the potential economic outcomes of various shoreline management techniques,<br />
an analysis was provided in Appendix I of the Shoreline Preservation Strategy for the San Diego<br />
Region (SANDAG 1993). That document quantified the economic costs and benefits of three basic<br />
shoreline management alternatives in terms of loss to property and loss of recreational opportunities. These<br />
included: 1) Do Nothing, 2) Armor the coast to protect property, using sea walls and revetments, and 3)<br />
<strong>Beach</strong> Replenishment. Under the Do Nothing Alternative, which corresponds in part to the No Action<br />
Alternative, there would be “significant costs to the region in lost property and recreational benefits due to<br />
shoreline retreat.” Annual costs (losses) were estimated for the total San Diego region as $52 million by<br />
2010 and over $226 million by 2040.<br />
The No Action Alternative would have specific ramifications to the potential receiver sites, and some<br />
indirect relationships to the littoral cells, but would also not satisfy the regional goals of beach replenishment<br />
promulgated by the SEC and USACOE.<br />
2.5 MONITORING AND MITIGATION FRAMEWORK<br />
Although sand replenishment has occurred along the San Diego region coastline for well over 50 years<br />
(USACOE 1991), the effects of sand transport have not been effectively monitored to date. While there<br />
are coastal engineering models to predict sand transport from beach replenishment, there is little local data<br />
available to verify how the actual conditions compare to the predicted.<br />
As part of the permits issued to the Navy for their beach replenishment project, a Coastal Monitoring Plan<br />
was approved by the U.S. <strong>Army</strong> Corps of Engineers in 1997. That plan described a monitoring program<br />
to be implemented subsequent to sand placement and for a four-year period following the action. The<br />
intent of the monitoring was to verify that there were no long-term, significant impacts to sensitive biological<br />
resources. If impacts were identified, then mitigation would be required. The data from monitoring would<br />
also be useful in understanding how actual sand transport compared to the predicted path.<br />
While sand placement was halted prior to completion, the required monitoring continued by the Navy as<br />
required by the permit until 2001. Since the projects are substantially the same, except with respect to sand<br />
Page 2-54<br />
<strong>Regional</strong> <strong>Beach</strong> <strong>Sand</strong> <strong>Project</strong> <strong>EIR</strong>/<strong>EA</strong><br />
99-69\SANDAG <strong>EIR</strong><strong>EA</strong> 3.4.wpd 7/17/00
2.0 Alternatives Considered<br />
source and reduced sand volume, a similar monitoring program would be implemented for the <strong>Regional</strong><br />
<strong>Beach</strong> <strong>Sand</strong> <strong>Project</strong>. A mitigation commitment would also be necessary in case long-term, significant<br />
impacts are identified during monitoring. This section describes the framework for monitoring and<br />
mitigation for the <strong>Regional</strong> <strong>Beach</strong> <strong>Sand</strong> <strong>Project</strong>. The final details are most appropriately determined upon<br />
selection of an alternative and negotiation of permit conditions with the resource agencies. Items such as<br />
exact monitoring locations would depend on the alternative to be implemented.<br />
Monitoring can be considered in terms of “during construction” and “post-construction.” Monitoring during<br />
construction would be required to verify that specified site-specific, resources are not adversely impacted<br />
(e.g., grunion). Post-construction monitoring will be required to understand the long-term ramifications of<br />
project implementation, which is especially pertinent because of the highly dynamic ocean system.<br />
2.5.1 Monitoring During Construction<br />
The three issues likely to require construction monitoring are turbidity, grunion, and underwater cultural<br />
resources. In this phase, monitoring is used to identify problems and solutions in the immediate time frame,<br />
mitigation would not be necessary once adjustments are made to correct the problem. Additionally,<br />
SANDAG is committed to coordinating with commercial fishermen to avoid gear loss in the transit and<br />
dredge areas. As described in Section 2.4.1, an observer would be aboard the dredge to document any<br />
fishing gear in these areas and determine compensation responsibility if gear is lost. Other specifics of the<br />
noticing procedure prior to and during construction are in that section.<br />
R<br />
R<br />
R<br />
R<br />
R<br />
Turbidity<br />
Construction monitoring of water quality (i.e., potential turbidity impacts) will occur as directed by the<br />
RWQCB 401 Certification of Waste Discharge Requirements and to support the predicted impact of<br />
localized turbidity influence. The 401 permit will likely establish parameters for water quality at specified<br />
distances from activity at the receiver sites and the borrow sites, and it will be necessary to perform<br />
verification that water quality is within those parameters. The 401 Certification requirement will establish<br />
the frequency and duration of monitoring.<br />
R<br />
R<br />
<strong>Regional</strong> <strong>Beach</strong> <strong>Sand</strong> <strong>Project</strong> <strong>EIR</strong>/<strong>EA</strong> Page 2-55<br />
99-69\SANDAG <strong>EIR</strong><strong>EA</strong> 3.4.wpd 7/17/00
2.0 Alternatives Considered<br />
Spawning Grunion<br />
Replenishment of beaches could potentially bury grunion eggs or change the beach profile such that juvenile<br />
grunion are unable to return to the ocean. Monitoring would occur during discharge operations at those<br />
receiver sites with suitable grunion habitat. Monitoring by a qualified biologist would only occur during the<br />
spawning season (March through August) and during the dates specified by the CDFG in their annual<br />
pamphlet Expected Grunion Runs. If grunion were observed spawning, disposal of sand would cease<br />
in the vicinity and a buffer zone established. The buffer zone would extend 65 feet shoreward of the high<br />
water mark at the spawning area and 100 feet upcoast and downcoast (total 200 feet). A sand dike would<br />
be constructed to ensure that discharge water would not enter the spawning area. A schematic drawing<br />
of any diked buffer area would be submitted to the resource and regulatory agencies. The buffer zone<br />
would be in place a minimum of 14 days to allow the eggs to hatch, and surveys show no subsequent<br />
spawning has occurred in the same area.<br />
R<br />
R<br />
R<br />
R<br />
R<br />
R<br />
R<br />
Underwater Cultural Resources<br />
Underwater cultural resources consist of potential archaeological resources and historic elements remaining<br />
at ancient river bed locations. The dredge areas at each borrow site have varying potential to effect such<br />
resources. Although the dredge areas have been designed, to the maximum extent possible, to avoid<br />
locations of high probability for underwater archaeological resources there is the potential for such<br />
resources to be uncovered during dredging. Design considerations to avoid high probability areas are<br />
constrained by ocean outfalls, artificial reefs, and kelp beds as well as the location of beach quality sand.<br />
Identified side scan sonar targets in SO-9 and MB-1 would be investigated by diver or remotely operated<br />
vehicle (ROV) prior to dredge to determine what they are. Interpretation of sonar targets is difficult and<br />
targets within the dredge area may be gravel, sand dollar beds or historic features. If the targets are historic<br />
features, then a buffer would be established around the target and the resource would be recorded at the<br />
appropriate clearinghouse. Interpretation of targets will be also be appropriate to avoid any features that<br />
may hinder or damage the dredge machine. Finally, complete side scan sonar will be obtained and<br />
interpreted at SO-9 and SS-1 prior to dredge activity to verify no historic targets and to ensure no<br />
damaging features for the dredge.<br />
To avoid significant archaeology impacts, monitoring will be required as material is dredged from each<br />
borrow site. A qualified marine archeologist would be present while material is being placed on receiver<br />
Page 2-56<br />
<strong>Regional</strong> <strong>Beach</strong> <strong>Sand</strong> <strong>Project</strong> <strong>EIR</strong>/<strong>EA</strong><br />
99-69\SANDAG <strong>EIR</strong><strong>EA</strong> 3.4.wpd 7/17/00
2.0 Alternatives Considered<br />
sites to observe the discharged material. Appropriate communication equipment (two-way radios or<br />
cellular telephones) would allow for communication with dredge personnel. Daily ship logs shall also be<br />
maintained regarding the dredge position, time and sediment depth of dredge activities. If the monitor<br />
observes cultural material suggesting that dredging has entered an archaeological site, then the dredging<br />
operation would be permanently relocated away from that site and a 250-foot-wide buffer would be<br />
established around the site. The location of the site would be recorded for the appropriate clearinghouse.<br />
The monitoring program would be guided by the probability for occurrence of archaeological resources.<br />
Where there is a high probability of occurrence, the monitor would be present during dredging of the<br />
borrow sites (cutterhead dredge) or when material is being pumped to the receiver site (hopper dredge),<br />
on a daily basis. This applies to SO-9 at depths below nine feet, SO-6, MB-1 at depths below 12 feet<br />
and SS-1. Where the probability is moderate, the monitor would be present as above on alternate days.<br />
This applies to SO-9 at depths higher than 9 feet, SO-7, SO-5, and MB-1 at depths greater than 12 feet.<br />
2.5.2 Post-Construction Monitoring<br />
There will be monitoring, and may be mitigation, for potential indirect impacts to sensitive marine resources<br />
due to sedimentation and indirect impacts to lagoons from increased sand inflow. Each is discussed<br />
individually below.<br />
Potential Sedimentation Impacts to Marine Resources<br />
Sensitive marine resources are defined consistent with the Navy’s documentation (1997a, 1997b) as rocky<br />
intertidal reefs; subtidal vegetated reefs including feather boa kelp, surfgrass, sea fans, and sea palm; and<br />
nearshore kelp. These resources exist in an environment of constantly moving sediment. The fluctuation<br />
is daily and seasonal. Most have adapted to periodic exposure to sand, while some experience total<br />
covering. Seasonal fluctuation of up to three feet has been documented (Appendix D). Therefore, the most<br />
difficult challenge in designing a sediment monitoring program is distinguishing project-related sediment from<br />
natural seasonal sand flux. Toward that end, the monitoring program includes pre-discharge baseline<br />
studies and post-discharge monitoring as well as monitoring of control sites that are not influenced by the<br />
project, but are comparable in terms of other ocean influences. The existing data collected by Navy will<br />
serve as one component of the pre-discharge baseline data and as a guide for the monitoring program<br />
overall. All monitoring data from the on-going Navy monitoring are publicly available as would be the<br />
results of the proposed monitoring program.<br />
<strong>Regional</strong> <strong>Beach</strong> <strong>Sand</strong> <strong>Project</strong> <strong>EIR</strong>/<strong>EA</strong> Page 2-57<br />
99-69\SANDAG <strong>EIR</strong><strong>EA</strong> 3.4.wpd 7/17/00
2.0 Alternatives Considered<br />
The Navy plan involves various test and control sites for the three habitat types. For rocky intertidal<br />
monitoring there is one test site (Cardiff) and two control sites (Scripps/La Jolla and off Point Loma). For<br />
subtidal reefs there are two monitoring sites (North Carlsbad and Encinitas) and one control site (Cardiff).<br />
For kelp monitoring there are four test sites (Imperial <strong>Beach</strong>, North Carlsbad, Leucadia, and Solana<br />
<strong>Beach</strong>/Cardiff) and two control sites (Swami’s Reef and Point Loma kelp beds). The intent of the<br />
monitoring program is two-fold: (1) to verify that after project implementation there would be no long-term,<br />
significant impacts to sensitive biological resources from sediment transport, and (2) to gain a better<br />
understanding of the regional on-shore and off-shore seasonal movement of sand over time and under<br />
various weather conditions. The RBSP monitoring program will continue as many of the existing Navy sites<br />
as practicable while meeting the two purposes.<br />
While the exact monitoring locations will be finalized in concert with the resource and regulatory agencies,<br />
tentative locations include Point Loma (control) and Cardiff (test) for rocky intertidal habitat; Cardiff, North<br />
Carlsbad and Leucadia (test) and one new site north of Table Tops or Swami’s (control) for subtidal<br />
habitat; and a new location off North Carlsbad, Solana <strong>Beach</strong>/Cardiff, Batiquitos, Moonlight<br />
<strong>Beach</strong>/Boneyards (test) and Point Loma, possibly Swami’s (control) for kelp habitat. A new perpendicular<br />
transect would be added at the North Carlsbad site to monitor surfgrass to verify no project-specific<br />
impacts. Current baseline data is available for existing Navy monitoring sites, but where new test and<br />
control sites would be selected, baseline monitoring would be completed prior to project initiation. Possible<br />
new sites include the perpendicular transect at North Carlsbad for subtidal habitat, the selected control site<br />
for subtidal habitat (surfgrass), and Batiquitos, Moonlight <strong>Beach</strong>/Boneyards and North Carlsbad sites for<br />
kelp habitat.<br />
The monitoring program for rocky intertidal habitat would involve periodic checks of fixed plots and fixed<br />
transects to observe identified target species of vegetation, barnacles, and sea stars. Species abundance<br />
would be estimated based on counts and measurements within those fixed sample locations. Timed<br />
searches and reconnaissance surveys would also be conducted, including video-recording. Surveys would<br />
occur twice a year (spring and fall) for four years. Sample reports would be provided after each survey<br />
and a yearly report would be required after each full year of monitoring. A final report would be prepared<br />
at the completion of the four-year monitoring effort.<br />
The subtidal monitoring would involve establishment of fixed transects inside a fixed quadrant within which<br />
the substrate would be characterized in terms of percentage of sand, rock, rock type, vertical relief and<br />
depth of sand cover. Within that quadrant, the biologist would census abundance of key indicator species.<br />
Habitat type and species abundance along each transect would be mapped and digitized into a GIS<br />
R<br />
R<br />
R<br />
R<br />
R<br />
R<br />
R<br />
R<br />
R<br />
R<br />
R<br />
R<br />
R<br />
R<br />
R<br />
R<br />
R<br />
R<br />
R<br />
R<br />
Page 2-58<br />
<strong>Regional</strong> <strong>Beach</strong> <strong>Sand</strong> <strong>Project</strong> <strong>EIR</strong>/<strong>EA</strong><br />
99-69\SANDAG <strong>EIR</strong><strong>EA</strong> 3.4.wpd 7/17/00
2.0 Alternatives Considered<br />
database. Persistence or change in habitat over time would be documented. Sediment markers would be<br />
established and monitored as well. It will be important in the monitoring plan to design a standard method<br />
for accurately recording changes in sand depth. Surveys would occur twice annually in spring and fall.<br />
Annual reports would be provided, as well as a final report at the end of four years.<br />
Kelp monitoring would be performed using divers at the study reefs to sample the kelp and reef biota within<br />
established areas. Transects would be established and substrate mapped to characterize the percentage<br />
of sand, rock, rock type, vertical relief and depth of sand cover. Key indicator species (plants and<br />
invertebrates) would be inventoried for type and abundance. Photographs and video would be used for<br />
recordation. Sediment markers and buoys would be established. For the first two years, monitoring would<br />
occur periodically and thereafter annually. Sampling reports would be required as surveyed, annual reports<br />
every year, and then a final report at the conclusion of monitoring (after four years).<br />
R<br />
Potential Impacts to Lagoons<br />
R<br />
The Navy committed to a four-year lagoon monitoring program at Agua Hedionda Lagoon, Batiquitos<br />
Lagoon, San Elijo Lagoon, San Dieguito Lagoon, and Los Peñasquitos Lagoon to evaluate lagoon mouth<br />
closures and/or increased sand accumulation rates. SANDAG is currently participating in an annual lagoon<br />
monitoring program as part of that program which has been ongoing since 1996. Under this program,<br />
beach profile data has been measured in spring and fall at 32 transects perpendicular to the coast. The<br />
transects were originally established by the USACOE so there is historic data from the early 1980s<br />
available. The five lagoon mouth entrances are also surveyed in the spring and fall seasons by aerial<br />
overflight. Measurement of two cross-channel transects plus bathymetric soundings are provided at Agua<br />
Hedionda and Batiquitos lagoons, which are jetty-stabilized.<br />
R<br />
R<br />
R<br />
R<br />
R<br />
R<br />
R<br />
All of these lagoons have been heavily modified and are subject to human intervention in terms of periodic<br />
maintenance dredging and mouth openings. Table 2-7 outlines the current permitted levels of dredging at<br />
each lagoon and the party responsible for dredging activities.<br />
R<br />
The intent of lagoon monitoring would be to determine to what extent sand deposition and lagoon mouth<br />
closures are related to the <strong>Regional</strong> <strong>Beach</strong> <strong>Sand</strong> <strong>Project</strong> versus other sand sources and coastal processes.<br />
The determination would be made by the USACOE in consultation with the resource agencies. <strong>Project</strong><br />
monitoring would rely on a comparison of surveyed beach transects which bracket each lagoon mouth<br />
between current year changes and historical data, comparison of triangulated irregular network (TIN) maps<br />
and transects to recent lagoon monitoring, aerial overflights, as well as an evaluation of non-project inputs<br />
R<br />
<strong>Regional</strong> <strong>Beach</strong> <strong>Sand</strong> <strong>Project</strong> <strong>EIR</strong>/<strong>EA</strong> Page 2-59<br />
99-69\SANDAG <strong>EIR</strong><strong>EA</strong> 3.4.wpd 7/17/00
2.0 Alternatives Considered<br />
Table 2-7<br />
Lagoon Maintenance<br />
Lagoon<br />
Party Responsible for Dredging<br />
Approximate Amount of<br />
Material Dredged Annually (cy)<br />
Buena Vista CDFG 0<br />
Agua Hedionda Cabrillo Power I 200,000<br />
Batiquitos CDFG 50,000 to 75,000<br />
San Elijo<br />
San Dieguito<br />
Department of Parks and Recreation, County Department<br />
of Vector Control, San Elijo Lagoon Conservancy (1) 50,000 to 60,000<br />
City of Del Mar, 22 nd District Agricultural Association (1) ,<br />
San Dieguito River Valley Open Space Park, Southern<br />
California Edison (2) 5,000<br />
Los Peñasquitos City of San Diego (3) 2,000 to 10,000<br />
Tijuana Estuary<br />
City and County of San Diego, U.S. Navy, USFWS,<br />
Department of Parks and Recreation<br />
18,000 (4)<br />
(1)<br />
Although these entities have carried out lagoon mouth openings in the past, there is no legal requirement for<br />
them to do so.<br />
(2)<br />
Southern California Edison (SCE) is required to maintain the river mouth in an open condition after future<br />
lagoon restoration to mitigate for San Onofre Power Plant impacts on fisheries.<br />
(3)<br />
The City of San Diego is required to fund lagoon maintenance activities to mitigate for impacts from the<br />
ongoing construction of the State Highway 56/I-5 interchange. The City contracts this work to the Department<br />
of Parks and Recreation and Los Peñasquitos Lagoon Foundation.<br />
(4)<br />
Completed restoration of tidal influence to tide pools.<br />
Source: SANDAG 1999<br />
(i.e., other beach replenishment projects including maintenance dredging) versus project inputs to determine<br />
how much of the material in the lagoon, if any, is project-related. This monitoring effort would also occur<br />
for four years subsequent to the action. It would rely in part on data from the ongoing SANDAG<br />
monitoring plus additional data collection. If the monitoring effort is unable to determine, to the satisfaction<br />
of the resource agencies, the project impact at a specific lagoon, then quantities up to the potential, worstcase<br />
sedimentation derived in Appendix C may be utilized.<br />
R<br />
R<br />
R<br />
R<br />
2.5.3 Post-<strong>Project</strong> Mitigation (If Necessary)<br />
Potential Sedimentation Impacts to Marine Resources<br />
If monitoring documents a significant, long-term adverse impact to sensitive marine resources resulting from<br />
discharge activities based on resource agency/SANDAG consultation and review of the monitoring reports<br />
(twice yearly and project completion), then restoration of like habitat at a 1:1 ratio would be proposed as<br />
R<br />
R<br />
Page 2-60<br />
<strong>Regional</strong> <strong>Beach</strong> <strong>Sand</strong> <strong>Project</strong> <strong>EIR</strong>/<strong>EA</strong><br />
99-69\SANDAG <strong>EIR</strong><strong>EA</strong> 3.4.wpd 7/17/00
2.0 Alternatives Considered<br />
a first priority. Consideration would be given to the construction of artificial reefs as mitigation to offset<br />
project impacts at a 1:1 ratio if like habitat restoration efforts were not feasible as determined by the<br />
USACOE, in consultation with the resource agencies. Like the Navy, SANDAG would negotiate a “notto-exceed”<br />
cap on mitigation costs as a key part of the permit conditions related to mitigation. The<br />
potential worst-case acreage for 1:1 enhancement/replacement is similar in size to the prior Navy project<br />
and a similar mitigation fund ($1.1 million) would likely be negotiated.<br />
R<br />
R<br />
R<br />
Potential Impacts to Lagoons<br />
If the lagoons experience sand input above typical conditions, which are related to the <strong>Regional</strong> <strong>Beach</strong><br />
<strong>Sand</strong> <strong>Project</strong>, funding would be provided to allow for sediment removal or an additional mouth opening<br />
in concert with other on-going maintenance efforts at each lagoon. This determination would be made in<br />
consultation with SANDAG/resource agencies based on review of the monitoring reports (twice yearly and<br />
project completion). Funding will be identified for potential mitigation and a not-to-exceed cap will be<br />
negotiated as a key part of permit conditions.<br />
R<br />
2.5.4 Summary of <strong>Project</strong> Elements to Avoid Significant Impacts/ R<br />
Possible Mitigation Measures<br />
R<br />
Section 2.4.1 identifies numerous project design features and conditions that will be placed on the<br />
contractor to avoid significant impacts. Section 2.5 contains a monitoring framework, based on the Navy’s<br />
approved monitoring program for a larger beach replenishment project, for monitoring and mitigation, if<br />
necessary. The design features, monitoring component and fully funded mitigation commitments are<br />
considered in the determination of impact significance in Chapter 4. Table 2-8 provides a summary table<br />
of these features and commitments, identifying the purpose, timing, and entity responsible for<br />
implementation.<br />
2.6 ALTERNATIVES COMPARISON<br />
The intent of NEPA and CEQA is to ensure that the information about the scope of a project and the<br />
potential action environmental effects are made available to public officials and citizens before decisions are<br />
made and actions undertaken. Accordingly, this <strong>EIR</strong>/<strong>EA</strong> evaluates two potential alternatives for<br />
implementation of the <strong>Regional</strong> <strong>Beach</strong> <strong>Sand</strong> <strong>Project</strong> and the No Action Alternative. CEQA requires an<br />
<strong>EIR</strong> to include sufficient information about each alternative to allow meaningful evaluation, analysis and<br />
comparison.<br />
R<br />
R<br />
R<br />
R<br />
R<br />
R<br />
R<br />
R<br />
R<br />
R<br />
R<br />
R<br />
<strong>Regional</strong> <strong>Beach</strong> <strong>Sand</strong> <strong>Project</strong> <strong>EIR</strong>/<strong>EA</strong> Page 2-61<br />
99-69\SANDAG <strong>EIR</strong><strong>EA</strong> 3.4.wpd 7/17/00
2.0 Alternatives Considered<br />
Table 2-8<br />
Summary of Design Features/Monitoring Commitments<br />
and Mitigation Measures (If Necessary)<br />
R<br />
R<br />
R<br />
Design Features<br />
Purpose Timing Implementation Responsibility<br />
Construct longitudinal dikes at all receiver sites Reduce nearshore turbidity During beach-building Construction contractor<br />
Maintain project web site with current construction<br />
schedule<br />
Issue Notice to Mariners and maintain 500-foot<br />
buffer around active dredge equipment<br />
Restrict public access at receiver sites and maintain<br />
100-foot buffer around construction areas<br />
Timely public notification<br />
Warn boaters/fishermen of dredging<br />
activities to ensure avoidance<br />
At present and continuing through<br />
construction<br />
Before and during dredging activities<br />
SANDAG<br />
Coast Guard (via construction<br />
contractor)<br />
Public safety during construction During beach-building activities Construction contractor, in<br />
coordination with local lifeguards<br />
Relocation of temporary lifeguard towers Public safety during construction During beach-building activities Construction contractor, in<br />
coordination with local lifeguards<br />
<strong>Sand</strong> placement to avoid blocking line-of-sight at<br />
permanent lifeguard towers<br />
Contain fill material during sand placement near<br />
storm drain outlets<br />
Generate plan for hazardous spill containment<br />
Coordination with commercial fishermen;<br />
establishment of offshore transit corridors in<br />
consultation with a commercial fishermen<br />
representative; issue Notice to Mariners; incorporate<br />
notices into SANDAG website<br />
Condition contractor to avoid traversing CDFG<br />
artificial reef areas near SO-9, SO-7, and MB-1 by<br />
hopper dredge or discharge pipeline<br />
Condition contractor to make landfall with discharge<br />
pipeline, or place mono buoy, north of Seacoast<br />
Boulevard in Imperial <strong>Beach</strong>.<br />
Design borrow sites to maintain adequate distance<br />
from artificial reefs, kelp, and other features<br />
SO-9: 350-foot buffer from experimental artificial<br />
reefs to the west and north<br />
SO-7: 350-foot buffer to CDFG artificial reefs to<br />
the east and 500 feet from kelp to southeast<br />
SO-5: at least 3,000 feet from kelp to northeast<br />
MB-1: dives sites at least 1,000 feet to the south<br />
SS-1: kelp at least 3,000 feet to the north<br />
Public safety during construction During beach-building activities Construction contractor, in<br />
coordination with local lifeguards<br />
Continue proper drainage During beach-building activities Construction contractor, in<br />
coordination with City Engineer<br />
Ensure minimal contamination from<br />
fuel leak, if any<br />
Avoid gear conflicts and provide for<br />
compensation if loss occurs<br />
Avoid direct impacts to artificial<br />
reefs<br />
Avoid direct impacts to Tijuana<br />
Slough National Wildlife Refuge<br />
Avoid direct impacts to artificial<br />
reefs and kelp<br />
During beach building<br />
Before and during dredging operations<br />
Final engineering<br />
Final engineering<br />
Final engineering and during<br />
construction<br />
Construction contractor<br />
Coast Guard (via construction<br />
contractor) and SANDAG<br />
Construction contractor<br />
Construction contractor<br />
Engineering contractor and<br />
construction contractor<br />
Page 2-62<br />
<strong>Regional</strong> <strong>Beach</strong> <strong>Sand</strong> <strong>Project</strong> <strong>EIR</strong>/<strong>EA</strong><br />
99-69\SANDAG <strong>EIR</strong><strong>EA</strong> 3.4.wpd 7/17/00
2.0 Alternatives Considered<br />
Table 2-8. Continued<br />
Monitoring Commitments<br />
Perform baseline surveys of selected test and control<br />
sites if not in current Navy program<br />
Semi-annual monitoring of rocky intertidal, subtidal,<br />
and kelp habitat; includes surfgrass in subtidal<br />
Monitor for grunion spawning in construction area,<br />
establish buffer extending 65 feet shoreward of high<br />
tide line and 100 feet upcoast and downcoast (total<br />
200 feet), until eggs hatch (14 days) and surveys<br />
show no subsequent spawning<br />
Monitor for possible underwater archaeology<br />
resources. If resources found, establish a 250-foot<br />
buffer around receiver site and record with<br />
appropriate clearinghouse. Monitoring to occur<br />
daily at SO-9 below 9 feet, SO-6, MB-1 below 12<br />
feet and SS-1. Monitor on alternate days at SO-9<br />
above 9 feet, SO-7, SO-5, and MB-1 above 12 feet<br />
Monitor for possible historic resources. At SO-9 and<br />
SS-1 complete side-scan sonar to verify no historic<br />
targets. At SO-9 and MB-1 use diver or ROV to<br />
verify targets are not historic resources. If resources<br />
found, establish a 250-foot buffer and record with<br />
appropriate clearinghouse<br />
Water quality monitoring per RWQCB 401<br />
Certification, if outside parameters then halt<br />
dredging<br />
Lagoon monitoring via transects, TIN maps, aerial<br />
overflights, and research on other sand inputs<br />
Post-<strong>Project</strong> Mitigation Measures (If Necessary)<br />
Restoration or creation of like habitat at 1:1 ratio<br />
for long-term significant impacts to marine<br />
resources<br />
Funding to be provided to current lagoon<br />
management entity to pay for dredging or mouth<br />
opening<br />
Establish baseline data for<br />
comparison purposes<br />
Purpose Timing Implementation<br />
Verify no long-term adverse impacts<br />
to sensitive habitats due to sediment<br />
transport<br />
Avoid grunion eggs and protect until<br />
hatched<br />
Identify any significant<br />
archaeological resources (if present)<br />
to map and avoid<br />
Identify any significant historic<br />
resources (if present) to map and<br />
avoid<br />
Verify localized turbidity influence<br />
and permit compliance<br />
Determine project-related sediment<br />
in lagoons or lagoon mouth closures<br />
Mitigate for significant, long-term<br />
impacts to sensitive marine resources<br />
caused by sediment transport<br />
Remove project-related sediment or<br />
open lagoon mouth<br />
Prior to construction<br />
Twice annually for four years, with<br />
annual reports and one final report<br />
March through August and per CDFG<br />
annual pamphlet Expected Grunion<br />
Runs.<br />
During project construction<br />
During project construction<br />
During beach building as per RWQCB<br />
401 Certification<br />
Twice annually for four years, with<br />
annual reports and one final report<br />
Subsequent to resource agency review<br />
of monitoring reports and<br />
determination that significant impact<br />
had occurred<br />
Subsequent to resource agency review<br />
of monitoring reports and<br />
determination that significant impact<br />
had occurred<br />
Qualified biological consultant<br />
retained by SANDAG<br />
Qualified biological consultant<br />
retained by SANDAG<br />
Qualified biological consultant<br />
retained by SANDAG<br />
Qualified cultural resource consultant<br />
retained by SANDAG<br />
Qualified cultural resource consultant<br />
retained by SANDAG<br />
Qualified biological consultant<br />
retained by SANDAG<br />
Qualified hydrologic consultant<br />
retained by SANDAG<br />
Qualified biological consultant<br />
retained by SANDAG<br />
SANDAG<br />
<strong>Regional</strong> <strong>Beach</strong> <strong>Sand</strong> <strong>Project</strong> <strong>EIR</strong>/<strong>EA</strong> Page 2-63<br />
99-69\SANDAG <strong>EIR</strong><strong>EA</strong> 3.4.wpd 7/17/00
2.0 Alternatives Considered<br />
A comparison of the two action alternatives reveals no issue areas where one alternative would have a<br />
significant impact that another alternative would lessen or avoid. In fact, given project design features and<br />
the monitoring and implementation commitments described in Sections 2.4 and 2.5, neither action<br />
alternative would result in significant impacts. There would be only minor differences in terms of potentially<br />
adverse impacts. For the issue areas of geology and soils, coastal wetlands, water resources, land and<br />
water use, aesthetics, socioeconomics, structures and utilities, traffic, air quality and noise the relative<br />
difference would be very minor. For the issue areas of biological resources, cultural resources and public<br />
health and safety there would be incrementally variable impacts.<br />
For the issue area of biology, the incremental difference would be related to indirect sedimentation impacts.<br />
Under Alternative 1, model-predicted, worst-case potential impacts would occur with partial sedimentation<br />
on up to 3.2 acres of reef near three receiver sites, which support giant kelp, 0.3 acre at one reef which<br />
has feather boa, and 0.24 acre at a single reef which has some surfgrass. Long-term impacts would not be<br />
significant because surfgrass leaves would extend well above the predicted sediment layer and allow for<br />
recovery, and the kelp areas are either sparse, subject only to short-term sediment coverage, and/or not<br />
within the historic areas of kelp persistence. Given Alternative 2, which has a different distribution of<br />
receiver sites, worst-case potential impacts due to sedimentation may occur on less than 1.78 acres of reef,<br />
at two locations, which support some giant kelp and less than 0.24 acre of reef with surfgrass. These<br />
impacts would also not be significant. Values for Alternative 2 are based, in part, on conservative, and<br />
probably unlikely, sediment deposition near North Carlsbad from sand placed at the South Oceanside site.<br />
The impact evaluation is based on prior analyses (Department of Navy 1997a) and interpretation of model<br />
predictions for a configuration with greater combined sand volume at Oceanside and North Carlsbad. In<br />
order to disclose potential worst-case impacts, the most conservative interpretation is provided and impacts<br />
are likely overstated. While the relative difference in worst-case impacts is over 1.5 acres, and probably<br />
slight more; since both estimates are based on predictions of an inherently dynamic system (with variable<br />
weather and wave conditions) the level of uncertainty would suggest these different values may not be great<br />
enough to discriminate between the two alternatives.<br />
For the issues of cultural resources and public health and safety the relative difference is also minor, but<br />
appropriate for disclosure. Under both alternatives borrow site dredging has the potential to disturb areas<br />
of moderate to high probability for archaeological resources. Under Alternative 2, the depth of dredging<br />
would be greater by one to three feet at borrow sites SS-1 and MB-1, respectively. Therefore, there<br />
would be a slightly greater opportunity for intrusion into areas that may contain underwater archaeological<br />
resources under Alternative 2. Given the monitoring program to be implemented as described in Section<br />
2.5, the significance conclusion would be identical for both alternatives. For the issue of public health and<br />
Page 2-64<br />
<strong>Regional</strong> <strong>Beach</strong> <strong>Sand</strong> <strong>Project</strong> <strong>EIR</strong>/<strong>EA</strong><br />
99-69\SANDAG <strong>EIR</strong><strong>EA</strong> 3.4.wpd 7/17/00
2.0 Alternatives Considered<br />
safety, both alternatives would result in placement of sand at the base of eroded bluffs, thereby providing<br />
a temporary buffer between wave action and these elements, but only under Alternative 1 would sand be<br />
placed along bluffs in Encinitas that have recently experienced failure. Under either alternative, sand<br />
placement would be a temporary feature and this project alone would not prevent future bluff failures.<br />
Based on the above analysis, there may be less indirect sedimentation impacts with Alternative 2 (although<br />
likely not enough to effectively discriminate), there may be greater potential for impacts to underwater<br />
archaeology resources under Alternative 2, and a greater potential for the (temporary) protection of fragile<br />
bluffs in Encinitas under Alternative 1.<br />
Another method of comparing the two action alternatives is their effectiveness at satisfying the project<br />
purpose and need. Following the guidance provided in the Guidelines for the Implementation of CEQA<br />
(Cal. Code Regs. Title 14 § 15126.6(D)) Table 2-9 has been developed to compare the alternatives in this<br />
function. (The No Action Alternative fails to meet the purpose and need and is not analyzed.) As shown,<br />
both alternatives would replenish beaches in accordance with Shoreline Preservation Strategy; however,<br />
Alternative 1 would replenish more receiver sites, create more total beach area (post-construction), and<br />
provide a buffer between wave action and structures at a greater number of locations adjacent to bluffs,<br />
including those along Encinitas.<br />
CEQA requires disclosure of the environmentally superior alternative, and if the No <strong>Project</strong> alternative is<br />
environmentally superior it requires identification of a superior alternative among the other alternatives<br />
(§15126.6(e)(2)). As described above, neither Alternative 1 nor Alternative 2 would result in long-term<br />
significant impacts to any issue area. For the issue areas of biological, cultural resources and public health<br />
and safety there would be incrementally variable impacts and Alternative 1 would have slightly less impact<br />
for two of the three topics. Also, Alternative 1 would better meet the purpose and need of the project<br />
(Table 2-9). Therefore, Alternative 1 would be considered environmentally superior under CEQA.<br />
R<br />
R<br />
R<br />
R<br />
R<br />
R<br />
R<br />
2.7 PERMITS REQUIRED<br />
Various approvals and permits would be necessary for implementation of the proposed action. The project<br />
as a whole would need federal and state permits and then individual receiver sites within the seven<br />
jurisdictions would need appropriate local approvals. Table 2-10 lists the permits and approvals required<br />
for each site, excluding the permits to be issued by individual jurisdictions that vary by receiver site. The<br />
<strong>Regional</strong> <strong>Beach</strong> <strong>Sand</strong> <strong>Project</strong> <strong>EIR</strong>/<strong>EA</strong> Page 2-65<br />
99-69\SANDAG <strong>EIR</strong><strong>EA</strong> 3.4.wpd 7/17/00
2.0 Alternatives Considered<br />
Table 2-9<br />
Effectiveness of Alternatives at Satisfying the Purpose and Need<br />
<strong>Project</strong> Purpose<br />
and Need Alternative 1 Alternative 2<br />
Replenish Eroded<br />
<strong>Beach</strong>es in Accordance<br />
with SANDAG’s 1993<br />
Shoreline Preservation<br />
Strategy for the San<br />
Diego Region<br />
Replenish Littoral Cells<br />
and Receiver Sites<br />
Enhance Recreational<br />
Opportunities and<br />
Access<br />
Enhance Tourism<br />
Potential<br />
Protect Property and<br />
Infrastructure<br />
Alternative Which Best<br />
Meets Purpose and Need<br />
Satisfies Need Satisfies Need Both alternatives meet<br />
need of replenishing<br />
eroded beaches but<br />
Alternative 1 replenishes<br />
three additional eroded<br />
beaches.<br />
Replenishes 3 Littoral<br />
Cells and 12 Receiver<br />
Sites<br />
New recreational beach<br />
area would be created at<br />
more sites along the<br />
coastline to create a postconstruction<br />
total beach<br />
area of 378 acres; access<br />
correspondingly<br />
improved<br />
Tourism potential directly<br />
related to area of<br />
recreational beach created<br />
Total of 12 receiver sites<br />
where additional sand<br />
would temporarily<br />
increase the buffer<br />
between wave activity<br />
and structures. Six of the<br />
12 receiver sites are<br />
located entirely or<br />
partially in front of bluffs<br />
Replenishes 3 Littoral<br />
Cells and 9 Receiver Sites<br />
New recreational beach<br />
area would be created at<br />
fewer sites to create a<br />
post-construction total<br />
beach area of 345 acres;<br />
access correspondingly<br />
improved<br />
Tourism potential directly<br />
related to area of<br />
recreational beach created<br />
Total of nine receiver<br />
sites where additional<br />
sand would temporarily<br />
increase the buffer<br />
between wave activity<br />
and structures. Four of<br />
the nine receiver sites are<br />
located entirely or<br />
partially in front of bluffs<br />
Alternative 1 has<br />
maximum number of<br />
receiver sites<br />
Alternative 1 has greatest<br />
amount of postconstruction<br />
total beach<br />
area and improved access<br />
Alternative 1 has greatest<br />
acreage of recreational<br />
beach added<br />
Alternative 1 with greater<br />
number of sites overall in<br />
front of bluffs<br />
site-specific approvals are listed in Table 2-11. The agencies that may issue the permits or approvals may<br />
use the information presented in this <strong>EIR</strong>/<strong>EA</strong> to assist in the decision-making process.<br />
As shown in Tables 2-10 and 2-11, the types of permits can vary widely by jurisdiction and by the type<br />
of applicant. One key variation is the permitting/approval process in the coastal zone. Some background<br />
is useful to understand this process.<br />
Page 2-66<br />
<strong>Regional</strong> <strong>Beach</strong> <strong>Sand</strong> <strong>Project</strong> <strong>EIR</strong>/<strong>EA</strong><br />
99-69\SANDAG <strong>EIR</strong><strong>EA</strong> 3.4.wpd 7/17/00
2.0 Alternatives Considered<br />
Table 2-10<br />
Matrix of Key <strong>Project</strong> Approvals and Discretionary Actions<br />
SANDAG Board<br />
U.S. Navy<br />
U.S. <strong>Army</strong> Corps<br />
U.S. Fish and<br />
Wildlife Service<br />
U.S. Environmental<br />
National Marine<br />
California Dept. of<br />
<strong>Regional</strong> Water Quality<br />
State Water Resources<br />
California Coastal<br />
State Lands<br />
San Diego Air Pollution<br />
California Dept. of Parks<br />
<strong>EIR</strong> Certification !<br />
Issue Finding of No Significant<br />
Impact (FONSI)<br />
! !<br />
404 Permit ! " " " "<br />
401 Certification Order " " ! "<br />
Stormwater Pollution Prevention<br />
Plan (SWPPP)<br />
Coastal Consistency Determination/<br />
Coastal Development Permit<br />
" " ! "<br />
" " !<br />
Lease Agreement for Utilization of<br />
Sovereign Lands<br />
!<br />
Authority to Construct/Permit to<br />
Operate<br />
!<br />
Letter of Non-Objection ! !<br />
! Permitting/Approval Agency<br />
" Reviewing/Participating Agency<br />
<strong>Regional</strong> <strong>Beach</strong> <strong>Sand</strong> <strong>Project</strong> <strong>EIR</strong>/<strong>EA</strong> Page 2-67<br />
99-69\SANDAG <strong>EIR</strong><strong>EA</strong> 3.4.wpd 7/17/00
2.0 Alternatives Considered<br />
Table 2-11<br />
List of Approvals/Permits to Be Issued by Local Jurisdictions<br />
Name of Jurisdiction Applicable Receiver Sites Approval/Permit<br />
City of Oceanside South Oceanside Local coastal development permit, noise<br />
variance for Alternatives 1a and 2a,<br />
authorization to utilize sovereign lands<br />
City of Carlsbad<br />
City of Encinitas<br />
North Carlsbad, South Carlsbad North,<br />
South Carlsbad South<br />
Batiquitos, Leucadia, Moonlight <strong>Beach</strong>,<br />
Cardiff<br />
Noise variance at North Carlsbad site for<br />
Alternative 1a if haul or staging occur<br />
landward of historic mean high tide line<br />
City of Solana <strong>Beach</strong> Solana <strong>Beach</strong> Noise variance for Alternatives 1a and 2a<br />
City of Del Mar Del Mar Noise variance for Alternatives 1a and 2a<br />
City San Diego Torrey Pines, Mission <strong>Beach</strong> Noise variance for Mission <strong>Beach</strong> site,<br />
Alternatives 1a and 2a, authorization to<br />
utilize sovereign lands (includes receiver<br />
sites and borrow site MB-1)<br />
City of Imperial <strong>Beach</strong> Imperial <strong>Beach</strong> Local coastal development permit; noise<br />
variance for Alternatives 1a and 2a<br />
Port of San Diego Imperial <strong>Beach</strong> Local coastal development permit for<br />
sovereign lands; Board of<br />
Commissioner’s authorize sand placement<br />
None<br />
The federal Coastal Zone Management Act of 1972, as amended, requires that federal actions within a<br />
state’s coastal zone be consistent with the federally approved coastal zone management plan for that state<br />
(if one exists). The California Coastal Act of 1976 (Cal. Code Regs. Title 14 § 30000) led to the adoption<br />
of a federally approved coastal zone management program for California. Federal consistency with the<br />
California coastal zone management program is based on the coastal resource planning and management<br />
policies contained in Chapter 3 of the California Coastal Act. The policies in Chapter 3 generally relate to<br />
public access, recreation, the marine environment, land resources, development, and industrial uses. Within<br />
California, the federal proponent of an action must prepare a Coastal Consistency Determination (CCD)<br />
evaluating the consistency of that action with Chapter 3 of the California Coastal Act. The federal entity<br />
must obtain concurrence from the Coastal Commission prior to proceeding with the action. For the<br />
previous Navy Homeporting project, the Navy prepared a CCD for the Homeporting EIS and two<br />
subsequent CCD’s for the beach replenishment <strong>EA</strong>s. The Coastal Commission concurred on all three<br />
determinations.<br />
Page 2-68<br />
<strong>Regional</strong> <strong>Beach</strong> <strong>Sand</strong> <strong>Project</strong> <strong>EIR</strong>/<strong>EA</strong><br />
99-69\SANDAG <strong>EIR</strong><strong>EA</strong> 3.4.wpd 7/17/00
2.0 Alternatives Considered<br />
At the state level, the Coastal Act requires each local jurisdiction along the coast to prepare and submit for<br />
state certification a Local Coastal Program (LCP) for that portion of its area located within a specified<br />
Coastal Zone. The LCP consists of two parts. The first is a Land Use Plan with goals and regulatory<br />
policies, and the second is a set of Implementing Ordinances. Once the Coastal Commission certifies both<br />
elements then the local jurisdiction is granted permitting authority. However, the State Coastal Commission<br />
retains permitting authority over “sovereign lands” which are not within the purview of the LCP and for<br />
submerged lands which are seaward of the mean high tide line. Therefore, the responsibility for issuing<br />
coastal development permits for an action proposed by a non-federal entity is project-specific with regards<br />
to sovereign lands and the mean high tide line. The location of the mean high tide line varies substantially<br />
by season and due to prior beach replenishment actions. Generally, the history of harbor dredging and<br />
beach replenishment at Oceanside and nearby beaches to the south, has resulted in a change in the historic<br />
mean high tide line. Mapping from 1960 and 1972 identify a more landward mean high tide line in many<br />
locations, typically located at the base of small bluffs or locations of shoreline protection such as rip-rap.<br />
The California State Lands Commission will provide direction to the Coastal Commission and local<br />
jurisdictions regarding this boundary for purposes of this project.<br />
Because the intent of both the federal CCD and the state/local coastal development permit process is to<br />
ensure consistency with the California Coastal Act, where a project is jointly proposed by a federal and<br />
local entity, one concurrence by the Coastal Commission may satisfy both requirements. For purposes of<br />
this project, the state and local coastal development permits would be obtained for individual receiver sites<br />
depending on the status of the local permitting authority, and these would serve to satisfy the federal CCD<br />
requirement.<br />
R<br />
R<br />
R<br />
R<br />
R<br />
R<br />
In the case of Oceanside, which has been granted authority to issue local coastal development permits, the<br />
proposed project is both seaward and landward of the mean high tide line so permits would be necessary<br />
from both the local jurisdiction and the State Coastal Commission. Carlsbad also has been granted<br />
authority to issue local coastal development permits landward of the mean high tide line. Subsequent to<br />
issuance of the Draft <strong>EIR</strong>/<strong>EA</strong>, the historic mean high tide line was clarified by the State Lands Commission<br />
at North Carlsbad. The North Carlsbad receiver site will be reconfigured as part of final design to extend<br />
landward to the existing rip-rap. Because the entire project would be designed seaward of the historic<br />
mean high tide line, there would be no local permit authority. During final design, the configuration of the<br />
North Carlsbad receiver site will be widened landward. This document evaluates the worst-case footprint<br />
for purposes of full disclosure of visual impacts.<br />
R<br />
<strong>Regional</strong> <strong>Beach</strong> <strong>Sand</strong> <strong>Project</strong> <strong>EIR</strong>/<strong>EA</strong> Page 2-69<br />
99-69\SANDAG <strong>EIR</strong><strong>EA</strong> 3.4.wpd 7/17/00
2.0 Alternatives Considered<br />
The cities of Solana <strong>Beach</strong> and Del Mar do not have permitting authority granted by the Coastal<br />
Commission. The cities of Encinitas and San Diego do have permitting authority for portions of their cities,<br />
but not for the areas encompassed by the project. Therefore, the Coastal Commission would issue the<br />
coastal development permit for the entire action within each receiver site in these four jurisdictions.<br />
In the City of Imperial <strong>Beach</strong>, the project could be both seaward and landward of the mean high tide line.<br />
The City has an approved LCP and would issue the local permit, but the Coastal Commission has granted<br />
sovereign lands to the Port of San Diego in this location so the Port would issue a permit for that area<br />
seaward of the mean high tide line (as necessary).<br />
In some cases, Table 2-11 also indicates the need for issuance of noise variances. A variance would be<br />
required, where the local noise ordinance is applicable, to operate seven days a week within a 24-hour<br />
period. Such nighttime operations would be outside the limitations of the pertinent noise ordinance. More<br />
discussion of this topic is provided in Section 2.4 (Detailed Description of Alternatives) and Sections 3.13<br />
and 4.13 (Noise).<br />
Table 2-11 also identifies two cities that have been granted sovereign land by the California State Lands<br />
Commission (San Diego and Oceanside) who may issue authorization for utilization of those lands. This<br />
is similar to the lease agreement issued by the California State Lands Commission for receiver sites in other<br />
cities.<br />
Page 2-70<br />
<strong>Regional</strong> <strong>Beach</strong> <strong>Sand</strong> <strong>Project</strong> <strong>EIR</strong>/<strong>EA</strong><br />
99-69\SANDAG <strong>EIR</strong><strong>EA</strong> 3.4.wpd 7/17/00
3.0 Affected Environment<br />
CHAPTER 3.0<br />
AFFECTED ENVIRONMENT<br />
Chapter 3 sets forth the Affected Environment of the proposed action. The Affected Environment<br />
describes the present conditions within the area of the proposed action. The project area is defined as the<br />
coastal San Diego region, and is the area in which resources may be affected directly or indirectly by the<br />
proposed action.<br />
The receiver site footprints vary by alternative for the proposed action. For existing conditions, the<br />
alternative whose receiver site boundaries are the longest is described. In Chapter 4, the impact analysis<br />
addresses the receiver sites at a greater level of detail, where necessary, to fully address potential<br />
environmental effects of an alternative.<br />
This section of the <strong>EIR</strong>/<strong>EA</strong> describes the baseline conditions for each environmental resource against which<br />
the potential impacts of the proposed action will be compared. Generally, the baseline utilized for the<br />
analysis of environmental impacts under CEQA or NEPA reflects the conditions present at or about the<br />
time the <strong>EIR</strong>/<strong>EA</strong> is initiated. For purposes of this <strong>EIR</strong>/<strong>EA</strong>, except where noted otherwise, the baseline year<br />
is 1999. This is the year that the NOP was issued and the year that much of the offshore surveying and<br />
modeling of sand deposits was performed. Some additional offshore surveying was completed in January,<br />
February, and March 2000.<br />
<strong>Regional</strong> <strong>Beach</strong> <strong>Sand</strong> <strong>Project</strong> <strong>EIR</strong>/<strong>EA</strong> Page 3.1-1<br />
99-69\SANDAG <strong>EIR</strong><strong>EA</strong> 3.4.wpd 7/17/00
3.1 Geology and Soils<br />
3.1 GEOLOGY AND SOILS<br />
This section of the <strong>EIR</strong>/<strong>EA</strong> provides general information and a regional perspective on coastal geology,<br />
beaches and shoreline configuration, tides and sea level changes, wave processes, littoral processes.<br />
Existing geologic conditions were based on several reports and documents, including the San Diego<br />
<strong>Regional</strong> <strong>Beach</strong> <strong>Sand</strong> <strong>Project</strong> Offshore <strong>Sand</strong> Investigations (Sea Surveyor 1999); Shoreline<br />
Morphology Study, San Diego <strong>Regional</strong> <strong>Beach</strong> <strong>Sand</strong> <strong>Project</strong> (Moffatt & Nichol 2000a) which is<br />
Appendix C; the two Environmental Assessments for beach replenishment (Department of the Navy 1997a,<br />
1997b); and <strong>Beach</strong> <strong>Sand</strong> Transport and Sedimentation Report prepared by Frederic R. Harris, Inc.<br />
(FRH 1997).<br />
For purposes of this report, geology and soils include coastal geology and littoral processes of the receiver<br />
sites, and the composition of the offshore borrow sites. Coastal geology and beach configuration are<br />
determined primarily by wave forces acting on the geologic framework. These factors account for the<br />
area’s rugged undersea and land topography, including the narrow continental shelf, the rocky substrate<br />
under most beach areas, the thin layer of sediment, as well as coastal marine terraces, sea cliffs, and<br />
lagoons.<br />
The following subsections focus on the existing geologic conditions and littoral processes that make up the<br />
individual receiver sites, and the composition of the proposed borrow sites. More information regarding<br />
turbidity issues can be found in Sections 3.3 and 4.3 (Water Resources), while more detailed lagoon<br />
information is found in Sections 3.2 and 4.2 (Coastal Wetlands).<br />
3.1.1 Littoral Processes of the Three Littoral Cells<br />
Oceanside Littoral Cell<br />
The Oceanside Littoral Cell extends from Dana Point, in Orange County, south to the Scripps-La Jolla<br />
Submarine Canyon system at La Jolla Shores, near the foot of Mount Soledad (refer to Figure 1-2). The<br />
Oceanside Harbor complex is located approximately in the middle of this littoral cell. The harbor jetties<br />
interrupt the natural flow of sand and to a large extent divide the cell into sub-cells north and south of<br />
Oceanside Harbor. Receiver sites are located along the southern half of the Oceanside Littoral Cell.<br />
Page 3.1-2<br />
<strong>Regional</strong> <strong>Beach</strong> <strong>Sand</strong> <strong>Project</strong> <strong>EIR</strong>/<strong>EA</strong><br />
99-69\SANDAG <strong>EIR</strong><strong>EA</strong> 3.4.wpd 7/17/00
3.1 Geology and Soils<br />
Historical longshore transport rates and shoreline changes are well documented in the CCSTWS<br />
(USACOE 1991). This study concluded that the future condition of the beaches in northern San Diego<br />
County would be governed by cycles of accretion and erosion similar to those of the past 50 years, with<br />
accelerated trends toward erosion due to the following conditions: (1) reduction of river-borne sediment<br />
due to impoundment by dams; (2) influence of Oceanside Harbor; and (3) increase in the rate of sea level<br />
rise. In addition, the CCSTWS concluded that the most critical reach in terms of susceptibility to future<br />
erosion in the San Diego region is the 12-mile stretch of beach from Oceanside Harbor south to Encinitas<br />
(page xi). The shoreline immediately south of the harbor retreated at a rate of approximately 40 feet per<br />
year (1980 to 1989). The size of retreat decreased with distance from the harbor, and averaged only one<br />
foot per year at the southern end of the reach near Encinitas. Factors contributing to the trend in this reach<br />
include the cluster storms of in 1982-83 and the reduced rate of artificial nourishment (USACOE 1991).<br />
R<br />
R<br />
R<br />
R<br />
R<br />
R<br />
Extensive studies of longshore transport rates have been conducted on the Oceanside Littoral Cell. Table<br />
3.1-1 summarizes sediment transport rates, as identified by previous researchers. Results indicate a net<br />
southerly sediment transport at rates ranging between approximately 0 to 550,000 cy per year, with the<br />
average being approximately 250,000 cy per year (Moffatt & Nichol 2000a).<br />
Table 3.1-1<br />
Longshore Sediment Transport Rate Estimates for the Oceanside Littoral Cell<br />
Study<br />
Northerly<br />
cy/yr<br />
Southerly<br />
cy/yr<br />
Net<br />
cy/yr<br />
Marine Advisors (1961) 545,000 760,000 215,000<br />
Hales (1978) 541,000 643,000 102,000<br />
Inman and Jenkins (1983) 553,000 807,000 254,000<br />
Source: FRH 1997<br />
Historical sources of sediment for Oceanside Littoral Cell beaches include rivers, streams, and lagoons.<br />
However, since the 1950s, dams have substantially reduced these sediment sources and urbanization has<br />
accelerated the erosion rate of coastal bluffs and increased the rate of sedimentation in lagoons. Thus,<br />
current sources of onshore littoral material primarily include rivers, bluffs, and artificial fills.<br />
Several other elements also contribute to the decline of sediments within the littoral cell. Storms carry<br />
sediment away from the nearshore area and deposit it on the continental slope. The Oceanside Littoral Cell<br />
<strong>Regional</strong> <strong>Beach</strong> <strong>Sand</strong> <strong>Project</strong> <strong>EIR</strong>/<strong>EA</strong> Page 3.1-3<br />
99-69\SANDAG <strong>EIR</strong><strong>EA</strong> 3.4.wpd 7/17/00
3.1 Geology and Soils<br />
slope is steep; therefore, littoral material can be permanently lost from the littoral zone. Additionally, littoral<br />
transport between Oceanside and La Jolla is affected by two submarine canyons located at Carlsbad and<br />
La Jolla. La Jolla acts as a significant sediment sink for littoral material. As a result of a reduction in littoral<br />
material sources, coupled with the loss of material from storms and a submarine canyon, a net reduction<br />
in available natural sources of beach replenishment is occurring.<br />
Mission Bay Littoral Cell<br />
The Mission Bay Littoral Cell is a 16.5 mile-long coastal segment bounded on the north by Point La Jolla<br />
and on the south by Point Loma, at the entrance to San Diego Bay (refer to Figure 1-2). The north and<br />
south portions of this littoral cell are composed of high rocky bluffs containing pocket beaches of small areal<br />
extent. The central four-mile-long part of this cell contains sandy beaches including Ocean <strong>Beach</strong>, Mission<br />
<strong>Beach</strong>, and Pacific <strong>Beach</strong>. The coast between Mission <strong>Beach</strong> and Ocean <strong>Beach</strong> is divided by the jettied<br />
entrance to Mission Bay and the San Diego River outlet.<br />
Within the Mission Bay Littoral Cell, longshore shifts in sediment volume occur frequently in response to<br />
changing wave conditions. Typically, northerly shifts of sediment are experienced during the winter, while<br />
this pattern reverses in the summer. One study suggested that an annual net northerly sediment transport<br />
rate of 20,000 cy exists along the Mission Bay Littoral Cell (Hales 1979); the USACOE estimates a net<br />
longshore sediment transport between 20,000 to 90,000 cy per year to the south (USACOE 1991).<br />
Silver Strand Littoral Cell<br />
The Silver Strand Littoral Cell extends over a 17-mile long coastal reach from the headland at the south<br />
end of the Playas de Tijuana, Mexico, to Zuniga Jetty located immediately east of the entrance to San<br />
Diego Bay (refer to Figure 1-2). The primary physical features of this littoral cell include the coastal bluffs<br />
of the Playa de Tijuana, the Tijuana River delta, and the broad sandy beaches of the Silver Strand. An<br />
effective sediment sink in this littoral cell is a shoal located adjacent to Zuniga Jetty, where beach sand<br />
transported to the north along the Silver Strand beaches becomes impounded in the lee of Point Loma.<br />
Historical beach recession has occurred south of Coronado and at Imperial <strong>Beach</strong>.<br />
<strong>Sand</strong> transport along the beach in this littoral cell is generally in a net northward direction. Net longshore<br />
sediment transport is to the north from between 120,000 to 200,000 cy per year (Moffatt & Nichol<br />
2000a).<br />
Page 3.1-4<br />
<strong>Regional</strong> <strong>Beach</strong> <strong>Sand</strong> <strong>Project</strong> <strong>EIR</strong>/<strong>EA</strong><br />
99-69\SANDAG <strong>EIR</strong><strong>EA</strong> 3.4.wpd 7/17/00
3.1 Geology and Soils<br />
3.1.2 Receiver Sites<br />
Offshore of all receiver sites, a naturally-forming nearshore bar exists that typically receives sediment from<br />
the exposed beach during the winter season. The length and width of the nearshore bar varies by season,<br />
from effects of longshore current and sand transport, and by geography. Impacts to the nearshore bars as<br />
a result of sand replenishment activities are discussed in Section 4.1.<br />
For all receiver sites, seismic activity associated with the Rose Canyon fault and other nearby faults may<br />
lead to liquefaction, ground failure, sand volcanoes, and seaward slumping of beach material. The Rose<br />
Canyon fault is an active fault that roughly parallels the San Diego region coastline form north to south,<br />
crisscrossing from the ocean to land near La Jolla.<br />
South Oceanside<br />
The South Oceanside receiver site was formed from sand and rocks that originated from upland erosion.<br />
The receiver site consists of a relatively thin sand and cobble layer varying in width on a shallow, rock<br />
platform. Unusually large waves can expose the rock layer by moving the sand offshore or down coast.<br />
The receiver site is relatively wide although beach widths decrease south of Wisconsin Street as the wave<br />
sheltering effect from Oceanside Harbor no longer plays a role. <strong>Beach</strong> widths south of Oceanside Harbor,<br />
however, are presently narrower than they were historically due to the net decrease of river sand inputs and<br />
the effect of the harbor which prevents transport of sand from north to south. The Oceanside receiver site<br />
is located within the 12-mile stretch of beach defined in the CCSTWS as the most critical reach for future<br />
erosion.<br />
North Carlsbad<br />
The North Carlsbad receiver site was formed from the same process as South Oceanside and has the same<br />
geology with a thin layer of sand and cobble atop bedrock. South of Buena Vista Lagoon, the existing<br />
receiver site is relatively narrow with an abundance of cobbles. The receiver site is backed by marine<br />
terraces that reach a height of approximately 30 feet. <strong>Beach</strong> widths from Oceanside Harbor to La Jolla<br />
are narrower than they were historically as a combined consequence of a net decrease of river sand inputs<br />
and the trapping effect of the Oceanside Harbor on the littoral transport of sand from the north. This site<br />
also lies within the 12-mile length of beach area with critical erosion problems per the CCSTWS.<br />
<strong>Regional</strong> <strong>Beach</strong> <strong>Sand</strong> <strong>Project</strong> <strong>EIR</strong>/<strong>EA</strong> Page 3.1-5<br />
99-69\SANDAG <strong>EIR</strong><strong>EA</strong> 3.4.wpd 7/17/00
3.1 Geology and Soils<br />
South Carlsbad (North and South)<br />
The South Carlsbad receiver sites are located on a low tide terrace, which lies in front of coastal cliffs<br />
between Agua Hedionda and Batiquitos Lagoon. The steep coastal cliffs in this area have been continually<br />
forming from wave action cutting against the marine terrace. This process has occurred since the last<br />
relative still-stand of sea level, approximately 6,000 years ago (FRH 1997). The existing receiver site<br />
comprises the flat, rocky, shallow part of the shoreline and is part of the critical erosion area defined by<br />
CCSTWS.<br />
Batiquitos<br />
The Batiquitos receiver site is located on a low terrace, which lies in front of coastal cliffs south of<br />
Batiquitos Lagoon. The steep coastal cliffs in this area have been continually forming due to wave action<br />
cutting against the marine terrace. The existing receiver site comprises the flat, mixed sand and rock<br />
shallow part of the shoreline visible during periods of low tide.<br />
Batiquitos Lagoon was formed in the geologic past when the sea level was at a lower level, the shoreline<br />
was located farther to the west, and existing streams quickly eroded the exposed marine terraces. This led<br />
to the formation of steep canyons and as the sea level rose (approximately 18,000 years ago), sediments<br />
quickly filled the lower reaches of the channels that created the lagoon. Batiquitos Lagoon is currently a<br />
tidal lagoon due to an enhancement project completed in early 1997 that opened the inlet channel to tidal<br />
flows.<br />
The Batiquitos receiver site is located within the Oceanside Littoral Cell and is subject to similar transport<br />
processes as those described for the South Oceanside receiver site. The receiver site is located within a<br />
critical erosional area (USACOE 1991).<br />
Leucadia<br />
Similar to the Batiquitos receiver site, the Leucadia receiver site is located on a low terrace, which lies in<br />
front of coastal cliffs that characterize Leucadia’s beaches. The steep coastal cliffs in this area have been<br />
continually forming due to wave action cutting against the marine terrace. The existing receiver site<br />
comprises the flat, rocky, shallow part of the shoreline visible during periods of low tide.<br />
Page 3.1-6<br />
<strong>Regional</strong> <strong>Beach</strong> <strong>Sand</strong> <strong>Project</strong> <strong>EIR</strong>/<strong>EA</strong><br />
99-69\SANDAG <strong>EIR</strong><strong>EA</strong> 3.4.wpd 7/17/00
3.1 Geology and Soils<br />
The Leucadia receiver site is located within the Oceanside Littoral Cell and is subject to similar transport<br />
processes as those described for the South Oceanside receiver site. The Leucadia receiver site is located<br />
within a critical erosional area (USACOE 1991).<br />
Moonlight <strong>Beach</strong><br />
The Moonlight receiver site was formed from sand and rocks that originated from upland erosion. The<br />
receiver site consists of a relatively thin sand layer, which varies in width and lies on a shallow rock<br />
platform. The receiver site is relatively wide although beach widths decrease to the north and south, where<br />
coastal bluffs line the coast.<br />
The Moonlight receiver site is located within the Oceanside Littoral Cell and is subject to similar transport<br />
processes as those described for the South Oceanside receiver site. The Moonlight receiver site is located<br />
within a critical erosional area (USACOE 1991).<br />
Cardiff<br />
The Cardiff receiver site consists of a rocky (cobble) beach that lies on a shallow, wave cut platform. The<br />
beach area has been stripped of most of its sand from large waves which typically occur during the winter<br />
months.<br />
The receiver site is located directly seaward of San Elijo Lagoon and south of the lagoon mouth. The<br />
lagoon was formed during lower stands of sea level, when the shoreline was farther to the west and existing<br />
streams quickly eroded the exposed marine terraces. This formed steep canyons, and as the sea level rose<br />
(approximately 18,000 years ago), sediments quickly filled the lower reaches of the channels and created<br />
the lagoon (FRH 1997). San Elijo is still currently a tidal lagoon because the channels are not completely<br />
full of sediments.<br />
The Cardiff receiver site is within the Oceanside Littoral Cell and is subject to similar transport processes<br />
as described for South Oceanside. However, the Cardiff receiver site is not located within the critical<br />
erosional area south of Oceanside Harbor (as identified by the CCSTWS).<br />
<strong>Regional</strong> <strong>Beach</strong> <strong>Sand</strong> <strong>Project</strong> <strong>EIR</strong>/<strong>EA</strong> Page 3.1-7<br />
99-69\SANDAG <strong>EIR</strong><strong>EA</strong> 3.4.wpd 7/17/00
3.1 Geology and Soils<br />
Solana <strong>Beach</strong><br />
The Solana <strong>Beach</strong> receiver site consists of a low tide terrace, which lies in front of coastal cliffs south of<br />
San Elijo Lagoon. The steep coastal cliffs in this area have been continually forming from wave action<br />
cutting against the marine terrace. This process has occurred since the last relative still-stand of sea level,<br />
approximately 6,000 years ago (FRH 1997). The existing receiver site comprises the flat, rocky, shallow<br />
part of the shoreline visible during low tide.<br />
The Solana <strong>Beach</strong> receiver site is within the Oceanside Littoral Cell and is subject to similar transport<br />
processes as described for South Oceanside. However, this receiver site is not located within the critical<br />
erosional area south of Oceanside Harbor (as identified by the CCSTWS).<br />
Del Mar<br />
The Del Mar receiver site is located within the Oceanside Littoral Cell and is subject to similar transport<br />
processes as those described for the South Oceanside receiver site. The Del Mar receiver site was formed<br />
from sand and rocks that originated from upland erosion. The receiver site consists of a relatively thin sand<br />
layer, which varies in width and lies on rock platform. The receiver site is relatively wide compared to<br />
other receiver sites.<br />
Similar to Batiquitos Lagoon, the San Dieguito Lagoon was formed in the geologic past when the sea level<br />
was lower, the shoreline was farther to the west, and existing streams quickly eroded the exposed marine<br />
terraces. San Dieguito Lagoon is a functioning tidal lagoon.<br />
Torrey Pines<br />
The Torrey Pines receiver site is located on a low tide terrace, which lies in front of coastal cliffs to the<br />
north and south of Los Peñasquitos Lagoon. The steep coastal cliffs in this area have been continually<br />
forming from wave action cutting against the marine terrace. The existing receiver site comprises the flat,<br />
rocky, shallow part of the shoreline visible during low tide.<br />
Similar to other lagoons in the region, Los Peñasquitos Lagoon was formed in the geologic past when the<br />
sea level was lower, the shoreline was farther to the west, and existing streams quickly eroded the exposed<br />
Page 3.1-8<br />
<strong>Regional</strong> <strong>Beach</strong> <strong>Sand</strong> <strong>Project</strong> <strong>EIR</strong>/<strong>EA</strong><br />
99-69\SANDAG <strong>EIR</strong><strong>EA</strong> 3.4.wpd 7/17/00
3.1 Geology and Soils<br />
marine terraces. Los Peñasquitos Lagoon is an intermittent tidal lagoon due to occasional lagoon closures<br />
from sediment accretion at the channel inlet.<br />
The Torrey Pines receiver site is situated within the Oceanside Littoral Cell and is subject to similar<br />
transport processes as described for South Oceanside. According to the CCSTWS, the Torrey Pines<br />
receiver site is not located within a critical erosional area.<br />
Mission <strong>Beach</strong><br />
The Mission <strong>Beach</strong> receiver site is located on a low tide terrace. The existing receiver site comprises the<br />
flat, shallow part of the shoreline visible during high and low tides. The receiver site was once a<br />
depositional area of the ancestral San Diego River. The Mission <strong>Beach</strong> receiver site is situated within the<br />
Mission <strong>Beach</strong> Littoral Cell.<br />
Imperial <strong>Beach</strong><br />
The Imperial <strong>Beach</strong> receiver site is located on a low tide terrace. The existing receiver site comprises the<br />
flat, shallow part of the shoreline visible during high and low tides. The receiver site is a depositional area<br />
of sediment from the Tijuana River. The Imperial <strong>Beach</strong> receiver site is located within the Silver Strand<br />
Littoral Cell.<br />
3.1.2 Borrow Sites<br />
Marine geophysical surveys and vibracore investigations were conducted along the San Diego coastline<br />
to map the horizontal and vertical extent, and compute the volume, of beach-quality sand at numerous<br />
possible borrow sites. The marine geophysical surveys included the use of side-scan sonar to produce<br />
maps that show the type and extent of the surface (e.g., silt, sand, gravel, cobble) and natural (e.g., bedrock<br />
exposures) or cultural features (e.g., boats, pipelines) on the seafloor. Sediment layers were mapped at 10<br />
feet and 30 feet below the seabed. The borrow sites were defined originally in large rectangles for<br />
purposes of investigation. Over time, dredge areas have been defined within the original rectangle. The<br />
description below pertains to the original site so the dredge area shown in Figures 2-15 through 2-20<br />
represent a smaller subset of the described area.<br />
<strong>Regional</strong> <strong>Beach</strong> <strong>Sand</strong> <strong>Project</strong> <strong>EIR</strong>/<strong>EA</strong> Page 3.1-9<br />
99-69\SANDAG <strong>EIR</strong><strong>EA</strong> 3.4.wpd 7/17/00
3.1 Geology and Soils<br />
Sediment core samples were taken at 125 locations in January 1999. Subsamples from the sediment cores<br />
were later studied in a laboratory to determine grain-size and chemical make-up for evaluating compatibility<br />
between borrow site material and sand at the receiver sites.<br />
Tables 2-3 and 2-5 shows various construction characteristics of the borrow sites. The discussion below<br />
includes additional information about the dredge sites regarding geology and soils, including the volume and<br />
thickness of silt overburden and the thickness of the sand layer.<br />
SO-9<br />
Site SO-9 is located north of Oceanside Harbor and offshore of the Santa Margarita River. The original<br />
area of investigation was over 340 acres, and the project dredge area had a surface area of 63 acres in 45<br />
to 50 feet of water. This dredge area has been reduced in the Final <strong>EIR</strong>/<strong>EA</strong> by approximately 25 percent<br />
to provide a greater buffer from previously unmapped artificial reefs. CDFG review of the side-scan sonar<br />
imaging at SO-9 revealed that some targets of unknown origin were remnants of an artificial reef experiment<br />
that had been mismapped after placement. The artificial reef had not been included in published sources<br />
because it had not been re-located.<br />
R<br />
R<br />
R<br />
R<br />
R<br />
At the SO-9 borrow site, three layers of sediments were found. The top (surficial) layer consists of sandy<br />
silt. The grain-size analyses showed this surficial layer to be approximately 0 to 2 feet deep over the dredge<br />
site, and unsuitable for beach nourishment material. Beneath the surficial silt is a layer of fine- to mediumgrained<br />
sand that is suitable for beach replenishment. This sand layer is 2 to 13 feet thick, and is exposed<br />
on the seafloor surface along the central region of the site. A third layer, consisting of fine-grained silty<br />
sand, was found under the sand layer. The grain-size analyses showed this layer to be unsuitable for beach<br />
nourishment material.<br />
SO-7<br />
Site SO-7 is located offshore of Batiquitos Lagoon. The area of investigation covered an area of<br />
approximately 280 acres but the project dredge area would be approximately 70 acres in 60 to 85 feet of<br />
water. If SO-7 is expanded and SO-9 and/or SO-6 are eliminated, then the dredge area would increase<br />
up to 150 acres with 1.5 million cy of material removed. Most of the site is predominantly well-sorted<br />
medium- to coarse-grained sand with occasional pebbles and shell fragments. This material is ideal for<br />
R<br />
R<br />
Page 3.1-10<br />
<strong>Regional</strong> <strong>Beach</strong> <strong>Sand</strong> <strong>Project</strong> <strong>EIR</strong>/<strong>EA</strong><br />
99-69\SANDAG <strong>EIR</strong><strong>EA</strong> 3.4.wpd 7/17/00
3.1 Geology and Soils<br />
beach nourishment, and the layer is thick enough (1 to 11 feet) for efficient and economical dredging.<br />
There is no silt overburden at this borrow site.<br />
SO-6<br />
Site SO-6 is located offshore of San Elijo Lagoon. The project dredge area covers approximately 29<br />
acres in 60 to 80 feet of water of the approximately 225 acres investigated. The results of the grain-size<br />
analysis indicate that most, if not all, of the sediment within SO-6 is acceptable for beach replenishment<br />
purposes. A single, wedge-shaped layer of fine-grained sand with a low content of silt overlies shale<br />
bedrock within the site. This wedge of material measures less than 5 feet thick along the nearshore<br />
boundary and uniformly increases toward the offshore boundary to a maximum of 14 feet in thickness.<br />
There is no silt overburden at this borrow site.<br />
SO-5<br />
Site SO-5 is located offshore of San Dieguito Lagoon. The area investigated was about 225 acres and the<br />
proposed project dredge area has a surface area of approximately 127 acres. The dredge area would be<br />
located between 50 and 80 feet of water. A majority of the site contains suitable sand for beach<br />
nourishment. The thickness of the sand layer is 1 to 22 feet. The predominant sediment within Site SO-5<br />
is gray to olive-gray fine-grained sand with 3 percent silt content. The site contains a single, homogenous,<br />
wedge-shaped layer of fine-grained sand. There is no silt overburden at this borrow site.<br />
MB-1<br />
Site MB-1 is located offshore of Mission <strong>Beach</strong> and north of the San Diego River. The area investigated<br />
was over 500 acres, but the proposed project dredge area covers approximately 19 acres at 65 to 75 feet<br />
of water. The majority of the site contains fine- to coarse-grained that is suitable for beach replenishment.<br />
The site contains a very thick layer of medium- to coarse-grained sand covering the entire area and varying<br />
in thickness from 15 to 45 feet. There is no silt overburden at this borrow site. Of all the proposed borrow<br />
sites, this site contains the largest overall volume of suitable sand for beach replenishment.<br />
<strong>Regional</strong> <strong>Beach</strong> <strong>Sand</strong> <strong>Project</strong> <strong>EIR</strong>/<strong>EA</strong> Page 3.1-11<br />
99-69\SANDAG <strong>EIR</strong><strong>EA</strong> 3.4.wpd 7/17/00
3.1 Geology and Soils<br />
SS-1<br />
This proposed dredge area is located offshore of Imperial <strong>Beach</strong> near the Mexican border in 40 to 50 feet<br />
of water, and covers approximately 22 acres. The site originally investigated was over 650 acres in size.<br />
This site is located within the Silver Strand Littoral Cell. <strong>Sand</strong> was found that is medium- to coarse-grained<br />
and brownish-gray to light-gray in color, and is suitable for beach nourishment.<br />
Page 3.1-12<br />
<strong>Regional</strong> <strong>Beach</strong> <strong>Sand</strong> <strong>Project</strong> <strong>EIR</strong>/<strong>EA</strong><br />
99-69\SANDAG <strong>EIR</strong><strong>EA</strong> 3.4.wpd 7/17/00
3.2 Coastal Wetlands<br />
3.2 COASTAL WETLANDS<br />
Coastal wetlands discussed in this section include creeks, rivers, or lagoons that discharge into the ocean<br />
near the proposed receiver sites. Coastal wetland areas identified in the vicinity of the proposed receiver<br />
sites include San Luis Rey River, Loma Alta Creek, Buena Vista Lagoon, Agua Hedionda Lagoon,<br />
Batiquitos Lagoon, San Elijo Lagoon, San Dieguito Lagoon, Los Peñasquitos Lagoon, Mission Bay, and<br />
Tijuana Estuary. The characteristics below are summarized from the biological resources technical report,<br />
Appendix D.<br />
San Luis Rey River<br />
The San Luis Rey River has a watershed area of 560 square miles and is located below Henshaw Dam.<br />
It has been estimated that construction of the dam has reduced the average sediment yield of the river by<br />
approximately 32 percent. The San Luis Rey River has historically received discharges of treated<br />
wastewater. The ocean inlet at this location is open intermittently due to the presence of a sand barrier and<br />
low fresh water flows. Currently the entire wetland excluding the river corridor covers 294 acres. Riparian<br />
habitat is the dominant habitat type followed by estuarine open water. Endangered California brown<br />
pelicans and California least terns feed and roost along the river. Riparian areas upstream support the<br />
endangered least Bell’s vireo.<br />
Loma Alta Creek<br />
The Loma Alta Creek is a seasonal freshwater creek that discharges into the ocean near Buccaneer <strong>Beach</strong><br />
Park. The creek flows under Pacific Street through a cement culvert, and the creek is industrialized inland.<br />
There is no lagoon associated with the creek. The outlet area crosses a small steep sand beach that is<br />
defined by rip-rap on both sides. A small freshwater marsh is located east of the outlet area. During the<br />
dry season, the creek outlet to the ocean is closed by a sand berm.<br />
Buena Vista Lagoon<br />
Buena Vista Lagoon is a State Ecological Reserve managed by the CDFG. Historically, it was a tidal<br />
lagoon; however, since 1940 the inlet has been closed by a man-made weir (a dam used to raise the<br />
lagoon’s water level and control flow at the mouth). The entire lagoon consists of 246 acres with the<br />
primary habitats being fresh/brackish water and marsh, although there is a small remnant coastal saltmarsh.<br />
<strong>Regional</strong> <strong>Beach</strong> <strong>Sand</strong> <strong>Project</strong> <strong>EIR</strong>/<strong>EA</strong> Page 3.2-1<br />
99-69\SANDAG <strong>EIR</strong><strong>EA</strong> 3.4.wpd 7/17/00
3.2 Coastal Wetlands<br />
The lagoon has historically received discharges of secondary treated wastewater and presently continues<br />
to experience sewage spills. The accumulated sludge, plant detritus, excess nutrients, and contained basin<br />
combine to cause eutrophic conditions. Nonetheless, a diverse assemblage of sensitive bird species forage<br />
or nest in the vicinity of this lagoon. The lagoon is a migratory bird stopover point and general habitat for<br />
herons, egrets, dabbling and diving ducks. The lagoon supports endangered species such as the lightfooted<br />
clapper rail, California brown pelican, California least tern, and occasionally Belding’s savannah<br />
sparrows. Cattail marsh habitat along the lagoon has been utilized for nesting by light-footed clapper rails<br />
(Rallus longirostris levipes). It has been proposed by the USFWS as critical habitat for the tidewater<br />
goby (Eucyclogobius newberryi), a small fish.<br />
R<br />
R<br />
R<br />
Agua Hedionda Lagoon<br />
The ocean inlet to Agua Hedionda Lagoon is located south of the proposed North Carlsbad receiver site<br />
and north of the proposed South Carlsbad (north and south) receiver sites. Aqua Hedionda has been a<br />
tidal lagoon since 1954 when San Diego Gas and Electric completed a large-scale dredging project to<br />
provide a deep water basin and cooling water for the Encina Power Plant. As a result, the lagoon exhibits<br />
a diverse community of benthic invertebrates and fish. The lagoon serves as a nursery area for marine fish<br />
and has also been proposed as critical habitat for the tidewater goby. The outer lagoon supports<br />
commercial shellfishing aquaculture, recreational boating and skiing, a marina, and a marine fish hatchery.<br />
Two pair of jetties maintain tidal flow and power plant circulation; the northern jetties serve as an ocean<br />
inlet to the lagoon and the southern jetties serve as the warm water discharge from the power plant.<br />
R<br />
R<br />
The lagoon is approximately 400 acres in size and consists primarily of open water habitat. A coastal<br />
saltmarsh occurs at the eastern end of the inner lagoon and supports endangered Belding’s savannah<br />
sparrow. Endangered California brown pelican feed and roost at the lagoon, and California least tern<br />
forage there as well. Cattail marsh habitat has been utilized by light-footed clapper rails for nesting.<br />
Eelgrass occurs along the shoreline throughout the lagoon. The entrance to the lagoon undergoes<br />
maintenance dredging annually or biannually and dredge materials are used to replenish beaches north,<br />
between, and south of the inlet and discharge jetties.<br />
R<br />
R<br />
Batiquitos Lagoon<br />
Batiquitos Lagoon inlet is located north of the proposed Batiquitos receiver site. The lagoon is managed<br />
as a State Ecological Reserve by the CDFG. A major wetlands enhancement project that involved<br />
Page 3.2-2<br />
<strong>Regional</strong> <strong>Beach</strong> <strong>Sand</strong> <strong>Project</strong> <strong>EIR</strong>/<strong>EA</strong><br />
99-69\SANDAG <strong>EIR</strong><strong>EA</strong> 3.4.wpd 7/17/00
3.2 Coastal Wetlands<br />
dredging the entire lagoon was completed in January 1997, which allowed sustained tidal flushing of the<br />
lagoon. Prior to the enhancement project, the lagoon consisted of 550 acres of shallow wetland, which<br />
included estuarine open water, southern coastal salt marsh, and tidal estuarine flats. The lagoon area<br />
supported a number of nesting migratory birds, including the California least terns and western snowy<br />
plovers. The lagoon had been subject to frequent inlet closures due to the buildup of a sand and cobble<br />
berm. The lagoon closures led to a substantial accumulation of organics and fine anaerobic sediments,<br />
persistent eutrophic conditions (i.e., enriched in dissolved nutrients that stimulate the growth of aquatic plant<br />
life resulting in the depletion of dissolved oxygen), development of algal mats, and wide swings in salinity.<br />
Since the completion of the enhancement project, habitat throughout the lagoon has been altered. The<br />
primary habitat is estuarine open water followed by coastal salt marsh. Nesting islands support endangered<br />
California least terns and threatened western snowy plover. The lagoon also functions as habitat for marine<br />
and estuarine species of invertebrates and fish.<br />
R<br />
R<br />
R<br />
The new ocean inlet to the lagoon is protected by two jetties that enable sustained tidal flushing. Due to<br />
the dynamics of the lagoon, the west and central basins are expected to naturally accumulate beach sand<br />
and will require routine maintenance dredging similar to that conducted at Aqua Hedionda Lagoon every<br />
two years.<br />
San Elijo Lagoon<br />
The inlet to San Elijo Lagoon is located north of the proposed Cardiff receiver site. San Elijo Lagoon is<br />
comprised of approximately 900 acres and includes the 590-acre San Elijo Ecological Reserve, which is<br />
managed by the CDFG and the San Diego County Department of Parks and Recreation. It is rarely open<br />
to tidal flushing due to its relatively small tidal prism and frequent blockage by a substantial volume of<br />
cobbles. Experimental excavation of the inlet area and high stormwater runoff events have resulted in<br />
periodic opening of the lagoon to tidal flushing for short durations spanning a couple to several months.<br />
Most of the habitat consists of brackish/freshwater marsh, nontidal flats, and open water. San Elijo Lagoon<br />
is one of the highest ranked waterfowl habitats among the coastal lagoons in San Diego County because<br />
of its diverse habitat and shallow brackish water. Both the endangered Belding’s savannah sparrow and<br />
California least tern nest at the lagoon. California brown pelicans use the open water to rest and feed.<br />
<strong>Regional</strong> <strong>Beach</strong> <strong>Sand</strong> <strong>Project</strong> <strong>EIR</strong>/<strong>EA</strong> Page 3.2-3<br />
99-69\SANDAG <strong>EIR</strong><strong>EA</strong> 3.4.wpd 7/17/00
3.2 Coastal Wetlands<br />
San Dieguito Lagoon<br />
The inlet to San Dieguito Lagoon is located north of the proposed Del Mar receiver site and south of the<br />
Solana <strong>Beach</strong> receiver site. The lagoon includes a lengthy river channel, which serves as the main body<br />
of the lagoon, along with a channel tributary. Historically, the lagoon was a 604-acre salt marsh. It was<br />
filled in 1935 to create the Del Mar fairgrounds and racetrack. Today, San Dieguito Lagoon is primarily<br />
a river channel with dominant seasonal fluvial flows. The lagoon is part of the San Dieguito River Park<br />
System. The lagoon is the location of a restoration project being planned by Southern California Edison.<br />
Presently, the lagoon inlet is intermittently open. The 22 nd Agricultural District periodically uses a bulldozer<br />
to open the inlet to tidal flushing. The lagoon spans 520 acres with about half that consisting of disturbed<br />
and agricultural habitat. Wetland habitat comprises 267 acres. The lagoon provides foraging and nesting<br />
habitat for endangered Belding’s savannah sparrows and western snowy plover, and California least tern<br />
forage within the vicinity.<br />
Los Peñasquitos Lagoon<br />
The ocean inlet to Los Peñasquitos Lagoon is located north of the proposed Torrey Pines receiver site and<br />
south of the proposed Del Mar receiver site. The Los Peñasquitos Lagoon Foundation has had success<br />
with keeping the inlet open, although extensive cobble in the vicinity of the entrance complicates<br />
maintenance and accelerates inlet closure processes. The primary habitat type is coastal salt marsh, which<br />
at 271 acres, is one of the largest in San Diego County. The lagoon also has over 100 acres of riparian<br />
habitat. The endangered Belding’s savannah sparrow use the salt marsh habitat for nesting and foraging.<br />
Western snowy plover nest in the vicinity and California least tern forage within the lagoon.<br />
Mission Bay<br />
The 2,470-acre Mission Bay complex, which includes Kendall-Frost Preserve, Famosa Slough, and the<br />
San Diego River Channel, is the second largest embayment in San Diego County. The ocean inlet is south<br />
of the proposed Mission <strong>Beach</strong> receiver site. Marine open water is the dominant habitat (1,916 acres)<br />
within the bay. Eelgrass beds and mudflats are found throughout the bay, and there are about 125 acres<br />
of coastal salt marsh. Coastal brackish/freshwater marsh and riparian habitats occur along the San Diego<br />
River. Endangered Belding’s savannah sparrow and light-footed clapper rail nest and forage in the<br />
Kendall-Frost Preserve. California least terns nest on islands and forage throughout the bay.<br />
Page 3.2-4<br />
<strong>Regional</strong> <strong>Beach</strong> <strong>Sand</strong> <strong>Project</strong> <strong>EIR</strong>/<strong>EA</strong><br />
99-69\SANDAG <strong>EIR</strong><strong>EA</strong> 3.4.wpd 7/17/00
3.2 Coastal Wetlands<br />
Tijuana Estuary<br />
The Tijuana Estuary is just southeast of the proposed Imperial <strong>Beach</strong> receiver site. The 2,119-acre Tijuana<br />
Estuary includes open water, marsh, dune, coastal scrub and chaparral, riparian, tidal and nontidal estuarine<br />
flats, and ruderal and disturbed habitats. It has one of the few remaining dune habitats in San Diego<br />
County. The dune habitat occurs just south of the proposed receiver site and separates the coastal<br />
shoreline from the wetland habitat. Normally the estuary is open to tidal flushing. Tijuana Estuary is unique<br />
in that it is entirely in California, but three-fourths of its watershed are in Mexico. The estuary is part of the<br />
Pacific Flyway, and supports the most diverse assemblage of birds found within this region. The<br />
endangered Belding’s savannah sparrow, California least tern, light-footed clapper rail, and western snowy<br />
plover nest and forage within the wetland.<br />
<strong>Regional</strong> <strong>Beach</strong> <strong>Sand</strong> <strong>Project</strong> <strong>EIR</strong>/<strong>EA</strong> Page 3.2-5<br />
99-69\SANDAG <strong>EIR</strong><strong>EA</strong> 3.4.wpd 7/17/00
3.3 Water Resources<br />
3.3 WATER RESOURCES<br />
Water resources analyzed in this study include physical processes and chemical properties. Physical<br />
processes include tides and water levels, currents, wave exposure, and littoral processes. Chemical<br />
properties are characterized by temperature, salinity, dissolved oxygen, and water visibility (turbidity).<br />
The following is a discussion of the factors that contribute to the quality of existing water resources at the<br />
proposed borrow sites and receiver beaches. Data is summarized from the previous Navy documentation<br />
(1997a, 1997b) and the biological resources technical report which is provided as Appendix D (refer to<br />
Section 3.1.5 and Table 5 of that Appendix). The survey methods and literature/data review for water<br />
quality are described in Section 3.4.1.<br />
R<br />
R<br />
R<br />
3.3.1 Physical Processes<br />
The general oceanic circulation off the coast of California is dominated by the long-term mean southward<br />
flow associated with the California Current. In southern California, the current divides into a southward<br />
extension and a recirculating flow toward the coast. The recirculation forms a counterclockwise eddy that<br />
is present most of the year. An inshore countercurrent (Davidson Current) moves north from Baja<br />
California and is detected along the southern California coastline from October to April.<br />
Currents move large amounts of water with varying levels of temperature, salinity, dissolved oxygen, and<br />
nutrients in and out of the study area. These water masses vary in strength and are influenced by weather<br />
patterns and seasonal variations. In addition, nearshore currents vary along the coast in response to<br />
coastline orientation, bottom topography, and tides. Kelp forests may slow ocean currents to one-third of<br />
the normal rate.<br />
Waves (swell) also exert a significant influence upon the water column and nearshore bottom habitats. In<br />
shallow water, the circular motion within the water column can induce the resuspension and transport of<br />
bottom sediments. Wave height and high-velocity swell tend to be most prominent during winter and spring<br />
due to storms from the North Pacific.<br />
All of southern California has a mixed semidiurnal (daily) tide with two high tides and two low tides, each<br />
of different magnitude, every 24 hours and 50 minutes. The range between mean high and low water is<br />
approximately 3.7 feet and the diurnal range is approximately 5.4 feet.<br />
<strong>Regional</strong> <strong>Beach</strong> <strong>Sand</strong> <strong>Project</strong> <strong>EIR</strong>/<strong>EA</strong> Page 3.3-1<br />
99-69\SANDAG <strong>EIR</strong><strong>EA</strong> 3.4.wpd 7/17/00
3.3 Water Resources<br />
Local currents in nearshore waters are complex and include longshore currents, which flow parallel to the<br />
shore, and cross-shore and rip currents, which move in an onshore-offshore direction. The combination<br />
of these currents makes up the littoral transport process. Longshore currents in the coastal zone and driven<br />
primarily by waves striking the shoreline at oblique angles. Overall, longshore currents produce drift and<br />
sediment transport (turbidity) from north to south. Wave exposure affects the receiver beaches from the<br />
south and west. For further discussion of littoral transport processes affecting the proposed receiver sites,<br />
refer to Section 3.1.<br />
Seasonal fluctuations in wave patterns and currents also cause substantial changes in water quality,<br />
especially turbidity. Warming by the sun is the primary factor that affects surface water temperatures in<br />
southern California from June to October.<br />
Seasonal upwelling and downwelling also affect water quality within the area. Upwelling occurs when<br />
northern winds displace surface waters offshore, resulting in replacement by colder, deeper waters. These<br />
colder waters have lower dissolved oxygen, but they have higher salinity and, most importantly, are richer<br />
in nutrients. Upwelling is generally present from late March though July in the San Diego County area.<br />
Downwelling occurs when southern winds push offshore waters towards the shore, thus, pushing nearshore<br />
surface waters down and causing warmer waters and lower salinity than is typical for deeper waters.<br />
3.3.2 Chemical Properties<br />
The similarities and differences in chemical properties expected at the borrow sites and offshore the<br />
receiver sites are described below. The initial focus is factors associated with the water, specifically<br />
temperature, salinity, dissolved oxygen and pH. This is followed by sediment characteristics.<br />
Temperature<br />
In areas near the borrow sites, seasonal thermoclines stratify the water column. Waters typically are<br />
stratified during the summer and early fall, unstratified during the winter, and transitional (e.g., stratification<br />
weakening or increasing) in late fall and spring. Thermoclines represent barriers to mixing between surface<br />
and bottom waters. Surface water temperatures generally are highest from June through September and<br />
lowest from November through February. Temperatures near the bottom generally are higher from<br />
October through January and lower from April through June. Historical temperatures in the study area<br />
range from 52 to 74º F near the surface and from 49 to 61º F near the bottom.<br />
Page 3.3-2<br />
<strong>Regional</strong> <strong>Beach</strong> <strong>Sand</strong> <strong>Project</strong> <strong>EIR</strong>/<strong>EA</strong><br />
99-69\SANDAG <strong>EIR</strong><strong>EA</strong> 3.4.wpd 7/17/00
3.3 Water Resources<br />
Water temperatures near the receiver sites tend to be more uniform throughout the water column due to<br />
turbulent mixing and shallower depths. Nearshore locations are shallower and have slightly higher<br />
temperatures in the range of 57 to 75 °F.<br />
Salinity<br />
Historical salinity levels are fairly uniform ranging from approximately 32 to 34 parts per thousand (ppt)<br />
throughout the study area. Salinity levels tend to be homogenous throughout the water column with<br />
differences typically less than 1 ppt from surface (near receiver sites) to bottom waters (borrow sites). The<br />
exception is during winter storms when freshwater runoff reduces surface water salinity, especially at<br />
nearshore locations. Salinity levels in both surface and bottom waters may be slightly higher from April to<br />
August due to upwelling of more dense bottom waters.<br />
Dissolved Oxygen<br />
Historical dissolved oxygen values range from 5.0 to 11.6 mg/L throughout the study area. Surface water<br />
dissolved oxygen at proposed borrow sites SO-5 and SO-7 were 8.3 mg/L and 7.8 mg/L, respectively,<br />
during the June 1999 survey. Bottom water dissolved oxygen at both sites was 8.6 mg/L. Surface and<br />
nearshore waters generally have higher concentrations of dissolved oxygen due to continuous wave action<br />
and atmospheric mixing. A dissolved oxygen level equal to or greater than 5 milligrams per liter (mg/l) has<br />
been recommended as a generalized standard of acceptable water quality for aquatic life. Dissolved<br />
oxygen concentrations are routinely measured off the coast of Encinitas. Average recorded dissolved<br />
oxygen levels at that location are 6 to 10 mg/l.<br />
pH<br />
Historical pH values range from 7.7 to 8.4 throughout the study area. Slightly higher pH values occur<br />
during May through September when water temperatures are warmer. Little variance occurs from surface<br />
to bottom waters.<br />
3.3.3 Turbidity<br />
Turbidity is a result of particles suspended in the water column. Turbidity may result from natural causes,<br />
e.g., plankton concentrations, as well as from sediment particles suspended by waves, river discharge<br />
<strong>Regional</strong> <strong>Beach</strong> <strong>Sand</strong> <strong>Project</strong> <strong>EIR</strong>/<strong>EA</strong> Page 3.3-3<br />
99-69\SANDAG <strong>EIR</strong><strong>EA</strong> 3.4.wpd 7/17/00
3.3 Water Resources<br />
and/or dredging activities. Increases in turbidity can affect light levels in the water which can reduce<br />
photosynthesis and plant growth. Additional effects of turbidity may result in impaired feeding and<br />
respiration of fish and invertebrates.<br />
Suspended silt particles in the water column will increase turbidity; however, larger sand particles (greater<br />
than 63 microns [µm]) will settle out rapidly and do not cause a significant increase in turbidity. Sampling<br />
of the water near the receiver beaches indicates that nearshore water visibility typically ranges between 5<br />
and 20 feet; however, visibility is significantly reduced in the surf zone due to sediment disturbance from<br />
wave action and rip currents. Sediment testing has shown that the average percentage of fines in the<br />
Oceanside Littoral Cell native sediments is approximately three percent above mean sea level (MSL) and<br />
12 percent below MSL. The higher percentage of fines below MSL is attributed to the fact that finer<br />
grained materials reside at equilibrium below the shorebase. Generally, intertidal waters of the receiver<br />
beaches are characteristically turbid due to the high energy activity in the nearshore environment.<br />
Water clarity for light (transmissivity) tends to increase with distance from shore. Transmissivity levels<br />
typically range from 40 to 90 percent at depths of the borrow sites in the study area. In the June 1999<br />
survey of proposed borrow sites SO-5 and SO-7, surface water transmissivity ranged from 83.9 percent<br />
to 84.3 percent and bottom water transmissivity ranged from 64 percent to 69.6 percent.<br />
Turbidity concentrations may be substantially elevated in coastal lagoons due to shallow depths, river<br />
discharges, storm runoff, and/or algal blooms. Suspended particle concentrations of 100 mg/l were<br />
recorded just inside Batiquitos Lagoon at the same time concentrations of 20 mg/l were recorded in the<br />
adjacent nearshore during a non-storm period.<br />
Sediment Characteristics<br />
Trace metal and organic contaminants discharged into coastal waters can settle to the bottom. Finer<br />
sediments (silts and clays) generally have higher contaminant concentrations than coarser sediments (sands).<br />
Contaminants may be remobilized through strong currents, storms, or mechanical disturbance such as<br />
dredging. Thus, grain size characteristics and sediment contaminant concentrations at the borrow sites are<br />
important to the evaluation of the potential for contaminant release and turbidity during dredging.<br />
Most borrow sites are located miles from wastewater outfall point source discharges and several thousand<br />
feet from non-point source river discharges, which represent the major sources of contaminate input to the<br />
Page 3.3-4<br />
<strong>Regional</strong> <strong>Beach</strong> <strong>Sand</strong> <strong>Project</strong> <strong>EIR</strong>/<strong>EA</strong><br />
99-69\SANDAG <strong>EIR</strong><strong>EA</strong> 3.4.wpd 7/17/00
3.3 Water Resources<br />
study area. Borrow site SO-6 is the closest to an outfall point and is approximately 350 feet north of the<br />
San Elijo Wastewater outfall pipeline and greater than 4,000 feet from the outfall discharge area. The<br />
entrance to San Elijo Lagoon is approximately 4,500 feet from the dredge area. Proposed borrow sites<br />
SO-9 and MB-1 are located over three miles upcoast and inshore of wastewater outfalls and a mile or<br />
more from rivers or bays. Proposed borrow sites SO-7 and SO-5 are located more than two miles<br />
downcoast and inshore of wastewater outfalls, and 3,000 and 4,500 feet offshore lagoons, respectively.<br />
Borrow site SS-1 is located approximately 2,250 feet north of the City of San Diego outfall.<br />
As stated in Section 3.1, sampling has been performed to determine grain-size compatibility between the<br />
borrow sites and receiver sites. All material proposed to be placed would be compatible in terms of grainsize.<br />
A detailed comparison of the chemical characteristics of the borrow sites and receiver sites is<br />
provided in Table 3.3-1.<br />
Borrow Sites<br />
Proposed borrow site sediments range from very fine- to coarse-grained sand. Contaminant concentrations<br />
of metals (arsenic, cadmium, chromium, copper, lead, mercury, nickel, selenium, silver, and zinc),<br />
pesticides, polychlorinated biphenyls (PCBs), polycyclic aromatic hydrocarbons (PAHs), and phenols were<br />
non-detectable to low at all borrow sites. Percent solids ranged from 79.2 to 86.6 percent, total sulfides<br />
were 0.2 to 1.1 mg/kg, and total organic carbon concentrations ranged from 0.02 to 0.22 percent.<br />
While no regulatory criteria exist for the protection of aquatic life from exposure to potentially contaminated<br />
sediments, the National Oceanographic and Atmospheric Administration (NOAA) publishes effects-based<br />
sediment quality values for evaluating the potential for constituents in sediment to cause adverse biological<br />
effects. These values are referred to as Effects Range-Low (ER-L) and Effects Range-Median (ER-M).<br />
The ER-L concentrations indicate the low end of the range of concentrations at which adverse biological<br />
effects are observed or predicted. The ER-M values are concentrations at which effects were observed<br />
or predicted in 50 percent of the test organisms evaluated. The ER-L and ER-M concentrations are not<br />
accepted standards or criteria, but provide effects based guidelines. Contaminant concentrations in the<br />
sediment at each borrow site were compared to ER-L and ER-M values for metals and organics. None<br />
of the sediment materials exceeded the NOAA values.<br />
<strong>Regional</strong> <strong>Beach</strong> <strong>Sand</strong> <strong>Project</strong> <strong>EIR</strong>/<strong>EA</strong> Page 3.3-5<br />
99-69\SANDAG <strong>EIR</strong><strong>EA</strong> 3.4.wpd 7/17/00
3.3 Water Resources<br />
Table 3.3-1<br />
Comparison of Physical and Chemical Characteristics of the Proposed Borrow Sites and Receiver Sites<br />
Analyte<br />
Borrow Site<br />
Receiver Site<br />
(1,3)<br />
Receiver Site<br />
(1,2)<br />
Borrow Site Receiver Site (2) Receiver Site<br />
(1,2)<br />
Receiver Site (3) Receiver Site (2)<br />
SO-9 Oceanside North Carlsbad SO-7 South Carlsbad Batiquitos Leucadia<br />
<strong>Sand</strong> % 47-99 100 100 87-99 100<br />
Silt/clay % 1-53 0 0 0.05-9.7 0<br />
Mean or Median Grain Size<br />
(mm)*<br />
0.12-1.2 0.12-0.24 0.13-0.46 0.17-0.87 0.24 0.16-0.21 0.16-0.21 0.46<br />
TOC % 0.08 0.06 0.04 0.10 0.06<br />
Metals mg/kg Arsenic 1.2 0.8 0.8 1.1 0.8<br />
Cadmium
3.3 Water Resources<br />
Table 3.3-1. Continued<br />
Analyte<br />
Borrow<br />
Site<br />
Receiver<br />
Site (2)<br />
Borrow<br />
Site<br />
SO-6 Cardiff SO-5<br />
Receiver<br />
Site (2)<br />
Receiver<br />
Site (1,3)<br />
Receiver<br />
Site (1,3)<br />
Borrow<br />
Site<br />
Solana<br />
<strong>Beach</strong> Del Mar Torrey Pines MB-1<br />
<strong>Sand</strong> % 91-97 86-99 100 100 98-99 99 99 100<br />
Silt/clay % 1-3 1.3-13.8 0 0 0.1-0.4 1 0.57 0<br />
Mean or Median Grain<br />
Size (mm)*<br />
Receiver<br />
Site (1,2)<br />
Mission<br />
<strong>Beach</strong><br />
Borrow<br />
Site<br />
SS-1<br />
Receiver<br />
Site (1,3)<br />
Imperial<br />
<strong>Beach</strong><br />
0.12-0.66 0.22 0.12-0.16 0.15 0.15-0.21 0.12-0.17 0.44-0.63 0.27 0.28 0.16-0.64<br />
TOC % 0.07 0.04 0.05 0.05 0.02 0.06 0.22 0.19<br />
Metals mg/kg Arsenic 1.6 1.1 0.7 0.8 0.8 0.9 0.7 1.5<br />
Cadmium
3.4 Biological Resources<br />
3.4 BIOLOGICAL RESOURCES<br />
This section presents a summary of the biological technical report which is included in Appendix D. First,<br />
the methods are described (Section 3.4.1). This is followed by a regional review of biological resources,<br />
both marine and terrestrial (Section 3.4.2). The biological resources of each receiver site are described<br />
in Section 3.4.3, and the borrow site resources are described in Section 3.4.4. One issue raised during<br />
the NOP period was potential impacts to commercial fisheries. Both the socioeconomic and biological<br />
issues associated with this topic are addressed in Sections 3.8 and 4.8.<br />
3.4.1 Data Collection Methods<br />
The technical approach included coordination with regulatory and resource agency personnel; offshore<br />
surveys at selected borrow sites; surveys of the beach receiver sites; consultation with technical experts,<br />
representatives from local fishing organizations, and local divers and fishermen; and literature and data<br />
review. Coordination efforts are summarized in Chapter 7.0 of this <strong>EIR</strong>/<strong>EA</strong> as well as Appendix D. An<br />
overview of the survey method is provided below for receiver and borrow sites.<br />
Receiver Site Surveys<br />
Intertidal surveys were conducted at each of the alternative receiver sites to map and describe habitat<br />
characteristics. Of particular interest was the occurrence of hard substrate, the relative quality of habitats,<br />
and occurrence of sensitive resources. The intertidal zone is defined as the area between the highest high<br />
tide and the lowest low tide and can be divided into three areas (upper, middle, and lower) based on the<br />
frequency and duration of inundation by seawater. The intertidal zone is also characterized by breaking<br />
surf. Shallow subtidal zone is defined as the area between the lower intertidal and the inner shelf zone. The<br />
inner shelf zone is defined as the subtidal zone between -30 feet and -80 feet MLLW.<br />
Receiver sites were visited during spring lower low tides so that the intertidal zone was well exposed. All<br />
sites were surveyed early morning between May 17 and May 20, 1999. Brief visits were made June 15<br />
through 17, 1999 at selected sites to augment the description of those sites. At the time of the June 1999<br />
visits, it was noted that there had been build up of sand on the beaches, and that some of the hard substrate<br />
areas noted in May 1999 were buried by sand. Sites where hard substrate had been noted in June were<br />
re-surveyed July 13 through 15, 1999. The re-surveyed locations included the South Carlsbad South,<br />
Solana <strong>Beach</strong>, and Torrey Pines receiver sites. The Leucadia receiver site was first surveyed in July 1999.<br />
<strong>Regional</strong> <strong>Beach</strong> <strong>Sand</strong> <strong>Project</strong> <strong>EIR</strong>/<strong>EA</strong> Page 3.4-1<br />
99-69\SANDAG <strong>EIR</strong><strong>EA</strong> 3.4.wpd 7/17/00
3.4 Biological Resources<br />
During the beach surveys, the distribution of sand versus hard substrate habitat within the intertidal zone<br />
was mapped. Survey teams measured the length and width of all hard substrate areas relative to distance<br />
from the northern site boundary. Photographs of representative views of the beach habitats were taken.<br />
The depth of sand, up to a depth of four feet, was measured within upper, mid, and low intertidal zones at<br />
several locations along the beach using a one-quarter inch diameter calibrated rod. At selected locations<br />
the rod was pushed into the sand up to four feet deep or to the point of refusal (until it hit something that<br />
prevented further penetration like a rock or reef) whichever occurred first. There were at least nine sample<br />
locations at each receiver site. The focus of the sand depth measurements was to identify occurrence of<br />
habitat for various organisms and egg laying by California grunion. Since those habitat functions typically<br />
occur within sand depths ranging up to two to three feet, depths greater than four feet were not measured.<br />
R<br />
R<br />
The sand substrate was further characterized by examination of organisms living within upper, mid, and low<br />
intertidal zones. Shovel samples (up to 24 inches deep or refusal) were collected from the three intertidal<br />
zones at three locations corresponding to near the northern boundary, near the middle, and near the<br />
southern boundary of each site. The sides and interior of the holes were examined for marine organisms<br />
(e.g., grunion eggs, sand crabs, worms, clams, etc.). <strong>Sand</strong> removed from the holes was sieved through a<br />
1 mm screen to assist the evaluation of the presence of marine organisms. The wave wash area was<br />
examined for sign of sand crabs (i.e., v-shaped antennae extended), clams, and sand dollars.<br />
The hard substrate areas were described according to type (e.g., cobble, boulders, rock bench) and relief<br />
height. Relief was defined in a manner consistent with previous Navy documentation. Pursuant to the<br />
previous Navy documentation, low relief was defined as being less than three feet in height and high relief<br />
was defined as being greater than three feet in height (Department of the Navy 1997a, 1997b). Animals<br />
and plants living on hard substrate areas were identified consistent with the previous Navy studies, and their<br />
relative abundance was noted.<br />
Intertidal and Subtidal Surveys<br />
Inshore surfgrass beds located between Oceanside and Torrey Pines were surveyed during extreme minus<br />
tides (-1.8 to -2.1 MLLW) on January 21 and 22, 2000. Differential Global Positioning System (DGPS)<br />
coordinates were taken at the onshore-offshore and upcoast-downcoast edges of exposed surfgrass beds.<br />
Beds were delineated by biologists and plotted using DGPS.<br />
Page 3.4-2<br />
<strong>Regional</strong> <strong>Beach</strong> <strong>Sand</strong> <strong>Project</strong> <strong>EIR</strong>/<strong>EA</strong><br />
99-69\SANDAG <strong>EIR</strong><strong>EA</strong> 3.4.wpd 7/17/00
3.4 Biological Resources<br />
Surveys for nearshore reefs were conducted in areas where the model indicated the potential for more<br />
persistent sand deposition and where resources had not been mapped or where mapping identified hard<br />
substrate, but that substrate was unquantified or uncharacterized. Surveys also validated data from various<br />
sources including prior mapping performed by the Navy and information from commercial fisherman (at<br />
selected locations). These surveys were conducted January 18 through 25, 2000. The purpose of these<br />
surveys was to quantify the hard substrate, determine relief heights of the hard substrate, and determine the<br />
presence or absence of reef indicator species. The indicator species were selected in consultation with the<br />
resource and regulatory agencies to be consistent with the U.S. Navy’s previous resource mapping for the<br />
project. The indicator species included surfgrass (Phyllospadix spp.), giant kelp (Macrocystis pyrifera),<br />
feather boa kelp (Egregia menziesii), sea palms (Eisenia arborea), and sea fans (Muricea spp.). All of<br />
these species are perennial, although feather boa kelp occur in locations where scour and other ocean<br />
process result in high (yearly or less) morbidity. Feather boa are extremely quick to recolonize.<br />
Additionally, the occurrence of non-vegetated hard substrate or substrate vegetated only with opportunistic<br />
coralline algal turf was noted. The relative abundance of indicator species was noted as abundant,<br />
common, or sparse similar to that for the receiver site surveys.<br />
Hard substrate on nearshore reefs in intertidal and shallow, inshore areas were assessed by walking the<br />
beach during extreme minus tides (-1.4 to -2.1 MLLW) between January 18 and 20, 2000. Next, subtidal<br />
hard substrates were mapped according to location and relief height using side-scan sonar from January<br />
22 to 25, 2000. Following the side-scan sonar work, biologists using S.C.U.B.A. dove on the sonaridentified<br />
hard substrates and noted reef heights and presence of indicator species and/or coralline algal turf.<br />
Divers swam transects to complete map coverage between side-scan sonar and minus tide survey limits.<br />
They also swam transects to map an area off Solana <strong>Beach</strong> where kelp canopy cover had interferred with<br />
operation of the side-scan sonar. Divers deployed buoys to mark reef edges and dramatic changes in<br />
resource development (e.g., surfgrass versus non-surfgrass areas), and DGPS readings of the buoy<br />
locations were recorded. The dives were conducted from January to March 2000. Maps were prepared<br />
of the surveyed areas that included the extent of all hard substrate within the survey area, relief heights, and<br />
the recorded biological notes. The dimensions of the hard substrate areas were measured to provide<br />
acreage according to biological resource categories.<br />
Borrow Site Surveys<br />
Offshore surveys were conducted at proposed borrow sites S0-7 and SO-5 to obtain representative<br />
information on the offshore habitats. To assist in the evaluation of potential borrow site impacts, a survey<br />
<strong>Regional</strong> <strong>Beach</strong> <strong>Sand</strong> <strong>Project</strong> <strong>EIR</strong>/<strong>EA</strong> Page 3.4-3<br />
99-69\SANDAG <strong>EIR</strong><strong>EA</strong> 3.4.wpd 7/17/00
3.4 Biological Resources<br />
effort was also undertaken at the Surfside/Sunset <strong>Beach</strong> borrow sites in Orange County that have been<br />
continually used for beach replenishment since the late 1970s. Three existing borrow sites that were used<br />
in 1979, 1990, and 1997 were surveyed so that comparisons could be made between dredge areas that<br />
differed in time from disturbance. Additionally, an unaffected “control” area was sampled in the vicinity.<br />
The surveys were conducted between June 23 through 25, 1999. The proposed borrow sites in San Diego<br />
County (SO-7 and SO-5) and the existing borrow sites in Orange County were surveyed with identical<br />
methods.<br />
Continuous water quality (pH, dissolved oxygen, temperature, salinity, transmissivity) measurements were<br />
made from the surface to the bottom at the borrow site locations using a Seabird water quality analyzer.<br />
Fish and benthic macroinvertebrates were collected using a 25-foot headrope otter trawl. Two trawl<br />
samples (10 minute tows) were collected at each study station. Two SCUBA diving biologists swam<br />
transects at each of the stations and recorded observations of fish and benthic macroinvertebrates. Divers<br />
collected samples for infaunal and sediment analysis. Grain size distribution and total organic carbon were<br />
analyzed in the laboratory using standard methods. Infaunal samples were processed according to standard<br />
protocols for collecting and identifying the small organisms that reside in the sediment.<br />
Literature and Data Review<br />
Several sources of information were used to augment description of existing conditions and to evaluate<br />
potential impacts from the project. Primary data sources for existing conditions included water quality<br />
monitoring data from NPDES wastewater ocean monitoring programs conducted in San Diego County;<br />
physical and chemical characterization of borrow site sediments (Sea Surveyor, Inc. 1999); habitat maps<br />
prepared by the Department of the Navy (1997a, 1997b); input on resource maps by representatives of<br />
commercial fishing organizations (Guth 1999); field surveys conducted by MEC for this project; fishing<br />
catch records obtained from the CDFG; sensitive bird species monitoring data from the USFWS; and<br />
monitoring studies currently being conducted in the project area for the Navy in rocky intertidal, subtidal<br />
reef, and kelp bed habitats.<br />
3.4.2 <strong>Regional</strong> Overview<br />
The project area is within the larger zoogeographic zone known as the warm temperate or Southern<br />
California Bight, whose boundaries span from Point Conception, California to Punta Eugenia, Baja<br />
California. The distributions of species within the Bight are related to the complex hydrography and<br />
Page 3.4-4<br />
<strong>Regional</strong> <strong>Beach</strong> <strong>Sand</strong> <strong>Project</strong> <strong>EIR</strong>/<strong>EA</strong><br />
99-69\SANDAG <strong>EIR</strong><strong>EA</strong> 3.4.wpd 7/17/00
3.4 Biological Resources<br />
geology of the region. The mainland shelf, which extends from shore to approximately -650 feet MLLW,<br />
comprises six percent of the 40,000-square mile Bight. There are no sensitive or endangered infauna<br />
species in the Bight. There are also smaller Sub-bights and the project is within the Sub-bights of<br />
Oceanside, Mission <strong>Beach</strong>, and Imperial <strong>Beach</strong> (also littoral cells).<br />
The primary habitat of the offshore borrow sites is marine open water. <strong>Sand</strong>y substrates characterize the<br />
bottom in the vicinity of the borrow sites; however, hard substrate may support sensitive indicator species<br />
such as sea fans, feather boa kelp, and/or giant kelp. <strong>Sand</strong> and hard substrate bottoms characterize<br />
nearshore and intertidal habitats within, and adjacent to, the receiver sites.<br />
The following text provides an overview of the soft bottom and hard bottom communities which generally<br />
occur in or adjacent to proposed borrow or receiver sites. This is followed by an overview of the mammals<br />
(marine and terrestrial), and bird species which occur throughout the project area. A detailed description<br />
of each individual receiver site and borrow site, in terms of both resources within the footprint and nearby,<br />
is provided in Section 3.4.3.<br />
Soft Bottom Communities<br />
The benthos is a general term referring to those organisms that live in (infauna), on (epibenthic), or near<br />
(demersal) the seafloor. Benthic habitats along the mainland shelf of the Bight can be divided into soft and<br />
hard bottom substrates. Each harbors a distinct and characteristic community, which varies with many<br />
environmental variables but especially water depth and substrate type. The descriptions are organized<br />
generally from the intertidal zone seaward.<br />
Benthic Invertebrates<br />
The soft-bottom substrates of the mainland shelf include over 5,000 species of invertebrates. Biological<br />
diversity is generally related to the complexity of habitats, water depth, sediment grain size, nutrients,<br />
contaminants, shelf width, and distance from shoreline. Benthic communities can be affected by seasonal<br />
change and episodic winter storms (waves and rain) which physically disrupt bottom communities.<br />
Soft bottom infaunal communities have similar characteristics for a given water depth, sediment type, and<br />
wave energy. Thus, sandy infaunal communities off of Oceanside are similar to those found at similar<br />
depths and bottom type off of Imperial <strong>Beach</strong>. The infaunal zone is classified into general regions, including<br />
<strong>Regional</strong> <strong>Beach</strong> <strong>Sand</strong> <strong>Project</strong> <strong>EIR</strong>/<strong>EA</strong> Page 3.4-5<br />
99-69\SANDAG <strong>EIR</strong><strong>EA</strong> 3.4.wpd 7/17/00
3.4 Biological Resources<br />
shallow subtidal to a depth of about -30 feet MLLW, an inner shelf zone from about -30 to -80 feet<br />
MLLW, middle shelf from about -80 to -300 feet MLLW, and outer shelf zone from about -300 to -600<br />
feet MLLW.<br />
<strong>Sand</strong>y beaches represent unstable habitats with seasonal cycles of sand deposition and erosion. Common<br />
invertebrates observed on San Diego County sandy beaches include beach hoppers (Orchestodea spp.),<br />
sand crabs (Emerita analoga), bean clams (e.g., Donax gouldii), olive snails (Olivella biplicata), and<br />
polychaete worms (e.g., Euzonus spp., Lumbrineris spp., Nephtys californiensis, Scololepis spp.,<br />
Scoloplos spp.).<br />
Bottom-dwelling species in the shallow subtidal zone are well adapted to shifting sediments and turbidity,<br />
with suspension feeders being the dominant group. Species common in sandy-bottom, nearshore areas<br />
off Oceanside include the polychaete (Apoprionospio pygmaea), bean clam (Donax gouldii), amphipod<br />
(Mandibulophoxus uncirostratus), and nemerteans. Similar species would be expected in nearshore<br />
sandy substrates offshore all receiver sites.<br />
The proposed borrow sites fall within the inner shelf zone which is routinely disrupted by wave activity and<br />
oceanic swell. The number of species and abundances of bottom dwelling macroinvertebrates is quite low<br />
in the inner shelf compared to the middle and outer shelf depth zones. Polychaete worms and/or small,<br />
mobile crustaceans dominate the inner to middle shelf infaunal community.<br />
Fish<br />
Speckled sanddabs (Citharichthys stigmaeus) are the most abundant fish species of the inner shelf with<br />
only a few individuals found in the middle shelf zone. Fish commonly found on the bottom in sandy subtidal<br />
habitat (less than 30 feet) off San Diego County beaches include: halibut (Paralichthys californicus),<br />
speckled sanddab, bat ray (Myliobatus californica), and shovelnose guitarfish (Rhinobatos productus).<br />
Northern anchovy (Engraulis mordax), jack mackerel (Trachurus symmetricus), and Pacific bonito<br />
(Sarda chiliensis) are commonly encountered in the water column just beyond the surfzone.<br />
The California grunion (Leuresthes tenuis) is common south of Point Conception, California, to Magdalena<br />
Bay, Baja California, in nearshore waters from the surf to a depth of 60 feet. Grunion travel from their<br />
habitat in nearshore waters to specific sandy beaches just after certain full and new moons in conjunction<br />
with their spawning. Grunion on San Diego beaches are typically found on the long, gently sloping beaches<br />
Page 3.4-6<br />
<strong>Regional</strong> <strong>Beach</strong> <strong>Sand</strong> <strong>Project</strong> <strong>EIR</strong>/<strong>EA</strong><br />
99-69\SANDAG <strong>EIR</strong><strong>EA</strong> 3.4.wpd 7/17/00
3.4 Biological Resources<br />
with moderately fine grain size. Grunion are managed as a game species by the California Department of<br />
Fish and Game. Their spawning season occurs from March to August.<br />
Hard Bottom Communities<br />
Rocky habitats often are very productive ecosystems that support a variety of plants and animals. Hard<br />
bottom habitats include rocky intertidal shores and hard bottom subtidal reef. (The intertidal zone is the<br />
area between the highest high tide and the lowest low tide. Areas that are permanently inundated are<br />
defined as subtidal.) Approximately 14 percent of the coastline in San Diego County is estimated to be<br />
rocky, but the distribution of subtidal reefs is less well known than the rocky intertidal because large-scale<br />
mapping studies have not been undertaken. The proportion of hard substrate habitat at any given time<br />
relates to the amount of sand in the littoral cell and relief height. An increase in the proportion of hardbottom<br />
habitat may be occurring in conjunction with sand loss and degradation of beaches by erosion.<br />
Several physical factors influence the types and diversity of marine life associated with rocky habitats.<br />
Important substrate qualities include relief height (low, high), texture (smooth, pitted, cracked), size, and<br />
composition (sandstone, mudstone, basalt, granite). Substrates that are of higher relief, greater texture, and<br />
size generally have the richest assemblages of marine species. Cobbles, which roll and move about within<br />
the wash zone, are dangerous to small organisms and empty of life. Rocks and reefs of low height are<br />
subjected to seasonal burial and uncovering associated with the onshore and offshore migration of sand.<br />
Such low lying substrate tends to be devoid of organisms and is dominated by opportunistic annuals or sand<br />
tolerant species. The hardness of the substrate also is important; organisms growing on soft rock substrates<br />
(e.g., mudstones, sandstones) may be dislodged when water movement fractures or erodes the rock.<br />
In addition to relationship with substrate characteristics, marine life also differs with water level. The upper<br />
intertidal or splash zone is characterized by simple green algae (Chaetomorpha, Enteromorpha, Ulva),<br />
barnacles (Cthamalus), limpets (Collisella, Lottia), and periwinkles (Littorina). Coralline algae<br />
(Corallina spp.) is a dominant algae on low relief rocky substrate in the mid-to-low intertidal zone.<br />
Intertidal substrates less influenced by sand burial and abrasion often support California mussel (Mytilus<br />
californus), gooseneck barnacle (Pollicipes polymerus), aggregating sea anemones (Anthopleura<br />
elegantissima), hermit crabs (e.g., Pagurus), a variety of snails (e.g., Lithopoma, Kelletia, Tegula),<br />
chitons (e.g., Mopalia), and annual species of algae.<br />
Along the northern coast of San Diego County, the most common algae on exposed rocky substrate are<br />
coralline algal turf and seasonal species that can develop rapidly whenever a surface is free from sand, but<br />
<strong>Regional</strong> <strong>Beach</strong> <strong>Sand</strong> <strong>Project</strong> <strong>EIR</strong>/<strong>EA</strong> Page 3.4-7<br />
99-69\SANDAG <strong>EIR</strong><strong>EA</strong> 3.4.wpd 7/17/00
3.4 Biological Resources<br />
many do not persist. Opportunistic species such as the feather boa kelp (Egregia menziesii), which more<br />
commonly occurs as a subtidal canopy, actively recruits to intertidal habitats on exposed rock, but rarely<br />
lives more than a year due to sand scouring, sun burn, density-dependent self-thinning, and competitive<br />
exclusion.<br />
Persistent substrates in the low tidal zone and minus tide zone are characterized by a greater diversity of<br />
plants and animals including coralline algae, other red algae, brown algae, surfgrass (Phyllospadix), green<br />
sea anemones (Anthopleura xanthogrammica), purple sea urchins (Strongylocentrotus purpuratus),<br />
California sea hares (Aplysia californica), snails, sponges, and starfish (Asterina miniata, Pisaster spp.).<br />
Wooly sculpin (Clinocottus analis) is one of the more commonly encountered fish in tidepools.<br />
Subtidal reefs in the shallow nearshore also exhibit considerable variation in resource development<br />
associated with the seasonal onshore and offshore migration of sand, and similar to intertidal reefs, substrate<br />
factors such as relief height, texture, composition, and size largely determine resource development on<br />
nearshore reefs. Higher relief reefs typically support more diverse communities that include perennial<br />
species such as sea fans (Muricea), sea palms (Eisenia arborea), sponges, nudibranchs, and sea stars,<br />
and harbor and attract a variety of fish such as garibaldi (Hypsypops rubicunda), blacksmith (Chromis<br />
punctipinnis), and black perch (Embiotoca jacksoni). In striking contrast, very low relief areas exhibit<br />
reduced species diversity consisting mainly of opportunistic and annual turf vegetation.<br />
Surfgrass is a key species of an important vegetated community that ranges from intertidal to -20 feet<br />
MLLW. In southern California, surfgrass serves as a nursery for the California spiny lobster. Surfgrass,<br />
which is a long-lived perennial species, persists in rocky areas with shifting sand by having an extensive root<br />
system that binds with sand and having leaves that are tolerant of sand abrasion. However, while surfgrass<br />
may tolerate wet sand cover for many months, the duration and depth of burial that would result in<br />
morbidity has not been studied. Incremental sand burial has been reported to affect blade growth.<br />
Surfgrass recovery rates are slow (three to five years) when recovering from removal of the root mat, but<br />
may be quicker when the rhizomes remain intact. Surveys undertaken in January and February 2000<br />
identified and mapped approximately 42 acres of surfgrass in the intertidal from Oceanside to Torrey Pines<br />
(Appendix D). While the acreage in the nearshore was not surveyed by this method and is not field<br />
verified, hard substrate patterns suggest at least that same amount, and probably more, are present in the<br />
nearshore. This total surfgrass acreage off the North County San Diego shoreline is estimated at 80 to 100<br />
acres.<br />
Page 3.4-8<br />
<strong>Regional</strong> <strong>Beach</strong> <strong>Sand</strong> <strong>Project</strong> <strong>EIR</strong>/<strong>EA</strong><br />
99-69\SANDAG <strong>EIR</strong><strong>EA</strong> 3.4.wpd 7/17/00
3.4 Biological Resources<br />
As one moves further offshore to depths where seasonal sand movement is less, hard substrates do not<br />
need to have as high a relief to support perennial species. Kelp beds are an important habitat associated<br />
with offshore reefs. The kelp community, dominated by giant kelp (Macrocystis pyrifera), ranges from<br />
water depths of about -20 feet to -120 feet MLLW. It is a unique habitat that provides food, shelter,<br />
substrate, and nursery areas for many species of fish and invertebrates. Invertebrates found in kelp beds<br />
include lobster, sea stars, sea urchins, and mollusks. Brown, green, and red (fleshy and coralline) algae<br />
occur in kelp beds. Surfperch, rockfish (Sebastes spp.), and wrasses (senorita, rock wrasse and<br />
sheephead) are usually the dominate fish type.<br />
Kelp beds also provide a large food supply for marine birds and mammals. Cormorants are the birds most<br />
closely associated with California kelp beds; however, gulls commonly scavenge on the surface canopy,<br />
and pelicans and terns exploit schooling fish along the canopy's edge. Mammals such as sea lions, seals,<br />
and whales use kelp beds as transitory foraging areas. The giant kelp is commercially harvested for use<br />
in a variety of food products, pharmaceuticals, adhesives, paper products, paints and finishes, rubbers, and<br />
textiles.<br />
Giant kelp is adversely affected by sedimentation and turbidity. Large amounts of shifting sediment can<br />
scour the bottom, bury small plants, and prevent settling of microscopic spores, all of which can reduce the<br />
cover in the number of adult plants. Giant kelp is one of the first species to be eliminated in physically<br />
stressed habitats (wave or sand scour). The density and abundance of kelp canopy varies by location,<br />
season, and year. Kelp beds in southern California commonly deteriorate to some degree during summer<br />
and fall when temperatures are higher and nutrient concentrations are lower. El Niño conditions, which<br />
result in higher than average temperatures and low nutrients have been linked to periodic and widespread<br />
reductions in kelp canopy. Kelp beds in northern San Diego County are in the process of recovering from<br />
the recent 1997/1998 El Niño.<br />
Mammals<br />
Both marine and terrestrial mammals occur in the project area.<br />
Marine<br />
Several species of mammals occur in nearshore waters adjacent to the receiver sites and in offshore waters<br />
near the borrow sites. California sea lions (Zalophus californicanus) and harbor seals (Phoca vitulina)<br />
<strong>Regional</strong> <strong>Beach</strong> <strong>Sand</strong> <strong>Project</strong> <strong>EIR</strong>/<strong>EA</strong> Page 3.4-9<br />
99-69\SANDAG <strong>EIR</strong><strong>EA</strong> 3.4.wpd 7/17/00
3.4 Biological Resources<br />
are found in these waters and may, occasionally, use the beach (Department of the Navy 1997a, 1997b).<br />
Common dolphins (Delphinus delphis) and bottlenose dolphins (Tursiops truncatus) occur in the surfzone<br />
and in offshore waters. Pacific white-sided dolphins (Lagenorhynchus obliquidens) and Risso’s dolphins<br />
(Grampus griseus) also are known to occur seasonally in southern waters of the Bight.<br />
California gray whales (Eschrichtius robustus) migrate through the study area. The southbound migration<br />
through the Bight begins in December and lasts through February; the northbound migration is February<br />
through May. Gray whales migrate up to 125 miles offshore along three pathways through the Bight. The<br />
project area lies within the nearshore migration path, which extends from the shoreline to approximately<br />
12 miles offshore.<br />
Terrestrial<br />
Several of the receiver sites are located near urban development and/or have bluffs. Common mammal<br />
species with the potential to occur in the vicinity of receiver sites in the project area include gophers<br />
(Thomomys bottae sanctidiegi), mice (e.g., Mus musculus), black rats (Rattus rattus), Norway rats<br />
(Rattus norvegicus), opossum (Didelphis virginiana), rabbits (Sylvilagus spp.), California ground<br />
squirrel (Spermophilus beecheyi nudipes), raccoon (Procyon lotor psora), and striped skunks (Mephitis<br />
mephitis holzneri). None of these species are listed as threatened or endangered by the federal or state<br />
government.<br />
Birds<br />
The southern California coastline is a diverse habitat for migrant and resident birds. The proposed beach<br />
sites and nearshore waters provide a variety of areas for seabirds to roost and forage. <strong>Sand</strong>y/cobblestone<br />
upper tidal beaches are utilized by gulls and shorebirds as roosts (resting-places). However, cobblestone<br />
areas in the intertidal are not typical feeding areas for shorebirds. Probing shorebirds will forage upon<br />
invertebrates in the damp, sandy middle and lower tidal zones. Kelp and surfgrass that have washed ashore<br />
are good foraging areas for gulls, shorebirds, and even some passerines, as they harbor and are fed upon<br />
by invertebrates. Other areas of rocky/reef substrates provide tide pools filled with marine animals for<br />
foraging gulls and shorebirds. The nearshore ocean accommodates birds such as gulls, pelicans, terns, and<br />
cormorants, which prey upon the schooling fish and other marine organisms below.<br />
Page 3.4-10<br />
<strong>Regional</strong> <strong>Beach</strong> <strong>Sand</strong> <strong>Project</strong> <strong>EIR</strong>/<strong>EA</strong><br />
99-69\SANDAG <strong>EIR</strong><strong>EA</strong> 3.4.wpd 7/17/00
3.4 Biological Resources<br />
Also within the project area are inlets for several lagoons, estuaries, and bays. These coastal ecosystems<br />
are havens for a huge diversity of birds due to their varied habitat. The shallow water and shoreline provide<br />
roosting, foraging, and nesting areas for such birds as ducks, terns, shorebirds, pelicans, cormorants, gulls,<br />
herons, raptors (such as ospreys and northern harriers), and various passerines in the surrounding<br />
vegetation. Some of these wetlands also provide rest stops for migrating birds along the Pacific Flyway.<br />
Over 70 species of birds are known or expected to occur in the project area (Appendix D). Because of<br />
the proximity of some receiver sites to coastal inlets, species associated with wetlands have the potential<br />
for occurrence at some beach receiver sites. Threatened and endangered bird species with known or<br />
expected occurrence in the project area include California brown pelican, California least tern, western<br />
snowy plover, and American peregrine falcon (described below). The locations of California least tern and<br />
western snowy plover nesting sites are shown in Figure 3.4-1.<br />
California Brown Pelican<br />
The California brown pelican is a protected species in California and is listed as endangered by both the<br />
federal and state government. They are found in the open ocean and other coastal salt waters along the<br />
southern California coast throughout the year. This species is tolerant of human activity near its daytime<br />
roosts and readily utilizes various man-made structures (e.g., piers, breakwaters, buoys) as roosting sites.<br />
Known breeding locations include offshore islands such as Anacapa and Santa Barbara Islands in southern<br />
California and islands off the coast of northwestern Baja California, Mexico.<br />
California Least Tern<br />
The California least tern (Sterna antillarum browni) has been listed as endangered federally and by the<br />
state since 1972. This small tern nests in colonies along the southern California coast on sandy beaches<br />
with sparse vegetation. It forages in shallow ocean water, generally less than 60 feet deep and within one<br />
mile of shore, and in wetlands nearby these nesting habitats. Wetland destruction and human developments<br />
along the coastline have impacted least tern’s nesting habitats, as well as their foraging resources.<br />
The San Diego nesting sites are located as far north as Marine Corps Base (MCB) Camp Pendleton and<br />
extend southward to the United States/Mexico border. Nest locations are on the beaches of MCB Camp<br />
Pendleton near the Santa Margarita River mouth, around Mission Bay, and the greatest number of sites are<br />
found around San Diego Bay. Other nests were found in Batiquitos and San Elijo Lagoons. The least tern<br />
<strong>Regional</strong> <strong>Beach</strong> <strong>Sand</strong> <strong>Project</strong> <strong>EIR</strong>/<strong>EA</strong> Page 3.4-11<br />
99-69\SANDAG <strong>EIR</strong><strong>EA</strong> 3.4.wpd 7/17/00
4.0 Environmental Consequences<br />
L<strong>EA</strong>ST TERN<br />
SNOWY PLOVER<br />
TERN AND PLOVER<br />
B<strong>EA</strong>CH REPLENISHMENT SITES<br />
OFFSHORE BORROW SITES<br />
SAND DELIVERY PIPELINES<br />
Source: SANDAG<br />
NORTH<br />
Figure 3.4-1<br />
Nesting Locations of<br />
California Least Tern and Western Snowy Plover<br />
<strong>Regional</strong> <strong>Beach</strong> <strong>Sand</strong> <strong>Project</strong> <strong>EIR</strong>/<strong>EA</strong><br />
9969 SANDAG <strong>Beach</strong> Replenishment/Figures/Fig 3.4-1 Nesting Locations 9/15/99<br />
Page 3.4-12
3.4 Biological Resources<br />
nesting season is April 1 to September 15. Least tern’s usually feed in waters within a two-mile radius of<br />
their nesting site, but observations suggest the tern’s opportunistic foraging can take it as far as five miles<br />
away.<br />
Western Snowy Plover<br />
The western snowy plover (Charadrius alexandrinus nivosus) was listed as threatened in 1997. Their<br />
decline is a result of loss of nesting habitat due to coastal development and recreational activities. Along<br />
the southern California coast, snowy plovers nest on bay fill and beaches around bays and lagoons, spits<br />
and alkali flats at river mouths, and on salt evaporators. Plovers typically forage in areas with little or no<br />
human activity and avoid areas of high human use. They prefer to forage on sandy beaches with kelp<br />
washed ashore. The San Diego region supports 26 percent of the estimated breeding pairs on the<br />
California coast.<br />
R<br />
R<br />
R<br />
R<br />
A cluster of nest sites are located around the mouth of the Santa Margarita River on MCB Camp Pendleton<br />
and around the San Diego Bay. The other nests are spread out in between those two sites on Carlsbad<br />
State <strong>Beach</strong>/Agua Hedionda Lagoon; around Batiquitos, San Elijo, San Dieguito, and Los Peñasquitos<br />
Lagoons; and along Mission <strong>Beach</strong> and Bay. Snowy plovers forage close to their nests probing in the sand<br />
for invertebrates or running along the sand snatching up insects in the air. The nesting season extends from<br />
March 1 to September 15.<br />
American Peregrine Falcon<br />
The American peregrine falcon (Falco peregrinus anatum) was listed by the federal and state<br />
governments as an endangered species in 1970. On August 25, 1999, the USFWS removed the American<br />
peregrine falcon from the Endangered Species List, although it currently remains on the state endangered<br />
species list. Current nesting locations include the San Diego metropolitan area and Point Loma. Preferring<br />
to hunt along larger waterways and coastal areas, particularly where large numbers of shorebirds and<br />
waterfowl congregate, peregrine falcons likely utilize the project area on an occasional basis.<br />
<strong>Regional</strong> <strong>Beach</strong> <strong>Sand</strong> <strong>Project</strong> <strong>EIR</strong>/<strong>EA</strong> Page 3.4-13<br />
99-69\SANDAG <strong>EIR</strong><strong>EA</strong> 3.4.wpd 7/17/00
3.4 Biological Resources<br />
3.4.3 Receiver Sites<br />
Intertidal habitats at proposed receiver sites were mapped between May and July 1999 and January<br />
through March 2000. Extensive habitat mapping was conducted by the U.S. Navy in 1997 and focused<br />
subtidal surveys were conducted in January and March 2000. Rocky substrate areas mapped in<br />
1999/2000 corresponded well to 1997 map information.<br />
The proximity of the receiver sites to reefs and/or kelp beds located further offshore was considered for<br />
each site because the project has the potential to result in impacts associated with increased turbidity and<br />
sediment transport. Historical maps of nearshore resources, additional map information provided by<br />
commercial fishermen, and representative photographs of the receiver sites are provided in Appendix D.<br />
The receiver sites are characterized by varying combinations of sand and cobble. Receiver sites at South<br />
Oceanside, Del Mar, and Mission <strong>Beach</strong> are almost entirely sand habitats. <strong>Sand</strong> habitat is inhabited by<br />
worms, sand crabs, crustaceans, and bean clams. Other sites have hard substrate in the form of cobbles,<br />
rock revetment, rock, or sandstone bench with various resource development. The Cardiff, Torrey Pines,<br />
and Imperial <strong>Beach</strong> receiver sites are predominantly cobble. Sites in Carlsbad, elsewhere in Encinitas, and<br />
Solana <strong>Beach</strong> have sand plus cobble bands of varying widths and density. Each of the 13 receiver sites<br />
is described below in terms of species and habitat identified within the receiver sites boundaries (i.e.,<br />
footprint) and nearby sensitive resources. Sensitive resources are defined at the habitat level to include<br />
vegetated nearshore reefs and kelp beds, and at the species level to include protected, and/or threatened<br />
and endangered species. The types of habitats observed and expected at the receiver sites and nearshore<br />
in the vicinity are summarized in Table 3.4-1. This table reflects data from past Navy analyses (1995,<br />
1997a, 1997b), field work in 1999 and 2000, and input from local commercial fisherman.<br />
Nearshore habitats adjacent to the beach replenishment sites support invertebrates, fish, algae, surfgrass,<br />
kelp, mammals, and foraging birds. Communities of invertebrates and fish that inhabit the nearshore areas<br />
are determined by the type of bottom substrate (sandy or hard-substrate) and the presence of kelp or<br />
surfgrass. Nearshore habitats adjacent to the receiver sites are sandy bottom, with varying amounts of hard<br />
substrate at several of the sites. Hard substrate with surfgrass or kelp occur offshore several of the sites.<br />
Vegetated areas are functional habitats, supporting associated fishes and invertebrates.<br />
Page 3.4-14<br />
<strong>Regional</strong> <strong>Beach</strong> <strong>Sand</strong> <strong>Project</strong> <strong>EIR</strong>/<strong>EA</strong><br />
99-69\SANDAG <strong>EIR</strong><strong>EA</strong> 3.4.wpd 7/17/00
3.4 Biological Resources<br />
Table 3.4-1<br />
Summary of Habitats at the Proposed and<br />
Alternative Receiver Sites and in the Nearshore Vicinity<br />
Receiver<br />
Site Intertidal Subtidal to -10 ft MLLW -11 to -20 ft MLLW -20 to -30 ft MLLW<br />
Proposed Sites<br />
Oceanside<br />
North<br />
Carlsbad<br />
South<br />
Carlsbad<br />
North<br />
South<br />
Carlsbad<br />
South<br />
Batiquitos<br />
<strong>Sand</strong>, localized 100% cobble,<br />
one high relief rock (about 6<br />
ft wide), rip-rap revetment<br />
at back beach<br />
<strong>Sand</strong>, 30 to 100% cobble<br />
bands 14 to 65 ft seaward, 5<br />
to 25% cobble bands seaward<br />
of denser cobble<br />
<strong>Sand</strong>, 30 to 100% cobble<br />
bands 19 to 100 ft seaward,<br />
5 to 25% cobble bands<br />
seaward of denser cobble,<br />
localized rip-rap revetment<br />
at back beach<br />
<strong>Sand</strong>, 30 to 100% cobble<br />
bands 25 to 50 ft seaward, 5<br />
to 25% cobble bands from<br />
25 to 105 ft seaward,<br />
localized low relief reef 230<br />
ft seaward<br />
<strong>Sand</strong>, 30 to 100% cobble<br />
bands up to 80 ft seaward, 5<br />
to 25% cobble bands about<br />
25 ft seaward of denser<br />
cobble<br />
Leucadia <strong>Sand</strong>, localized 50 to 100%<br />
cobble bands 50 ft seaward, 3<br />
to 20% cobble up to 80 ft<br />
seaward, scattered low relief<br />
rock without marine life<br />
Moonlight<br />
<strong>Beach</strong><br />
<strong>Sand</strong>, 30 to 100% cobble<br />
bands 30 to 80 ft seaward,<br />
localized rip-rap revetment<br />
at back beach<br />
Cardiff 80 to 100% cobble band 75<br />
ft seaward, sand with sparse<br />
to moderate cobble low tide<br />
zone, localized rip-rap<br />
revetment<br />
Solana <strong>Beach</strong> <strong>Sand</strong>, localized 30 to 100%<br />
cobble bands, patchy low<br />
relief reef starting 210 ft<br />
seaward<br />
Del Mar<br />
<strong>Sand</strong>, localized boulders and<br />
sandstone<br />
<strong>Sand</strong><br />
<strong>Sand</strong> and low relief reef,<br />
small high relief reef, patchy<br />
surfgrass<br />
<strong>Sand</strong> and localized high relief<br />
reef, historical surfgrass<br />
<strong>Sand</strong> and low relief reef,<br />
patchy surfgrass<br />
<strong>Sand</strong> and localized low relief<br />
reef, patchy surfgrass<br />
<strong>Sand</strong>, low relief reef,<br />
localized high relief reef,<br />
patchy surfgrass<br />
<strong>Sand</strong>, localized low relief<br />
reef northwest, with patchy<br />
surfgrass<br />
<strong>Sand</strong> directly offshore, low<br />
relief reef northwest, high<br />
relief reef, historical patchy<br />
surfgrass<br />
<strong>Sand</strong>, low relief reef,<br />
localized surfgrass, high<br />
relief reef north<br />
<strong>Sand</strong> at –10 ft isobath,<br />
patchy surfgrass<br />
<strong>Sand</strong> localized scattered<br />
rocks<br />
<strong>Sand</strong> and low relief reef,<br />
small high relief reef, patchy<br />
surfgrass<br />
<strong>Sand</strong> and localized high relief<br />
reef, historical surfgrass<br />
<strong>Sand</strong> and low relief reef,<br />
localized high relief reef<br />
southwest, patchy surfgrass<br />
<strong>Sand</strong> and localized low relief<br />
reef, localized high relief<br />
reef, patchy surfgrass<br />
<strong>Sand</strong>, low relief reef,<br />
localized high relief reef,<br />
patchy surfgrass<br />
<strong>Sand</strong>, localized low relief<br />
reef northwest with patchy<br />
surfgrass<br />
<strong>Sand</strong>, low relief reef<br />
northwest, historical patchy<br />
surfgrass<br />
<strong>Sand</strong>, low relief reef,<br />
localized surfgrass, high<br />
relief reef north, scattered<br />
rocks<br />
<strong>Sand</strong> at –20 ft isobath,<br />
scattered rocks<br />
<strong>Sand</strong>, localized scattered rock;<br />
nearest kelp bed > 8,000 ft<br />
southwest, nearest historical<br />
kelp 1150 ft southwest<br />
<strong>Sand</strong> and reef; nearest kelp bed<br />
2,250 ft southwest, historical<br />
kelp offshore<br />
Nearest kelp bed 1,600 ft<br />
northwest, historical kelp<br />
offshore<br />
Nearest kelp bed >3,000 ft<br />
southwest, historical kelp<br />
offshore<br />
<strong>Sand</strong> and reef; nearest kelp bed<br />
1,500 ft offshore, historical<br />
kelp offshore<br />
1997 and historical kelp bed<br />
925 ft offshore<br />
Localized kelp bed 850 ft<br />
offshore and 1,125 ft<br />
northwest of site, scattered<br />
rock<br />
Nearest kelp beds 1,075 ft<br />
northwest and 1,550 ft<br />
southwest, historical kelp<br />
offshore<br />
Kelp beds 1,000 to 1,500 ft<br />
offshore<br />
<strong>Sand</strong> at –30 ft isobath; nearest<br />
kelp bed 3,750 ft northwest,<br />
historical kelp offshore<br />
<strong>Regional</strong> <strong>Beach</strong> <strong>Sand</strong> <strong>Project</strong> <strong>EIR</strong>/<strong>EA</strong> Page 3.4-15<br />
99-69\SANDAG <strong>EIR</strong><strong>EA</strong> 3.4.wpd 7/17/00
3.4 Biological Resources<br />
Table 3.4-1. Continued<br />
Receiver<br />
Site Intertidal Subtidal to -10 ft MLLW -11 to -20 ft MLLW -20 to -30 ft MLLW<br />
Torrey Pines<br />
Mission<br />
<strong>Beach</strong><br />
Imperial<br />
<strong>Beach</strong><br />
<strong>Sand</strong>, 30 to 100% cobble<br />
bands 3 to 100 ft seaward<br />
<strong>Sand</strong>, historical surfgrass,<br />
high relief reef to south<br />
<strong>Sand</strong> and localized low relief<br />
reef, patchy surfgrass<br />
<strong>Sand</strong> and reef at –30 ft<br />
isobath, small kelp 3,000 ft<br />
southwest, historical kelp<br />
1800 ft northwest<br />
<strong>Sand</strong> <strong>Sand</strong> at –10 ft isobath <strong>Sand</strong> at –20 ft isobath <strong>Sand</strong> at –30 ft isobath; small<br />
<strong>Sand</strong>, 95 to 100% cobble<br />
band up to 110 ft seaward, 5<br />
to 30% cobble in localized<br />
areas, rip-rap revetment at<br />
back beach<br />
and localized kelp beds 800 to<br />
1,200 ft offshore<br />
<strong>Sand</strong> at –10 ft isobath <strong>Sand</strong> at –20 ft isobath <strong>Sand</strong> at –30 ft isobath; kelp<br />
beds 1,900 ft offshore<br />
All of the receiver sites tested negative for grunion eggs during surveys in May and July 1999, even when<br />
beach and tide conditions were favorable. Testing for grunion eggs was performed with sand shovel<br />
samples as described in Section 3.4.1. Specific factors which may attract or detract grunion at individual<br />
receiver sites are noted in the text. Generally, those receiver sites with gentle sloping sand beaches would<br />
be suitable, while cobble beaches would not be utilized.<br />
South Oceanside<br />
Within Receiver Site Boundaries<br />
The intertidal habitat is predominantly sand. <strong>Sand</strong> depths measured in May 1999 ranged from 12 to greater<br />
than 48 inches with an average depth of 18 inches in the upper and mid tidal zones and 26 inches in the low<br />
intertidal zone. <strong>Beach</strong> width under spring low tide conditions ranged from 245 feet at Marron Street to 160<br />
feet at Cassidy Street. Organisms observed in the sand habitat included sand crabs, bean clams, and<br />
polychaete worms.<br />
Dense cobble was limited to a few localized areas primarily at the south end of the site. One high relief<br />
rock, about six feet wide, occurred approximately 250 feet offshore between Crosswaithe and Witherby<br />
Streets, which are located north of Buccaneer beach. No surfgrass was observed on the rock during the<br />
May 1999 beach survey. Rip-rap revetment occurred along the back beach of the entire site. The green<br />
alga, acorn barnacle, limpets, and gray littorine snails occurred in localized areas where the revetment was<br />
in the high tide splash zone. Shorebirds were abundant and foraging in the intertidal and gulls were<br />
observed resting in the upper intertidal during the May 1999 survey.<br />
Page 3.4-16<br />
<strong>Regional</strong> <strong>Beach</strong> <strong>Sand</strong> <strong>Project</strong> <strong>EIR</strong>/<strong>EA</strong><br />
99-69\SANDAG <strong>EIR</strong><strong>EA</strong> 3.4.wpd 7/17/00
3.4 Biological Resources<br />
California grunion eggs were not observed in shovel samples collected during the May survey, which was<br />
during a period of predicted grunion runs. <strong>Sand</strong> depths were sufficient and cobble cover was not extensive<br />
at the north to middle portions of the site. However, beach width was narrow and cobble cover was<br />
extensive in the upper intertidal towards the south end of the site. Grunion are known to occasionally use<br />
the beach at Oceanside near Oceanside Harbor and MCB Camp Pendleton; therefore, there is the<br />
potential for their occurrence. The potential is considered low towards the south end of the site where sand<br />
habitat is limited and cobble is more dense.<br />
Nearby Sensitive Resources<br />
Primary California least tern and western snowy plover nesting locations are located about two to five miles<br />
north of the site at MCB Camp Pendleton. The W-2 tern and plover nesting colony at Batiquitos Lagoon<br />
is approximately 500 feet from this receiver site.<br />
R<br />
R<br />
R<br />
Nearshore waters off the South Oceanside receiver site are predominantly sand with localized occurrence<br />
of scattered rocks. Scattered rock habitat offshore the receiver site was surveyed in January 2000. It<br />
consists of low relief (zero to three feet) substrate vegetated with opportunistic coralline algal turf.<br />
Localized and sparse occurrence of sea fans occur on higher relief rocks. The south boundary of the<br />
receiver site is at least 2,000 feet from the nearest vegetated nearshore reef (Table 3.4-2). No kelp bed<br />
had surface canopy in the vicinity in 1999, and the closest kelp bed in 1997 was nearly two miles south.<br />
The nearest surfgrass bed is over 1.5 miles to the south.<br />
North Carlsbad<br />
Within Receiver Site Boundaries<br />
The proposed receiver site is predominantly sand. <strong>Sand</strong> depths ranged between 13 to 32 inches during<br />
the May 1999 survey and had an overall average depth of 18 inches. <strong>Sand</strong> crabs and polychaete worms<br />
occupied the sand habitat.<br />
Cobble was sparse (5 to 10 percent) in occurrence along most of the site, although localized areas near<br />
the north and south boundaries had dense bands (100 percent cover) next to the back beach. Bands of<br />
25 to 75 percent cobble extended seaward of the dense band at the south end of the site. No marine life<br />
was observed on the cobble. California grunion eggs were not observed in shovel samples collected during<br />
<strong>Regional</strong> <strong>Beach</strong> <strong>Sand</strong> <strong>Project</strong> <strong>EIR</strong>/<strong>EA</strong> Page 3.4-17<br />
99-69\SANDAG <strong>EIR</strong><strong>EA</strong> 3.4.wpd 7/17/00
3.4 Biological Resources<br />
Table 3.4-2<br />
Closest Distance to Reefs/Kelp Beds<br />
from the Seaward Boundary of Each Receiver Site<br />
Receiver Site<br />
Proposed Sites<br />
Distance (ft)<br />
to Reef<br />
Distance (ft) to Kelp Bed Canopy<br />
1999 1997 1978-1996<br />
Oceanside 2,250 8,000 1,150<br />
North Carlsbad 200 2,250 700<br />
South Carlsbad North 225 1,600 1,000<br />
South Carlsbad South 350 3,000 1,000<br />
Batiquitos 150 1,500 1,300<br />
Leucadia 0 925 925<br />
Moonlight <strong>Beach</strong> 400 >4,500 850 850<br />
Cardiff 450 1,200 1,075 1,000<br />
Solana <strong>Beach</strong> 0 >6,000 1,000 1,000<br />
Del Mar 2,250 3,750 1,000<br />
Torrey Pines 650 3,000 1,800<br />
Mission <strong>Beach</strong> 6,000 800 800<br />
Imperial <strong>Beach</strong> None nearby 1,900 1,900<br />
the May survey, which was during a period of predicted grunion runs. Cobble cover was not extensive<br />
enough to preclude grunion egg laying and sand depths may have been of sufficient depth.<br />
Nearby Sensitive Resources<br />
California least tern nesting locations are located from about two to five miles north of the site at MCB<br />
Camp Pendleton (Figure 3.4-1). The closest western snowy plover nesting locations are within one mile<br />
south at Agua Hedionda Lagoon.<br />
Intertidal and inshore surfgrass beds occur south of the receiver site offshore Juniper Avenue and offshore<br />
Tamarack Avenue north of the inlet jetty to Agua Hedionda Lagoon.<br />
Nearshore waters off North Carlsbad are characterized by mostly sandy bottom with patches of low-relief<br />
reef and smaller patches of high-relief reef. The low-relief reef starts approximately 525 feet offshore in<br />
-7 to -12 feet MLLW, which is about 200 feet from the seaward boundary of the fill site (Table 3.4-2).<br />
Page 3.4-18<br />
<strong>Regional</strong> <strong>Beach</strong> <strong>Sand</strong> <strong>Project</strong> <strong>EIR</strong>/<strong>EA</strong><br />
99-69\SANDAG <strong>EIR</strong><strong>EA</strong> 3.4.wpd 7/17/00
3.4 Biological Resources<br />
Surfgrass and feather boa kelp was associated with some of the low relief areas in 1997. Localized areas<br />
of high-relief reef start at about -10 feet MLLW. Feather boa kelp and sea fans were noted on some of<br />
the high relief areas.<br />
Consistent results were noted during January 2000 surveys of reef areas located near Pine Avenue at the<br />
south end of the site, further south offshore Tamarack Avenue but north of the inlet jetty of Agua Hedionda<br />
Lagoon, and south of the discharge jetty of the lagoon. Nearshore reef areas ranged from 0 to 5 feet in<br />
height. Surfgrass mainly occurred on relatively higher relief reefs (e.g., two to five feet) at depths less than<br />
-15 feet MLLW, but also occurred on lower relief reefs at deeper depths out to -22 feet MLLW. Feather<br />
boa kelp had scattered occurrence on a variety of reefs from -10 feet to -25 feet MLLW. Sea fans were<br />
sparse in occurrence on relatively higher (greater than two feet) portions of some reefs. Several of the<br />
reefs, particularly at depths less than -10 feet MLLW and/or with lower relief heights were vegetated only<br />
with opportunistic coralline turf algae.<br />
No kelp canopy was mapped in the vicinity of the site in 1999. In 1997, the nearest kelp bed was over<br />
2,000 feet south of the site (Table 3.4-2). Historically, kelp has occurred offshore in depths greater than<br />
-20 feet MLLW. Historical persistence of kelp has been moderate at locations north of Agua Hedionda<br />
Lagoon.<br />
South Carlsbad North<br />
Within Receiver Site Boundaries<br />
This site is predominantly sand with localized cobble bands extending from the upper intertidal from 10 to<br />
100 feet seaward to the mid tide zone. <strong>Sand</strong> depths during the May 1999 survey averaged five to seven<br />
inches in the upper and mid intertidal zones and 19 inches in the lower intertidal. With the exception of<br />
juvenile sand crabs, few organisms were observed in the shovel samples collected in May.<br />
California grunion eggs were not observed in shovel samples collected during the May survey. <strong>Sand</strong> depths<br />
were not sufficient in the upper and mid intertidal zones to support grunion egg laying in May. <strong>Beach</strong> width<br />
also may have been limiting since damp sand was observed at the back of the beach, which is abutted by<br />
a cliff along the length of the site.<br />
<strong>Regional</strong> <strong>Beach</strong> <strong>Sand</strong> <strong>Project</strong> <strong>EIR</strong>/<strong>EA</strong> Page 3.4-19<br />
99-69\SANDAG <strong>EIR</strong><strong>EA</strong> 3.4.wpd 7/17/00
3.4 Biological Resources<br />
Nearby Sensitive Resources<br />
The closest California least tern and western snowy plover nesting sites are located at Batiquitos Lagoon,<br />
which is within two miles of the receiver site (Figure 3.4-1).<br />
Nearshore waters are characterized by mostly sandy bottom with a patch of high-relief reef in the<br />
northern/central part of the receiver site. The high-relief reef begins 525 feet offshore in -6 feet MLLW<br />
at a distance of about 225 feet from the seaward boundary of the fill site (Table 3.4-2). Feather boa kelp<br />
and sea palms were noted on the reef in 1997. No surface canopy of kelp was mapped in the vicinity in<br />
1999, and the closest kelp bed in 1997 was approximately one mile south. Historically, kelp has occurred<br />
offshore at depths greater than 20 feet above MLLW.<br />
South Carlsbad South<br />
Within Receiver Site Boundaries<br />
<strong>Sand</strong> is the predominant habitat at this proposed receiver site. <strong>Sand</strong> depths averaged three inches in the<br />
upper, 10 inches in the mid, and 15 inches in the lower intertidal. The site was revisited in July and sand<br />
depths had increased four to ten-fold at specific locations and averaged 31 inches overall. <strong>Sand</strong> crabs,<br />
polychaete worms, and bean clams were noted in the sand habitat. Only a few gulls were observed<br />
foraging and resting at the site during the May 1999 survey.<br />
During the May 1999 survey, 30 to 100 percent cobble bands occurred along the back beach in the upper<br />
intertidal and less dense cobble cover extended up to 105 feet seaward in localized areas. During the July<br />
1999 survey, dense cobble bands were pushed higher up the beach and did not extend more than about<br />
40 feet from the bluff. Mid and low intertidal areas had less than cobble cover. No marine life was<br />
observed on the cobble.<br />
A hard substrate area (approximately 183 feet long) occurred in the lower intertidal between 1,251 and<br />
1,434 feet south of the site’s northern boundary and 230 feet seaward of the back beach. The area<br />
consisted of scattered low relief rocks and bench. The low relief rocks supported few marine resources.<br />
Filamentous red algae was common and coralline algae and hermit crabs were sparse in occurrence.<br />
Page 3.4-20<br />
<strong>Regional</strong> <strong>Beach</strong> <strong>Sand</strong> <strong>Project</strong> <strong>EIR</strong>/<strong>EA</strong><br />
99-69\SANDAG <strong>EIR</strong><strong>EA</strong> 3.4.wpd 7/17/00
3.4 Biological Resources<br />
California grunion eggs were not observed in shovel samples collected during the May or July 1999<br />
surveys. Cobble cover and inadequate sand depths may have limited the ability of this site to support<br />
grunion egg laying during the May survey. While sand depths were sufficient in the lower part of the upper<br />
and mid intertidal zones, cobble cover was still dense in part of the upper intertidal during the July survey.<br />
Nearby Sensitive Resources<br />
The closest California least tern and western snowy plover nesting sites are at Batiquitos Lagoon, which<br />
is about 1.8 miles south of the receiver site (Figure 3.4-1). A small inshore surfgrass patch occurs over<br />
one mile south of the receiver site.<br />
A localized low relief hard substrate area was observed over 250 feet south of the site’s southern<br />
boundary. No sensitive resources were found. Filamentous red, coralline, and crustose red algae were<br />
the only marine life observed on the rocks.<br />
Nearshore waters are characterized by mostly sandy bottom with low-relief, scattered reef offshore most<br />
of the site. This low-relief reef area begins 600 feet offshore in -5 to -10 feet MLLW, which is about 350<br />
feet from the seaward boundary of the site (Table 3.4-2). Patchy surfgrass and feather boa kelp were<br />
observed on the reef in 1997. Patches of high-relief reef occur south of the site, beginning 775 feet offshore<br />
in -7 to -15 feet MLLW. Surfgrass and feather boa kelp were on those reef areas in 1997.<br />
No kelp canopy was present in the vicinity of the site in 1999. The closest kelp bed in 1997 was about<br />
one mile south (Table 3.4-2). Historically, kelp has occurred offshore the site at depths greater than 20<br />
feet above MLLW.<br />
Batiquitos<br />
Within Receiver Site Boundaries<br />
While much of the proposed receiver site is sand, during the May 1999 survey, a continuous band of 100<br />
percent cobble was observed in the upper intertidal and extended up to 60 feet seaward of the back beach.<br />
Bands of five to 70 percent cobble extended further seaward from the denser cobble band. Insufficient<br />
sand occurred in the upper intertidal to record sand depth measurements. <strong>Sand</strong> depths ranged from four<br />
<strong>Regional</strong> <strong>Beach</strong> <strong>Sand</strong> <strong>Project</strong> <strong>EIR</strong>/<strong>EA</strong> Page 3.4-21<br />
99-69\SANDAG <strong>EIR</strong><strong>EA</strong> 3.4.wpd 7/17/00
3.4 Biological Resources<br />
to 24 inches in the mid intertidal, 12 to 25 inches in the lower intertidal, and averaged 14 inches overall.<br />
No marine life was observed on the cobble. <strong>Sand</strong> crabs and polychaetes occupied the sand habitat.<br />
California grunion eggs were not observed in the shovel samples collected during the May 1999 survey.<br />
Very shallow sand depths and extensive cobble cover in the upper intertidal may have been limiting to<br />
grunion egg laying.<br />
Nearby Sensitive Resources<br />
Primary California least tern and western snowy plover nesting sites are located at Batiquitos Lagoon,<br />
which is about one-quarter mile inland from the receiver site. The W-2 plover nesting colony at Batiquitos<br />
Lagoon is approximately 500 feet from this receiver site, on the other side of the 101 Coast highway and<br />
jetty structure.<br />
R<br />
R<br />
R<br />
R<br />
Nearshore waters are characterized by mostly sandy bottom, with an area of low-relief, scattered reef and<br />
a smaller patch of high-relief reef at the southern end of the site. The low-relief, scattered reef begins<br />
approximately 625 feet offshore in -8 feet MLLW, which is about 150 feet seaward of the site boundary.<br />
A small high-relief reef starts approximately 750 feet offshore in -10 feet MLLW. The low relief reef was<br />
covered with scattered surfgrass and feather boa kelp in 1997.<br />
No kelp canopy was mapped in 1999. In 1997, kelp canopy was mapped offshore. The inshore edge<br />
was 1,875 feet offshore in -35 feet MLLW, which is about 1,500 feet from the seaward boundary of the<br />
site (Table 3.4-2). The approximate size of this bed was 0.2 square miles. Historical maps indicate a<br />
relatively high persistence of kelp in the vicinity of the site. During the January 2000 survey, giant kelp was<br />
observed on reefs at depths greater than -30 feet MLLW.<br />
Leucadia<br />
Within Receiver Site Boundaries<br />
The proposed receiver site is predominantly sand habitat. The site was first surveyed in July 1999. <strong>Sand</strong><br />
depths ranged from 6 to 41 inches, and averaged 19 inches in the upper and mid intertidal zones and 27<br />
inches in the low intertidal zone. <strong>Sand</strong> crabs, bean clams, and polychaete worms were found in the sand<br />
habitat.<br />
Page 3.4-22<br />
<strong>Regional</strong> <strong>Beach</strong> <strong>Sand</strong> <strong>Project</strong> <strong>EIR</strong>/<strong>EA</strong><br />
99-69\SANDAG <strong>EIR</strong><strong>EA</strong> 3.4.wpd 7/17/00
3.4 Biological Resources<br />
With the exception of a small localized area that had a 40-foot wide band of dense cobble (100 percent<br />
cover), cobble cover on the beach was sparse (less than 20 percent). Very localized occurrence of hard<br />
substrate included a few rocks in the upper intertidal 2,900 feet south of the northern site boundary. No<br />
marine life was found on the cobble or rock. One very small area (3.5 feet long by 6 inches wide) of<br />
exposed sandstone was observed 350 feet seaward of the back beach (i.e., outside but adjacent to the<br />
site’s seaward boundary) approximately 1,900 feet south of the northern site boundary. The sandstone<br />
had a relief height of two inches and no marine life was observed.<br />
California grunion eggs were not observed in shovel samples collected during the July survey. <strong>Sand</strong> depths<br />
were sufficient and cobble cover was not extensive enough to have limited grunion egg laying during the<br />
survey period.<br />
Nearby Sensitive Resources<br />
The closest California least tern and western snowy plover nesting sites are at Batiquitos Lagoon, which<br />
is about one-half mile from the receiver site (Figure 3.4-1).<br />
Inshore and intertidal surfgrass beds occur immediately north of the receiver site near Grandview Street,<br />
and at several locations south of the site offshore Jason Street, offshore Diana Street, offshore Leucadia<br />
Street, and offshore El Porto Street.<br />
The nearshore habitats off Leucadia are mostly low-relief, scattered reef with patches of high-relief reef.<br />
Low-relief reef begins just beyond the seaward boundary of the site and extends in the nearshore area<br />
along the entire site (Table 3.4-2). The scattered, low-relief reef off the Leucadia site was covered with<br />
scattered surfgrass, feather boa kelp, and giant kelp in 1997. An area of high-relief reef starts<br />
approximately 700 feet offshore in -8 feet MLLW. An area of high-relief reef also occurs immediately to<br />
the north of the site, approximately 725 feet offshore in -9 feet MLLW. The high relief patches were<br />
vegetated with giant kelp, feather boa kelp, surfgrass, and sea palms.<br />
No kelp canopy was mapped in the vicinity of the site in 1999. In 1997, kelp was found offshore at depths<br />
greater than -20 feet MLLW, which is about 925 feet seaward of the site boundary (Table 3.4-2).<br />
Historically, there has been a high persistence of kelp in the vicinity of the site.<br />
<strong>Regional</strong> <strong>Beach</strong> <strong>Sand</strong> <strong>Project</strong> <strong>EIR</strong>/<strong>EA</strong> Page 3.4-23<br />
99-69\SANDAG <strong>EIR</strong><strong>EA</strong> 3.4.wpd 7/17/00
3.4 Biological Resources<br />
Moonlight <strong>Beach</strong><br />
Within Receiver Site Boundaries<br />
While some of the site is sand habitat, during the May 1999 survey, 30 to 100 percent cobble bands<br />
extended 30 to 80 feet seaward of the back beach. No marine life occurred on the cobble. <strong>Sand</strong> depths<br />
averaged 3 inches in upper, 11 inches in the mid, and 21 inches in the lower intertidal zones. The mid and<br />
lower intertidal sand habitat was occupied by sand crabs and polychaete worms.<br />
California grunion eggs were not observed in shovel samples collected during the May 1999 survey.<br />
Shallow sand depths and some cobble cover in the upper intertidal may have been limiting to grunion egg<br />
laying during the survey period.<br />
Nearby Sensitive Resources<br />
The closest California least tern and western snowy plover nesting sites are at Batiquitos Lagoon, which<br />
is about 2.5 miles from the receiver site (Figure 3.4-1).<br />
The nearshore waters off Moonlight <strong>Beach</strong> are characterized by mostly sandy bottom, with a low-relief reef<br />
starting 500 feet offshore in -6 feet MLLW, just north of the site at a distance of about 400 feet from the<br />
seaward boundary of the site (Table 3.4-2). Scattered giant kelp, surfgrass, and feather boa kelp were<br />
found on the low-relief reef in 1997. The Encinitas City Marine Life Refuge lies immediately south of the<br />
site. Refer to Section 3.6.<br />
R<br />
R<br />
R<br />
The nearshore area offshore the receiver site and extending further south nearly to I Street was surveyed<br />
in January 2000 by side-scan sonar and by divers. One small reef (0.04 acre) had very sparse occurrence<br />
of surfgrass (1 turion per 10 ft 2 (4 m 2 )). Feather boa kelp was fairly ubiquitous but ranged from sparse to<br />
common abundance on several reefs. Several reefs and scattered rock areas were only vegetated with<br />
opportunistic coralline algal turf. They mainly occurred in water depths ranging between -10 and-20 feet<br />
MLLW. Giant kelp, sea fans, and/or sea palms occurred on reefs at depths ranging from -20 to -35 feet<br />
MLLW. Sea fans were on relative higher relief substrate (greater than two feet). Giant kelp occurrence<br />
was sparse, but localized areas with juvenile plants indicate some recovery from the 1997 El Niño event.<br />
Page 3.4-24<br />
<strong>Regional</strong> <strong>Beach</strong> <strong>Sand</strong> <strong>Project</strong> <strong>EIR</strong>/<strong>EA</strong><br />
99-69\SANDAG <strong>EIR</strong><strong>EA</strong> 3.4.wpd 7/17/00
3.4 Biological Resources<br />
No kelp canopy was mapped in the vicinity of the site in 1999. In 1997, giant kelp beds were found<br />
offshore of the north end and to the south, off Santa Fe Drive. These beds were approximately 1,200 feet<br />
offshore at depths greater than -20 feet MLLW. A small patch occurred approximately 1,200 feet directly<br />
offshore at depths of -20 to -25 feet MLLW, and was about 850 feet seaward of the site boundary (Table<br />
3.4-2). Historically, there has been a relatively high persistence of kelp in the vicinity of the site.<br />
Cardiff<br />
Within Receiver Site Boundaries<br />
During spring lower low tides in May and July 1999, only about 150 feet of beach width at the receiver<br />
site was exposed. With the exception of the rip-rap revetment that occurs at the north end of the site in<br />
front of Restaurant Row, the site consisted of 80 to 100 percent cobble cover in the mid and upper<br />
intertidal zones. The lower intertidal zone consisted of sand with moderate cobble cover. <strong>Sand</strong> depths in<br />
the lower intertidal ranged from 14 to 28 inches with an overall average of 23 inches. No organisms were<br />
found in samples from the mid and lower intertidal zones.<br />
Common splash zone organisms such as acorn barnacle were found on the revetment. Juvenile sized<br />
feather boa kelp (less than 24 inches) and goose-neck barnacles, which are species associated with<br />
frequent inundation, were noted in localized areas on the revetment.<br />
California grunion eggs were not observed in shovel samples collected during the May 1999 survey.<br />
Extensive cobble cover in the upper intertidal did not provide habitat to support grunion egg laying.<br />
Nearby Sensitive Resources<br />
The closest California least tern and western snowy plover nesting sites are located at San Elijo Lagoon,<br />
which is located just inland from the receiver site (Figure 3.4-1).<br />
Inshore and intertidal surfgrass beds occur north of the receiver site on Cardiff reef located north of Dublin<br />
Drive and further north offshore San Elijo State <strong>Beach</strong>.<br />
<strong>Regional</strong> <strong>Beach</strong> <strong>Sand</strong> <strong>Project</strong> <strong>EIR</strong>/<strong>EA</strong> Page 3.4-25<br />
99-69\SANDAG <strong>EIR</strong><strong>EA</strong> 3.4.wpd 7/17/00
3.4 Biological Resources<br />
The subtidal area immediately adjacent to the site is sandy bottom. Reef occurs about 450 feet north of<br />
the site at depths ranging from -5 to -20 feet MLLW. No surfgrass was observed at this location in 1995;<br />
however, sea palms, coralline algae, and sea fans were common to abundant.<br />
Low relief reef also occurs in the nearshore about 2,000 feet south of the site. The reef starts out as patch<br />
reef and at about 2,500 feet south the reef is more extensively developed. Dense surfgrass was observed<br />
in 1995 on more developed areas of the reef between -8 and -18 feet MLLW.<br />
Giant kelp was noted during the January 2000 survey in deeper water (greater than 25 feet above MLLW)<br />
on reefs and the San Elijo outfall pipe. A small canopy of kelp was mapped offshore and north of the<br />
receiver site in 1999 (Table 3.4-2). Kelp beds were found to the north off Cardiff and to the south off the<br />
southern portion of San Elijo Lagoon historically and in 1997. In 1997, the bed to the north began 1,200<br />
feet offshore in -20 feet MLLW and extended into deeper waters. This bed was more than 0.25 square<br />
mile in size. The bed to the south began 1,550 feet offshore in -25 to -35 feet MLLW. Some kelp was<br />
also found along the San Elijo outfall pipe. Historically, there has been a high persistence of kelp just north<br />
of the lagoon and a much more transitory persistence in the vicinity of the pipeline.<br />
Solana <strong>Beach</strong><br />
Within Receiver Site Boundaries<br />
The beach habitat is predominantly sand with some cobble. <strong>Sand</strong> depths ranged between two and 40<br />
inches with an overall average of 14 in during the May 1999 survey. Depths measured at several of the<br />
same locations in July 1999 indicated a build up of the beach over the two months following the survey.<br />
The average sand depth in July 1999 was 21 inches in the upper, 25 inches in the mid, and 37 inches in the<br />
low intertidal zones. <strong>Sand</strong> crabs, polychaete worms, and amphipod crustaceans occupied the sand habitat.<br />
Cobble varied from being more dense in the northern half of the site to fairly sparse in the southern half.<br />
Cobble cover exceeded 60 percent at Fletcher Cover during the May and July 1999 surveys and occurred<br />
in dense bands along the cliff and extending out to 40 feet seaward further north. No marine life was<br />
associated with the cobble.<br />
Two reef areas were observed south of Fletcher Cove within the site boundaries during the minus tide<br />
surveys and one was observed just south of the boundary. The beach site was surveyed in May and July<br />
Page 3.4-26<br />
<strong>Regional</strong> <strong>Beach</strong> <strong>Sand</strong> <strong>Project</strong> <strong>EIR</strong>/<strong>EA</strong><br />
99-69\SANDAG <strong>EIR</strong><strong>EA</strong> 3.4.wpd 7/17/00
3.4 Biological Resources<br />
and a brief visit was made in June 1999. The amount of the exposed reef habitats differed between<br />
surveys. The few marine resources observed on all three reefs indicated that the sites experience frequent<br />
sand disturbance.<br />
A 350-foot long area with patchy, low relief reef occurred in May 1999 between Fletcher Cove and South<br />
Helix Street. The reef started 200 feet seaward of the cliff and extended offshore through the site’s<br />
offshore boundary. Filamentous red algae was common on the rock and juvenile feather boa kelp was<br />
sparse in occurrence. In July, sand had covered 200 feet of the reef and filamentous red algae was the only<br />
resource observed on the 150-foot long patchy reef area.<br />
A 250-foot long by 185-foot wide patchy, low relief reef area was observed between offshore South Helix<br />
Street starting 60 feet seaward of the back beach both in May and July. With the exception of filamentous<br />
and coralline red algae, which were common in occurrence, there were few biological resources. Very<br />
sparse in occurrence were juvenile feather boa kelp (average size 22 inches), Ulva green algae, small leafy<br />
brown and red algae, aggregated sea anemones (average size 21 inches), and chitons.<br />
Just south of the southern end of the site, a small (80-foot long) patchy low relief area began about 200 feet<br />
seaward of the back beach and extended offshore. Feather boa kelp (juvenile to adult size; average size<br />
88 inches) was common in occurrence as was filamentous red algae. Other algae such as coralline and<br />
small leafy red algae were sparsely distributed. The only invertebrates were hermit crabs, which were<br />
sparse in occurrence.<br />
California grunion eggs were not observed in shovel samples collected during the May and July 1999<br />
surveys. <strong>Sand</strong> depths generally were insufficient in the upper intertidal during the May survey, but there<br />
was sufficient sand in July. The narrow beach width probably would have been limiting to grunion laying<br />
because waves were breaking at the base of the cliff on the incoming portion of the tide during both<br />
surveys.<br />
Nearby Sensitive Resources<br />
The closest California least tern and western snowy plover nesting sites are located at San Elijo Lagoon,<br />
which is located within one mile from the receiver site (Figure 3.4-1).<br />
<strong>Regional</strong> <strong>Beach</strong> <strong>Sand</strong> <strong>Project</strong> <strong>EIR</strong>/<strong>EA</strong> Page 3.4-27<br />
99-69\SANDAG <strong>EIR</strong><strong>EA</strong> 3.4.wpd 7/17/00
3.4 Biological Resources<br />
Inshore intertidal surfgrass occurs at three sites north of the receiver site; one at the surf spot known as Pill<br />
Box, another north of Tide Park, and a third further north at Table Tops reef.<br />
Several intertidal reef areas outside the site boundaries were noted both north and south of the site. The<br />
closest reef area to the north is a surfing location known as Pill Box. This consisted of a 145-foot long, high<br />
relief reef area (starting 152 feet seaward of the cliff) and a low relief reef that extended further north (from<br />
approximately 400 to 1,000 feet north of the northern site boundary) in May 1999. In July 1999, sand<br />
build up had reduced the above ground height of most of that reef to 27 to 29 inches except at a distance<br />
of approximately 270 feet seaward of the cliff. At that location, the reef height ranged up to 38 inches.<br />
Resources on the high relief area were similar between the May and July surveys and included juvenile<br />
feather boa kelp (average size 24 inches), Ulva green algae, small leafy brown and red algae, and sea<br />
anemones (average size 29 inches). A 145-foot by 8-foot area of surfgrass occurred on the high relief reef<br />
just seaward (268 feet from the cliff) of the site’s offshore boundary.<br />
The low relief area supported filamentous and coralline red algae, Ulva green algae, small leafy brown<br />
algae (e.g., Colpomenia, Dictyota/Pachydictyon sp.) feather boa kelp, and hermit crabs, which were<br />
sparse to common in abundance. In July, a portion of the area was covered with sand, and in other areas<br />
the low relief rock and reef ranged in height from zero (i.e., flush with sand) to eight inches. Filamentous<br />
red algae, small leafy brown algae, and hermit crabs were common in abundance, and feather boa kelp was<br />
very sparse in occurrence on the reef in July.<br />
North of that location were two small patch reefs with little resource development in May 1999 that were<br />
completely covered with sand in July 1999. Offshore Tide Park, more reef area was exposed in May than<br />
in June and July. During the May 1999 survey, surfgrass, feather boa kelp, a variety of algae, several types<br />
of snails (Lithopoma undosa, Kelletia kelletia, Ocenebra sp., Tegula sp.), sea hares, aggregated sea<br />
anemones, and hermit crabs were observed. During a visit in June 1999 and the July 1999 survey, most<br />
of the reef area was covered with sand. Surfgrass with patchy, feather boa kelp was lying on the sand<br />
surface, algae (except filamentous red) was sparse in occurrence on any of the exposed rock, and hermit<br />
crabs were the only visible invertebrates.<br />
During the June 1999 site visit, it was noted that extensive mounds of turf algae and kelp were on the beach<br />
at Tide Park. A City Parks Department bulldozer was clearing the beach of the accumulated material by<br />
pushing it into the surfzone. During the July 1999 survey, this material was observed washed up on the<br />
Page 3.4-28<br />
<strong>Regional</strong> <strong>Beach</strong> <strong>Sand</strong> <strong>Project</strong> <strong>EIR</strong>/<strong>EA</strong><br />
99-69\SANDAG <strong>EIR</strong><strong>EA</strong> 3.4.wpd 7/17/00
3.4 Biological Resources<br />
beach at the northern end of Tide Park and extended along the beach further north. It is suspected that<br />
sand and/or cobble scour associated with the sand build-up had stripped the reef area of the algae.<br />
Even further north is the extensively developed reef known as Table Tops. That reef had extensive<br />
development of biological resources including a variety of algae and invertebrates, and substantial surfgrass<br />
beds. Juvenile to adult sized California mussels, relatively large sea anemones, large colonies of sand castle<br />
worm (Phragmatopoma californica), and a diverse range of resources at the site indicate that this is a<br />
persistent reef area. Substantial sand build up also occurred at this site between June and July 1999 and<br />
included partial burial of some surfgrass. Navy monitoring at this site records about three feet of sand build<br />
up between the spring and fall of 1999. This location is one of the sites currently being monitored by the<br />
Navy as part of the permit conditions associated with the previous Homeporting project (refer also to<br />
Section 2.5). Monitoring will continue here until 2001.<br />
The closest reef to the south was located approximately 600 feet south of the southern site boundary. It<br />
consisted of a 459-foot-long area with patchy reef. With the exception of four rocks (each about 6 feet<br />
wide) that were 27 inches in height, exposed sandstone benches were either flush with the sand or only a<br />
few inches in height. Common in occurrence were feather boa kelp (average size 71 inches), a variety of<br />
turf algae, aggregated sea anemones, and hermit crabs. Although this site was only visited in July 1999,<br />
the occurrence of feather boa kelp on the surface of the sand in several places indicates that sand build up<br />
had also occurred at this site since May 1999.<br />
The next closest reef area to the south was located over 1,600 feet south of the southern site boundary.<br />
Both low and high relief benches and rocks were present in the upper intertidal through minus tide zones.<br />
Feather boa kelp (juvenile to adult sizes, average size 28 inches), a variety of red turf algae, Ulva green<br />
algae, small leafy brown algae, sea anemones, California mussel, Acanthina snails, limpets, hermit crabs,<br />
and striped shore crabs were present. There was fairly high public use of the rocky intertidal area during<br />
the July 1999 survey.<br />
A side-scan sonar survey was conducted offshore between Tide Park and Pill Box reef in January 2000,<br />
however, surface kelp canopy interfered with acquisition of side-scan sonar maps for part of the site.<br />
Storm conditions with large swell and surf have limited dives at this site later in January and February 2000.<br />
The side-scan sonar maps indicate predominantly low relief reef, although high relief associated with the<br />
Pill Box reef to the south and high relief to the north was mapped within the extent of survey boundary.<br />
Limited diver surveys have verified some reef heights under the kelp canopy, and assessed resources on<br />
<strong>Regional</strong> <strong>Beach</strong> <strong>Sand</strong> <strong>Project</strong> <strong>EIR</strong>/<strong>EA</strong> Page 3.4-29<br />
99-69\SANDAG <strong>EIR</strong><strong>EA</strong> 3.4.wpd 7/17/00
3.4 Biological Resources<br />
some reefs mapped outside the kelp canopy. In some locations, the kelp that was present in January 2000<br />
had been eliminated by storms in February 2000.<br />
No kelp canopy was mapped within one mile of the site in 1999. In 1997, kelp beds were mapped<br />
offshore the site. The shallowest portions of these large beds were in -15 to -30 feet MLLW, about 1,075<br />
to 2,000 feet offshore (Table 3.4-2). The large bed in the northern portion of the site was approximately<br />
0.2 square mile, and the large bed in the southern portion was 0.1 square mile in size. Historically, there<br />
has been a relatively high persistence of kelp in the vicinity of the site.<br />
Del Mar<br />
Within Site Boundaries<br />
The proposed site is predominantly sand habitat. <strong>Sand</strong> depths ranged between seven and 25 inches with<br />
an overall average of 14 inches in May. <strong>Sand</strong> crabs and polychaete worms occupied the sand habitat.<br />
Boulders occurred in localized areas along the back beach and a small sandstone bench was exposed in<br />
the upper intertidal at the south end of the site. A more extensive sandstone bench occurred in the upper<br />
intertidal immediately south of the site. Cobble was very localized to sparse on the beach. No marine life<br />
was observed on any of these hard substrate areas.<br />
California grunion eggs were not observed in shovel samples collected during the May survey. While sand<br />
depths may have been sufficient to support grunion, and cobble cover was not extensive enough to have<br />
limited grunion egg laying, beach width may have been a limiting factor. The upper intertidal had damp sand<br />
to the back of the beach, which had a narrow, steep slope, bluff, or revetment along its length.<br />
Nearby Sensitive Resources<br />
The closest California least tern and western snowy plover nesting sites are located at San Dieguito<br />
Lagoon, which is located less than one mile from the receiver site (Figure 3.4-1).<br />
Inshore intertidal surfgrass occurs in extensive patches south of the receiver site from near 15 th Street to<br />
4 th Street.<br />
Page 3.4-30<br />
<strong>Regional</strong> <strong>Beach</strong> <strong>Sand</strong> <strong>Project</strong> <strong>EIR</strong>/<strong>EA</strong><br />
99-69\SANDAG <strong>EIR</strong><strong>EA</strong> 3.4.wpd 7/17/00
3.4 Biological Resources<br />
Commercial fishermen provided information that reef and scattered rock occurs offshore and south of the<br />
Del Mar site. Surveys by the Navy in 1994 documented sand at the -10, -20, and -30 feet depth contours<br />
offshore the site. No kelp canopy was mapped in the vicinity of the site in 1999. In 1997, the nearest kelp<br />
bed was over 3,000 feet to the north. Historical mapping indicates that kelp has occurred offshore from<br />
the south end of the site and up to about 6,000 feet further south. While conflicting reports of the<br />
occurrence of hard substrate offshore Del Mar exist, the locations of intertidal surfgrass and historic kelp<br />
beds indicate that the more sensitive hard substrate habitats occur south of the receiver site.<br />
Commercial fishermen also reported occurrence of scattered rock and reef habitat north of the site and San<br />
Dieguito Lagoon. The side-scan sonar survey in January 2000 included the closest scattered rock area<br />
to the north. Scattered rock and reef were noted at depths between -10 and -20 feet MLLW. Dives in<br />
February and March 2000 to assess resources on hard substrate in this area found that all the substrate was<br />
vegetated with opportunistic coralline turf.<br />
Torrey Pines<br />
Within Site Boundaries<br />
The proposed site consists of sand habitat with cobble. During the May 1999 survey, sand occurred<br />
mainly in the mid and low intertidal zones. Cobble occurred in a dense band (100 percent cover) three to<br />
100 feet wide from the back beach, and a band with about 30 percent cobble cover occurred seaward of<br />
that for most of the site. In July, cobble cover was restricted to a narrow band (20 feet wide) in the upper<br />
intertidal from the mid to south end of the site.<br />
<strong>Sand</strong> depths were very shallow in the upper intertidal (average of 5 inches), moderate in the mid (average<br />
of 18 inches), and deeper in the low intertidal (average of 42 inches) during the May 1999 survey. By July<br />
1999, there had been substantial build up of sand with average sand depths of 34 inches in the upper<br />
intertidal, 36 inches in the mid, and 46 inches in the low intertidal zones. <strong>Sand</strong> habitat was occupied by<br />
sand crabs, polychaete worms, and bean clams. One dead sand dollar was noted in the low intertidal<br />
during the May beach survey and four dead sand dollars were noted in July 1999. This indicates the<br />
presence of offshore sand dollar beds in the vicinity of the site.<br />
California grunion eggs were not observed in shovel samples collected during the May and July surveys.<br />
<strong>Sand</strong> depths were insufficient and cobble cover was dense in the upper intertidal in May. In July sand<br />
<strong>Regional</strong> <strong>Beach</strong> <strong>Sand</strong> <strong>Project</strong> <strong>EIR</strong>/<strong>EA</strong> Page 3.4-31<br />
99-69\SANDAG <strong>EIR</strong><strong>EA</strong> 3.4.wpd 7/17/00
3.4 Biological Resources<br />
depths were sufficient and dense cobble was more restricted in occurrence and thus not limiting to grunion<br />
egg laying. However, beach may not have been wide enough. The upper intertidal had damp sand to the<br />
back of the beach, which had bluff or revetment along its length.<br />
Nearby Sensitive Resources<br />
The closest California least tern and western snowy plover nesting sites are located at Los Peñasquitos<br />
Lagoon within less than one mile from the receiver site (Figure 3.4-1).<br />
Nearshore habitats are mostly sandy bottom with a small amount of low-relief, scattered reef at the<br />
southern end of the site. This reef begins approximately 825 feet offshore between -10 and -15 feet<br />
MLLW, which is about 650 feet seaward of the site boundary and extends into deeper waters (Table 3.4-<br />
2). A large, wide area of low-relief, scattered reef, extending from the intertidal to the subtidal, is found<br />
immediately south of the Torrey Pines site. Inshore intertidal surfgrass beds also occur south of the site.<br />
No kelp canopy was mapped offshore in 1999. In 1997, giant kelp was found in only one small, offshore<br />
patch south of the site. This patch was 2,000 feet offshore in -35 feet MLLW and was located about<br />
3,000 feet from the site (Table 3.4-2). Historically, there has been a relatively high persistence of kelp<br />
about 4,500 feet north of the site.<br />
Mission <strong>Beach</strong><br />
Within Site Boundaries<br />
The proposed site consists entirely of sand habitat. <strong>Sand</strong> crabs, bean clams, and polychaete worms<br />
occupied the sand habitat. A dead sand dollar was observed on the beach, which suggests the presence<br />
of offshore sand dollar beds in the vicinity of the site. <strong>Sand</strong> depths ranged from 15 to greater than 48<br />
inches and averaged 40 inches in the upper, 19 inches in the mid, and 29 inches in the low intertidal.<br />
California grunion eggs were not observed in shovel samples collected during the May survey. <strong>Sand</strong> depths<br />
were sufficient to support grunion egg laying and the site was sampled four days after a new moon. The<br />
upper intertidal showed evidence of recent beach grooming and it is not known to what extent (if any) that<br />
had on the lack of observed eggs.<br />
Page 3.4-32<br />
<strong>Regional</strong> <strong>Beach</strong> <strong>Sand</strong> <strong>Project</strong> <strong>EIR</strong>/<strong>EA</strong><br />
99-69\SANDAG <strong>EIR</strong><strong>EA</strong> 3.4.wpd 7/17/00
3.4 Biological Resources<br />
Nearby Sensitive Resources<br />
Western snowy plover sites are located at the south end of Mission <strong>Beach</strong> and at Mission Bay where<br />
California least tern nests also occur (Figure 3.4-1). All sites are located less than one mile away, and the<br />
Mission <strong>Beach</strong> snowy plover nest sites are within one-half mile.<br />
Nearshore habitat is sand. Artificial reefs and numerous sunken vessels are known to occur offshore. The<br />
nearest hard bottom feature is the NOSC Tower at -60 feet MLLW located approximately 4,500 feet from<br />
the receiver site (refer also to Section 3.6). No kelp canopy was mapped in 1999 in the vicinity of the site.<br />
In 1997, small patches of kelp were found offshore of the northern half of the site and to the north of the<br />
site. These patches were 1,150 feet offshore between -15 and -25 feet MLLW, which was about 800 feet<br />
seaward of the site boundary (Table 3.4-2). Historically, kelp does not occur with any regularity or<br />
persistence off Mission <strong>Beach</strong>.<br />
Imperial <strong>Beach</strong><br />
Within Site Boundaries<br />
<strong>Sand</strong> is the predominant intertidal habitat; however, an extensive band of 80 to 100 percent cobble<br />
extended up to 110 feet from the back beach throughout most of the site. During the May 1999 survey,<br />
the beach width was wider at the north end of the site and about 100 feet narrower towards the south end.<br />
Rip-rap revetment occurred the length of the site at the back beach. <strong>Sand</strong> depths were highly variable in<br />
the upper and mid intertidal zones (4 to greater than 48 inches), and generally deeper in the low intertidal<br />
(28 to greater than 48 inches). <strong>Sand</strong> depths averaged 18 inches in the upper, 15 inches in the mid, and 34<br />
inches in the low intertidal.<br />
<strong>Sand</strong> crabs, bean clams, and polychaete worms were found in the sand habitat. No marine life was<br />
observed on the cobble. Common splash zone organisms such as Enteromorpha, acorn barnacle, and<br />
limpets were noted on the revetment in areas where it was closer to the water.<br />
California grunion eggs were not observed in shovel samples collected during the May survey. <strong>Sand</strong> depths<br />
were sufficient to support grunion egg laying and the site was sampled four days after a new moon. Dense<br />
cobble cover over most of the upper intertidal and/or narrow beach width probably limited potential habitat<br />
for grunion along most of the site.<br />
<strong>Regional</strong> <strong>Beach</strong> <strong>Sand</strong> <strong>Project</strong> <strong>EIR</strong>/<strong>EA</strong> Page 3.4-33<br />
99-69\SANDAG <strong>EIR</strong><strong>EA</strong> 3.4.wpd 7/17/00
3.4 Biological Resources<br />
Nearby Sensitive Resources<br />
The closest western snowy plover and California least tern nesting locations are located within<br />
approximately one mile of the receiver site at Tijuana Estuary (Figure 3.4-1). Nearshore habitat is sand<br />
and no sensitive hard bottom resources are known to occur immediately offshore.<br />
No kelp canopy was mapped in the vicinity of the site in 1999. In 1997, giant kelp was found beginning<br />
at 2,250 feet offshore of Imperial <strong>Beach</strong> at a depth of -20 feet MLLW and extending to a depth of -35 feet<br />
MLLW. The inshore edge of the kelp was about 1,900 feet seaward of the site boundary (Table 3.4-2).<br />
This kelp bed was approximately 0.5 square mile in size. Historically, kelp persistence has been relatively<br />
low to moderate in the vicinity of the site.<br />
3.4.4 Borrow Sites<br />
Site specific information at and/or near the borrow sites includes data from NPDES wastewater monitoring<br />
studies for San Elijo Joint Powers (Encinitas/Solana <strong>Beach</strong>) and Encina Wastewater Facility (Carlsbad),<br />
regional monitoring studies coordinated by SCCWRP, City of San Diego Monitoring Studies for their<br />
ocean outfalls, and sampling at borrow sites SO-5 and SO-7. Representative monitoring stations were<br />
considered with locations at or near the proposed borrow sites.<br />
Because the proposed borrow sites would be located at similar depths and have relatively similar sediment<br />
type, they have many species in common (Table 3.4-3). The fish and epibenthic macroinvertebrate<br />
communities in each borrow site are also well known and inhabited by species common throughout the<br />
Bight. Table 3.4-4 summarizes the fish species encountered at various representative locations near or at<br />
the borrow sites.<br />
Species within all the borrow sites are typical for their water depth and tend to be common throughout the<br />
Bight. There are no threatened, endangered, or sensitive species within any of the borrow sites. Detailed<br />
descriptions of the sampling results at SO-7 and SO-5 undertaken for this project are provided in<br />
Appendix D.<br />
The focus on this text below is to disclose the proximity of specific borrow sites, pipeline routes or mono<br />
buoy locations to areas of hard-bottom substrate.<br />
Page 3.4-34<br />
<strong>Regional</strong> <strong>Beach</strong> <strong>Sand</strong> <strong>Project</strong> <strong>EIR</strong>/<strong>EA</strong><br />
99-69\SANDAG <strong>EIR</strong><strong>EA</strong> 3.4.wpd 7/17/00
3.4 Biological Resources<br />
Table 3.4-3<br />
Summary of the Most Commonly Collected Infaunal Invertebrate<br />
Species Occurring Offshore from Oceanside to Imperial <strong>Beach</strong><br />
(at water depths of 59 to 177 feet)<br />
Polychaetes<br />
Scientific Name<br />
Common Name<br />
SO-9 SO-7 SO-6 MB-1 SS-1<br />
Station<br />
2286 Encina R1<br />
Station<br />
2293<br />
Station<br />
1791<br />
Dipatra sp. Onuphid P X X<br />
Dispio uncinata Spionid X P X<br />
Euclymeninae sp. A Maldanid P P P<br />
Mediomastus spp. Capitellid P<br />
Melinna oculata Ampharetid P X X<br />
Metasychis disparidentatus Maldanid P<br />
Monticellina sp. Cirratulid X X P<br />
Lumbrineris sp. Lumbrinerid X X X X<br />
Myriochele sp. M Oweniid P X<br />
Mooreonuphis sp. Onuphid X X X<br />
Paraprionospio pinnata Spionid P P P<br />
Petalodymene pacifica Maldanid P<br />
Pista disjuncta Terebellid P X<br />
Prionospio sp. A Spionid P<br />
Owenia sp. Oweniid X X P P<br />
Onuphis sp. Onuphid X X X X X<br />
Sigalion spinosa Sigalionid X X X<br />
Spiophanes bombyx Spionid X P X<br />
Spiophanes missionensis Spionid P P X X X<br />
Streblosoma sp. Terebellid P X<br />
Sthenelanella uniformis Sigalionid X P<br />
Crustaceans<br />
Ampelisca brevisimulata Amphipod X P<br />
Ampelisca cristata Amphipod P X X X<br />
Cerapus tubularis Amphipod X<br />
Euphilomedes<br />
carcharondonta<br />
Ostracod<br />
Leptochelia dubia Tanaid X P<br />
Pinnixa sp. Crab X X P<br />
Rhepoxynius sp. Amphipod X X X P X<br />
Photis sp. Amphipod X X X X<br />
P<br />
Station<br />
1944<br />
<strong>Regional</strong> <strong>Beach</strong> <strong>Sand</strong> <strong>Project</strong> <strong>EIR</strong>/<strong>EA</strong> Page 3.4-35<br />
99-69\SANDAG <strong>EIR</strong><strong>EA</strong> 3.4.wpd 7/17/00
3.4 Biological Resources<br />
Table 3.4-3. Continued<br />
Scientific Name<br />
Common Name<br />
SO-9 SO-7 SO-6 MB-1 SS-1<br />
Station<br />
2286<br />
Oceanside<br />
Encina R1<br />
Carlsbad<br />
Station<br />
2293<br />
Cardiff<br />
Station<br />
1791<br />
Mission<br />
<strong>Beach</strong><br />
Synchelidium shoemakeri Amphipod X<br />
Tiburonella viscana Amphipod P P<br />
Echinoderms<br />
Amphiodia urtica Brittlestar P X<br />
Dendraster excentricus <strong>Sand</strong> dollar X P<br />
Leptosynapta sp. Cucumber X X P X<br />
Molluscs<br />
Acteocina harpa Snail X<br />
Caecum crebrinctum Snail P P<br />
Halistylus pupoides Snail P P<br />
Macoma yoldiformis Tellinid clam X X X X<br />
Olivella baetica<br />
Purple olive<br />
snail<br />
Solen sicarius Solen clam X<br />
Solamen columbiana Clam P<br />
Tellina sp. Tellinid clam X P P<br />
Turbonilla sp. Snail X X X<br />
Other Phyla<br />
Glottidia albida Brachiopoda X<br />
Branchiostoma californiense <strong>Sand</strong> lancelet X X<br />
Lineidae Nemertea X X X X X<br />
Station<br />
1944<br />
Imperial<br />
<strong>Beach</strong><br />
Tubulanus polymorphus Nemertea X X<br />
Phoronis sp. Phoronida X X X X<br />
Molgulidae sp. A Tunicate P<br />
Total Number of Individuals 256 491 171 164 133<br />
Total Number of Species 62 118 29 51 43<br />
P = Most abundant taxa X = Identified as present<br />
Sources: MEC and SCCWRP, refer to Appendix C.<br />
X<br />
Page 3.4-36<br />
<strong>Regional</strong> <strong>Beach</strong> <strong>Sand</strong> <strong>Project</strong> <strong>EIR</strong>/<strong>EA</strong><br />
99-69\SANDAG <strong>EIR</strong><strong>EA</strong> 3.4.wpd 7/17/00
3.4 Biological Resources<br />
Table 3.4-4<br />
Summary of Fish Collected By Otter Trawls Offshore from Oceanside to Imperial <strong>Beach</strong><br />
(at water depths of 55 to 100 feet)<br />
Scientific Name<br />
Common Name<br />
SO-9 SO-7 SO-6 SO-5 MB-1 SS-1<br />
Stations<br />
1650,<br />
2286,<br />
2288<br />
<strong>Project</strong><br />
Specific (1)<br />
Station<br />
2293<br />
<strong>Project</strong><br />
Specific (1)<br />
Anisotremus davidsoni Sargo X X<br />
Chitonotus pugetensis Roughback sculpin X<br />
Station<br />
1766,<br />
1780<br />
Citharichthys stigmaeus Speckled sanddab X P P P P P<br />
Citharichthys xanthostigma Longfin sanddab P P X X X<br />
Cymatogaster aggregata Shiner perch X<br />
Genyonemus lineathus White croaker P P<br />
Halichoeres semicinctus Rock wrasse X X<br />
Hippoglossina stomata Bigmouth sole P X<br />
Hypsopsetta guttulata Diamond turbot X<br />
Lepidogobius lepidus Bay goby X<br />
Menticirrhus undulatus California corbina X<br />
Myliobatis californica Bay ray X<br />
Paralabrax nebulifer Barred sand bass P P X X X X<br />
Paralichthys californicus California halibut P P P P P<br />
Peprilus simillimus Pacific butterfish X<br />
Phanerodon furcatus White surfperch X<br />
Platyrhinoidis triseriata Thornback X X X<br />
Pleuronectes vetulus English sole X X P X P<br />
Pleuronichthys ritteri Spotted turbot X X X<br />
Pleuronichthys verticalis Hornyhead turbot P X P<br />
Porichthys myriaster Specklefin midshipman X X<br />
Rhacochilus toxotes Rubberlip surfperch X<br />
Scorpaena guttata California scorpionfish X P P<br />
Seriphus politus Queenfish P<br />
Symphurus atricauda California tongue fish X<br />
Synodus lucioceps California lizardfish P P P P P P<br />
Xystreurys liolepis Fantail sole P X P X P<br />
P = Most abundant in trawl X = Identified as present<br />
(1)<br />
Otter trawls at these locations undertaken for this project<br />
Sources: MEC and SCCWRP, refer to Appendix C.<br />
Stations<br />
1944,<br />
2335<br />
<strong>Regional</strong> <strong>Beach</strong> <strong>Sand</strong> <strong>Project</strong> <strong>EIR</strong>/<strong>EA</strong> Page 3.4-37<br />
99-69\SANDAG <strong>EIR</strong><strong>EA</strong> 3.4.wpd 7/17/00
3.4 Biological Resources<br />
SO-9<br />
The species found at this borrow site are typical for this water depth and are common throughout the<br />
project area. As shown in Table 3.4-5, other than 12 small artificial CDFG reefs, borrow site SO-9 is<br />
generally distant from known sensitive resources and habitats. The dredge area has been designed to<br />
provide a minimum 500-foot buffer zone to the nearest artificial CDFG reef. A previously unmapped<br />
experimental reef was identified during public review of side-scan sonar data. SO-9 has been modified<br />
to provide a 350-foot buffer from that small complex of scattered rock. It should be noted that during final<br />
design, this borrow site may be eliminated, but impacts are addressed for purposes of full disclosure.<br />
R<br />
R<br />
R<br />
R<br />
R<br />
R<br />
Proposed pipeline routes for onshore transport of sand appear to be clear of sensitive resources although<br />
there may be some scattered rock near the proposed pipeline route.<br />
SO-7<br />
The SO-7 borrow site is complex and constrained by artificial reefs along the eastern edge and inshore<br />
hard bottom and potential kelp habitat to the north and south. However, sampling at this location in June<br />
of 1999 did not observe kelp near this site. The dredge area has been designed to provide a minimum<br />
350-foot buffer zone to the nearest artificial reef and potential kelp habitat areas. The nearest nearshore<br />
reef area appears to be approximately 2,000 feet from the borrow site and there are no artificial reefs in<br />
the dredge area (Table 3.4-5). There may be scattered rock and low relief reef near proposed pipeline<br />
and mono buoy locations. The borrow site maybe expanded north and west if SO-9 and/or SO-6 are not<br />
utilized, to be determined in final design.<br />
R<br />
R<br />
SO-6<br />
While most of the species observed during monitoring near this borrow site are species common throughout<br />
the Bight, some are more representative of coarse sand sediments. These tend to be less common than<br />
those species associated with sand and silt/sand sediments.<br />
Borrow site SO-6 is located near sensitive resources and habitats including nearshore reefs located about<br />
500 feet from borrow site footprint and adjacent areas that historically have supported kelp at different<br />
times. To the south is the San Elijo outfall pipe and a 350-foot buffer zone from the outfall pipe has been<br />
incorporated into location of the dredge area. As shown in Table 3.4-5, hard bottom reef areas may exist<br />
along pipeline and mono buoy locations.<br />
Page 3.4-38<br />
<strong>Regional</strong> <strong>Beach</strong> <strong>Sand</strong> <strong>Project</strong> <strong>EIR</strong>/<strong>EA</strong><br />
99-69\SANDAG <strong>EIR</strong><strong>EA</strong> 3.4.wpd 7/17/00
3.4 Biological Resources<br />
SO-5<br />
The soft bottom habitat within SO-5 contains a mixture of coarse sand and sand/silt sediments. Fish,<br />
infaunal and macroinvertebrates, are common and similar to other locations in the Bight and the project<br />
itself. As shown in Table 3.4-5, the SO-5 borrow site has few constraints and the dredge area is located<br />
over 500 feet from reefs and over 600 feet from historical kelp areas. Proposed pipeline and mono buoy<br />
locations may be near potential reef and kelp habitat.<br />
MB-1<br />
The sand sediments within this borrow site tend to be coarser sands than found at other borrow sites. As<br />
shown in Table 3.4-3, the species list from the monitoring station near this borrow site contains many of<br />
the common infaunal species found throughout the Bight for the inner shelf community but also contains<br />
some species indicative of coarser sandy sediments (e.g., sand dollars, the amphipod Tiburonella viscana,<br />
and the presence of the sand lancelet).<br />
There are several artificial reefs and sunken wrecks which support sensitive resources located near the<br />
MB-1 borrow site, so the dredge area has been located to maximize the buffer zone to all resources (Table<br />
3.4-5). The nearest artificial reef is the Mission Bay Bridge Wreckage Site No. 1 located approximately<br />
1,000 feet to the south. Other sunken structures are the NOSC Tower and the Ruby E, which are 1,500<br />
and 2,000 feet distant, respectively (refer also to Section 3.6). There are no resources near proposed<br />
pipeline locations and mono buoy locations.<br />
SS-1<br />
Table 3.4-3 presents the species list and abundance for Monitoring Station 1944, located upcoast from<br />
this borrow site. While species present at this location are typical species found throughout the Bight, this<br />
location tends to have fewer organisms than borrow sites further to the north.<br />
As shown in Table 3.4-5, there are no sensitive resources or habitats in close proximity to the proposed<br />
borrow site. No kelp canopy was mapped in the vicinity in 1999. In 1997 kelp was mapped about 3,000<br />
feet north of the site. Kelp bed persistence off Imperial <strong>Beach</strong> is low to moderate.<br />
<strong>Regional</strong> <strong>Beach</strong> <strong>Sand</strong> <strong>Project</strong> <strong>EIR</strong>/<strong>EA</strong> Page 3.4-39<br />
99-69\SANDAG <strong>EIR</strong><strong>EA</strong> 3.4.wpd 7/17/00
3.4 Biological Resources<br />
Table 3.4-5<br />
Closest Distance to Sensitive Resources from the Dredge Area Boundaries<br />
Borro<br />
w Site<br />
Distance<br />
(ft)<br />
Offshore<br />
Distance<br />
(ft)<br />
Offshore to<br />
–30 to –40<br />
MLLW<br />
Sensitive<br />
Resources at<br />
Potential<br />
Mono Buoy<br />
Location<br />
SO-9 6,000 2,625-4,500 Potentially<br />
scattered rocks<br />
SO-7 3,000 1,500-1,875 Potentially<br />
scattered rocks<br />
and/or reef<br />
SO-6 4,125 1,680-2,438 Potentially reef,<br />
kelp<br />
Sensitive<br />
Resources<br />
along Sinker<br />
Pipeline<br />
Route<br />
Nearshor<br />
e Reef<br />
Approximate Distance (ft) to Sensitive Habitats From Closest Dredge Area Boundary<br />
Artificial<br />
Reef<br />
1999 Kelp<br />
Canopy<br />
1997 Kelp<br />
Canopy<br />
1976-<br />
1996 Kelp<br />
Canopy<br />
Sunken<br />
Vessel or<br />
Debris<br />
Pipeline<br />
No 2,000 500 (2) 30,000 30,000 30,000 No 18,000 from<br />
Oceanside<br />
Potentially<br />
and/or reef<br />
SO-5 4,125 1,875-2,625 Potentially reef Potentially reef 500 None in<br />
vicinity<br />
MB-1 4,690 1,875-3,000 No No None in<br />
vicinity<br />
SS-1 4,300 2,400-4,875 No No None in<br />
vicinity<br />
500 350 18,000 500 500 No No<br />
Potentially reef 500 2,250 3,000 500 500 250 350 from<br />
San Elijo<br />
1,000 None in<br />
vicinity<br />
None in<br />
vicinity<br />
15,000 3,300 600 No No<br />
None in<br />
vicinity<br />
2,300 2,300 (1) MB Bridge<br />
1,000' south,<br />
NOSC Tower<br />
1,500' east<br />
No<br />
3,000 3,000 (1) No 2,250-from<br />
City of San<br />
Diego<br />
Outfall<br />
Note: Distance offshore to –30 to –40 MLLW provides indication of anchorage depth of mono buoy<br />
(1)<br />
Assumed approximately the same historical kelp cover as in 1997.<br />
(2)<br />
At SO-9, 500 feet minimum between mapped CDFG artificial reefs but 350 feet from previously unmapped experimental rock scatter. R<br />
Page 3.4-40<br />
<strong>Regional</strong> <strong>Beach</strong> <strong>Sand</strong> <strong>Project</strong> <strong>EIR</strong>/<strong>EA</strong><br />
99-69\SANDAG <strong>EIR</strong><strong>EA</strong> 3.4.wpd 7/17/00
3.5 Cultural Resources<br />
3.5 CULTURAL RESOURCES<br />
Cultural resources are prehistoric and historic period sites structures, objects, districts, or other places with<br />
evidence of human activity that are considered significant to a community, culture, or ethnic group.<br />
Significant cultural resources are referred to as historic properties under federal law and meet one or more<br />
criteria for eligibility for nomination to the National Register of Historic Places (NRHP). Under CEQA,<br />
important or significant resources are those that meet one or more of the evaluation criteria for the<br />
California Register of Historic Places.<br />
Cultural resource investigations for the <strong>Regional</strong> <strong>Beach</strong> <strong>Sand</strong> <strong>Project</strong> were directed at assessing the effects<br />
of the proposed undertaking on significant cultural resources, as mandated under the National Historic<br />
Preservation Act (NHPA) and CEQA, and their implementing regulations and guidelines. The area of<br />
potential effect (APE) for cultural resources encompasses the proposed offshore borrow sites and<br />
associated anchor zones, along with the sand transport corridor, and receiver sites. This section provides<br />
a summary of the cultural resources potential of the various project features based on a review of archival<br />
literature (including shipwreck data bases, government baseline studies, and historic charts), informant<br />
interviews, as well as study of geophysical survey and sediment core data. It also provides a brief overview<br />
of the prehistoric and historic cultural setting, particularly underwater resources. The complete technical<br />
report is provided as Appendix E (bound separately).<br />
Background<br />
Near Surface Geology<br />
During the past 20,000 years the earth has experienced a glacial retreat, with an accompanying rise in sea<br />
level. At 10,000 before present (B.P.) the global sea level averaged about 100 feet below the present<br />
shoreline. The gradual rate of sea level rise from 10,000-5,000 B.P. may have produced many estuaries<br />
and coastal lagoons. Present-day sea level was attained by about 3,000 B.P., allowing sedimentation to<br />
nearly completely fill the previous coastal bays and lagoons.<br />
Prehistoric Cultural Setting<br />
Most archaeologists generally agree that manifestations of three major prehistoric cultural traditions exist<br />
in San Diego: the San Dieguito Complex (a Paleo-Indian tradition); the La Jolla Complex (a regional<br />
expression of the Milling Stone Horizon); and the Late Prehistoric Complex, designated as Yuman<br />
<strong>Regional</strong> <strong>Beach</strong> <strong>Sand</strong> <strong>Project</strong> <strong>EIR</strong>/<strong>EA</strong> Page 3.5-1<br />
99-69\SANDAG <strong>EIR</strong><strong>EA</strong> 3.5 to 3.12.wpd 7/17/00
3.5 Cultural Resources<br />
(Kumeyaay-Ipai) or Shoshonean (Luiseño). These traditions/complexes cover a broad time span with the<br />
San Dieguito Complex dating from 10,000 or before to 7,500 B.P., the La Jolla 7,500 to 3,000 B.P., and<br />
the Late Prehistoric 3,000 to 2,000 B.P.<br />
At the time of contact with Europeans, the local Native American peoples were utilizing numerous coastal<br />
resources including shellfish, seaweed, shore birds, and fish. Archaeological evidence indicates that lagoon<br />
and other coastal areas have attracted human activity throughout much of prehistory.<br />
The San Diego region has cultural resources that are documented to be more than 9,000 years old. Recent<br />
dating of cultural materials on the southern California Channel Islands suggests that materials as old as<br />
11,000 years may be expected in the San Diego region. What is known of prehistoric settlement locations<br />
in the San Diego region suggests that the coastal zone was highly desirable. Since the shoreline held<br />
significant subsistence resources for prehistoric peoples, it is expected that many cultural resources dating<br />
from the 10,000-year or younger period are located in the offshore zone. Given the concentration of sites<br />
along the modern shoreline, it is reasonable to expect that submerged sites would also exist along<br />
paleoshore lines dating from the 10,000 - 3,000 B.P. time period. Archaeological evidence for these sites<br />
may still exist despite their being subjected to a rising sea level, leading to their submergence. Indeed, the<br />
rising sea level might have created favorable ecological setting in certain areas, such as embayments and<br />
estuaries, and these now submerged features may have concentrated local populations and settlement<br />
patterns.<br />
Numerous prehistoric artifacts have been reported by divers in the nearshore zone of the San Diego region.<br />
Three main theories have been suggested to explain why those resources would be offshore. They may<br />
be artifacts carried offshore by the erosion of onshore coastal sites. They may be objects which fell from<br />
prehistoric sea-going craft. They may be artifacts that represent the remains of offshore prehistoric sites,<br />
dating from periods when that location was not submerged, but which are presently exposed on the sea<br />
floor.<br />
Table 3.5-1 lists prehistoric artifact localities reported offshore from San Diego County. At least 37<br />
offshore artifact localities have been reported between San Elijo Lagoon south to the Mexican border. All<br />
of these sites, with the exception of the La Jolla <strong>Beach</strong> and Tennis Club site (Site Number 11) and the<br />
Solana <strong>Beach</strong> (Site Number 36) site, report relatively small numbers of artifacts. The best documented<br />
submerged archaeological site in San Diego County is offshore from the La Jolla <strong>Beach</strong> and Tennis Club<br />
where more than 2,000 stone mortars have been recovered at water depths of up to 90 feet. In addition,<br />
this site has yielded stone pestles, metate fragments, manos, and grooved stones that may have been used<br />
Page 3.5-2<br />
<strong>Regional</strong> <strong>Beach</strong> <strong>Sand</strong> <strong>Project</strong> <strong>EIR</strong>/<strong>EA</strong><br />
99-69\SANDAG <strong>EIR</strong><strong>EA</strong> 3.5 to 3.12.wpd 7/17/00
3.5 Cultural Resources<br />
Table 3.5-1<br />
Marine Prehistoric Artifact Locations/Sites<br />
Site<br />
No.<br />
Location<br />
Depth<br />
feet<br />
Bottom<br />
Type Artifacts Reference<br />
1 Point Loma RSK 3 Masters 1983<br />
2 Point Loma RSK 1 Masters 1983<br />
3 La Jolla RBSK 2 Masters 1983<br />
4 La Jolla RK 1 Masters 1983<br />
5 La Jolla RK 2(a) Masters 1983<br />
6 La Jolla RK 1 Masters 1983<br />
7 La Jolla RB 1(b) Masters 1983<br />
8 La Jolla RK 1 Masters 1983<br />
9 La Jolla 17-20 RK 6 Masters 1983<br />
10 La Jolla RW 1 (c) Tuthill & Allanson 1954<br />
11 La Jolla 0-82 CS 2000 (a,c,d,e,f) Marshall & Moriarty 1964<br />
11 La Jolla 0-20 CS 300(c,d,e) Tuthill & Allanson 1954<br />
12 La Jolla S 2 Masters 1983<br />
13 La Jolla RBSC 2 Masters 1983<br />
14 Torrey Pines 13-16 RBS 3 Masters 1983<br />
15 La Jolla 10-16 RCS 5 Tuthill & Allanson 1954<br />
16 La Jolla 3-13 R 4(f) Tuthill & Allanson 1954<br />
17 La Jolla 56 RW 1 Masters 1983<br />
18 La Jolla RW 1 Masters 1983<br />
19 La Jolla Intertidal S 1 Masters 1983<br />
20 Point Loma RSK 2 Masters 1983<br />
21 Imperial <strong>Beach</strong> Intertidal C 1 Tuthill & Allanson 1954<br />
22 Solana <strong>Beach</strong> 3-26 RC 100+ Tuthill & Allanson 1954<br />
23 Del Mar RS 1 Carl L. Hubbs Archives, SIO Library<br />
24 La Jolla Intertidal S 1(d) SD Museum of Man, Site Record<br />
25 La Jolla 49 SMU 1 Masters 1983<br />
26 Pacific <strong>Beach</strong> Intertidal C 9 Masters 1983<br />
27 La Jolla 59 MU 1(a) Masters 1983<br />
28 Point Loma 46 RK 1 Masters 1983<br />
29 Point Loma 39 RK 1 Masters 1983<br />
30 La Jolla 102 R 1 Tuthill & Allanson 1954<br />
31 La Jolla 39-49 B 2 Masters 1983<br />
32 San Diego Bay Intertidal SMB Midden Carter 1955<br />
33 Del Mar Intertidal S 1 SD State University, Site Record<br />
34 Point Loma 59 RK 1 Thornburg 1956<br />
35 La Jolla Intertidal RS 1 Pettus 1999<br />
36 San Elijo 39 RS 10+ Buxton 1999<br />
37 Point Loma 66-98 BCKS 30+ Buxton 1999<br />
Bottom type: B = Boulders; C = Cobbles; K = Kelp; M = Clay; R = Rock; S = <strong>Sand</strong>; W = Wall of submarine canyon<br />
Artifact Type: a = Mano; b = Shaped bowl; c = Metate; d = Grooved stone; e = Pestle; f = Flaked lithic<br />
<strong>Regional</strong> <strong>Beach</strong> <strong>Sand</strong> <strong>Project</strong> <strong>EIR</strong>/<strong>EA</strong> Page 3.5-3<br />
99-69\SANDAG <strong>EIR</strong><strong>EA</strong> 3.5 to 3.12.wpd 7/17/00
3.5 Cultural Resources<br />
as net weights as well as flaked lithics. The 14 localities reported in kelp beds (Table 3.5-1) may be the<br />
result of loss from prehistoric sea-faring craft. It has been speculated that kelp rafting may also be<br />
responsible for transporting artifacts along the shelf. The distribution of reported sites may be<br />
predominately dependent upon the location of sport diving, and for this reason shallow sites are more likely<br />
to be reported. Artifacts at depths below 66 feet may be rare because of the difficulty and limited dive<br />
times at these depths. Another factor in allowing site discovery may be sediment cover. In the La Jolla<br />
and Point Loma areas there is limited sediment cover to obscure the presence of artifacts. Commercial<br />
urchin divers report numerous stone mortar localities in these areas.<br />
Historic Cultural Setting<br />
The following paragraphs provide a very brief history of maritime activities along the San Diego region’s<br />
coast and adjacent waters. The history of the area can generally be divided into three sections. The<br />
Spanish period begins in 1542, followed by the Mexican period beginning around 1800. The American<br />
period came with the discovery of gold and the Treaty of Guadalupe-Hildago in 1849. A more lengthy<br />
history is provided in Appendix E.<br />
Juan Rodriguez Cabrillo was the leader of the first expedition to enter the project vicinity in September of<br />
1542. Some historians believe that the next recorded European entry into the project vicinity was by a<br />
Portuguese navigator named Sebastian Cermenho. The next reported visit to the project area was the<br />
expedition of Sebastian Vizcaino who arrived in San Diego Bay in November 1602. Over 160 years<br />
passed until the Spanish visited the area again. In 1769, four ships left La Paz, Mexico bound for San<br />
Diego. Only two ships successfully completed the transit. The leader of the expedition, Captain Vicente<br />
Vila, erected a crude fort at the site of the San Diego Presidio.<br />
The Mexican era of California history saw the arrival of hide trading ships which sailed through the project<br />
area. San Diego Bay was utilized as a hide processing station so frequent transit of the San Diego area<br />
occurred as the hide ships plied their trade along the California coast.<br />
The discovery of gold in 1849 and the signing of the treaty of Guadelupe-Hidalgo acted to dramatically<br />
increase maritime traffic along the San Diego region coast. Gold seekers traveling to the mines from the<br />
east crossed the isthmus at Panama to wait for ship passage north. This era of maritime history also saw<br />
the arrival of the first steam ship to San Diego.<br />
Page 3.5-4<br />
<strong>Regional</strong> <strong>Beach</strong> <strong>Sand</strong> <strong>Project</strong> <strong>EIR</strong>/<strong>EA</strong><br />
99-69\SANDAG <strong>EIR</strong><strong>EA</strong> 3.5 to 3.12.wpd 7/17/00
3.5 Cultural Resources<br />
Most vessels carrying passengers first arrived at San Francisco, then sailed to San Diego aboard a regular<br />
coastwise service vessel. Several ships offered passage from San Francisco to San Diego. As immigrants<br />
poured in to California from the east, maritime activity in the San Diego coastal region increased steadily.<br />
The great land boom of the late 1880s combined with increased development of port facilities in San Diego<br />
encouraged maritime commerce. Additionally, technology in ship building and marine propulsion systems<br />
further fueled maritime activity in the San Diego area.<br />
The Mexican land grants were eventually sold to real estate developers who subdivided the Ranchos for<br />
sale to the public. Del Mar was one of several towns that swiftly sprang up on old Rancho land. A large<br />
natatorium was constructed in the surf zone near the foot of 10th street. Remnants of this ocean swimming<br />
pool were still visible in 1974. A pier was also constructed near the foot of 10th street. The pier fell into<br />
the sea twice during construction, knocking a large steam crane into the sea. Another victim of building the<br />
pier was a barge that swamped and sank. Remnants of this vessel washed ashore in 1955. The pier fell<br />
into disrepair and was demolished by the Navy in 1958.<br />
Commercial fishing activities began during the last half of the 19th century. Several Chinese junks using nets<br />
operated from San Diego Bay providing fish for local residents. Also, a whaling station began operation<br />
on Ballast Point.<br />
By 1900, the Navy began to realize the strategic importance of San Diego. The Great White Fleet arrived<br />
in San Diego in 1908. While the entrance to San Diego Bay was too shallow to permit these large ships<br />
to enter the harbor, small draft naval vessels did navigate into the bay.<br />
During the 1930s prohibition smugglers used the north county beaches. Illegal shipments of bootleg liquor<br />
were landed along the remote stretch of beaches and hidden in brush to await transportation by truck. On<br />
July 13, 1939, a fishing barge which was anchored off Carlsbad broke her moorings and foundered on<br />
shore. Named the Glenn Mayne, she was a 431-ton converted brig built in 1918. A large piece of the<br />
hull washed ashore in the same general area in 1991. A severe storm caused the loss of another vessel off<br />
Cardiff <strong>Beach</strong> in the late 1930s. The Jeannette R developed engine trouble and sank one mile offshore.<br />
Remnants of what is believed to be this ship washed ashore in 1958.<br />
The development of Oceanside Harbor as a small craft facility allowed recreational use of nearby fishing<br />
grounds by a rapidly growing fleet of boats and small ships.<br />
<strong>Regional</strong> <strong>Beach</strong> <strong>Sand</strong> <strong>Project</strong> <strong>EIR</strong>/<strong>EA</strong> Page 3.5-5<br />
99-69\SANDAG <strong>EIR</strong><strong>EA</strong> 3.5 to 3.12.wpd 7/17/00
3.5 Cultural Resources<br />
The outbreak of World War II brought increased Naval activities throughout San Diego waters and<br />
adjacent shore. From 1941 to 1971 military activities were conducted at Imperial <strong>Beach</strong>. Gunnery<br />
practice, artillery observation, and aviation operations took place. To the north, amphibious landings were<br />
practiced near Oceanside.<br />
San Diego Bay continued to develop as a port. Constant dredging since 1911 allowed larger ships to enter<br />
into the bay. The completion of the Tenth Avenue Marine Terminal provided off-loading facilities for large<br />
cargo ships.<br />
Receiver Sites<br />
The 13 receiver sites are beaches located between south Oceanside and Imperial <strong>Beach</strong>. When the Navy<br />
evaluated 10 of the receiver sites proposed under the previously permitted project, impacts to<br />
archaeological sites from the placement of sand were determined to be beneficial (Department of the Navy<br />
1995, 1997a, 1997b). Therefore, detailed cultural resource analysis of other receiver sites proposed under<br />
the project was not undertaken.<br />
Borrow Sites<br />
It is possible that submerged (and buried) cultural resources would be preserved in certain offshore subtidal<br />
environments. Based on the model used in the current study, the high probability for prehistoric site<br />
preservation is predicted to be at the contact of marsh sediments with streams or rivers. These would be<br />
the oldest associations. Older sites would be most likely to occur within marsh habitats and the most recent<br />
sites within lagoon habitat. Probability assessments are made based on the likelihood of occurrence,<br />
detection, preservation, and recoverability of both prehistoric and historic cultural resources. This<br />
approach is based on the Mineral Management Service (MMS) method utilized to assess submerged (and<br />
often buried) areas for cultural resource sensitivity. The following provides a discussion of the affected<br />
environment for the six borrow sites.<br />
As in the Geology and Soils description (Section 3.1), this text provides an overview of the larger borrow<br />
site rectangle which was originally investigated for sand suitability (Sea Surveyor 1999 and Appendix C).<br />
The “grid” is larger than the dredge area by a factor of two to 25. For example, the grid at SS-1 is over<br />
650 acres, but the dredge area would be under 25 acres.<br />
Page 3.5-6<br />
<strong>Regional</strong> <strong>Beach</strong> <strong>Sand</strong> <strong>Project</strong> <strong>EIR</strong>/<strong>EA</strong><br />
99-69\SANDAG <strong>EIR</strong><strong>EA</strong> 3.5 to 3.12.wpd 7/17/00
3.5 Cultural Resources<br />
SO-9<br />
The dredge area footprint covers a complex but elongate-shaped region, oriented with its long axis in a<br />
beach-parallel direction (4,000 feet) and with its short axis beach-perpendicular and of varying width<br />
(1,000 to 1,500 feet). The water depth varies from 45 feet along the northeast edge to 58 feet along the<br />
southwest edge. A maximum dredging depth of 10 feet below the sea floor is proposed. The geophysical<br />
survey data collected at this site cover approximately 90 percent of the dredge site footprint. Geophysical<br />
data were collected on two occasions. In January 1999 a survey grid with both side-scan sonar and subbottom<br />
profiling was collected, consisting of four survey lines perpendicular to the beach direction, and<br />
eleven survey lines parallel to the beach direction. A total of 12 vibracores were also collected, primarily<br />
in the northeast portion of the borrow site, and five of these vibracores fall within the proposed dredge area.<br />
The deepest core penetration was 17 feet, occurring in the northern portion of the grid. During a previous<br />
beach replenishment study conducted by the <strong>Army</strong> Corps of Engineers (1993) three additional cores were<br />
collected in the presently proposed sand dredging site. In January 2000, additional side-scan sonar data<br />
were collected in a rectangular region overlapping and slightly shoreward of the previous survey grid.<br />
Geoarchaeological Results<br />
According to recent search results conducted for the proposed project, no prehistoric offshore<br />
archeological sites have yet been recorded in or near this borrow site. Based on available data, the SO-9<br />
area is located along the southern margin of the offshore paleochannel of the Santa Margarita River, near<br />
its junction with the offshore paleochannel of the San Luis Rey River. The side scan sonar data collected<br />
for the present study (Sea Surveyor 1999) reveal a smooth featureless bottom texture at SO-9, suggesting<br />
that silt rather than sand is the dominate surface sediment. The sub-bottom profiles reveal a complex<br />
stratigraphy, with a prominent paleochannel oriented perpendicular to the current shoreline. At the bottom<br />
of the profile are pre-transgression fluvial sediments at depths of 10 to 17 feet. Overlying are intertidal,<br />
lagoonal and offshore sediments to the west and only intertidal and offshore sediments to the east.<br />
Evidence for the fluvial sediments is the presence of gravel and other coarse sand near the bottom of<br />
several cores. Likewise, evidence for the intertidal, lagoonal, and offshore environments comes from the<br />
presence of diagnostic shells.<br />
The potential for occurrence of archaeological sites within SO-9 grid appears to be high. The location is<br />
ideal for prehistoric settlement: at the junction of two river channels near the shore. Site preservation may<br />
be problematic, however, since cultural materials would be present within fluvial sediments, the uppermost<br />
<strong>Regional</strong> <strong>Beach</strong> <strong>Sand</strong> <strong>Project</strong> <strong>EIR</strong>/<strong>EA</strong> Page 3.5-7<br />
99-69\SANDAG <strong>EIR</strong><strong>EA</strong> 3.5 to 3.12.wpd 7/17/00
3.5 Cultural Resources<br />
portion of which may have been eroded and/or reworked into intertidal sediments during transgression.<br />
Within the region designated for sand dredging, the eastern portion would have the highest probability for<br />
prehistoric site occurrence. Within this high probability zone, it is most likely that prehistoric sites would<br />
be encountered at depths of about nine feet or below, although the depth may be less for portions of the<br />
dredge site moving inshore.<br />
Historical Results<br />
Portions of this proposed borrow site are near generalized shipping zones assessed by an MMS baseline<br />
study as a medium to high probability area for the occurrence of historical shipwrecks.<br />
Within the portion of the dredge area covered by side-scan sonar, several unidentified sonar targets were<br />
detected. They are now known to be scattered rocks deposited by Dr. Jack Patton as part of a reef<br />
development experiment. Because they were not re-located they were not monitored or mapped on state<br />
sources. Artificial reefs materials have been deposited within the coverage of the geophysical survey grid<br />
and adjacent to the dredge site, seen as discrete piles of material in the side-scan sonar image. No sidescan<br />
sonar data area available for the southeast portion of the dredge area (approximately 10 percent).<br />
R<br />
R<br />
R<br />
SO-7<br />
Within SO-7, the water depth varies from 50 feet along the eastern edge of the grid to 80 feet along the<br />
western portion of the grid. At this site, six seismic survey lines were conducted approximately<br />
perpendicular to the beach direction, and ten survey lines were conducted parallel to the beach direction.<br />
A total of 20 vibracores were collected, primarily in the western portion of the grid. The deepest core<br />
penetration was 14.9 feet, in the east-central portion of the grid.<br />
Geoarchaeological Results<br />
Although no offshore archaeological sites are recorded for this area, sites are present both north and south<br />
of the Batiquitos Lagoon entrance along the modern shoreline.<br />
The dredge area at SO-7 can be divided into an eastern inboard and a western outboard portion. When<br />
viewed in a beach perpendicular profile, a distinct change in bottom and sub-bottom reflector slope is<br />
observed midway through the grid. This change in slope may be related to a previous stable sea level<br />
Page 3.5-8<br />
<strong>Regional</strong> <strong>Beach</strong> <strong>Sand</strong> <strong>Project</strong> <strong>EIR</strong>/<strong>EA</strong><br />
99-69\SANDAG <strong>EIR</strong><strong>EA</strong> 3.5 to 3.12.wpd 7/17/00
3.5 Cultural Resources<br />
stand, at about the 80-90 foot depth contour below current sea level, consistent with the sea level<br />
fluctuations which occurred during the 12,000 - 10,000 B.P. time period. A stable sea level would have<br />
created shorefront erosion and the resulting steeper profile. This interpretation is supported by the presence<br />
of boring clam clasts at 1 to 3 foot depth, suggestive of a rocky intertidal environment.<br />
The eastern portion of SO-7 presents a contrasting geologic structure. The side scan sonar image reveals<br />
a rippled, sand covered, bedform for much of this region, with an exposure of rough bedrock in the<br />
southeast portion of the grid. The sub-bottom profiler data suggest that a preserved paleolandform, a<br />
channel meander feature, is present along the eastern edge of the grid. Using the vibracore as a guide, a<br />
geological cross-section of the SO-7 site indicates bedrock outcrops near the sea floor at the north and<br />
south ends of the grid, with the preserved paleochannel in the central portion. The channels is filled<br />
primarily by intertidal sediments, with a pre-transgression fluvial deposit at the bottom, and offshore marine<br />
sediments at the top of the section. Intertidal species are represented in two of the cores by Donax gouldii<br />
(1 to 10 feet).<br />
The onshore area is environmentally very rich today and numerous prehistoric sites are recorded in the<br />
vicinity of Batiquitos Lagoon. The potential for occurrence of archaeological materials within SO-7<br />
appears to be moderate. Much of the sand deposit at this site is intertidal material, with low probability for<br />
direct prehistoric habitation. Since this is a sand bar at a lagoonal entrance, the probability for occurrence<br />
of a prehistoric archaeological site may be increased. In the southern portion of the site, there is a<br />
preserved basal contact between fluvial (pre-transgression) and intertidal (transgression) sediments. The<br />
preservation of sites at this location may be problematic, since erosion and mixing would likely accompany<br />
the intertidal deposition.<br />
Historical Results<br />
Although the project area lies within a zone assessed as high sensitivity for the presence of historic<br />
shipwrecks, no shipwreck sites are recorded within this proposed borrow site. No side scan sonar targets<br />
suggesting the presence of cultural material were recorded during the survey phase.<br />
SO-6<br />
The water depth varies from 58 feet along the eastern edge of the grid to 120 feet along the western portion<br />
of the grid. A small rectangle within the eastern portion of SO-6 has been designated as a source site for<br />
<strong>Regional</strong> <strong>Beach</strong> <strong>Sand</strong> <strong>Project</strong> <strong>EIR</strong>/<strong>EA</strong> Page 3.5-9<br />
99-69\SANDAG <strong>EIR</strong><strong>EA</strong> 3.5 to 3.12.wpd 7/17/00
3.5 Cultural Resources<br />
sand dredging. At this site, five seismic survey lines were conducted approximately perpendicular to the<br />
beach direction, and six survey lines were conducted parallel to the beach direction. A total of five<br />
vibracores were collected, primarily in the eastern portion of the grid. The deepest core penetration was<br />
10.6 feet, in the south-central portion of the grid.<br />
Geoarchaeological Results<br />
Two offshore archaeological sites are recorded near SO-6, along the margins of San Elijo Lagoon (Table<br />
3.5-1, Sites 22 and 36). More than 100 artifacts have been recovered from these sites. Site 22 is located<br />
in 3- to 26-foot deep water south of the lagoon entrance, and Site 36 is located in 39-foot deep water<br />
north of the lagoon entrance.<br />
The dredge area for SO-6 spans the northern edge of the offshore paleochannel of San Elijo Lagoon. The<br />
side scan sonar data reveal an extensive rippled bedform, particularly in the south and eastern portion of<br />
the grid, suggesting a surface sand cover in these regions. The sub-bottom profile data also suggest a<br />
defined boundary between these two regions. Using the vibracore and sub-bottom data as a guide, a<br />
geologic cross-section of SO-6 indicates a division between a shallow (5-foot) bedrock interface, with<br />
overlying offshore sediments in the northern portion of the grid, and a paleochannel filled with a sequence<br />
of sedimentary facies in the southern portion of the grid.<br />
The potential for occurrence of archaeological sites at SO-6 varies with location within the grid. The<br />
northern portion of the grid has a low probability for site occurrence since in that region offshore sediments<br />
rest directly on bedrock. The southern portion of the grid has a higher probability for site occurrence since<br />
in that region an intertidal-to-fluvial (pre-transgression to transgression) contact is present. The designated<br />
sand source region within SO-6 is a high probability prehistoric site zone, since it is within the paleochannel,<br />
along its northern margin and since it is close to a known offshore prehistoric artifact locality (Table 3.5-1,<br />
Site 36).<br />
Historical Results<br />
One unidentified sonar target was detected just west of the proposed dredge area, but analysis of sonar<br />
imaging suggests it is a sunken vessel. Two historic ships have been documented or reported to exist within<br />
this area. Precise locations of shipwrecks are often notoriously inaccurate but, actual historic vessel<br />
Page 3.5-10<br />
<strong>Regional</strong> <strong>Beach</strong> <strong>Sand</strong> <strong>Project</strong> <strong>EIR</strong>/<strong>EA</strong><br />
99-69\SANDAG <strong>EIR</strong><strong>EA</strong> 3.5 to 3.12.wpd 7/17/00
3.5 Cultural Resources<br />
wreckage washed ashore at Cardiff State <strong>Beach</strong> in 1991. Another probable wreck site was reported in<br />
the August 1955 San Diego Union.<br />
SO-5<br />
The water depth varies from 50 feet along the eastern edge of the grid to 100 feet along the western portion<br />
of the grid. At SO-5, five seismic survey lines were conducted approximately perpendicular to the beach<br />
direction, and seven survey lines were conducted parallel to the beach direction. A total of ten vibracores<br />
were collected, primarily in the central portion of the grid. The deepest core penetration was 12 feet, on<br />
the eastern portion of the grid.<br />
Geoarchaeological Results<br />
Two offshore archaeological artifact sites are recorded near SO-5, along the southern margin of the San<br />
Dieguito River valley, in the intertidal zone and at 10 feet water depth (Masters 1983, Sites 23 and 33).<br />
At each of these sites a single artifact has been recovered.<br />
Borrow site SO-5 spans the offshore paleochannel of the San Dieguito River. The side scan sonar data<br />
suggest a featureless seafloor, except for a small region of rippled bedforms in the southeast and in the<br />
northeast corner of the grid. The sub-bottom profiles revealed a clear bedrock layer beneath sedimentary<br />
sequences that thicken seaward. In the beach parallel profiles, the outline of a paleochannel is preserved,<br />
with its axis directed east-west. Based on the survey and core data, a geological cross-section was<br />
developed for SO-5. The interpretation shows the paleochannel at depth beneath SO-5, filled with a<br />
succession of sediments. It should be noted that at the intertidal/fluvial interface in one of the cores, a<br />
fractured piece of quartzite (a stone material known to be used for tool manufacture) was observed. While<br />
possibly suggestive of humanly produced flaked stone material, it was not definitive.<br />
The potential for occurrence and preservation of archaeological sites within SO-5 is moderate to high. This<br />
is due to the presence of a paleochannel which might have been an attractive feature for prehistoric<br />
habitation, and also the presence of a contact between fluvial (pre-transgression) and intertidal<br />
(transgression) deposits. Also, there are two already recorded offshore artifact sites along the southern<br />
margin of this paleochannel. The highest potential to encounter buried archaeological sites within SO-5 may<br />
be along the margins of the paleochannel, although an object suggestive of flaked lithic materials was found<br />
within a core in the interior of the paleochannel.<br />
<strong>Regional</strong> <strong>Beach</strong> <strong>Sand</strong> <strong>Project</strong> <strong>EIR</strong>/<strong>EA</strong> Page 3.5-11<br />
99-69\SANDAG <strong>EIR</strong><strong>EA</strong> 3.5 to 3.12.wpd 7/17/00
3.5 Cultural Resources<br />
Historical Results<br />
The project area lies within a medium sensitivity zone for the occurrence of historic shipwrecks. No sidescan<br />
sonar targets suggestive of cultural materials were identified within this survey grid. Historic coastal<br />
and marine features that once functioned near the SO-5 project area includes a large natatorium and a pier<br />
at the foot of 10 th Street in Del Mar. A barge swamped and sank near the pier and a large steam crane<br />
was knocked into the water when the pier broke up.<br />
MB-1<br />
At MB-1, the water depth varies from 60 feet along the eastern edge of the grid to 110 feet along the<br />
western edge of the grid. At MB-1, five seismic survey lines were conducted approximately perpendicular<br />
to the shoreline, and ten survey lines were conducted parallel to the shoreline. A total of ten vibracores<br />
were collected, primarily in the eastern portion of the grid. The deepest core penetration was 19.3 feet,<br />
on the eastern portion of the grid.<br />
Geoarchaeological Results<br />
No offshore archaeological artifact sites are recorded at dredge area MB-1, although several offshore<br />
artifact sites are located 1.7 miles or more south offshore from Point Loma, in 39- to 59-foot deep water.<br />
MB-1 spans the offshore paleochannel of the San Diego River. Sub-bottom profiles of the MB-1 site<br />
reveal a stair-stepped series of reflectors, suggestive of a series of stable sea level stands at this location.<br />
Since the MB-1 site is adjacent to the Mount Soledad region, it may be undergoing tectonic uplift at a rate<br />
faster than the previously discussed borrow sites; if the sea level rise and local tectonic uplift were<br />
correspondent during some extended time interval, then a series of stable sea level stands would result.<br />
The beach parallel sub-bottom profiles at MB-1 suggest a well defined paleochannel whose axis is directed<br />
east-west, present in the eastern portion of the grid. To the west, the paleochannel intersects what may<br />
be a beach cliff profile, described earlier as representative of a stable sea level stand. The fill of the<br />
paleochannel is characterized by strong but discontinuous seismic reflectors suggestive of a high-energy<br />
depositional environments, such as would be present for fluvial or intertidal deposition.<br />
Based on the sub-bottom and core data, a geological cross-section for MB-1 shows the paleochannel with<br />
a fill of layered fluvial/marsh/lagoonal sediments at the north and purely intertidal sediments at the south.<br />
Page 3.5-12<br />
<strong>Regional</strong> <strong>Beach</strong> <strong>Sand</strong> <strong>Project</strong> <strong>EIR</strong>/<strong>EA</strong><br />
99-69\SANDAG <strong>EIR</strong><strong>EA</strong> 3.5 to 3.12.wpd 7/17/00
3.5 Cultural Resources<br />
On the north, the paleochannel may have experienced a low energy transition from fluvial to marsh<br />
sediments. In the central and southern portions of the grid core data suggest that much of the sediment was<br />
deposited in a high-energy intertidal environment.<br />
The potential for occurrence and preservation of prehistoric archaeological sites within MB-1 is moderate.<br />
This site spans a well documented paleochannel of the San Diego River. In the northern portion of MB-1<br />
there is a low energy transition between fluvial and marsh sediments that would help to preserve prehistoric<br />
materials contained in the fluvial sediments. In the southern portion of the grid, however, the potential for<br />
site presence and preservation is reduced, given that most of the material in this region is intertidal, perhaps<br />
a lagoonal entrance sand bar.<br />
Historical Results<br />
This proposed borrow site is situated near many historical features. In addition to the intentionally sunken<br />
vessels located in Wreck Alley, at least three other types of subsea cultural features exist within the<br />
immediate vicinity of MB-1. Artificial reef materials are positioned in several locations proximate to or<br />
directly within MB-1. To date, this area holds 13,000 tons of concrete rubble or quarry rock. Plans call<br />
for an additional 12,000 tons of material to be deposited on this site. Several side scan sonar targets<br />
detected in this dredge area may be related to the artificial reef materials. The NOSC tower collapsed onto<br />
the sea floor in 1986, and lies to the east near the proposed dredge area. In addition, the City of San<br />
Diego and the San Diego Oceans Foundation are creating a new underwater park near the MB-1 site. The<br />
Canadian destroyer Yukon will be the first dive site/ artificial reef within the proposed park. Older sunken<br />
historic wreck sites reportedly exist down coast from the NOSC tower location.<br />
There are three unidentified side scan sonar targets in the dredge area. They may be related to the material<br />
deposited over time or they may be historic resources.<br />
SS-1<br />
At SS-1, the water depth varies from 40 feet along the eastern edge of the grid to 53 feet along the western<br />
portion of the grid. A region within the northeast quadrant of area SS-1 has been designated as a source<br />
site for sand dredging. At this site neither side scan sonar, nor seismic sub-bottom profiler lines were<br />
collected for this study, however, side scan sonar and sub-bottom profiler data covering the SS-1 site were<br />
<strong>Regional</strong> <strong>Beach</strong> <strong>Sand</strong> <strong>Project</strong> <strong>EIR</strong>/<strong>EA</strong> Page 3.5-13<br />
99-69\SANDAG <strong>EIR</strong><strong>EA</strong> 3.5 to 3.12.wpd 7/17/00
3.5 Cultural Resources<br />
previously collected as part of the South Bay Tunnel Outfall <strong>Project</strong>, and the interpretation of these data<br />
were made available (Pettus 1995).<br />
Geoarchaeological Results<br />
An offshore archaeological artifact site is recorded near SS-1, along the northern margin of the Tijuana<br />
River channel, at intertidal depths (Table 3.5-1, Site 21). No survey has been recorded in the area, but<br />
at least one stone mortar has been recovered from this site. A bathymetric high exists offshore of the<br />
present day slough mouth. Several recorded prehistoric sites are located along the Pleistocene terrace<br />
which defines the southern margin of the Tijuana River estuary.<br />
The dredge area for SS-1 spans the offshore paleochannel of the Tijuana River, where the paleochannel<br />
makes a bend from an east-west direction toward a more southerly direction. None of the vibracores<br />
reached bedrock; all have abundant sand, and some have a shallow buried clay layer. The deepest levels<br />
within the cores suggest fluvial sediments with poorly sorted and sandy sediments. The aforementioned clay<br />
layer represent a transition to the presence of finer grained marsh sediments above the fluvial layer. Cores<br />
throughout the site reveal a sequence of sedimentary environments from top to bottom as follows: offshore,<br />
lagoonal, marsh, and fluvial. A geological cross-section based on these data reveals a gently south-dipping<br />
contact between fluvial sediments on the bottom, and marsh above. The upper two sedimentary layers are<br />
flat-lying lagoonal and offshore facies.<br />
The potential for occurrence and preservation of archaeological sites within the dredge area for SS-1 is<br />
high, given the presence of a paleochannel, and a low energy interface between fluvial and marsh deposits.<br />
The most likely region to encounter buried cultural materials may be in the northern portion of the grid,<br />
along the margins of the paleochannel.<br />
Historic Results<br />
No seismic or magnetometry data were acquired at this location. However, other remote sensing surveys<br />
have been conducted in the area (Pettus 1995). Results from these offshore surveys were reviewed for<br />
this project. A recorded historic site (the destroyer USS Hogan (DD178)) is located offshore of the<br />
project area. A military aircraft (S2F Tracker) and a sunken sailboat were recorded in 97 feet of water<br />
during studies related to the South Bay Tunnel Outfall (Pettus 1995). The project area lies within a high<br />
potential zone for historic (and modern) shipwrecks and aircraft losses.<br />
Page 3.5-14<br />
<strong>Regional</strong> <strong>Beach</strong> <strong>Sand</strong> <strong>Project</strong> <strong>EIR</strong>/<strong>EA</strong><br />
99-69\SANDAG <strong>EIR</strong><strong>EA</strong> 3.5 to 3.12.wpd 7/17/00
3.6 Land and Water Use<br />
3.6 LAND AND WATER USE<br />
This section describes existing land uses in the project areas and in the surrounding communities, and<br />
identifies pertinent general plan designations for the cities of Oceanside, Carlsbad, Encinitas, Solana <strong>Beach</strong>,<br />
Del Mar, San Diego, and Imperial <strong>Beach</strong>.<br />
Proposed land uses are described in Chapter 5.0 (Cumulative Impacts). In general, proposed land uses<br />
in vicinity of the receiver sites include beach replenishment projects and road improvements.<br />
This section also describes existing and designated recreational uses within the project areas. The Pacific<br />
Ocean and its shores are the focus of recreational activity which also define land uses in the project areas.<br />
Recreation and other beneficial uses are protected by the California Ocean Plan which establishes<br />
standards to preserve the quality of ocean waters for use and enjoyment by the people of the State<br />
(SWRCB 1997). At all proposed receiver beaches, most of the same recreational activities occur and are<br />
therefore not discussed separately. Unique recreational activities are noted under the discussion of that<br />
particular receiver beach. Most recreational pursuits occur during the warmer spring and summer months,<br />
but are also popular during the fall and winter months due to the San Diego region’s mild climate.<br />
Additional information regarding the value of recreational fishing and diving is provided in Section 3.8.<br />
Each jurisdiction is responsible for maintaining a quality environment for its citizens and users through<br />
adoption of long-range planning documents. These documents contain goals, policies, implementation<br />
procedures, and regulatory controls, including permitting requirements, to guide and enforce conformance.<br />
State and federal agencies rely on executive orders, various laws, codes, mandates, management plans,<br />
and master plans to govern land use decisions within their jurisdiction. The most common guide used by<br />
local jurisdictions to define land use patterns is the general plan, which is, in turn, consistent with local<br />
ordinances. Land use elements of general plan documents typically contain those policies and maps<br />
governing land use compatibility within the jurisdiction. LCPs are also key planning documents guiding land<br />
use within the Coastal Zone, as defined by the California Coastal Act (Cal. Code Regs. Title 14, § 30000).<br />
Coastal Plans and Policies<br />
Under the federal Coastal Zone Management Act of 1972 (16 C.F.R. § 1451 (1997)), long range planning<br />
and management of California’s coastal zone was conferred to the state with implementation of the<br />
California Coastal Act in 1977. The California Coastal Act (Cal. Code Regs. Title 14 § 30000) created<br />
<strong>Regional</strong> <strong>Beach</strong> <strong>Sand</strong> <strong>Project</strong> <strong>EIR</strong>/<strong>EA</strong> Page 3.6-1<br />
99-69\SANDAG <strong>EIR</strong><strong>EA</strong> 3.5 to 3.12.wpd 7/17/00
3.6 Land and Water Use<br />
the CCC who assist local governments in implementing local coastal planning and regulatory powers.<br />
Under that Act, local governments are encouraged to adopt LCPs. The LCP consist of a Land Use Plan<br />
(LUP) with goals and regulatory policies as well as a set of Implementing Ordinances. Of the seven local<br />
jurisdictions for this project, six have approved LCPs acceptable to the CCC (Solana <strong>Beach</strong> is currently<br />
drafting its LCP).<br />
Several sections of the California Coastal Act focus on shoreline construction, specifically Sections 30235,<br />
30233, and 30706. All of these sections contain an element pertaining to the protection of existing<br />
structures and the protection of public beaches in danger of erosion. Under these sections, construction<br />
will be allowed through revetments, breakwaters, groins, or other means that alters natural shoreline<br />
processes; dredging of open coastal waters, lakes, wetlands, and other areas will be permitted only where<br />
less feasible environmentally damaging alternatives are not available. In particular, in Section 30233,<br />
dredging and spoils disposal, planned to avoid significant disruption to marine and wildlife habitats and<br />
water circulation, is allowed for restoration purposes. Section 30233 states further that dredge spoils<br />
suitable for beach replenishment should be transported to appropriate beaches or into suitable longshore<br />
current systems. The Coastal Act also requires that new construction (Section 30253[2]) shall not require<br />
the construction of protective devices for erosion control.<br />
California State Lands Commission<br />
The California State Lands Commission (CSLC) has exclusive jurisdiction over all of California’s tide and<br />
submerged lands and the beds of naturally navigable rivers and lakes, which lands are sovereign lands, and<br />
swamp and overflow lands and State School Lands (proprietary lands).<br />
Authority of the CSLC originates and is exercised from the state’s position as a landowner. The CSLC<br />
has statutory authority (Division 6 of the California Resources Code) to approve appropriate uses of state<br />
lands under its jurisdiction and is the administrator of the Public Trust Doctrine over sovereign lands. The<br />
Public Trust is a sovereign public property right held by the State or its delegated trustee for the benefit of<br />
the people. This right limits the uses of these lands to waterborne commerce, navigation, fisheries, open<br />
space, recreation, or other recognized Public Trust purposes. Sovereign lands may only be used for<br />
purposes consistent with this public trust, which uses include commerce, navigation, fisheries, open space,<br />
wetlands and other related trust uses. The CSLC has an oversight responsibility for tide and submerged<br />
lands legislatively granted in trust to local jurisdictions (Public Resources Code § 6301).<br />
Page 3.6-2<br />
<strong>Regional</strong> <strong>Beach</strong> <strong>Sand</strong> <strong>Project</strong> <strong>EIR</strong>/<strong>EA</strong><br />
99-69\SANDAG <strong>EIR</strong><strong>EA</strong> 3.5 to 3.12.wpd 7/17/00
3.6 Land and Water Use<br />
Management responsibilities of the CSLC extend to activities within submerged lands and those within three<br />
nautical miles offshore. These activities include oil and gas developments; harbor development and<br />
management oversight; construction and operation of any offshore pipelines or other facilities; dredging;<br />
reclamation; use of filled sovereign lands; topographical and geological studies; and other activities which<br />
occur on these lands. The CSLC also surveys and maintains title records of all state sovereign lands as well<br />
as settling issues of title and jurisdiction.<br />
3.6.1 Receiver Sites<br />
For each of the 13 possible receiver sites, on-site and adjacent land uses (including recreation) are<br />
described, followed by a discussion of land use policies applicable to the proposed action. The proposed<br />
offshore borrow sites are described separately.<br />
Recreational activities at all proposed receiver sites include a variety of onshore and offshore activities,<br />
including walking/jogging, swimming, surfing, windsurfing, sunbathing, beach combing, fishing (both<br />
commercial and sportfishing), SCUBA and skin diving, hiking, picnicking, boating, sailing, and bicycling.<br />
Surfing sites in the project areas are shown in Figures 3.6-1 and 3.6-2. Fishing includes commercial fishing,<br />
sport fishing, lobster fishing, and gillnetting. Some of the species most commonly caught in the region<br />
include white seabass, rockfish, shark, halibut, lobster, sea urchins, and abalone. Fishing can occur<br />
throughout the offshore area, although most of the activity concentrates around offshore kelp beds. For<br />
more information on the commercial fishing industry, refer to Sections 3.8 and 4.8 (Socioeconomics). The<br />
large majority of human activity occurs closer to shore that at the outer edge of the kelp beds. Near the<br />
proposed offshore borrow sites, whale watching is a popular recreational activity.<br />
South Oceanside<br />
On-site and Adjacent Land Use<br />
Under the maximum length alternative, the proposed South Oceanside receiver site stretches for<br />
approximately two miles from Seagaze Drive to Vista Way. Buccaneer <strong>Beach</strong> is a small pocket beach<br />
situated in the center of the proposed receiver site. The receiver site is used for recreational activities,<br />
especially in the southern portion. The area immediately adjacent to the South Oceanside receiver site is<br />
mostly comprised of a mix of new and older residential uses. Rip-rap (large boulders) exists to protect<br />
beach front residences and structures. Scattered commercial and retail activities, mostly associated<br />
<strong>Regional</strong> <strong>Beach</strong> <strong>Sand</strong> <strong>Project</strong> <strong>EIR</strong>/<strong>EA</strong> Page 3.6-3<br />
99-69\SANDAG <strong>EIR</strong><strong>EA</strong> 3.5 to 3.12.wpd 7/17/00
X.X Section Name<br />
Oceanside Jetty<br />
Oceanside Pier<br />
South Oceanside<br />
South Oceanside<br />
Receiver Site<br />
North Carlsbad<br />
Receiver Site<br />
Offshore<br />
Tamarack<br />
South Carlsbad<br />
Receiver Site<br />
PACIFIC<br />
OC<strong>EA</strong>N<br />
Warm Water Jetty<br />
Terra Mar<br />
South Carlsbad<br />
State <strong>Beach</strong><br />
Ponto<br />
Boneyards<br />
Swami’s<br />
Pipes<br />
Traps<br />
Turtles<br />
85/60’s<br />
Tippers<br />
Tomato Patch<br />
Grandview<br />
Seaside Reef<br />
Palisades<br />
Tabletops<br />
Beacon’s<br />
Stone Steps<br />
and Moonlight<br />
D Street<br />
Cardiff Reef<br />
George’s<br />
Pill Box<br />
Cherry Hill<br />
Rivermouth<br />
<strong>Beach</strong> Break<br />
15th Street<br />
9th Street<br />
Encinitas<br />
Receiver Site<br />
Leucadia<br />
Receiver Site<br />
Cardiff<br />
Receiver Site<br />
Solana <strong>Beach</strong><br />
Receiver Site<br />
Del Mar<br />
Receiver Site<br />
Torrey<br />
Pines<br />
Receiver<br />
Site<br />
Torrey Pines<br />
Black’s<br />
Source: DoN 1993<br />
NORTH<br />
CALIF<br />
PROJECT LOCATION<br />
Figure 3.6-1<br />
Surfing Spots Near Proposed Receiver Sites<br />
(Northern Region)<br />
Page 3.6-4<br />
<strong>Regional</strong> <strong>Beach</strong> <strong>Sand</strong> <strong>Project</strong> <strong>EIR</strong>/<strong>EA</strong><br />
9969 <strong>Beach</strong> Replenishment\Figures\Fig 3-6.1 3/30/99
X.X Section Name<br />
Mission <strong>Beach</strong><br />
Receiver Site<br />
<strong>Beach</strong> Breaks<br />
South<br />
Mission Jetty<br />
I.B. Pier<br />
Imperial <strong>Beach</strong><br />
Receiver Site<br />
<strong>Beach</strong> Break<br />
Tijuana Sloughs<br />
Source: DoN 1993<br />
NORTH<br />
CALIF<br />
PROJECT LOCATION<br />
Figure 3.6-2<br />
Surfing Spots Near Proposed Receiver Sites<br />
(Southern Region)<br />
<strong>Regional</strong> <strong>Beach</strong> <strong>Sand</strong> <strong>Project</strong> <strong>EIR</strong>/<strong>EA</strong><br />
9969 <strong>Beach</strong> Replenishment\Figures\Fig 3-6.2 3/30/99<br />
Page 3.6-5
3.6 Land and Water Use<br />
with the tourism industry, also exist along adjacent roadways. The Strand, a beach front road that extends<br />
from Seagaze Drive to Wisconsin Avenue, abuts the northern end of the proposed receiver site. The Loma<br />
Alta Creek mouth is also adjacent to the replenishment footprint at Buccaneer <strong>Beach</strong>.<br />
Most recreational watersports occur adjacent to the Oceanside Pier, although there are scattered sand drift<br />
surf breaks near the proposed receiver site. Surfing conditions in this area are primarily dependent upon<br />
shifting formations of nearshore sandbars; surfing conditions tend to be good all year round. Popular surf<br />
spots near the receiver site are shown on Figure 3.6-1.<br />
The South Oceanside receiver beach involves CSLC sovereign land granted to the City of Oceanside<br />
pursuant to Chapter 848, Statutes of 1979. As such, any permits necessary for the proposed action would<br />
be granted by the City, as trustee of these lands.<br />
Land Use Policies<br />
The proposed receiver site is located within the Coastal Zone as designated in the City of Oceanside Land<br />
Use Element of the General Plan (1989). The objective of the coastal zone is to provide for the<br />
conservation of the City’s coastal resources and fulfill the requirements of the California Coastal Act of<br />
1976.<br />
In compliance with the California Coastal Act of 1976, the City adopted a LCP in 1985. The coastal zone<br />
boundary runs parallel to Coast Highway and west to the ocean. The north shore of the Buena Vista<br />
lagoon and an area north of Mission Avenue and east of I-5 are also included in the boundary area. In<br />
general, the LCP requires that development not interfere with the public access to and along the shoreline.<br />
As stated in Policy A of Section 1.32 of the Land Use Element,<br />
The City shall utilize the certified Local Coastal Plan and supporting documentation<br />
for review of all proposed projects within the Coastal Zone. Specifically, the goals<br />
and policies of the Local Coastal Program Land Use Plan shall be the guiding policy<br />
review document.<br />
Page 3.6-6<br />
<strong>Regional</strong> <strong>Beach</strong> <strong>Sand</strong> <strong>Project</strong> <strong>EIR</strong>/<strong>EA</strong><br />
99-69\SANDAG <strong>EIR</strong><strong>EA</strong> 3.5 to 3.12.wpd 7/17/00
3.6 Land and Water Use<br />
In the Land Use Element, Section 3.17 Coastal Preservation, are the following policies:<br />
A. The City shall attempt to preserve shoreline beach area as a valuable<br />
recreational asset and visitor inducement.<br />
B. The City shall continue with periodic replenishment of beach sand by the<br />
Federal government until permanent beach sand management systems are<br />
decided on and implemented.<br />
Within the LCP, two of the major coastal access findings state:<br />
I.B.3.<br />
Lateral access along the beach is presently restricted because of the severely<br />
eroded condition of the beach from the southerly end of the Strand to the<br />
Buena Vista Lagoon. Restoration of the beach will greatly improve lateral<br />
access, as well as enlarging the usable beach area.<br />
I.B.4.<br />
Existing rock seawalls may, in some instances, inhibit lateral access,<br />
especially at high tide. However, the presence of the seawalls bears a direct<br />
relationship to the beach erosion problem which both necessitates shoreline<br />
protection and inhibits lateral access. Restoration of the beach may diminish<br />
this problem.<br />
In the City’s LCP, the following recreation-related findings are presented:<br />
II.B.1. There has been a periodic decline in beach usage in Oceanside which<br />
corresponds to the seriousness of the beach erosion problem.<br />
II.B.6. Future growth in beach usage in Oceanside will depend upon:<br />
a. Restoration of the beach.<br />
II.C.5. The City shall continue to take the initiative to resolve the problem of beach<br />
erosion.<br />
<strong>Regional</strong> <strong>Beach</strong> <strong>Sand</strong> <strong>Project</strong> <strong>EIR</strong>/<strong>EA</strong> Page 3.6-7<br />
99-69\SANDAG <strong>EIR</strong><strong>EA</strong> 3.5 to 3.12.wpd 7/17/00
3.6 Land and Water Use<br />
As evidenced in the City’s General Plan and LCP, beach replenishment is an important goal of coastal<br />
planning for the City of Oceanside.<br />
North Carlsbad<br />
On-site and Adjacent Land Use<br />
The North Carlsbad receiver site, located within the jurisdiction of the City of Carlsbad, stretches for<br />
approximately 4,000 feet (0.8 mile) from just south of the Buena Vista Lagoon to Carlsbad Village Drive<br />
(Elm Avenue). Carlsbad State <strong>Beach</strong> is located immediately south of the receiver site. The receiver site<br />
is moderately utilized for beach activities due to its confined location between Buena Vista Lagoon and<br />
Carlsbad State <strong>Beach</strong> and proximity to local residences. The Parks and Recreation Department reported<br />
651,622 visitors to Carlsbad State <strong>Beach</strong> in fiscal-year 1997-1998 (California Department of Parks and<br />
Recreation 1999). Access to the site is via public accessways from Ocean Street and Carlsbad Boulevard.<br />
Several lifeguard towers exist, and there is also occasional rip-rap to protect beach front properties. The<br />
area located adjacent to the proposed receiver beach site is comprised of new and older residential uses<br />
and a military (<strong>Army</strong>/Navy) preparatory school. <strong>Beach</strong> surf breaks (e.g., Offshore and Tamarack) are<br />
scattered along the shore near the proposed receiver site; however, no nearshore reefs supporting surf<br />
breaks are located in the vicinity. Surfing conditions in this area are primarily dependent upon shifting<br />
formations of nearshore sandbars.<br />
The site is located within the Coastal Zone as designated in the City of Carlsbad General Plan (1994). The<br />
objective of the Coastal Zone is to identify areas subject to the requirements of the California Coastal Act<br />
of 1976. Any project within the Coastal Zone is subject to review by the City of Carlsbad and the CCC.<br />
In compliance with the California Coastal Act of 1976, the City certified an LCP in 1980. Subsequent<br />
amendments to the LCP in 1982, 1985, 1988, and 1996 have produced a substantive LCP, comprised<br />
of five segments. The proposed receiver site is located within the Mello II Segment (City of Carlsbad<br />
1996). In general, the LCP requires that development not impact biological or cultural resources, interfere<br />
with the public access to and along the shoreline, or impact visual or natural resources in the Coastal Zone.<br />
The North Carlsbad receiver site involves ungranted sovereign land under the CSLC’s jurisdiction;<br />
authorization from the CSLC would be required for implementation of the proposed action. The owner<br />
Page 3.6-8<br />
<strong>Regional</strong> <strong>Beach</strong> <strong>Sand</strong> <strong>Project</strong> <strong>EIR</strong>/<strong>EA</strong><br />
99-69\SANDAG <strong>EIR</strong><strong>EA</strong> 3.5 to 3.12.wpd 7/17/00
3.6 Land and Water Use<br />
of the Encina Power Plant, Cabrillo Power, has an existing CSLC lease (PRC 932) for deposition of<br />
sediment from the dredging of Agua Hedionda Lagoon immediately south of this receiver site.<br />
Land Use Policies<br />
The following policies identified in the City of Carlsbad Land Use Element of the General Plan, Chapter<br />
III: Environmental, Section C, are relevant to the proposed action:<br />
C.9.<br />
Implement to the greatest extent feasible the natural resource protection<br />
policies of the Local Coastal Program.<br />
C.11.<br />
Participate in programs that restore and enhance the City’s degraded<br />
natural resources.<br />
The following policy identified in the City of Carlsbad LCP, Chapter II-2, Policy 4-1: Coastal Erosion, is<br />
also relevant to the proposed action:<br />
b. <strong>Beach</strong> <strong>Sand</strong> Erosion. Pursue mitigation measures which address the causes of beach<br />
sand erosion; sand dredging ... is one such method which had been suggested. The<br />
City should continue to participate in the <strong>Regional</strong> Coastal Erosion Committee’s<br />
studies of the causes and cures for shoreline erosion.<br />
South Carlsbad (North and South)<br />
On-site and Adjacent Land Use<br />
There are two proposed South Carlsbad receiver sites, one to the north and one to the south. No sand<br />
is proposed at the South Carlsbad South receiver site under Alternative 1. The South Carlsbad North and<br />
South Carlsbad South proposed receiver sites are under the jurisdiction of the California State Department<br />
of Parks and Recreation. An estimated 430,973 persons visited South Carlsbad State <strong>Beach</strong> in fiscal-year<br />
1997-1998 (California Department of Parks and Recreation 1999). The South Carlsbad North receiver<br />
site is located approximately two miles north of the Batiquitos Lagoon inlet, stretching for approximately<br />
2,800 feet (0.5 mile) to the north near Palomar Airport Road, under the maximum length alternative. The<br />
site is bordered by steep vegetated bluffs. The South Carlsbad South receiver site begins just south of the<br />
<strong>Regional</strong> <strong>Beach</strong> <strong>Sand</strong> <strong>Project</strong> <strong>EIR</strong>/<strong>EA</strong> Page 3.6-9<br />
99-69\SANDAG <strong>EIR</strong><strong>EA</strong> 3.5 to 3.12.wpd 7/17/00
3.6 Land and Water Use<br />
South Carlsbad North receiver site, stretching for approximately 1,830 feet (0.3 mile) southward. Due to<br />
their location on a State <strong>Beach</strong> adjacent to the South Carlsbad State <strong>Beach</strong> Campground, the receiver sites<br />
are highly utilized for recreational purposes. The campground consists of 222 campsites, a lifeguard tower,<br />
park ranger facilities, and maintenance facilities. <strong>Beach</strong> surf breaks are scattered along the shore in the<br />
vicinity of the receiver site. No nearshore reefs supporting surf breaks are located within the immediate<br />
vicinity of these receiver sites. Surfing conditions in this area are primarily dependent upon shifting<br />
formations of nearshore sandbars (Figure 3.6-1). Adjacent land use includes several new residential and<br />
mixed use development projects currently being constructed along Coast Highway 101.<br />
At both receiver sites, the CSLC has jurisdiction over sovereign land. Authorization from the CSLC would<br />
be required for implementation of the proposed action.<br />
Land Use Policies<br />
Both sites are located within the Coastal Zone as designated in the City of Carlsbad General Plan (1994).<br />
For relevant plans and policies under the City’s Land Use Element and LCP, refer to the discussion above<br />
under the North Carlsbad subheading.<br />
The receiver sites are also subject to the plans and policies identified in the San Diego Coastal State Park<br />
System General Plan, Volume 3: South Carlsbad State <strong>Beach</strong> (1984). This plan identifies proposed<br />
improvements to South Carlsbad State <strong>Beach</strong> facilities and policies intended to protect natural resources<br />
in the vicinity of the State <strong>Beach</strong>. The following policy is relevant to the proposed action:<br />
Littoral sand loss is recognized as a major threat to existing facilities and<br />
recreational resources. The department shall work with other agencies, including<br />
the California Department of Boating and Waterways, the City of Carlsbad, the San<br />
Diego Association of Governments, and the U.S. <strong>Army</strong> Corps of Engineers, to<br />
develop regional solutions to the sand loss problem. Any major program of sand<br />
replenishment or retention must consider the regional nature of the problem and the<br />
regional impact of actions taken along a segment of the shoreline.<br />
Page 3.6-10<br />
<strong>Regional</strong> <strong>Beach</strong> <strong>Sand</strong> <strong>Project</strong> <strong>EIR</strong>/<strong>EA</strong><br />
99-69\SANDAG <strong>EIR</strong><strong>EA</strong> 3.5 to 3.12.wpd 7/17/00
3.6 Land and Water Use<br />
Encinitas<br />
On-site and Adjacent Land Use<br />
Within the City of Encinitas, there are four proposed receiver sites: Batiquitos, Leucadia, Moonlight <strong>Beach</strong>,<br />
and Cardiff. At all Encinitas receiver sites the CSLC has jurisdiction over sovereign land. Authorization<br />
from the CSLC would be required for implementation of the proposed action.<br />
Batiquitos<br />
The Batiquitos site is located approximately 750 feet south of the Batiquitos Lagoon, stretching for<br />
approximately 1,390 feet (0.3 mile) from the City of Carlsbad into the community of Leucadia and<br />
Leucadia State <strong>Beach</strong>, which are within the City of Encinitas. The northern part of the site is known as<br />
“Ponto.” This state beach is a unit of the state park system, but is operated by the City of Encinitas. The<br />
state beach is subject to the San Diego Coastal State Park System General Plan. Leucadia State <strong>Beach</strong><br />
received 875,026 visitors in fiscal year 1997-1998 (California Department of Parks and Recreation 1999).<br />
Adjacent land use is predominantly open space and residential, with some commercial uses along Coast<br />
Highway 101.<br />
Due to erosion at this site, it is only moderately used for recreational purposes. In addition, public access<br />
to the southern segment of this beach is limited due to steep cliffs abutting the beach. There are also<br />
lifeguard stands along the beach. Several popular surf breaks exist along the shore in the vicinity of the<br />
receiver site, including Ponto, Tomato Patch, and Grandview (Figure 3.6-1). All surf breaks from Tomato<br />
Patch south to D Street are beach breaks with waves produced by scattered rocky reefs.<br />
Leucadia<br />
The proposed receiver beach at this site extends approximately 2,700 feet (0.5 mile) from just south of the<br />
Grandview access stairs to Glaucus Street. As described above, this state beach is a unit of the state park<br />
system, but is operated by the City of Encinitas. The Leucadia site is similar to the southern end of the<br />
Batiquitos site in that recreation is limited due to difficult access. Public stairways exist at Grandview Street<br />
and Leucadia Boulevard (Beacon’s), and several private stairways serve existing residences atop the bluff.<br />
The Leucadia receiver site is adjacent to the same surf breaks and reefs mentioned above for the Batiquitos<br />
<strong>Regional</strong> <strong>Beach</strong> <strong>Sand</strong> <strong>Project</strong> <strong>EIR</strong>/<strong>EA</strong> Page 3.6-11<br />
99-69\SANDAG <strong>EIR</strong><strong>EA</strong> 3.5 to 3.12.wpd 7/17/00
3.6 Land and Water Use<br />
site (Figure 3.6-1). Adjacent land use is predominantly residential, with some commercial uses along Coast<br />
Highway 101.<br />
Moonlight <strong>Beach</strong><br />
The proposed Moonlight <strong>Beach</strong> receiver site is located at the foot of Encinitas Boulevard at Moonlight<br />
State <strong>Beach</strong>. The proposed site is approximately 770 feet long (0.1 mile). Moonlight State <strong>Beach</strong> is a unit<br />
of the state park system, but is operated by the City of Encinitas. The state beach is subject to the San<br />
Diego Coastal State Park System General Plan. In the fiscal year 1997-1998, there were 857,735 visitors<br />
to Moonlight State <strong>Beach</strong> (California Department of Parks and Recreation 1999). Facilities at Moonlight<br />
State <strong>Beach</strong> include two lifeguard towers, volleyball and tennis courts, picnic facilities, recreational<br />
equipment rentals and a snack bar. The southern part of the site abuts the Encinitas City Marine Life<br />
Refuge (California Fish and Game Code § 10913). Within Refuge boundaries, it is illegal to take<br />
invertebrates or marine life specimens except under a permit. Kelp harvesting, for recreational or<br />
commercial use, is prohibited except under a permit.<br />
R<br />
R<br />
R<br />
R<br />
Residential uses occur adjacent to the site, to the north and south. The beach area is relatively flat, but<br />
quickly slopes up to the east, north, and south. Public access is found at Moonlight State <strong>Beach</strong> and south<br />
at the D Street stairway. Popular surf breaks along this stretch are primarily a result of beach access points<br />
(due to difficulty in access along the southern segment along the steep coastal cliffs). Moving south from<br />
G Street, the surf breaks are more heavily influenced by reefs. Wave peaks are formed from reefs located<br />
within the surf zone. Boneyards and Swami’s are examples of reef surf breaks south of the Moonlight<br />
receiver site (Figure 3.6-1).<br />
Cardiff<br />
<strong>Beach</strong> replenishment at this site would occur southwest of San Elijo Lagoon and Cardiff Reef. The<br />
proposed receiver site is approximately 780 feet long (0.1 mile) and comprises the northern end of Cardiff<br />
State <strong>Beach</strong>. The proposed Cardiff site is characterized by cobble beaches and a steep, 10- to 15- foot<br />
berm south of Restaurant Row. The site is located adjacent to Coast Highway 101. In its entirety, Cardiff<br />
State <strong>Beach</strong> stretches from Cardiff Reef south to Seaside Reef and encompasses approximately 25 acres<br />
and has 6,550 feet of ocean frontage. The facility includes two parking lots (at the north and south ends<br />
of the beach), restrooms, and an emergency vehicle access ramp. The California Department of Parks and<br />
Recreation recorded approximately 1,124,000 visitors at Cardiff State <strong>Beach</strong> during the 1995/1996 season<br />
Page 3.6-12<br />
<strong>Regional</strong> <strong>Beach</strong> <strong>Sand</strong> <strong>Project</strong> <strong>EIR</strong>/<strong>EA</strong><br />
99-69\SANDAG <strong>EIR</strong><strong>EA</strong> 3.5 to 3.12.wpd 7/17/00
3.6 Land and Water Use<br />
(California Department of Parks and Recreation 1997). This estimate includes visitors to the south and<br />
central sections of Cardiff State <strong>Beach</strong> (i.e., George’s and Seaside). A popular surf break in the vicinity<br />
of the proposed receiver beach is Cardiff Reef. George’s was also formerly a popular surf break (located<br />
south of Restaurant Row) but in recent years has lacked quality surf due to beach erosion and sandbar loss.<br />
Restaurant Row, which includes restaurants, offices, and shops, exists approximately 500 feet south of the<br />
San Elijo Lagoon inlet along the waterfront.<br />
The north of the lagoon is San Elijo State <strong>Beach</strong>, which is a highly used recreational facility. This beach<br />
includes approximately 42 acres with 7,190 feet of ocean frontage and is more developed than Cardiff<br />
State <strong>Beach</strong>. Its facilities include a 171-unit campground with five comfort stations, an 86–space day use<br />
parking lot, a unit office, an entrance station, a concessions building, a lifeguard tower, an informal<br />
campground center, and six beach access stairways. In addition to activities commonly encountered at<br />
Cardiff State <strong>Beach</strong>, San Elijo State <strong>Beach</strong> is also a popular camping spot. San Elijo State <strong>Beach</strong> had<br />
approximately 471,651 visitors in fiscal year 1997-1998 (California Department of Parks and Recreation<br />
1999).<br />
The San Elijo Lagoon Ecological Reserve is adjacent to the site, just east of Coast Highway 101.<br />
Recreation at the Reserve is primarily limited to passive uses such as hiking and bird watching.<br />
Surfing is a popular water activity within the Cardiff area and generally occurs along the entire stretch of<br />
Cardiff and San Elijo State <strong>Beach</strong>es, although it is most concentrated in a number of areas, including Cardiff<br />
Reef, Seaside Reef, Palisades, and Tabletops (Figure 3.6-1).<br />
The waters off of Cardiff State <strong>Beach</strong> also support nonrecreational uses, including commercial fishing, kelp<br />
harvesting, and behavioral studies of the bottlenose dolphin (Tursiops truncates). Commercial fishing<br />
generally occurs in the same locations as recreational fishing.<br />
Land Use Policies<br />
All four Encinitas sites are located within the Coastal Zone as designated in the City of Encinitas General<br />
Plan (1989). Any project within the Coastal Zone is subject to review by the City of Encinitas and the<br />
CCC. Public beaches in the City of Encinitas are designated as Ecological Resource/Open Space/Parks<br />
in the City’s General Plan (1989). The Leucadia and Moonlight beach sites are also within the Coastal<br />
Bluff Overlay zone.<br />
<strong>Regional</strong> <strong>Beach</strong> <strong>Sand</strong> <strong>Project</strong> <strong>EIR</strong>/<strong>EA</strong> Page 3.6-13<br />
99-69\SANDAG <strong>EIR</strong><strong>EA</strong> 3.5 to 3.12.wpd 7/17/00
3.6 Land and Water Use<br />
The Encinitas General Plan identifies issues and opportunities relative to planning decisions within the City.<br />
Regarding beaches, the plan states, “the beach areas are losing sand depth each year and sand<br />
replenishment programs are needed to provide for their restoration.” Additionally, the Resource<br />
Management Element of the General Plan identifies the following policies relevant to the proposed action:<br />
8.6 The City will encourage measures which would replenish sandy beaches in<br />
order to protect coastal bluffs from wave action and maintain beach<br />
recreational resources. The City shall consider the needs of surf-related<br />
recreational activities prior to implementation of such measures.<br />
10.3 The City shall explore the prevention of beach sand erosion. <strong>Beach</strong>es shall be<br />
artificially nourished with excavated sand whenever suitable material becomes<br />
available through excavation or dredging, in conjunction with the development of<br />
a consistent and approved project. The City shall obtain necessary permits to be<br />
able to utilize available beach replenishment sands (as necessary, permits from the<br />
<strong>Army</strong> Corps of Engineers, California Coastal Commission, Department of Fish and<br />
Game, USEPA, etc.).<br />
In compliance with the California Coastal Act of 1976, the City of Encinitas includes an LCP LUP in its<br />
General Plan. The LUP identifies policies and provisions that serve to apply the Coastal Act in the City.<br />
Leucadia, Moonlight, and Cardiff State <strong>Beach</strong>es, operated and maintained by the California State<br />
Department of Parks and Recreation, are subject to guidelines set forth in the San Diego Coastal State<br />
Park System General Plan (refer to the relevant land use policy described under South Carlsbad State<br />
<strong>Beach</strong>).<br />
Solana <strong>Beach</strong><br />
On-site and Adjacent Land Use<br />
The proposed receiver site in the City of Solana <strong>Beach</strong> is located just south of Fletcher Cove <strong>Beach</strong> Park<br />
(terminus of Plaza Drive) and extends approximately 1,800 feet (0.3 mile) south. Steep cliffs abut the<br />
receiver site and the area consists of a gently sloping sand beach with scattered rocks and cobbles.<br />
Fletcher Cove received 51,000 cy of sand from excavated fill in the spring of 1999 (Semple 1999). The<br />
Page 3.6-14<br />
<strong>Regional</strong> <strong>Beach</strong> <strong>Sand</strong> <strong>Project</strong> <strong>EIR</strong>/<strong>EA</strong><br />
99-69\SANDAG <strong>EIR</strong><strong>EA</strong> 3.5 to 3.12.wpd 7/17/00
3.6 Land and Water Use<br />
fill was excavated in 1998 and 1999 as part of the nearby Lomas Santa Fe Drive railroad grade separation<br />
project. Residential development and some commercial uses exist above the receiver site along the bluff.<br />
The bluffs and beach are severely eroded, and numerous efforts to slow erosion, such as rip-rap, the filling<br />
in of sea caves, sea walls, and other revetments occur along the bluffs and beach. There is also a lifeguard<br />
station and public shower at Fletcher Cove.<br />
A small subtidal reef exists north of Fletcher Cove, known as Pill Box. Surfing is a popular activity at this<br />
reef. Surfing is also popular farther south at Cherry Hill and north at Tabletops, where other subtidal reefs<br />
exist (Figure 3.6-1).<br />
The proposed receiver beach is within the CCC’s jurisdiction. Any decisions regarding activities on the<br />
beach would be subject to the Commission’s review and approval.<br />
Land Use Policies<br />
The City of Solana <strong>Beach</strong> currently has no approved LCP. The City anticipates preparation of an LCP<br />
in 2000 (Mitchell 1999).<br />
Del Mar<br />
On-site and Adjacent Land Use<br />
The proposed receiver site in the City of Del Mar extends from 27 th Street to Powerhouse Park, a distance<br />
of approximately 3,110 feet (0.6 mile). The beach has recently increased in size compared to the winter<br />
of 1997-1998, when El Niño-driven storms destroyed two beach front homes and substantially reduced<br />
the width and depth of the beach. The beach itself is designated Public Parkland in the City of Del Mar<br />
Community Plan (1976) and is within the City’s <strong>Beach</strong> Overlay Zone (City of Del Mar 1993). Most of<br />
the receiver site falls within the City’s North <strong>Beach</strong> District. The receiver site is lined with low and medium<br />
density residential uses and sea walls for most of its length, the exception being the southern end of the<br />
receiver site. At this southern end, Visitor Commercial and <strong>Beach</strong> Commercial uses exist including a motel,<br />
a hotel, and restaurants. Also at the southern end is Powerhouse Park, which is a Public Parkland use<br />
designated by the City. Powerhouse Park lies atop steep vegetated bluffs. Nearby surf spots are shown<br />
on Figure 3.6-1.<br />
R<br />
R<br />
<strong>Regional</strong> <strong>Beach</strong> <strong>Sand</strong> <strong>Project</strong> <strong>EIR</strong>/<strong>EA</strong> Page 3.6-15<br />
99-69\SANDAG <strong>EIR</strong><strong>EA</strong> 3.5 to 3.12.wpd 7/17/00
3.6 Land and Water Use<br />
The Del Mar receiver site involves ungranted sovereign land under the jurisdiction of the CSLC. As such,<br />
authorization from the CSLC would be required for implementation of the proposed action.<br />
Land Use Policies<br />
The Environmental Management chapter of the City’s Community Plan (1976) identifies beach erosion and<br />
sand loss as severe problems. Towards that end, the City’s Community Plan identifies the following<br />
objective.<br />
Goal 1J.<br />
Restore environmentally degraded areas to the high quality standards<br />
implied in the objectives above.<br />
This goal strives for consistency with standards provided elsewhere in the Environmental Management<br />
chapter. In addition, the more recent LCP for the City (1993) indicates the critical need to implement sand<br />
replenishment programs to protect property, structures, and coastal bluffs. For instance:<br />
Goal III-5<br />
Continue to study and implement shoreline management and<br />
replenishment programs applicable to the Oceanside littoral cell<br />
through participation in the activities of the regional organizations<br />
and agencies...<br />
The City of Del Mar passed an initiative in 1988 that created a <strong>Beach</strong> Overlay Zone (BOZ). According<br />
to the City’s LCP Land Use Plan, the BOZ:<br />
regulates the uses of the Del Mar beach area, a distinct and valuable natural<br />
resource, for the benefit of present and future generations. The regulations...shall<br />
be administered so as to protect public access to and along the shoreline, while<br />
promoting public safety, health and welfare, and providing for the protection of<br />
private property.<br />
<strong>Beach</strong> Overlay Zone regulations restrict development in the BOZ so as to minimize erosion effects along<br />
the City’s coastline. However, BOZ regulations for development projects do not apply to sand<br />
replenishment projects as described below:<br />
Page 3.6-16<br />
<strong>Regional</strong> <strong>Beach</strong> <strong>Sand</strong> <strong>Project</strong> <strong>EIR</strong>/<strong>EA</strong><br />
99-69\SANDAG <strong>EIR</strong><strong>EA</strong> 3.5 to 3.12.wpd 7/17/00
3.6 Land and Water Use<br />
Goal III-7, No. 15<br />
<strong>Sand</strong> Replenishment <strong>Project</strong>s. A sand replenishment project<br />
shall not be considered development within the meaning of<br />
these <strong>Beach</strong> Overlay Zone regulations where each of the<br />
following criteria are met:<br />
1. No structure or material other than sand is permanently<br />
placed on the beach;<br />
2. The proposed replenishment program is approved in<br />
advance by the City as to the quantities of sand to be placed<br />
on the beach, the location of the replenishment, the quality of<br />
the material to be used in the replenishment project, the time<br />
in which the project is to occur, and any other relevant<br />
aspects of the proposed project.<br />
Torrey Pines<br />
On-site and Adjacent Land Use<br />
The proposed Torrey Pines receiver site is located within the jurisdiction of the City of San Diego and the<br />
California Department of Parks and Recreation. Under the maximum length alternative, the site stretches<br />
for approximately 2,470 feet (0.5 mile) and is located on Torrey Pines State <strong>Beach</strong> adjacent to North<br />
Torrey Pines Road. Nearby land use includes the open space of Torrey Pines State <strong>Beach</strong>/Reserve and<br />
the Los Peñasquitos Lagoon. Public access is via trails at Torrey Pines State <strong>Beach</strong>/Reserve and along<br />
North Torrey Pines Road. The beach includes lifeguard stations and a 6- to 8-foot sand berm. Rip-rap<br />
has been placed along North Torrey Pines Road to protect it from eroding further (El Niño-driven storms<br />
of 1997-1998 eroded much of this road). Popular surf breaks in the vicinity are scattered beach breaks<br />
along Torrey Pines State <strong>Beach</strong> (Figure 3.6-1). In fiscal year 1997-1998, there were 675,821 visitors<br />
to Torrey Pines State <strong>Beach</strong> (California Department of Parks and Recreation 1999). In addition to the<br />
popular recreational activities found on other San Diego beaches, paragliding and parasailing are popular<br />
at this site.<br />
<strong>Regional</strong> <strong>Beach</strong> <strong>Sand</strong> <strong>Project</strong> <strong>EIR</strong>/<strong>EA</strong> Page 3.6-17<br />
99-69\SANDAG <strong>EIR</strong><strong>EA</strong> 3.5 to 3.12.wpd 7/17/00
3.6 Land and Water Use<br />
The Torrey Pines receiver beach involves sovereign land granted to the City of San Diego pursuant to<br />
Chapter 688, Statutes of 1933. As such, any permits necessary for the proposed action would be granted<br />
by the City, as trustee of these lands.<br />
Land Use Policies<br />
The proposed receiver site at Torrey Pines is located within the Coastal Zone as designated by the City<br />
of San Diego General Plan (1989). The City’s LCP guides development in sensitive coastal areas and<br />
provides for the preservation of natural resources. The City’s LCP requires any project occurring within<br />
the Coastal Zone to be reviewed by the City and the CCC.<br />
The receiver site is also subject to the plans and policies identified in the San Diego Coastal State Park<br />
System General Plan, Volume 8: Torrey Pines State <strong>Beach</strong> and State Reserve (1984). This plan identifies<br />
improvements to facilities at Torrey Pines State <strong>Beach</strong> and policies intended to protect natural resources<br />
in the vicinity of the State <strong>Beach</strong>. The following policy identified in Park System General Plan is relevant<br />
to the proposed action:<br />
<strong>Sand</strong> and similar sediment in active alluvial fans and other storage areas in the Los<br />
Peñasquitos watershed is a valuable resource that shall be considered for<br />
replenishment of littoral beach sand. Material excavated from sediment basins and<br />
other depositional storage areas in the watershed, and which is of suitable quantity,<br />
size, and chemical constituency to meet the management objectives of the state<br />
beach and state reserve, shall be considered for disposal into the littoral zone just<br />
below the Los Peñasquitos Lagoon opening. When beach replenishment is not<br />
needed or appropriate at the time of necessary dredging, the sand should be<br />
deposited for eventual use as beach replenishment, provided that suitable locations<br />
for deposit are available and that steps are taken at them to protect significant<br />
natural resources and their public use.<br />
Page 3.6-18<br />
<strong>Regional</strong> <strong>Beach</strong> <strong>Sand</strong> <strong>Project</strong> <strong>EIR</strong>/<strong>EA</strong><br />
99-69\SANDAG <strong>EIR</strong><strong>EA</strong> 3.5 to 3.12.wpd 7/17/00
3.6 Land and Water Use<br />
Mission <strong>Beach</strong><br />
On-site and Adjacent Land Use<br />
The proposed Mission <strong>Beach</strong> receiver site extends approximately 2,380 feet (0.5 mile) from Ostend Court<br />
to Santa Barbara Place. Land uses in the vicinity include residential, commercial and open space functions.<br />
The Boardwalk, which stretches from Pacific <strong>Beach</strong> Drive south to the terminus of Mission <strong>Beach</strong> Park,<br />
exists along the receiver site. Public access is from the adjacent residential streets and the South Mission<br />
parking lot. As of June 1999, the beach is approximately 25 to 30 feet wide at high tide. The Mission Bay<br />
Boat Channel is approximately two miles south of the proposed receiver site. Nearby surf spots are shown<br />
in Figure 3.6-2.<br />
The Mission <strong>Beach</strong> receiver site involves sovereign land granted to the City of San Diego pursuant to<br />
Chapter 688, Statutes of 1933 and state lands pursuant to Chapter 1054, Statutes of 1939, as amended<br />
with minerals reserved to the State. As such, any permits necessary for the proposed action would be<br />
granted by the City, as trustee of these lands.<br />
Land Use Policies<br />
The site is within the jurisdiction of the City of San Diego and whose future planning is accounted for in the<br />
Mission <strong>Beach</strong> Precise Plan and Local Coastal Program Addendum (1974). In the Conservation Element<br />
of the Precise Plan, Goal 3 states<br />
Conservation of beaches and shoreline to maintain and enhance their benefits for<br />
present and future San Diego residents and visitors.<br />
The proposed receiver site at Mission <strong>Beach</strong> is located within the Coastal Zone (City of San Diego 1974).<br />
The City’s LCP guides development in sensitive coastal areas and provides for the preservation of natural<br />
resources. The City’s LCP requires any project occurring within the Coastal Zone to be reviewed by the<br />
City and the California Coastal Commission. According to the Mission <strong>Beach</strong> Precise Plan LCP,<br />
In view of the heavy use, both in recreation and in research, that both beach and<br />
nonbeach shorelines receive, it is obviously decidable that additional shoreline be<br />
acquired as opportunities present themselves.<br />
<strong>Regional</strong> <strong>Beach</strong> <strong>Sand</strong> <strong>Project</strong> <strong>EIR</strong>/<strong>EA</strong> Page 3.6-19<br />
99-69\SANDAG <strong>EIR</strong><strong>EA</strong> 3.5 to 3.12.wpd 7/17/00
3.6 Land and Water Use<br />
The City of San Diego, in response to beach sand erosion and lateral drift concerns, produced a plan for<br />
shoreline development named The Ocean Edge of San Diego (City of San Diego 1969). The Ocean<br />
Edge of San Diego makes the following recommendations, which are still viable relative to sand<br />
preservation and replenishment:<br />
1. <strong>Sand</strong> replenishment is a regional problem, and any effective long-range management<br />
program should be directed and implemented on the basis of regional studies and policies.<br />
2. A sand replenishment program should be instituted for the San Diego shoreline and<br />
particularly the Pacific <strong>Beach</strong>/Mission <strong>Beach</strong>/Mission Bay beaches...<br />
3. <strong>Sand</strong> replenishment of beaches should be coordinated with future dredging projects and<br />
should be narrow in scope. Selective dredging action should provide the proper mitigating<br />
measures to protect environmentally sensitive habitat areas, i.e., eel grass, from impacts of<br />
the dredging activity...<br />
Imperial <strong>Beach</strong><br />
On-site and Adjacent Land Use<br />
The proposed Imperial <strong>Beach</strong> receiver site (maximum length) extends for approximately 3,470 feet (0.7<br />
mile) from Imperial <strong>Beach</strong> Boulevard to approximately 1,000 feet south of Encanto Avenue. Residential<br />
uses are located along Seacoast Drive South. The Tijuana River Natural Estuarine Research Reserve,<br />
which includes the Tijuana Slough National Wildlife Refuge, managed by the U.S. Fish and Wildlife Service<br />
(USFWS) is located to the south and east. The Imperial <strong>Beach</strong> pier is located approximately 1,000 feet<br />
to the north of the receiver site. Among other recreational activities common to other beaches in the region,<br />
visitors to this beach enjoy nature interpretation due to its proximity to the Tijuana Slough National Wildlife<br />
Refuge. The beach turns from gently sloping and sandy in the northern part of the receiver site to narrow,<br />
steep and cobbly as one travels south. Rip-rap exists along the site to protect beach front property.<br />
Popular surf spots are shown on Figure 3.6-2.<br />
The Imperial <strong>Beach</strong> receiver site involves sovereign lands granted to the San Diego Unified Port District<br />
pursuant to Chapter 1796, Statutes of 1990.<br />
R<br />
R<br />
Page 3.6-20<br />
<strong>Regional</strong> <strong>Beach</strong> <strong>Sand</strong> <strong>Project</strong> <strong>EIR</strong>/<strong>EA</strong><br />
99-69\SANDAG <strong>EIR</strong><strong>EA</strong> 3.5 to 3.12.wpd 7/17/00
3.6 Land and Water Use<br />
Land Use Policies<br />
The Conservation and Open Space Element of the City of Imperial <strong>Beach</strong> General Plan and Coastal Plan<br />
(1994) contains the following policy regarding sand deposition:<br />
CO-1 The <strong>Beach</strong>: Imperial <strong>Beach</strong> has few industries and must, therefore, rely on the<br />
attraction of tourists for economic development. The beach area is most critical and<br />
the City should:<br />
4. Assure continued replenishment of sand.<br />
Goal 11c. Immediate Ocean Shoreline. The ocean, beach and the immediately<br />
abutting land are recognized as an irreplaceable natural resource to be enjoyed by<br />
the entire City and region. This unique, narrow strip of land should receive careful<br />
recognition and planning. The purpose of the beach is to make available to the<br />
people, for their benefit and enjoyment forever, the scenic, natural, cultural, and<br />
recreational resources of the ocean, beach and related lands.<br />
Safety Element, Goal S-11:<br />
The City should protect property by:<br />
d) Working in coordination with SANDAG and other coastal cities in<br />
developing a regional beach replenishment program and continuing to<br />
implement the adopted “Shoreline Preservation Strategy for the San Diego<br />
Region.”<br />
3.6.2 Borrow Sites<br />
The proposed offshore borrow sites are illustrated in Figures 2-15 through 2-20. The sites are located<br />
from approximately 1,800 feet (0.3 mile) to 6,750 feet (1.3 miles) offshore. All of the dredge sites are<br />
surrounded by ocean water and recreational activities include diving, sailing, and fishing. Adjacent uses of<br />
submerged lands include sewer outfalls, artificial reefs, and underwater parks.<br />
<strong>Regional</strong> <strong>Beach</strong> <strong>Sand</strong> <strong>Project</strong> <strong>EIR</strong>/<strong>EA</strong> Page 3.6-21<br />
99-69\SANDAG <strong>EIR</strong><strong>EA</strong> 3.5 to 3.12.wpd 7/17/00
3.6 Land and Water Use<br />
Adjacent water uses to the offshore borrow sites include kelp harvesting and whale watching. A San<br />
Diego-based company, Kelco, harvests the kelp canopy at Point Loma, La Jolla, and from Del Mar to<br />
Carlsbad. Kelp is gathered by a specially designed ship that cuts the kelp to a depth of approximately 4<br />
feet below the surface.<br />
Gray whales migrate through San Diego’s offshore waters twice a year on their way between summer<br />
feeding grounds off Alaska and calving areas in the coastal lagoons of Baja California, Mexico. Private<br />
and charter boats venture out to watch the migrating whales.<br />
With the exception of MB-1, all offshore borrow sites are located in ungranted sovereign lands under the<br />
jurisdiction of the CSLC. A lease is required from the CSLC for any portion of a project extending into<br />
State-owned lands that are under its exclusive jurisdiction.<br />
SO-9<br />
SO-9 is located approximately 3.7 miles to the north of the Oceanside outfall and approximately 500 feet<br />
to the east of the nearest of eight artificial reef habitats (Figure 2-15), comprised of quarry rock, which<br />
occur on an otherwise featureless seafloor (Sea Surveyor 1999). The artificial reefs are created and<br />
maintained by CDFG per a lease from the CSLC (PRC 3136).<br />
SO-7<br />
As shown on Figure 2-11, the Encina Wastewater Authority’s sewer line is located approximately 1.6 miles<br />
north of the SO-7 borrow site. There is also an artificial reef implemented by the San Onofre Nuclear<br />
Generating Station (SONGS), which is located approximately 750 feet north of SO-7. Twelve artificial<br />
reefs are maintained by CDFG, four of which (C9, C10, C11, and C12) are approximately 500 feet from<br />
SO-7's proposed dredge area (Figure 2-6). Within that reef complex, the closest reef to the surface is C2<br />
which sits 21 feet high at -37 feet MLLW, resulting in 16 feet between the top of the reef and the water<br />
surface.<br />
R<br />
R<br />
R<br />
R<br />
SO-6<br />
The SO-6 proposed borrow site would be 350 feet north of the San Elijo ocean outfall. SO-6 is located<br />
seaward of a lease to the Department of Parks and Recreation from the CSLC (PRC 7365) for an<br />
Page 3.6-22<br />
<strong>Regional</strong> <strong>Beach</strong> <strong>Sand</strong> <strong>Project</strong> <strong>EIR</strong>/<strong>EA</strong><br />
99-69\SANDAG <strong>EIR</strong><strong>EA</strong> 3.5 to 3.12.wpd 7/17/00
3.6 Land and Water Use<br />
underwater recreational park. This lease area extends along the shore from Swami’s Point in Encinitas<br />
south to Tabletops Reef in Solana <strong>Beach</strong> and it extends seaward approximately 3,500 feet. SO-6's closest<br />
boundary is approximately 250 feet away (seaward) from the lease area. The closest artificial reef within<br />
the underwater park is located approximately 2,250 feet from SO-6.<br />
SO-5<br />
The SO-5 borrow site is approximately two miles south of the San Diego-La Jolla Underwater Park, a<br />
recreational area for divers. There are no artificial reefs in the vicinity.<br />
MB-1<br />
This borrow site is almost entirely encompassed by the Mission Bay Artificial Reef (MBAR) and is within<br />
700 feet of the proposed San Diego Underwater Recreation Area (Figure 2-19). MBAR is utilized by<br />
recreational fishermen and sport divers. MBAR was permitted by the CCC in 1986 and reauthorized in<br />
1996, and is administered by CDFG. The entire borrow site is within sovereign lands legislatively granted R<br />
to the City of San Diego. Located approximately one mile northwest of the Mission Bay Boat Channel,<br />
MBAR is easily accessed by vessels launched from or moored in Mission Bay. The proposed San Diego<br />
Underwater Recreation Area is located northwest of MBAR.<br />
R<br />
R<br />
Mission Bay Bridge Wreckage reefs 1 and 2, along with Mission Bay Cement reef provide habitat for sport<br />
fished species within MBAR, but the primary resources for sport divers are the sunken vessels of “Wreck<br />
Alley,” which are also utilized by sport fishermen. Wreck Alley is a cooperative effort between the San<br />
Diego Divers Council and the CDFG. The three primary vessels in Wreck Alley are the El Rey, Shooters’<br />
Fantasy, and the Ruby E. The El Rey, a 100-foot long 32-foot beam kelp cutter built in 1946, and<br />
Shooter’s Fantasy (originally the Betty Lou), a 65-foot steel hulled charter sport fisherman built in the<br />
early 1950s, were placed in Wreck Alley in 1986. They rest in approximately 80 feet and 70 feet of water,<br />
respectively. The most popular site in Wreck Alley is the Ruby E, a 160-foot long Coast Guard cutter that<br />
was sunk in 1987 in approximately 80 feet of water. It rests intact and upright on the bottom, and is the<br />
most complex of the wrecks in Wreck Alley. A number of local scuba shops use this wreck in their<br />
advanced dive certification classes. Less visited wrecks in Wreck Alley include Barge #1 with a 65-foot<br />
length and 22-foot beam sunk in 1986 in approximately 75 feet of water north of the El Rey, and the 36-<br />
foot sailboat the Strider, sunk that same year.<br />
<strong>Regional</strong> <strong>Beach</strong> <strong>Sand</strong> <strong>Project</strong> <strong>EIR</strong>/<strong>EA</strong> Page 3.6-23<br />
99-69\SANDAG <strong>EIR</strong><strong>EA</strong> 3.5 to 3.12.wpd 7/17/00
3.6 Land and Water Use<br />
Another important diving resource in Wreck Alley is the Naval Ocean Surveillance Center (NOSC)<br />
Tower. Not intended to be part of the artificial reef program, the tower sunk in a storm in January 1988,<br />
and it rises approximately 30 feet off of the approximately 60 feet bottom. This feature has several popular<br />
names. Erected by NOSC in 1959 for oceanographic research and other studies, it functioned as a Naval<br />
Experimental Lab (NEL), and in late 1987 jurisdiction was transferred to the Chief of Naval Research, and<br />
Scripps Institute of Oceanography (SIO) operated it. Today it is variously referred to as the NOSC, NEL,<br />
or SIO tower, and is a popular dive spot.<br />
Another vessel, the HMCS Yukon, is slated to be sunk by the San Diego Oceans Foundation in the vicinity<br />
of Wreck Alley within the proposed San Diego Underwater Recreation Area. The Yukon is 366-foot long<br />
decommissioned Canadian navy Mackenzie class destroyer, launched in 1961. At 2,890 tons, 70 feet tall,<br />
and with 6 decks, it will be by far the largest artificial reef vessel in the area. It is scheduled to be sunk in<br />
May 2000 in approximately 120 feet of water.<br />
SS-1<br />
The City of San Diego outfall is located approximately 2,000 feet south of the proposed dredge area. The<br />
City of San Diego has two ocean monitoring stations to monitor ocean water and sediment quality near the<br />
end of the City’s outfall. The nearest would be approximately 1.1 miles from SS-1.<br />
Page 3.6-24<br />
<strong>Regional</strong> <strong>Beach</strong> <strong>Sand</strong> <strong>Project</strong> <strong>EIR</strong>/<strong>EA</strong><br />
99-69\SANDAG <strong>EIR</strong><strong>EA</strong> 3.5 to 3.12.wpd 7/17/00
3.7 Aesthetics<br />
3.7 AESTHETICS<br />
Aesthetic resources are comprised of natural and manufactured features that give a particular area its visual<br />
qualities. These features form the overall impression that an observer receives of an area, or its landscape<br />
character. Landforms, water surfaces, vegetation, and manufactured features are considered characteristic<br />
of an area if they are inherent to the structure and function of its landscape.<br />
The significance of a change in visual character is influenced by social considerations, including public value<br />
placed on the resource, public awareness, and general community concern for visual resources in the area.<br />
These social considerations are addressed as visual sensitivity and are defined as the degree of public<br />
interest in a visual resource and concern over adverse changes in the quality of that resource. High visual<br />
sensitivity exists when the public can be expected to react strongly to a potential change in visual quality.<br />
Moderate visual sensitivity would exist when affected views are secondary in importance or are similar to<br />
others in the region. Low visual sensitivity exists when the public has little or no concern about changes in<br />
the landscape.<br />
To evaluate change to the landscape character of a project site, it is necessary to understand the existing<br />
visual qualities. Each receiver site is described below and a representative photograph is provided. The<br />
locations from where the site is visible are identified, which indicates the type of viewer. Then the actual<br />
beach site characteristics are described. The beach lengths where temporary pipelines for sand placement<br />
may occur are also described. Because the borrow sites are underwater and the actual site character is<br />
not visible, they are not discussed separately in this section.<br />
3.1.1 Receiver Sites/Temporary Pipeline Routes<br />
South Oceanside<br />
The South Oceanside receiver site is visible from several beachfront residences and businesses in the area.<br />
The public pier is just north of the receiver site (maximum footprint only) but there would be views from<br />
the pier under either alternative. The Strand, a beach-front road that runs from Seagaze Drive to Wisconsin<br />
Avenue, abuts the northern end of the receiver site, and users of the Strand would view the site. The<br />
receiver site is severely eroded and is visible only at low tide. <strong>Beach</strong>front homes and condominiums are<br />
located east of this portion of the receiver site. As shown in Figure 3.7-1 (Photograph A), huge boulders<br />
have been placed in front of these structures for protection and they are elevated slightly above<br />
<strong>Regional</strong> <strong>Beach</strong> <strong>Sand</strong> <strong>Project</strong> <strong>EIR</strong>/<strong>EA</strong> Page 3.7-1<br />
99-69\SANDAG <strong>EIR</strong><strong>EA</strong> 3.5 to 3.12.wpd 7/17/00
X.X Section Name<br />
Photo A: Typical rip-rap protection.<br />
Photo B: Bucaneer <strong>Beach</strong> Park.<br />
Figure 3.7-1<br />
Photographs of South Oceanside<br />
Receiver Site<br />
Page 3.7-2<br />
<strong>Regional</strong> <strong>Beach</strong> <strong>Sand</strong> <strong>Project</strong> <strong>EIR</strong>/<strong>EA</strong><br />
9969 <strong>Sand</strong> Replenishment\Figures\Fig 3.7-1 8/6/99
3.7 Aesthetics<br />
the beach. Buccaneer <strong>Beach</strong> Park is located within the receiver site. This park is situated where Loma<br />
Alta Creek drains to the ocean. Because the immediate area has not been developed, there is a sandy<br />
beach approximately 150 feet wide and 125 feet from the road to the line of rip-rap which protects homes<br />
on either side of the park. Photograph B in Figure 3.7-1 is a photograph of the beach in front of Buccaneer<br />
<strong>Beach</strong> Park and shows the relatively greater activity level at this location.<br />
The delivery pipeline would make landfall south of 9 th Avenue and continue south to the receiver site. It<br />
would be generally parallel to the Strand on the west side of the sea wall. On the east side of the Strand<br />
there are a mix of beach-front homes, condominiums, parks, shops, and restaurants. West of the road<br />
there is a short wall which allows residents and users of the Strand to view the flat sandy beach. This beach<br />
narrows as it approaches Wisconsin Avenue. Also visible are palm trees (parallel to the wall from 9 th<br />
Street to the Tyson Street Park), a traffic circle at 6 th Street, a small parking lot just north of the pier at 3 rd<br />
Street, and various lifeguard towers.<br />
North Carlsbad<br />
Primary views of the proposed North Carlsbad receiver site are from beachfront residences, which front<br />
the proposed site from the northern boundary near the mouth of the Buena Vista Lagoon to Pine Avenue<br />
(Figure 3.7-2, Photograph A). From Pine Avenue to the southern terminus near Hemlock Street, residents<br />
are located on the bluff tops east of Carlsbad Boulevard and a walkway is constructed near the base of<br />
the bluffs with intermittent beach access points (Figure 3.7-2, Photograph B). The North Carlsbad receiver<br />
site is also visible for recreationalists at Buena Vista Lagoon, drivers on Ocean Street where intermittent<br />
beach access is available, and Carlsbad Boulevard. Visual resources at the North Carlsbad receiver site<br />
consist of a flat sandy beach lying in front of rip-rap or vegetated slopes, and sea walls that support beachfront<br />
structures. Slopes behind these protection structures rise to a height of approximately 30 feet.<br />
Structures along this receiver site include single-family residences, apartments, condominiums, and a military<br />
preparatory school. The sand beach along this site is typically under water during high tide.<br />
The delivery pipeline would extend from the South Oceanside receiver site across the Buena Vista Lagoon<br />
mouth. Generally, it would be placed as far landward on the beach as possible to reduce exposure to wave<br />
action. From Hemlock Street south to the terminus of Tamarack Avenue, the pattern of adjacent residents<br />
on bluff tops, east of a busy roadway, continues. However, continuing south across the lagoon mouth there<br />
are no adjacent residents until approximately Cannon Road. Viewers would be limited to drivers along<br />
<strong>Regional</strong> <strong>Beach</strong> <strong>Sand</strong> <strong>Project</strong> <strong>EIR</strong>/<strong>EA</strong> Page 3.7-3<br />
99-69\SANDAG <strong>EIR</strong><strong>EA</strong> 3.5 to 3.12.wpd 7/17/00
X.X Section Name<br />
Photo A: Typical view looking north near Pine Street.<br />
Figure 3.7-2<br />
Photograph of North Carlsbad<br />
Receiver Site<br />
Page 3.7-4<br />
<strong>Regional</strong> <strong>Beach</strong> <strong>Sand</strong> <strong>Project</strong> <strong>EIR</strong>/<strong>EA</strong><br />
9969 <strong>Sand</strong> Replenishment\Figures\Fig 3.7-2 8/6/99
3.7 Aesthetics<br />
Cannon Road. A small subdivision is located between Cannon Road and Palomar Airport Road so there<br />
would be residential viewers along this length. From Palomar Airport Road to the south where the pipeline<br />
would eventually serve the receiver site, the adjacent land is undeveloped.<br />
South Carlsbad South and South Carlsbad North<br />
Both of these receiver sites are visible from South Carlsbad State <strong>Beach</strong> Campground. Portions of the<br />
northern site are visible from the parking areas north of the campground and Carlsbad Boulevard. The<br />
southern site is obscured from drivers by the intervening campground. This receiver site is characterized<br />
by a sand and cobble beach abutted by steep bluff slopes. The only development along this stretch of<br />
beach is the State <strong>Beach</strong> Campground located on the bluff approximately 65 feet above the site. Several<br />
stairways run from the campground down onto the beach (Figure 3.7-3).<br />
The pipeline to serve these two sites would be extended from borrow site SO-7 which is offshore from<br />
Batiquitos Lagoon to the south. It would come ashore north of the lagoon and traverse State <strong>Beach</strong><br />
recreation area to the receiver sites. The general goal is to place the pipeline at the base of the bluffs to<br />
reduce exposure to wave action. In this area the bluff slopes vary from non-existent at the lagoon mouth<br />
and 60 to 80 feet at the campground. There are no residents adjacent to the pipeline route.<br />
Batiquitos<br />
This proposed receiver site is just south of Batiquitos Lagoon with the northern portion adjacent to<br />
Carlsbad Boulevard/Coast Highway 101. Continuing south the proposed receiver site is situated in front<br />
of steep bluffs with houses constructed along the tops. Views are available from the roadway and<br />
residences. Views of the beach along this site are dependent upon the tides and location. Near the lagoon<br />
there is more sand (Figure 3.7-4, Photograph A). In front of the bluffs, the situation is different. At low<br />
tide, a low profile sand and cobble beach is visible below the cliffs; however, at high tide the beach is not<br />
visible as waves crash directly against the cliffs. The pipeline to serve this site would come from directly<br />
offshore and be placed as close to the bluff face as possible.<br />
Leucadia<br />
This receiver site is located entirely at the base of the bluffs and residents line the bluff tops. The northern<br />
limit is generally the public staircase at Grandview Avenue. Figure 3.7-4, Photograph B, shows the view<br />
<strong>Regional</strong> <strong>Beach</strong> <strong>Sand</strong> <strong>Project</strong> <strong>EIR</strong>/<strong>EA</strong> Page 3.7-5<br />
99-69\SANDAG <strong>EIR</strong><strong>EA</strong> 3.5 to 3.12.wpd 7/17/00
X.X Section Name<br />
Photo A: Looking North at South Carlsbad North site.<br />
Photo B: Looking South at South Carlsbad South site.<br />
Figure 3.7-3<br />
Photographs of South Carlsbad<br />
Receiver Sites<br />
Page 3.7-6<br />
<strong>Regional</strong> <strong>Beach</strong> <strong>Sand</strong> <strong>Project</strong> <strong>EIR</strong>/<strong>EA</strong><br />
9969 <strong>Sand</strong> Replenishment\Figures\Fig 3.7-3 8/6/99
X.X Section Name<br />
Photo A: Looking south at site from near Batiquitos Lagoon mouth.<br />
Photo B: Looking north at Leucadia from Grandview stairs.<br />
Figure 3.7-4<br />
Photographs of Batiquitos and Leucadia<br />
Receiver Sites<br />
<strong>Regional</strong> <strong>Beach</strong> <strong>Sand</strong> <strong>Project</strong> <strong>EIR</strong>/<strong>EA</strong><br />
9969 <strong>Sand</strong> Replenishment\Figures\Fig 3.7-4 8/6/99<br />
Page 3.7-7
3.7 Aesthetics<br />
looking north at this site. As shown, the bluffs are vegetated near the top where the slopes are less steep,<br />
but at the base there are cobbles. Some sea caves in this area have been filled and the fill material is visible<br />
against the lighter, tan bluffs. As with the Batiquitos site, at low tide the sand and cobble beach is visible<br />
but at high tide the waves crash against the cliffs. Development along this segment includes single-family<br />
residences, apartments, and condominiums, which are located approximately 80 to 100 feet above the<br />
beach on the bluff. Several stairways descend onto the beach from residences located on the bluff.<br />
The pipeline to serve this site would be placed at the base of the bluff, coming south from the landfall site<br />
at Batiquitos. Along this length, the pipeline would traverse a beach similar to the receiver site itself, with<br />
residences constructed atop high bluffs viewing a beach which comes and goes with the tide.<br />
Moonlight <strong>Beach</strong><br />
This receiver site has bluffs on either end, and Moonlight State <strong>Beach</strong> park at the terminus of B Street.<br />
Views of the site would be available from residents and park users. The site contains a wider sand area<br />
at the park because in this location the bluffs trend easterly and open up to allow Cottonwood Creek to<br />
drain into the ocean. Figure 3.7-5, Photograph A is a photograph looking north from the staircase at the<br />
terminus of D Street. As shown, there is a narrow sand shelf from the cliffs to a cobble slope, then sand<br />
sloping to the water. Rip-rap has been placed at the base of the bluffs to protect structures. At high tide<br />
the water comes to the base of the bluffs and the beach is not visible. The delivery pipeline would be<br />
located at the base of the bluffs between the Leucadia receiver site and this site. The character of the area<br />
traversed by the pipeline would be much the same as described under Leucadia.<br />
Cardiff<br />
This receiver site is parallel to Highway 101 and the San Elijo Lagoon. Several restaurants front the beach<br />
just north of the site. As shown in Figure 3.7-5, Photograph B, the beach is virtually all cobble. In fact,<br />
large boulders surrounding the restaurants are the only barrier between these structures and the sea. The<br />
length of the roadway is also protected by rip-rap. There are no obstructions between the receiver site and<br />
persons in the restaurants and for drivers along Highway 101. However, for drivers the higher elevation<br />
of the road and the relatively steep drop-off to the beach reduces the view of the beach itself, and the<br />
primary focal point is the ocean. There are also distant views for residences on the hills north and south<br />
of San Elijo. The pipeline to serve this site would come from directly offshore.<br />
Page 3.7-8<br />
<strong>Regional</strong> <strong>Beach</strong> <strong>Sand</strong> <strong>Project</strong> <strong>EIR</strong>/<strong>EA</strong><br />
99-69\SANDAG <strong>EIR</strong><strong>EA</strong> 3.5 to 3.12.wpd 7/17/00
X.X Section Name<br />
Photo A: Looking north at Moonlight <strong>Beach</strong> site from D Street stairs.<br />
Photo B: Looking south at Cardiff site from “Restaurant Row.”<br />
Figure 3.7-5<br />
Photographs of Moonlight <strong>Beach</strong> and Cardiff<br />
Receiver Sites<br />
<strong>Regional</strong> <strong>Beach</strong> <strong>Sand</strong> <strong>Project</strong> <strong>EIR</strong>/<strong>EA</strong><br />
9969 <strong>Sand</strong> Replenishment\Figures\Fig 3.7-5 8/6/99<br />
Page 3.7-9
3.7 Aesthetics<br />
Solana <strong>Beach</strong><br />
This receiver site sits below steep cliffs and is visible from the stairs at Solana Vista Drive, Fletcher Cove,<br />
and some residences along the bluff. It currently consists of little or no existing beach area. Views of the<br />
beach along this stretch are dependent upon the tides. At high tide the beach is not visible along the<br />
majority of the receiver site as waves crash directly against the cliffs. The only exception is the small sandy<br />
beach at Fletcher Cove which sits above the high tide mark and is located just north of the receiver site.<br />
At low tide a low profile sand and cobble beach is visible below the cliffs (Figure 3.7-6, Photograph A).<br />
The pipeline to deliver sand would come from offshore and would landfall at the northern end of the<br />
receiver site.<br />
Del Mar<br />
The vast majority of the receiver site is characterized by homes built on the beach, there are no bluffs along<br />
the receiver site. All structures are protected by sea walls or rip-rap and there are access ramps or stairs<br />
from most residences to the beach (Figure 3.7-6, Photograph B). This beach is relatively wide and even<br />
at high tide water does not reach the sea walls (except during storm events). At the southern end of the<br />
receiver site is Powerhouse Park. There would be clear views of the site from this park, from all<br />
beachfront residences and from the local access points at roadway terminuses.<br />
The pipeline to serve this site would come from directly offshore; however, it would also extend south to<br />
serve the Torrey Pines receiver site. East of Camino del Mar, the hills have been constructed with<br />
residences which, depending upon orientation, have elevated coastal views. These residents may have<br />
views of the receiver site and the dredge location, but these elements would be part of a larger viewscape<br />
of the ocean and a length of coastline.<br />
Torrey Pines<br />
The Torrey Pines receiver site is visible from North Torrey Pines Road, the parking area at Torrey Pines<br />
State Reserve, and view points within the State Reserve. This segment consists of a thin sand and cobble<br />
beach abutted by steep cliffs. Much of the southern part of the site is visible only during low tide, as waves<br />
reach the base of the cliffs at high tide. Cliffs range in elevation from approximately 50 to 200 feet. The<br />
beach trail from the State Reserve descends onto the beach, south of the receiver site. With the exception<br />
of the parking area for the State Reserve, no development exists in the vicinity of this site (Figure 3.7-7,<br />
Photograph A). There are residences constructed on the hills north of Peñasquitos Lagoon with distant<br />
Page 3.7-10<br />
<strong>Regional</strong> <strong>Beach</strong> <strong>Sand</strong> <strong>Project</strong> <strong>EIR</strong>/<strong>EA</strong><br />
99-69\SANDAG <strong>EIR</strong><strong>EA</strong> 3.5 to 3.12.wpd 7/17/00
X.X Section Name<br />
Photo A: Looking south at Solana <strong>Beach</strong> site from Fletcher Cove beach.<br />
Photo B: Looking north at Del Mar site.<br />
Figure 3.7-6<br />
Photographs of Solana <strong>Beach</strong> and Del Mar<br />
Receiver Sites<br />
<strong>Regional</strong> <strong>Beach</strong> <strong>Sand</strong> <strong>Project</strong> <strong>EIR</strong>/<strong>EA</strong><br />
9969 <strong>Sand</strong> Replenishment\Figures\Fig 3.7-76 8/6/99<br />
Page 3.7-11
X.X Section Name<br />
Photo A: Looking south at site from near lagoon mouth.<br />
Photo B: Rip-rap protection for North Torrey Pines Road.<br />
Figure 3.7-7<br />
Photographs of Torrey Pines<br />
Receiver Site<br />
<strong>Regional</strong> <strong>Beach</strong> <strong>Sand</strong> <strong>Project</strong> <strong>EIR</strong>/<strong>EA</strong><br />
9969 <strong>Sand</strong> Replenishment\Figures\Fig 3.7-7 8/6/99<br />
Page 3.7-12
3.7 Aesthetics<br />
views of the receiver site. As in the Del Mar receiver site, the Torrey Pines site would be one component<br />
of the viewscape which includes the lagoon, beach, and steep hills of Torrey Pines State Park.<br />
The lack of sand and protection for North Torrey Pines Road has resulted in severe erosion and failure at<br />
the road’s western edges. Figure 3.7-7, Photograph B shows the rip-rap protection underneath this closed<br />
portion of the roadway.<br />
The delivery pipeline would extend south from the Del Mar receiver site. From Seagrove Park to the south<br />
to just past 4 th Street, it would traverse a fairly large, low profile sandy beach abutted by steep slopes. The<br />
pipeline itself would likely be located at the base of the bluffs. The Amtrak/Coaster (ATS&F) railroad<br />
tracks are located on the bluff approximately 40 feet directly above the beach. Several residences are<br />
located 15 to 30 feet upslope of the railroad tracks. South of this location, the beach character changes.<br />
The bluffs descend to beach level at the mouth of the Peñasquitos Lagoon. There are no houses adjacent<br />
to the beach in this location. Here the beach is paralleled by South Camino Del Mar/North Torrey Pines<br />
Road.<br />
Mission <strong>Beach</strong><br />
This receiver site is similar to Del Mar in that residential structures (homes, condominiums and apartments)<br />
are built at the beach level and a relatively low sea wall separates the beach from these homes. At Mission<br />
<strong>Beach</strong> there is an approximately 12 foot-wide boardwalk between the wall and the residents. This popular<br />
boardwalk is used for walking, running, bicycling, and roller blading. Views are available both for residents<br />
and users of the boardwalk. As shown in Figure 3.7-8, Photograph A, the beach in this location is<br />
characterized mostly by sand. During storm events waves can over top the sea wall and boardwalk, but<br />
generally the high tide is well below this structure. The pipeline to serve this site would come from directly<br />
offshore.<br />
Imperial <strong>Beach</strong><br />
The Imperial <strong>Beach</strong> site is characterized entirely by homes, apartments and condominiums constructed on<br />
the beach. Most are protected by rip-rap. The northen end of the site, from Imperial <strong>Beach</strong> Boulevard to<br />
<strong>Beach</strong> Avenue, has some sand and cobble, but south of <strong>Beach</strong> Avenue the beach is entirely cobble (Figure<br />
3.7-8, Photograph B). Views would be available from residents along the site and from the pier which is<br />
over 700 feet north of the northern project terminus (maximum footprint length). The pipeline to serve this<br />
site would come from directly off-shore.<br />
<strong>Regional</strong> <strong>Beach</strong> <strong>Sand</strong> <strong>Project</strong> <strong>EIR</strong>/<strong>EA</strong> Page 3.7-13<br />
99-69\SANDAG <strong>EIR</strong><strong>EA</strong> 3.5 to 3.12.wpd 7/17/00
X.X Section Name<br />
Photo A: Looking south at Mission <strong>Beach</strong> site.<br />
Photo B: Looking south at Imperial <strong>Beach</strong> site, just south of <strong>Beach</strong> Avenue.<br />
Figure 3.7-8<br />
Photographs of Mission <strong>Beach</strong> and Imperial <strong>Beach</strong><br />
Receiver Sites<br />
Page 3.7-14<br />
<strong>Regional</strong> <strong>Beach</strong> <strong>Sand</strong> <strong>Project</strong> <strong>EIR</strong>/<strong>EA</strong><br />
9969 <strong>Sand</strong> Replenishment\Figures\Fig 3.7-8 8/6/99
3.8 Socioeconomics<br />
3.8 SOCIOECONOMICS<br />
Under NEPA “economic” and “social” effects are environmental consequences to be examined (40 C.F.R.<br />
§ 1502.16 and 40 C.F.R. § 1508.8). Under CEQA, the focus of an <strong>EIR</strong> is primarily on potential changes<br />
to the “physical conditions” which includes land, air, water, flora, fauna, population, housing, noise, and<br />
objects of historic or aesthetic significance (Cal. Pub. Res. Code § 21060.5; Cal. Code Regs. Title 14 §<br />
15358(b) and § 15382). The proposed action would place sand on existing beaches where there are no<br />
structures, except lifeguard towers, and there would be no physical changes to population or housing.<br />
In addition to examining potential social and economic impacts to local and regional populations as a whole,<br />
any NEPA document must consider the potential for disproportionate environmental impacts to minority<br />
or low-income populations, as well as potential disproportionate environmental health and safety risks to<br />
children, in order to comply with relevant federal Executive Orders. Those analyses are contained in<br />
Sections 6.6 and 6.7 of this <strong>EIR</strong>/<strong>EA</strong>, but the supporting demographic information on population, ethnicity<br />
and income is provided in this section.<br />
The primary social and economic related focus of the proposed project, as stated in the Purpose and Need<br />
of this <strong>EIR</strong>/<strong>EA</strong> (Section 1.2), is straightforward. The placement of sand at these public beaches is intended<br />
to enhance a valuable public resource that serves local residents in a number of ways. These include<br />
enhancing recreational opportunities at the receiver sites and bolstering the beaches as an important element<br />
of San Diego’s attraction as a tourist destination, thereby providing benefits to the entire regional economy.<br />
In addition to local and regional demographic and income information, this section presents information on<br />
commercial fisheries, the local social and economic sector most likely to adversely impacted by the<br />
proposed project. During the NOP process, the California Lobster and Trap Fishermen’s Association,<br />
the Sea Urchin Harvesters’ Association, California, and the Urchin Procedures Marketing Association<br />
raised several concerns regarding sand placement and potential impacts to these commercial fishing<br />
resources. As part of this <strong>EIR</strong>/<strong>EA</strong> process, these groups were contacted for further input. Refer to<br />
Chapter 7.0 for a summary of the coordination and consultation efforts with these groups.<br />
This section contains census data regarding population and income in subsection 3.8.1. Commercial<br />
fisheries and the relative economic value of various species are discussed in subsection 3.8.2. Kelp<br />
harvesting value is addressed in subsection 3.8.3 followed by recreational fishing and diving value in<br />
subsection 3.8.4.<br />
<strong>Regional</strong> <strong>Beach</strong> <strong>Sand</strong> <strong>Project</strong> <strong>EIR</strong>/<strong>EA</strong> Page 3.8-1<br />
99-69\SANDAG <strong>EIR</strong><strong>EA</strong> 3.5 to 3.12.wpd 7/17/00
3.8 Socioeconomics<br />
3.8.1 Socioeconomic Characteristics<br />
In terms of the broad economic contribution of beaches to the economy as a whole, while the total value<br />
of the beaches to the local jurisdictions and the region is known to be substantial, the quantification of the<br />
value of this resource is not straightforward. One way to approach the problem of valuation of is to<br />
examine the estimated costs of continuing beach loss to the region. As noted in subsection 2.4.3 (No<br />
Action Alternative), an earlier regional study (SANDAG 1993) places estimated annual costs (losses) of<br />
lost property and recreational benefits to the region at $52 million by 2010 and over $226 million by 2040.<br />
To provide a localized socioeconomic context for the proposed project, the remainder of this section<br />
presents information on population and income in the project area. To meet the specific intent of Executive<br />
Order 12898 on Environmental Justice (59 Fed. Reg. 7629 (1994)), it is necessary to consider the minority<br />
and economic status of the population surrounding receiver beaches. To allow for a subsequent assessment<br />
of potential disproportionate impacts to minority populations and low-income populations it is necessary<br />
to compare the same type of demographic and income information for the local jurisdiction and larger<br />
region. Therefore, these data provide information on population, ethnicity, and median income for each<br />
of the receiver beaches compared to the local jurisdiction and the San Diego County region. (Housing and<br />
employment data, often presented in socioeconomic sections of NEPA documents, are not provided in this<br />
section as the proposed project is not considered likely to have any direct impact on either housing or<br />
employment in the immediate area. Potential positive benefits to employment as a result of enhanced<br />
recreational and tourism opportunities would likely be felt at a subregional or regional level.)<br />
R<br />
R<br />
Census tracts are the standard localized units of analysis for these types of data. The receiver beaches are<br />
contained within twelve census tracts. These census tracts, as well as the receiver beach sites they each<br />
encompass, are listed in Table 3.8-1. Although some tracts contain all or portions of more than one<br />
receiver beach, some sites straddle two census tracts. In addition, census tract boundaries do not follow<br />
city boundaries. For example, census tract 173.03 includes portions of both Encinitas and Solana <strong>Beach</strong>.<br />
The data presented in this section for local jurisdictions and the region as a whole are from SANDAG<br />
Demographic and Economic Estimates Profiles which are derived from 1990 census data. Data for<br />
individual census tracts are directly from the 1990 Census (STF 3A).<br />
Page 3.8-2<br />
<strong>Regional</strong> <strong>Beach</strong> <strong>Sand</strong> <strong>Project</strong> <strong>EIR</strong>/<strong>EA</strong><br />
99-69\SANDAG <strong>EIR</strong><strong>EA</strong> 3.5 to 3.12.wpd 7/17/00
3.8 Socioeconomics<br />
Table 3.8-1<br />
Census Tract Numbers and Jurisdictional City<br />
Boundaries for Each Proposed Receiver Site<br />
City Census Tract No. Receiver Site<br />
Oceanside 181/183 South Oceanside<br />
Carlsbad<br />
180 North Carlsbad<br />
178.05 South Carlsbad North and South<br />
177 Batiquitos Lagoon/Leucadia<br />
Encinitas<br />
175 Moonlight <strong>Beach</strong><br />
173.03 Cardiff<br />
Solana <strong>Beach</strong> 173.03/173.04 Fletcher Cove<br />
Del Mar 172 Del Mar<br />
San Diego<br />
83.12 Torrey Pines<br />
76 Mission <strong>Beach</strong><br />
Imperial <strong>Beach</strong> 102 Imperial <strong>Beach</strong><br />
Source: 1994 Census Tract Thomas Brothers Guide for San Diego County<br />
Population/Ethnicity<br />
Tables 3.8-2 through 3.8-8 show population characteristics, including total population and race/ ethnic<br />
distribution, for the census tracts contiguous with the proposed receiver sites. The tables also provide the<br />
same ethnic and racial information for adjacent jurisdictions as well as at the county level to facilitate<br />
comparison between the affected area and a broader context.<br />
As shown in the tables, the majority of the project census tracts area have a lower non-white population<br />
percentage than both the local jurisdiction and the County of San Diego as a whole. Although the nonwhite<br />
population within census tracts 173.04, 175, and 177 is larger than that within the cities of Solana<br />
<strong>Beach</strong> and Encinitas, respectively, the minority population is still far below that of San Diego County in<br />
general. Therefore, while there may be a higher non-white population within those isolated census tracts<br />
compared to adjacent areas, these concentrations remain below the average regional minority population.<br />
Expressed in terms of a total minority population, most of the census tracts contiguous with the sand<br />
replenishment project area have a lower total minority population percentage than their jurisdictional cities<br />
or the county as a whole.<br />
<strong>Regional</strong> <strong>Beach</strong> <strong>Sand</strong> <strong>Project</strong> <strong>EIR</strong>/<strong>EA</strong> Page 3.8-3<br />
99-69\SANDAG <strong>EIR</strong><strong>EA</strong> 3.5 to 3.12.wpd 7/17/00
3.8 Socioeconomics<br />
Table 3.8-2<br />
Population and Ethnicity for South Oceanside Receiver Site<br />
Race/Ethnicity<br />
<strong>Project</strong> Census Tract<br />
No. 181 No. 183<br />
City of Oceanside<br />
San Diego Region<br />
White 4,633 2,470 81,813 1,633,281<br />
Black 147 52 9,520 149,898<br />
Hispanic (1) 392 274 28,982 510,781<br />
Other 512 205 8,083 204,056<br />
Total 5,684 3,001 128,398 2,498,016<br />
Total Non-White 1,051 531 46,585 864,735<br />
Percent Non-White 23.5% 17.7% 36.3% 34.6%<br />
(1)<br />
The Hispanic category is an ethnic, rather than a racial, distinction. These tables therefore include only non-Hispanic<br />
individuals in the black, white, and Asian/other categories to avoid double-counting.<br />
Source: SANDAG Demographic and Economic Estimates Profiles (city and regional information) 1990 Census STF 3A<br />
(census tract information)<br />
Table 3.8-3<br />
Population and Ethnicity for City of Carlsbad Receiver Sites<br />
Race/Ethnicity<br />
<strong>Project</strong> Census Tract (2) City of Carlsbad San Diego Region<br />
No. 180 No. 178.05<br />
White 3,059 1,632 51,555 1,633,281<br />
Black 29 12 702 149,898<br />
Hispanic (1) 190 23 8,700 510,781<br />
Other 315 16 2,169 204,056<br />
Total 3,593 1,683 63,126 2,498,016<br />
Total Non-White 534 51 11,571 864,735<br />
Percent Non-White 15.1% 3.0% 18.3% 34.6%<br />
(1)<br />
The Hispanic category is an ethnic, rather than a racial, distinction. These tables therefore include only non-Hispanic<br />
individuals in the black, white, and Asian/other categories to avoid double-counting.<br />
(2)<br />
CT 180 contains the North Carlsbad site and CT 178.05 contains the South Carlsbad North and South Carlsbad South<br />
receiver sites.<br />
Source: SANDAG Demographic and Economic Estimates Profiles (city and regional information) 1990 Census STF 3A<br />
(census tract information)<br />
Page 3.8-4<br />
<strong>Regional</strong> <strong>Beach</strong> <strong>Sand</strong> <strong>Project</strong> <strong>EIR</strong>/<strong>EA</strong><br />
99-69\SANDAG <strong>EIR</strong><strong>EA</strong> 3.5 to 3.12.wpd 7/17/00
3.8 Socioeconomics<br />
Table 3.8-4<br />
Population and Ethnicity for City of Encinitas Receiver Sites<br />
Race/Ethnicity<br />
<strong>Project</strong> Census Tract (2)<br />
No. 177 No. 175 No. 173.03<br />
City of<br />
Encinitas<br />
San Diego<br />
Region<br />
White 6,181 4,579 2,504 44,881 1,633,281<br />
Black 44 33 0 281 149,898<br />
Hispanic (1) 676 700 152 8,446 510,781<br />
Other 1,110 1,017 153 1,778 204,056<br />
Total 8,011 6,329 2,809 55,386 2,498,016<br />
Total Non-White 1,830 1,750 305 10,505 864,735<br />
Percent Non-White 22.8% 27.7% 1.1% 19.0% 34.6%<br />
(1)<br />
The Hispanic category is an ethnic, rather than a racial, distinction. These tables therefore include only non-Hispanic<br />
individuals in the black, white, and Asian/other categories to avoid double-counting.<br />
(2)<br />
CT 177 contains Batiquitos Lagoon and Leucadia receiver sites, CT 175 contains the Moonlight <strong>Beach</strong> receiver site, and<br />
CT 173.03 contains the Cardiff receiver site.<br />
Source: SANDAG Demographic and Economic Estimates Profiles (city and regional information) 1990 Census STF 3A<br />
(census tract information)<br />
Table 3.8-5<br />
Population and Ethnicity for City of Solana <strong>Beach</strong> Receiver Site<br />
Race/Ethnicity<br />
<strong>Project</strong> Census Tracts<br />
No. 173.03 No. 173.04<br />
City of Solana<br />
<strong>Beach</strong><br />
San Diego Region<br />
White 2,504 3,889 10,585 1,633,281<br />
Black 0 50 45 149,898<br />
Hispanic (1) 152 672 1,907 510,781<br />
Other 153 1,084 425 204,056<br />
Total 2,809 5,695 12,962 2,498,016<br />
Total Non-White 305 1,806 2,377 864,735<br />
Percent Non-White 1.1% 31.7% 18.3% 34.6%<br />
(1)<br />
The Hispanic category is an ethnic, rather than a racial, distinction. These tables therefore include only non-Hispanic<br />
individuals in the black, white, and Asian/other categories to avoid double-counting.<br />
Source: SANDAG Demographic and Economic Estimates Profiles (city and regional information) 1990 Census STF 3A<br />
(census tract information)<br />
<strong>Regional</strong> <strong>Beach</strong> <strong>Sand</strong> <strong>Project</strong> <strong>EIR</strong>/<strong>EA</strong> Page 3.8-5<br />
99-69\SANDAG <strong>EIR</strong><strong>EA</strong> 3.5 to 3.12.wpd 7/17/00
3.8 Socioeconomics<br />
Table 3.8-6<br />
Population and Ethnicity for Del Mar Receiver Site<br />
Race/Ethnicity<br />
<strong>Project</strong> Census Tract<br />
No. 172 City of Del Mar San Diego Region<br />
White 4,436 4,514 1,633,281<br />
Black 24 33 149,898<br />
Hispanic (1) 143 177 510,781<br />
Other 172 136 204,056<br />
Total 4,775 4,860 2,498,016<br />
Total Non-White 339 346 864,735<br />
Percent Non-White 7.1% 7.1% 34.6%<br />
(1)<br />
The Hispanic category is an ethnic, rather than a racial, distinction. These tables therefore include only non-Hispanic<br />
individuals in the black, white, and Asian/other categories to avoid double-counting.<br />
Source: SANDAG Demographic and Economic Estimates Profiles (city and regional information) 1990 Census STF 3A<br />
(census tract information)<br />
Table 3.8-7<br />
Population and Ethnicity for City of San Diego Receiver Sites<br />
Race/Ethnicity<br />
<strong>Project</strong> Census Tract (2) City of San Diego San Diego Region<br />
No. 83.12 No. 76<br />
White 3,351 6,323 651,735 1,633,281<br />
Black 13 39 98,852 149,898<br />
Hispanic (1) 110 273 229,519 510,781<br />
Other 166 268 130,443 204,056<br />
Total 3,640 6,903 1,110,549 2,498,016<br />
Total Non-White 289 580 458,814 864,735<br />
Percent Non-White 7.9% 8.4% 41.3% 34.6%<br />
(1)<br />
The Hispanic category is an ethnic, rather than a racial, distinction. These tables therefore include only non-Hispanic<br />
individuals in the black, white, and Asian/other categories to avoid double-counting.<br />
(2)<br />
CT 83.12 contains the Torrey Pines receiver site and CT 76 contains the Mission <strong>Beach</strong> receiver site.<br />
Source: SANDAG Demographic and Economic Estimates Profiles (city and regional information) 1990 Census STF 3A<br />
(census tract information)<br />
Page 3.8-6<br />
<strong>Regional</strong> <strong>Beach</strong> <strong>Sand</strong> <strong>Project</strong> <strong>EIR</strong>/<strong>EA</strong><br />
99-69\SANDAG <strong>EIR</strong><strong>EA</strong> 3.5 to 3.12.wpd 7/17/00
3.8 Socioeconomics<br />
Table 3.8-8<br />
Population and Ethnicity for Imperial <strong>Beach</strong> Receiver Site<br />
Race/Ethnicity<br />
<strong>Project</strong> Census Tract<br />
No. 102 City of Imperial <strong>Beach</strong> San Diego Region<br />
White 5,139 15,528 1,633,281<br />
Black 339 1,185 149,898<br />
Hispanic (1) 501 7,502 510,781<br />
Other 1,464 2,297 204,056<br />
Total 7,443 26,512 2,498,016<br />
Total Non-White 2,304 10,984 864,735<br />
Percent Non-White 31.0% 41.4% 34.6%<br />
(1)<br />
The Hispanic category is an ethnic, rather than a racial, distinction. These tables therefore include only non-Hispanic<br />
individuals in the black, white, and Asian/other categories to avoid double-counting.<br />
Source: SANDAG Demographic and Economic Estimates Profiles (city and regional information) 1990 Census STF 3A<br />
(census tract information)<br />
Thus, in comparison to the adjacent cities and the county, the census tracts contiguous with the project area<br />
cannot be considered a high minority population area.<br />
Income<br />
Information on median household income in the census tracts contiguous with the receiver sites, as well as<br />
median incomes of the contiguous jurisdictional cities and the county in general, are presented in Table 3.8-<br />
9.<br />
Six of the twelve census tracts contiguous with the project area have median household incomes greater<br />
than the median household income for the San Diego Region, although many of the median incomes within<br />
the census tract are less than those in the jurisdictional cities. The median incomes within the affected tracts<br />
are close to the county median incomes, with the exception of Imperial <strong>Beach</strong>. The median income of the<br />
coastal census tract within this city is substantially higher than the rest of Imperial <strong>Beach</strong>, however,<br />
indicating that the affected tract does not contain a disproportionately low-income population within the City<br />
of Imperial <strong>Beach</strong>.<br />
<strong>Regional</strong> <strong>Beach</strong> <strong>Sand</strong> <strong>Project</strong> <strong>EIR</strong>/<strong>EA</strong> Page 3.8-7<br />
99-69\SANDAG <strong>EIR</strong><strong>EA</strong> 3.5 to 3.12.wpd 7/17/00
3.8 Socioeconomics<br />
Table 3.8-9<br />
Median Household Income of Receiver Sites Compared to City and County<br />
City of Oceanside<br />
South Oceanside<br />
City of Carlsbad<br />
Receiver <strong>Beach</strong> Site<br />
Census Tract<br />
No.<br />
Median Income<br />
by Tract<br />
Median Income<br />
by City<br />
Median Income<br />
by County<br />
181 $26,843 $33,836 $35,028<br />
183 $25,211 $33,836 $35,028<br />
North Carlsbad 180 $34,036 $46,191 $35,028<br />
South Carlsbad North and South 178.05 $31,726 $46,191 $35,028<br />
City of Encinitas<br />
Batiquitos Lagoon 177 $36,391 $46,583 $35,028<br />
Leucadia/Moonlight <strong>Beach</strong><br />
177 $36,391 $46,583 $35,028<br />
175 $36,270 $46,583 $35,028<br />
Cardiff 173.03 $51,793 $46,583 $35,028<br />
City of Solana <strong>Beach</strong><br />
Fletcher Cove<br />
City of Del Mar<br />
173.03 $51,793 $52,387 $35,028<br />
173.04 $40,978 $52,387 $35,028<br />
Del Mar 172 $52,762 $53,239 $35,028<br />
City of San Diego<br />
Torrey Pines 83.12 $67,323 $33,910 $35,028<br />
Mission <strong>Beach</strong> 76 $34,314 $33,910 $35,028<br />
City of Imperial <strong>Beach</strong><br />
Imperial <strong>Beach</strong> 102 $30,029 $26,581 $35,028<br />
3.8.2 Commercial Fisheries<br />
San Diego County supports a substantial commercial fishing industry, and it is also center for sport and<br />
recreational fishing and diving activities. This section describes the commercial fishing activity specific to<br />
the project area. The information presented in this section has been gathered from the CDFG catch<br />
statistics, NMFS, San Diego Unified Port District (SDUPD) and through meetings and interviews with local<br />
individuals involved with the industry. The complete analysis is contained in Appendix D.<br />
Page 3.8-8<br />
<strong>Regional</strong> <strong>Beach</strong> <strong>Sand</strong> <strong>Project</strong> <strong>EIR</strong>/<strong>EA</strong><br />
99-69\SANDAG <strong>EIR</strong><strong>EA</strong> 3.5 to 3.12.wpd 7/17/00
3.8 Socioeconomics<br />
<strong>Regional</strong> Overview<br />
Several species of invertebrates and fish found in the project area are economically valuable marine<br />
resources, and the commercial fishery has been well established in the local economy for decades. The<br />
composition, volume, and the value of the local commercial catch have not been stable over time, however,<br />
as measured by a number of indices.<br />
In terms of number of participants, statewide the number of licensed commercial fisherman since 1980 has<br />
declined by about 50 percent and roughly 70 percent since the late 1970s (SDUPD 1998). The data are<br />
incomplete for San Diego but it is assumed that this area has paralleled the statewide decline. The number<br />
of fishing vessels has shown a similar decline, and the San Diego fleet has decline by about 67 percent since<br />
the mid 1970s. The Port of San Diego, Mission Bay, and Oceanside Harbor are the base for nearly all<br />
commercial operations in the county.<br />
The composition and relative economic importance of the local fishery has changed as well, with the largest<br />
changes being attributable to the local decline of the tuna fishery. In 1950, the San Diego county area<br />
produced the second largest volume and value of commercial fish landings among California’s six primary<br />
fisheries statistical areas, accounting for 25 percent and 35 percent of the state’s total commercial fishing<br />
landing volume and value respectively. By 1990, however, the San Diego county statistical area had<br />
dropped to being the state’s lowest producer, with only one percent and four percent of the California’s<br />
landings volume and value respectively. By 1996, area landings had declined to three percent of the state’s<br />
total value of landings. The role of tuna in these large scale changes can be seen by the fact that in 1980,<br />
various species of tuna comprised 96 percent of San Diego’s volume and value of landings. By 1990, this<br />
figure had dropped to less than one percent of volume and value of local landings.<br />
In general, over the past 25 years, the California fishing industry was harvesting less catch, required fewer<br />
fisherman, and utilized a smaller fleet in both boat length and numbers to bring the catch to port. Locally,<br />
since 1985, exclusive of tuna, while the number of fisherman and boats has declined significantly, the value<br />
of the landings have only declined slightly (SDUPD 1998). Commercial harvest and value of nearshore<br />
species showed a generally increasing trend from 1987 to 1995/1996, but since then has been declining.<br />
Annual commercial fishery catch and landings in volume (pounds) and value (dollars) are compiled by the<br />
CDFG. Landings are reported by area and port, and catch data are reported by fish block. Fish blocks<br />
are statistical areas normally 10 minutes of longitude by 10 minutes of latitude, with blocks adjacent to<br />
shore being somewhat smaller, with the area of specific blocks being determined by how the shoreline<br />
intersects the block area.<br />
<strong>Regional</strong> <strong>Beach</strong> <strong>Sand</strong> <strong>Project</strong> <strong>EIR</strong>/<strong>EA</strong> Page 3.8-9<br />
99-69\SANDAG <strong>EIR</strong><strong>EA</strong> 3.5 to 3.12.wpd 7/17/00
3.8 Socioeconomics<br />
Relevant fish blocks and their corresponding shorelines within the project area include 877 (Imperial<br />
<strong>Beach</strong>), 860 (Point Loma to La Jolla), 842 (Torrey Pines to Del Mar), 821 (Encinitas), 822 and 801<br />
(Oceanside), as shown in Figure 3.8-1. All fishing gear types are combined and include hook and line,<br />
longline, troll, harpoon, trap, seine, and trawl. Assignation of a species to a specific block is not always<br />
completely accurate, and fluctuations in annual catches are significant. Determining the cause of these<br />
fluctuations can be difficult due to the complex set of variables that affect fish movements and abundance.<br />
San Diego Area Overall Commercial Fishing Catch Volume and Value<br />
San Diego area port landings for the five-year period 1994 through 1998 (inclusive) had a total dollar value<br />
over $16.2 million and totaled 17 million pounds for the data blocks analyzed (Table 3.8-10). This dollar<br />
amount was an ex-vessel value (e.g., whole fish, wholesale price), whereas the final economic contribution<br />
may be estimated to have been three to four times higher.<br />
Lobster was the highest ranked commercial species in San Diego, representing 42.7 percent of the 1994<br />
to 1998 dollar value of all species. Five-year totals were $6.9 million for a total of 1 million pounds. The<br />
majority of the catch (76 percent) came from the Point Loma and La Jolla areas. Approximately 13<br />
percent of the catch came from the Encinitas to Solana <strong>Beach</strong> fish block, 8 percent from the Oceanside<br />
block, 3 percent from the Del Mar to Torrey Pines block, and 0.2 percent from the Imperial <strong>Beach</strong> block.<br />
Urchin dollar value was ranked second at $5.6 million, and urchin poundage was ranked second at 5.3<br />
million pounds. The dollar value for urchin represents 34.8 percent of the total of all species. Nearly 99<br />
percent of the urchin catch was from the La Jolla to Point Loma fish block. Crabs were the third ranked<br />
taxa by dollar, with 479,000 pounds worth approximately $489,000 (3.0 percent of the total dollar value).<br />
Mackerel and sardine were the first and third ranked catches by weight, at 6.4 and 1.4 million pounds,<br />
respectively. The relatively low value per pound for these two species placed them fourth and thirteenth<br />
by dollar value, respectively. California halibut, swordfish, rockfish, prawn/shrimp, and tuna all supported<br />
local fisheries, with five-year dollar values ranging from approximately $257,000 to $379,000. Shark and<br />
croaker had the next highest commercial value with five-year dollar values near $149,000. The 12<br />
species/categories listed above had a combined dollar value of $15.4 million, which is 95 percent of the<br />
total $16.2 million for all commercial fish species (Table 3.8-10) listed for these blocks, which include both<br />
nearshore and offshore species.<br />
Page 3.8-10<br />
<strong>Regional</strong> <strong>Beach</strong> <strong>Sand</strong> <strong>Project</strong> <strong>EIR</strong>/<strong>EA</strong><br />
99-69\SANDAG <strong>EIR</strong><strong>EA</strong> 3.5 to 3.12.wpd 7/17/00
3.8 Socioeconomics<br />
ORANGE<br />
COUNTY<br />
RIVERSIDE<br />
COUNTY<br />
SAN DIEGO<br />
COUNTY<br />
Camp<br />
Pendleton<br />
801<br />
Oceanside<br />
822<br />
Carlsbad<br />
Encinitas<br />
821<br />
842<br />
Solana <strong>Beach</strong><br />
Del Mar<br />
15<br />
La Jolla<br />
52<br />
San Diego<br />
163<br />
8<br />
94<br />
National City<br />
Chula Vista<br />
NORTH<br />
PACIFIC OC<strong>EA</strong>N<br />
860<br />
Coronado<br />
0 2200 3 Miles Feet<br />
877<br />
5<br />
Imperial<br />
<strong>Beach</strong><br />
805<br />
San Ysidro<br />
MEXICO<br />
Figure 3.8-1<br />
CDFG Fish Blocks<br />
<strong>Regional</strong> <strong>Beach</strong> <strong>Sand</strong> <strong>Project</strong> <strong>EIR</strong>/<strong>EA</strong><br />
9969 SANDAG\Figures\Fig 3.8-1 1/17/00<br />
Page 3.8-11
3.8 Socioeconomics<br />
Table 3.8-10<br />
San Diego County Landings by Fish Block for 1994 to 1998.<br />
Averaged Volume (Pounds) and Values (Dollars)<br />
Fish<br />
Species<br />
Oceanside<br />
Block<br />
801/822<br />
Area Name and Fish Block Number<br />
Encinitas /<br />
Solana <strong>Beach</strong><br />
Block 821<br />
Del Mar /<br />
Torrey Pines<br />
Block 842<br />
La Jolla /<br />
Point Loma<br />
Block 860<br />
Imperial<br />
<strong>Beach</strong><br />
Block 877<br />
Totals<br />
Anchovy 187,550 683 23,690 211,923<br />
$11,543 $378 $567 $12,487<br />
Barracuda 118 422 22,009 30 22,578<br />
$62 $319 $15,166 $24 $15,570<br />
Bonito 18,194 34,615 52,809<br />
$4,665 $10,849 $15,515<br />
Croaker 123,108 110,128 10 233,246<br />
$72,281 $76,898 $8 $149,187<br />
Halibut 2,949 840 113,219 11 117,018<br />
$7,189 $3,495 $368,157 $21 $378,863<br />
Lingcod 94 700 794<br />
$465 $696 $1,160<br />
Mackerel 3,600,443 209,749 975,148 1,661,221 872 6,447,432<br />
$230,204 $14,756 $61,095 $137,237 $277 $443,569<br />
Rockfish 156,362 1,026 1,157 198,499 255 357,299<br />
$58,054 $1,212 $1,571 $216,743 $268 $277,849<br />
Sablefish 985 293 2,034 3,312<br />
$876 $366 $1,364 $2,607<br />
Sardine 214,446 100 439,000 755,115 2,935 1,411,596<br />
$10,966 $45 $17,560 $39,329 $1,433 $69,332<br />
Seabass 61 4,852 4,913<br />
$163 $11,500 $11,663<br />
Shark 17,831 324 1,039 101,511 7,651 128,356<br />
$16,872 $425 $790 $119,207 $11,987 $149,281<br />
Sheephead 13,026 5,565 481 138,749 188 158,010<br />
$36,457 $16,800 $1,598 $425,892 $355 $97,800<br />
Sole 1,471 119 6,018 7,608<br />
$1,010 $154 $8,151 $9,315<br />
Swordfish 7,242 2,214 87,697 1,628 98,781<br />
$27,391 $7,926 $328,168 $3,460 $366,944<br />
Page 3.8-12<br />
<strong>Regional</strong> <strong>Beach</strong> <strong>Sand</strong> <strong>Project</strong> <strong>EIR</strong>/<strong>EA</strong><br />
99-69\SANDAG <strong>EIR</strong><strong>EA</strong> 3.5 to 3.12.wpd 7/17/00
3.8 Socioeconomics<br />
Table 3.8-10. Continued<br />
Species<br />
Oceanside<br />
Block<br />
801/822<br />
Area Name and Fish Block Number<br />
Encinitas /<br />
Solana <strong>Beach</strong><br />
Block 821<br />
Del Mar /<br />
Torrey Pines<br />
Block 842<br />
La Jolla /<br />
Point Loma<br />
Block 860<br />
Imperial<br />
<strong>Beach</strong><br />
Block 877<br />
Totals<br />
Tuna 1,616 81 572,400 279 574,376<br />
$1,529 $203 $254,026 $779 $256,536<br />
Whitefish 645 6 11,788 12,439<br />
$375 $5 $7,836 $8,216<br />
Yellowtail 2,382 9 162 27,156 29,709<br />
Invertebrates<br />
$2,870 $13 $165 $35,716 $38,764<br />
Crab 143,071 13,294 12,885 260,413 49,828 479,491<br />
$143,012 $14,760 $11,865 $269,754 $49,652 $489,043<br />
Lobster 79,373 135,281 27,744 779,563 1,117 1,023,078<br />
$572,789 $922,362 $187,724 $5,242,231 $9,556 $6,934,662<br />
Prawn / Shrimp 19,626 122 4,908 32,458 62,013 119,127<br />
$143,336 $945 $35,275 $95,780 $0 $275,336<br />
Urchin 7,620 24,362 10,329 5,198,139 18,903 5,259,353<br />
$8,345 $22,768 $4,926 $5,603,039 $14,734 $5,653,812<br />
Abalone 40 4,805 4,844<br />
$285 $45,075 $45,360<br />
Squid 4,900 93,951 62,535 161,386<br />
$525 $14,488 $9,405 $24,418<br />
Totals 4,446,752 390,316 1,568,619 9,987,981 169,154 16,562,822<br />
$1,292,925 $998,958 $344,386 $12,722,780 $92,852 $15,451,902<br />
Total for all spp. 4,491,015 391,491 1,570,938 10,350,749 201,938 17,006,131<br />
Source: CDFG 1994 - 1999<br />
$1,352,990 $1,000,456 $348,895 $13,418,781 $116,925 $16,238,047<br />
The pattern of distribution of total catch between fish blocks is also apparent in Table 3.8-10. The La Jolla/<br />
Point Loma block alone accounted for 60.9 percent of the total five block area volume of catch landed and<br />
82.6 percent of the total area catch value over the period 1994-1998.<br />
<strong>Regional</strong> <strong>Beach</strong> <strong>Sand</strong> <strong>Project</strong> <strong>EIR</strong>/<strong>EA</strong> Page 3.8-13<br />
99-69\SANDAG <strong>EIR</strong><strong>EA</strong> 3.5 to 3.12.wpd 7/17/00
3.8 Socioeconomics<br />
San Diego Commercial Fishing Catch Volume and Value for Nearshore Species<br />
In order to provide a more specific analysis of commercial landings for species that might be impacted by<br />
the proposed project, and because commercial catch and value can change dramatically from year-to-year,<br />
a longer-term perspective of nearshore commercial fishing is more appropriate for analysis. Appendix D<br />
presents specific information on volume and value data by major species by year landed at area ports (from<br />
any fish block[s]) for the 18-year span from 1981 to 1998 and from area fish blocks for the 12-year period<br />
from 1987 to 1998. Figure 3.8-2 summarizes the San Diego and Oceanside port area data for volume and<br />
value by year for the period 1981-1998. For the purposes of the analysis, landings at any sites between<br />
Torrey Pines and Oceanside were included in the Oceanside landings, and landings reported at locations<br />
between La Jolla and Imperial <strong>Beach</strong> were considered as a port of San Diego landing. These data provide<br />
a regional view of the historical usage, resource trends, and value of the resources, divided between a north<br />
county and central/south county perspective.<br />
Only those species generally fished in nearshore waters were considered for further discussion. The<br />
exceptions are spot and ridgeback prawns because of concern expressed by commercial fisherman that<br />
nearshore waters may be important as nursery areas.<br />
The total value of San Diego County commercial landings from 1981 to 1998 for the selected nearshore<br />
species was $31.2 million (Table 3.8-11), or an annual average of $1.7 million. This dollar amount is exvessel<br />
value (e.g., whole fish, wholesale price), and the final economic value is about three to four times<br />
higher. Commercial landings at Oceanside represent 10.3 percent of the total San Diego County nearshore<br />
landings. The commercial catch and value changes significantly from year to year. The value of landings<br />
for the nearshore species for San Diego County in 1998 was $1.3 million (Port of San Diego plus<br />
Oceanside) with Oceanside representing 10.0 percent of the total. This is in sharp contrast to 1997 when<br />
the total landings were $3.2 million with Oceanside accounting for 16.6 percent of that figure. It should<br />
be noted that unlike fish block harvest data, the commercial port landing data of nearshore species for San<br />
Diego County does include catch from the Channel Islands as well as from areas along the mainland. The<br />
proportion of catch attributable to areas other than San Diego County coastline cannot be determined from<br />
available records.<br />
For the San Diego area as a whole, California lobster ranked first in value ($14.1 million) of landings<br />
followed closely by red urchin ($11.6 million) (Table 3.8-11). These two species accounted for over 80<br />
percent of the total nearshore commercial catch. Lobster accounted for 68.0 percent of the catch at<br />
Page 3.8-14<br />
<strong>Regional</strong> <strong>Beach</strong> <strong>Sand</strong> <strong>Project</strong> <strong>EIR</strong>/<strong>EA</strong><br />
99-69\SANDAG <strong>EIR</strong><strong>EA</strong> 3.5 to 3.12.wpd 7/17/00
Oceanside Area<br />
San Diego Area<br />
600000<br />
140000<br />
3000000<br />
3500000<br />
500000<br />
All Nearshore Species<br />
120000<br />
2500000<br />
All Nearshore Species<br />
3000000<br />
Pounds<br />
400000<br />
300000<br />
200000<br />
100000<br />
80000<br />
60000<br />
40000<br />
Value ($)<br />
Pounds<br />
2000000<br />
1500000<br />
1000000<br />
2500000<br />
2000000<br />
1500000<br />
1000000<br />
Value ($)<br />
100000<br />
20000<br />
500000<br />
500000<br />
0<br />
81 82 83 84 85 86 87 88 89 90 91 92 93 94 95 96 97 98<br />
0<br />
0<br />
81 82 83 84 85 86 87 88 89 90 91 92 93 94 95 96 97 98<br />
0<br />
70000<br />
500000<br />
250000<br />
1800000<br />
Pounds<br />
60000<br />
50000<br />
40000<br />
30000<br />
20000<br />
10000<br />
Lobster, California spiny<br />
450000<br />
400000<br />
350000<br />
300000<br />
250000<br />
200000<br />
150000<br />
100000<br />
50000<br />
Value ($)<br />
Pounds<br />
200000<br />
150000<br />
100000<br />
50000<br />
Lobster, California spiny<br />
1600000<br />
1400000<br />
1200000<br />
1000000<br />
800000<br />
600000<br />
400000<br />
200000<br />
Value ($)<br />
0<br />
81 82 83 84 85 86 87 88 89 90 91 92 93 94 95 96 97 98<br />
0<br />
0<br />
81 82 83 84 85 86 87 88 89 90 91 92 93 94 95 96 97 98<br />
0<br />
50000<br />
16000<br />
2500000<br />
1800000<br />
Pounds<br />
45000<br />
40000<br />
35000<br />
30000<br />
25000<br />
20000<br />
15000<br />
10000<br />
Urchin, red<br />
14000<br />
12000<br />
10000<br />
8000<br />
6000<br />
4000<br />
Value ($)<br />
Pounds<br />
2000000<br />
1500000<br />
1000000<br />
500000<br />
Urchin, red<br />
1600000<br />
1400000<br />
1200000<br />
1000000<br />
800000<br />
600000<br />
400000<br />
Value ($)<br />
5000<br />
2000<br />
200000<br />
0<br />
81 82 83 84 85 86 87 88 89 90 91 92 93 94 95 96 97 98<br />
0<br />
0<br />
81 82 83 84 85 86 87 88 89 90 91 92 93 94 95 96 97 98<br />
0<br />
90000<br />
60000<br />
250000<br />
250000<br />
80000<br />
70000<br />
Crab, rock unspecified<br />
50000<br />
200000<br />
Crab, rock unspecified<br />
200000<br />
Pounds<br />
60000<br />
50000<br />
40000<br />
30000<br />
40000<br />
30000<br />
20000<br />
Value ($)<br />
Pounds<br />
150000<br />
100000<br />
150000<br />
100000<br />
Value ($)<br />
20000<br />
10000<br />
10000<br />
50000<br />
50000<br />
0<br />
81 82 83 84 85 86 87 88 89 90 91 92 93 94 95 96 97 98<br />
0<br />
0<br />
81 82 83 84 85 86 87 88 89 90 91 92 93 94 95 96 97 98<br />
0<br />
Source: CDF&G 1981-1998<br />
Figure 3.8-2<br />
Summary of Commercial Landings (Value and Pounds) for Port of San Diego and Port of Oceanside<br />
for Nearshore Commercially Important Species by Year from 1981 to 1998
Oceanside Area<br />
San Diego Area<br />
40000<br />
70000<br />
100000<br />
200000<br />
Pounds<br />
35000<br />
30000<br />
25000<br />
20000<br />
15000<br />
10000<br />
5000<br />
Halibut, California<br />
60000<br />
50000<br />
40000<br />
30000<br />
20000<br />
10000<br />
Value ($)<br />
Pounds<br />
90000<br />
80000<br />
70000<br />
60000<br />
50000<br />
40000<br />
30000<br />
20000<br />
10000<br />
Halibut, California<br />
180000<br />
160000<br />
140000<br />
120000<br />
100000<br />
80000<br />
60000<br />
40000<br />
20000<br />
Value ($)<br />
0<br />
81 82 83 84 85 86 87 88 89 90 91 92 93 94 95 96 97 98<br />
0<br />
0<br />
81 82 83 84 85 86 87 88 89 90 91 92 93 94 95 96 97 98<br />
0<br />
1<br />
1<br />
120000<br />
250000<br />
0.9<br />
0.8<br />
Abalone<br />
0.9<br />
0.8<br />
100000<br />
Abalone<br />
200000<br />
Pounds<br />
0.7<br />
0.6<br />
0.5<br />
0.4<br />
0.3<br />
0.7<br />
0.6<br />
0.5<br />
0.4<br />
0.3<br />
Value ($)<br />
Pounds<br />
80000<br />
60000<br />
40000<br />
150000<br />
100000<br />
Value ($)<br />
0.2<br />
0.1<br />
0.2<br />
0.1<br />
20000<br />
50000<br />
0<br />
81 82 83 84 85 86 87 88 89 90 91 92 93 94 95 96 97 98<br />
0<br />
0<br />
81 82 83 84 85 86 87 88 89 90 91 92 93 94 95 96 97 98<br />
0<br />
14000<br />
35000<br />
45000<br />
140000<br />
Pounds<br />
12000<br />
10000<br />
8000<br />
6000<br />
4000<br />
2000<br />
Sheephead, California<br />
30000<br />
25000<br />
20000<br />
15000<br />
10000<br />
5000<br />
Value ($)<br />
Pounds<br />
40000<br />
35000<br />
30000<br />
25000<br />
20000<br />
15000<br />
10000<br />
5000<br />
Sheephead, California<br />
120000<br />
100000<br />
80000<br />
60000<br />
40000<br />
20000<br />
Value ($)<br />
0<br />
81 82 83 84 85 86 87 88 89 90 91 92 93 94 95 96 97 98<br />
0<br />
0<br />
81 82 83 84 85 86 87 88 89 90 91 92 93 94 95 96 97 98<br />
0<br />
Pounds<br />
14000<br />
12000<br />
10000<br />
8000<br />
6000<br />
4000<br />
2000<br />
Prawn, spot<br />
90000<br />
80000<br />
70000<br />
60000<br />
50000<br />
40000<br />
30000<br />
20000<br />
10000<br />
Value ($)<br />
Pounds<br />
14000<br />
12000<br />
10000<br />
8000<br />
6000<br />
4000<br />
2000<br />
Prawn, spot<br />
90000<br />
80000<br />
70000<br />
60000<br />
50000<br />
40000<br />
30000<br />
20000<br />
10000<br />
Value ($)<br />
0<br />
81 82 83 84 85 86 87 88 89 90 91 92 93 94 95 96 97 98<br />
0<br />
0<br />
81 82 83 84 85 86 87 88 89 90 91 92 93 94 95 96 97 98<br />
0<br />
1<br />
1<br />
1<br />
Cucumber, sea<br />
1<br />
1<br />
1<br />
30000<br />
25000<br />
Cucumber, sea<br />
12000<br />
10000<br />
Pounds<br />
1<br />
1<br />
1<br />
0<br />
0<br />
1<br />
1<br />
1<br />
0<br />
0<br />
Value ($)<br />
Pounds<br />
20000<br />
15000<br />
10000<br />
8000<br />
6000<br />
4000<br />
Value ($)<br />
0<br />
0<br />
0<br />
0<br />
5000<br />
2000<br />
0<br />
81 82 83 84 85 86 87 88 89 90 91 92 93 94 95 96 97 98<br />
0<br />
0<br />
81 82 83 84 85 86 87 88 89 90 91 92 93 94 95 96 97 98<br />
0<br />
Source: CDF&G 1981-1998<br />
Figure 3.8-2. Continued.
Oceanside Area<br />
San Diego Area<br />
300<br />
2000<br />
3000<br />
8000<br />
Pounds<br />
250<br />
200<br />
150<br />
100<br />
50<br />
Prawn, ridgeback<br />
1800<br />
1600<br />
1400<br />
1200<br />
1000<br />
800<br />
600<br />
400<br />
200<br />
Value ($)<br />
Pounds<br />
2500<br />
2000<br />
1500<br />
1000<br />
500<br />
Prawn, ridgeback<br />
7000<br />
6000<br />
5000<br />
4000<br />
3000<br />
2000<br />
1000<br />
Value ($)<br />
0<br />
81 82 83 84 85 86 87 88 89 90 91 92 93 94 95 96 97 98<br />
0<br />
0<br />
81 82 83 84 85 86 87 88 89 90 91 92 93 94 95 96 97 98<br />
0<br />
90<br />
180<br />
4500<br />
12000<br />
80<br />
70<br />
Eel, California moray<br />
160<br />
140<br />
4000<br />
3500<br />
Eel, California moray<br />
10000<br />
Pounds<br />
60<br />
50<br />
40<br />
30<br />
120<br />
100<br />
80<br />
60<br />
Value ($)<br />
Pounds<br />
3000<br />
2500<br />
2000<br />
1500<br />
8000<br />
6000<br />
4000<br />
Value ($)<br />
20<br />
10<br />
40<br />
20<br />
1000<br />
500<br />
2000<br />
0<br />
81 82 83 84 85 86 87 88 89 90 91 92 93 94 95 96 97 98<br />
0<br />
0<br />
81 82 83 84 85 86 87 88 89 90 91 92 93 94 95 96 97 98<br />
0<br />
1<br />
1<br />
4000<br />
14000<br />
Pounds<br />
0.9<br />
0.8<br />
0.7<br />
0.6<br />
0.5<br />
0.4<br />
0.3<br />
0.2<br />
0.1<br />
Shrimp, unspecified<br />
0.9<br />
0.8<br />
0.7<br />
0.6<br />
0.5<br />
0.4<br />
0.3<br />
0.2<br />
0.1<br />
Value ($)<br />
Pounds<br />
3500<br />
3000<br />
2500<br />
2000<br />
1500<br />
1000<br />
500<br />
Shrimp, unspecified<br />
12000<br />
10000<br />
8000<br />
6000<br />
4000<br />
2000<br />
Value ($)<br />
0<br />
81 82 83 84 85 86 87 88 89 90 91 92 93 94 95 96 97 98<br />
0<br />
0<br />
81 82 83 84 85 86 87 88 89 90 91 92 93 94 95 96 97 98<br />
0<br />
120<br />
800<br />
6000<br />
4000<br />
100<br />
Urchin, purple sea<br />
700<br />
5000<br />
Urchin, purple sea<br />
3500<br />
Pounds<br />
80<br />
60<br />
40<br />
600<br />
500<br />
400<br />
300<br />
Value ($)<br />
Pounds<br />
4000<br />
3000<br />
2000<br />
3000<br />
2500<br />
2000<br />
1500<br />
Value ($)<br />
20<br />
200<br />
100<br />
1000<br />
1000<br />
500<br />
0<br />
81 82 83 84 85 86 87 88 89 90 91 92 93 94 95 96 97 98<br />
0<br />
0<br />
81 82 83 84 85 86 87 88 89 90 91 92 93 94 95 96 97 98<br />
0<br />
45<br />
60<br />
450<br />
500<br />
Pounds<br />
40<br />
35<br />
30<br />
25<br />
20<br />
15<br />
10<br />
5<br />
Octopus, unspecified<br />
50<br />
40<br />
30<br />
20<br />
10<br />
Value ($)<br />
Pounds<br />
400<br />
350<br />
300<br />
250<br />
200<br />
150<br />
100<br />
50<br />
Octopus, unspecified<br />
450<br />
400<br />
350<br />
300<br />
250<br />
200<br />
150<br />
100<br />
50<br />
Value ($)<br />
0<br />
81 82 83 84 85 86 87 88 89 90 91 92 93 94 95 96 97 98<br />
0<br />
0<br />
81 82 83 84 85 86 87 88 89 90 91 92 93 94 95 96 97 98<br />
0<br />
Source: CDF&G 1981-1998<br />
Figure 3.8-2. Continued.
3.8 Socioeconomics<br />
Table 3.8-11<br />
Summary of Values ($) of CDFG Commercial Landings<br />
by Port for San Diego County from 1981 to 1998<br />
Resource<br />
North County<br />
Oceanside<br />
Port of San Diego<br />
Total San Diego<br />
County<br />
Value Ranking<br />
Lobster $2,189,122 $11,928,314 $14,117,436 1<br />
Urchin, red $69,315 $11,524,961 $11,594,276 2<br />
Crab, rock $334,585 $1,303,726 $1,638,311 3<br />
Halibut, California $287,148 $1,17l,691 $1,458,839 4<br />
Abalone (all species) 0 $1,029,356 $1,029,356 5<br />
Sheephead, California $83,740 $575,888 $659,628 6<br />
Prawn, spot $250,530 392,664 $643,194 7<br />
Sea cucumber 0 $36,387 $36,387 8<br />
Prawn, ridgeback $3,123 $20,202 $23,325 9<br />
Eel, California moray $180 $20,399 $20,579 10<br />
Shrimp, unspecified 0 $19,789 $19,789 11<br />
Urchin, purple $673 $11,441 $12,114 12<br />
Octopus $109 $1,572 $1,681 13<br />
Total Value $3,218,525 $28,036,390 $31,254,915 na<br />
Oceanside. Landings of red urchins at Oceanside only account for 2.2 percent of the commercial value.<br />
Lobster accounted for 42.5 percent of the value of the total catch at the San Diego port, and lobster and<br />
combined red urchin accounted for 83.7 percent of the value of the total catch. Thus, lobster landings at<br />
Oceanside were by far the most valuable resource for local fisherman while lobster and red urchin are<br />
about equal for the San Diego area.<br />
It is important to note how relatively large the lobster and urchin fisheries are in relation to other San Diego<br />
area fisheries. As shown in Table 3.8-11, lobster and urchins were the only species whose ex-vessel value<br />
was in excess of $10 million over the period 1981-1998. The next most valuable species for the same<br />
period was well under $2 million.<br />
Other important commercial species for San Diego County include rock crabs (various species of Cancer<br />
spp.) which ranked third in value ($1.6 million), California halibut which ranked 4 th ($1.4 million), and<br />
abalone (all species of Haliotis spp.) ranked 5 th ($1.0 million). Few red urchins are landed at Oceanside,<br />
so rock crab and halibut ranked second and third in value at this port, respectively. These three species<br />
Page 3.8-16<br />
<strong>Regional</strong> <strong>Beach</strong> <strong>Sand</strong> <strong>Project</strong> <strong>EIR</strong>/<strong>EA</strong><br />
99-69\SANDAG <strong>EIR</strong><strong>EA</strong> 3.5 to 3.12.wpd 7/17/00
3.8 Socioeconomics<br />
were the only species whose local landing value was in excess of $1 million each (but less than $10 million)<br />
over the period 1981-1998.<br />
Some species historically had low value and were not commercially exploited in even the recent past<br />
(Figure 3.8-2). However, with the advent of the live trap market for California sheephead and spot prawn,<br />
the value and importance of these resources has increased. Averaged over the last 18 years these species<br />
ranked 6 th and 7 th , respectively, and in 1998 sheephead and spot prawn represented 4.4 percent and 2.2<br />
percent of the nearshore San Diego County commercial catch. These two species, with values of<br />
approximately $660,000 and $640,000 are the only species valued above $40,000 (but less than $1<br />
million).<br />
Other resources of lesser value include sea cucumber (Parastichopus spp.), ridgeback prawn, California<br />
moray eel, shrimp, purple urchin, and octopus. The combined value of these latter species represents only<br />
0.36 percent of the total value from 1981 to 1998 and only 1.3 percent of the value for total landings for<br />
1998.<br />
For all nearshore species of commercial importance, volume and value have fluctuated significantly both<br />
in absolute and relative terms over the period 1981-1998, as shown in Figure 3.8-2. Perhaps the most<br />
obvious trend has been the decline and subsequent closure of harvesting abalone. In the early 1980’s,<br />
abalone ranked third in importance behind lobster and red urchin. However, abalone harvest has declined<br />
significantly for multiple reasons and at the present time there is a moratorium on the harvesting of abalone<br />
south of San Francisco. Furthermore, the white and black abalone are candidate species for listing as an<br />
endangered species.<br />
Other important trends include the variability and value of the lobster catch which declined significantly in<br />
the late 1980’s following the 1983/1984 El Niño event and has shown an increasing trend until 1997, which<br />
was the best year on record. Lobster catch declined significantly following the El Niño of 1997/1998. The<br />
pattern of lower lobster catch following El Niño has been observed before by commercial fisherman, but<br />
the magnitude of decreases varied by location (Guth 1999). As shown in Figure 3.8-1, the value of lobster<br />
in 1998 dropped to approximately one-quarter of its 1997 value in the Oceanside/North County port area<br />
and to approximately one-half of its 1997 value in the San Diego port area.<br />
Poundage and value of the red urchin catch has also shown extreme fluctuation. This resource also showed<br />
a decline in the late 1980s, followed by increases in the early 1990s, and then a leveling off followed by<br />
<strong>Regional</strong> <strong>Beach</strong> <strong>Sand</strong> <strong>Project</strong> <strong>EIR</strong>/<strong>EA</strong> Page 3.8-17<br />
99-69\SANDAG <strong>EIR</strong><strong>EA</strong> 3.5 to 3.12.wpd 7/17/00
3.8 Socioeconomics<br />
a significant decline for 1997 and 1998 (Figure 3.8-2). A similar pattern is seen for rock crabs. Because<br />
of the complexity of the natural environment and species life histories, causes for annual changes in<br />
abundance of species are often not known and are difficult to determine. However, El Niño events<br />
significantly affect the physical environment (e.g., temperature, nutrients) which directly affects the success<br />
and survival of commercially important species. Equally important are the indirect effects caused by El<br />
Niño; e.g., the loss of most kelp beds and the food and shelter these habitats provide. Red urchins may<br />
well survive El Niño events but with a significant loss of kelp they have little food available and thus are not<br />
capable of producing roe, which is the target of the commercial harvest. Thus, red urchin harvest declines<br />
following El Niño events are more due to kelp loss and poor condition of the urchins, and not necessarily<br />
because the urchins are directly affected by El Niño or have been overharvested.<br />
Finfish catch and values have also shown considerable variability over the period. California halibut catch<br />
has shown considerable annual variation, but was greatest in the mid 1980s (Figure 3.8-2). By 1998,<br />
halibut represented only 3.8 percent of the total value for all the nearshore species. The live trap fishery<br />
for the California sheephead is relatively new, becoming important around 1992. Similarly, the live trap<br />
fishing for the spot prawn has become an important resource with 1993 representing a peak year for the<br />
value of this resource. Sea cucumbers appear to have become a commercially important fishery beginning<br />
around 1993.<br />
It is important to note that harvest of all target resources declined in 1998 following the most recent El Niño<br />
(Figure 3.8-2). A similar decline for most species also occurred following the 1983/1984 El Niño (Figure<br />
3.8-2).<br />
Economic Importance of Nearshore Species by Fish Block<br />
Table 3.8-12 provides a breakout of ex-vessel value of most valuable nearshore species for the relevant<br />
fish blocks for the period 1987-1998 to facilitate comparisons by block. Clearly lobster and red urchin<br />
are the most valuable in terms of dollar amount.<br />
In terms of geographic distribution of valuable nearshore species, several important facts are evident in<br />
Table 3.8-12. First, the overall importance of fish block 860, La Jolla to Point Loma, must be highlighted.<br />
This block accounts for 85 percent of the total value for the species and area listed. Second, lobster and<br />
red urchins are each worth more than 14 times as much as the next most valuable species. Third, within<br />
the two most valuable species, a very different geographic distribution pattern is found. For urchins, fully<br />
Page 3.8-18<br />
<strong>Regional</strong> <strong>Beach</strong> <strong>Sand</strong> <strong>Project</strong> <strong>EIR</strong>/<strong>EA</strong><br />
99-69\SANDAG <strong>EIR</strong><strong>EA</strong> 3.5 to 3.12.wpd 7/17/00
3.8 Socioeconomics<br />
99 percent of the value of the local fishery is concentrated in fish block 860, stretching from La Jolla to<br />
Point Loma. For lobsters, the La Jolla to Point Loma area dominates the value of catch as well, but not<br />
as strongly. Seventy-seven percent of the value is concentrated in this block ($7.5 million), but the value<br />
of lobster from the Oceanside ($0.8 million) and Encinitas/Solana <strong>Beach</strong> ($1.1 million) blocks are each<br />
worth more than any other species (except urchins) for the entire five-block region combined. Each is also<br />
worth in excess of 19 times the value of urchins from any one block in the region, aside from the La<br />
Jolla/Point Loma block. The Del Mar/Torrey Pines block, with a lobster value of $353,000 comprises a<br />
relatively small portion (four percent) of the regional lobster catch, however this value is still well in excess<br />
(by a factor of two or more) of the value of any other single commercial nearshore species for any<br />
individual block outside of block 860.<br />
Table 3.8-12<br />
San Diego County Landings by Fish Block for 1987 to 1998<br />
Most Valuable Nearshore Species Values (Dollars)<br />
Species<br />
Oceanside<br />
Block 801/822<br />
Area Name and Fish Block Number<br />
Encinitas /<br />
Solana <strong>Beach</strong><br />
Block 821<br />
Del Mar /<br />
Torrey Pines<br />
Block 842<br />
La Jolla /<br />
Point Loma<br />
Block 860<br />
Imperial<br />
<strong>Beach</strong><br />
Block 877<br />
Totals<br />
Lobster $802,777 $1,109,232 $353,294 $7,467,964 $9,556 $9,742,823<br />
Red Urchins $10,463 $41,827 $5,466 $9,869,331 $14,734 $9,941,821<br />
Rock Crab $163,163 $25,348 $11,865 $412,939 $60,085 $673,400<br />
Halibut $63,352 $8,285 $2,842 $540,178 $1,868 $616,525<br />
Abalone (1) $0 $6,320 $1,138 $154,239 $0 $161,697<br />
Sheephead $71,432 $20,734 $1,668 $581,807 $362 $676,003<br />
Spot Prawn (2) $272,923 $16,486 $72,107 $279,826 $0 $641,342<br />
Total $1,384,110 $1,228,232 $448,380 $19,306,284 $86,605 $22,453,611<br />
(1)<br />
Season currently closed due to a fishing moratorium.<br />
(2)<br />
Not a nearshore species, but included here in response to public input.<br />
Source: CDFG 1994 - 1999<br />
Looking at the next tier species by value in Table 3.8-12, there are three nearshore species currently being<br />
fished that have an aggregate value in the $600,000 to $700,000 range. Approximately 78 percent of the<br />
combined value of these species is concentrated in the La Jolla/Point Loma fish block (slightly over $1.5<br />
million out of just under $2.0 million total value). The pattern of distribution of catch is different for rock<br />
crab, however, than for halibut and sheephead. Halibut and sheephead are more heavily concentrated (88<br />
percent and 86 percent of total area species value, respectively) in the La Jolla/Point Loma area. Rock<br />
<strong>Regional</strong> <strong>Beach</strong> <strong>Sand</strong> <strong>Project</strong> <strong>EIR</strong>/<strong>EA</strong> Page 3.8-19<br />
99-69\SANDAG <strong>EIR</strong><strong>EA</strong> 3.5 to 3.12.wpd 7/17/00
3.8 Socioeconomics<br />
crab catch, on the other hand, is less concentrated. While La Jolla/Point Loma still account for 61 percent<br />
of the catch, Oceanside accounts for 24 percent of the area catch, and Imperial <strong>Beach</strong> comprises nine<br />
percent of the catch. Oceanside is thus a relatively important area for the rock crab fishery, and rock crab<br />
is by far the most valuable nearshore species in the Imperial <strong>Beach</strong> fish block (69 percent of total value of<br />
nearshore catch from that block).<br />
Nearshore Species Habitat Range and Fishing Techniques<br />
The following sections provide additional information about the lifecycle and typical fishery operations for<br />
lobster and red sea urchin. Specific biological life cycle data on these species may be found in Appendix<br />
D. Appendix D also contains similar information for rock crab, halibut, abalone, sheephead, spot prawn,<br />
and ridge back prawn.<br />
California Spiny Lobster (Panulirus interruptus), the commercial species of greatest value locally, is<br />
found from Monterey Bay to Manzanillo, Mexico, mostly from Point Conception to Magdalena Bay, Baja<br />
California. Adult lobsters are typically found in rocky areas from the intertidal zone to at least 240 feet.<br />
Local fishermen note that there is marked movement of adults between inshore and offshore areas. Most<br />
of the fishing for this species occurs in rocky coastal areas up to 120 feet in depth, although lobsters have<br />
been caught on any type of substrate. Traps are set on all bottom types from sand to rocky substrate.<br />
Ninety percent of commercial trapping takes place in depths of 90 feet or less (CDFG 1993), with most<br />
traps set at depths of 10 to 50 feet, according to local fishermen. The fishing season extends from October<br />
to March.<br />
Lobster are commercially fished locally via baited traps set from small boats that range from 20 to 45 feet<br />
in length, with the typical vessels in the 25 to 35 foot range. Smaller vessels may work the season with a<br />
single fisherman, while larger vessels may start the season with a skipper and two crew, but then reduce<br />
to one crew member as the catch drops off. The basis for crew compensation apparently varies from<br />
operation to operation, with some based on various types of the more traditional ‘share’ calculations, while<br />
others have moved toward flat rates.<br />
As noted in earlier sections, the area of highest concentration for lobster fishing occurs in the La Jolla to<br />
Point Loma area, but vessels from Mission Bay to Oceanside can and do fish the North County coast,<br />
according to interviews. Where a vessel is “homeported” is a trade-off between expense and convenience<br />
as, for example, fuel costs and slip fees tend to be less expensive at port facilities farther from local fishing<br />
Page 3.8-20<br />
<strong>Regional</strong> <strong>Beach</strong> <strong>Sand</strong> <strong>Project</strong> <strong>EIR</strong>/<strong>EA</strong><br />
99-69\SANDAG <strong>EIR</strong><strong>EA</strong> 3.5 to 3.12.wpd 7/17/00
3.8 Socioeconomics<br />
grounds. Also according to interviews, vessels working the area may have several hundred traps per<br />
vessel, up to perhaps 600 to 700 traps per boat for the larger operations. As gear sets and hauls can be<br />
six days apart, it is not necessarily the largest vessels that work the greatest number of traps, as small vessel<br />
owners can increase their effective gear capacity by making more frequent sets. According to local<br />
fishermen, an estimated 10,000 to 12,000 traps are set during peak season (October through November),<br />
with progressively fewer traps set as the season continues past the peak.<br />
The nature of the fishery has reportedly changed with the implementation of a limited entry regulatory<br />
system several years ago. Prior to limited entry, there were apparently a larger number of part-time lobster<br />
fishermen than is the case today. According to interviews, approximately one-half the fishermen who fish<br />
lobster do so exclusively, and do not switch to other species after the lobster harvest starts to decline or<br />
the season ends but, rather, discontinue fishing until the next lobster season. Those who do keep fishing<br />
transition into a variety of other fisheries, including spot prawns, sheephead, rock crab, the live eel fishery,<br />
or gillnetting. While levels of dependency vary, lobster is clearly the central element of the typical year’s<br />
economic base for participants, especially for the smaller boats that have less flexibility in their ability to<br />
change gear types and move between fisheries.<br />
The market for locally caught lobster has varied considerably over the last few years. Lobster are not<br />
landed at central processing facilities, rather, both the fishermen and the buyers are mobile and sales can<br />
take place wherever appropriate harbor facilities are available. While a significant portion of the local catch<br />
reportedly goes to the local restaurant market, it is not uncommon for larger operations to sell catch to Los<br />
Angeles-based entities. Reportedly, a larger proportion of the catch was going to Far East until the recent<br />
Asian economic crisis; in the wake of that set of events fishermen have had to rebuild local market<br />
relationships.<br />
Juvenile lobsters usually spend their first one to two years in nearshore surfgrass and eelgrass beds. Adults<br />
are found in rocky habitats, though they will move onto sand in search of food. It takes about seven to<br />
eleven years for lobsters to reach legal size. Fishermen expressed concerns about the impact that projectrelated<br />
turbidity may have on these nursery areas and its effect on juvenile lobster. There are only few<br />
studies on the effects of turbidity and sand burial on juvenile lobsters (e.g., Engle 1979, Perry 1999).<br />
Perry’s work in New Zealand on juvenile rock lobster found that they could survive suspended sediment<br />
of 363 mg/l for four days with no adverse effects. Juveniles of this species were also observed to bury with<br />
no apparent detrimental effect. Thus, juvenile rock lobster appear capable of tolerating high turbidity and<br />
suspended sediments. There may be benefits as well as high turbidity may reduce visual predation.<br />
<strong>Regional</strong> <strong>Beach</strong> <strong>Sand</strong> <strong>Project</strong> <strong>EIR</strong>/<strong>EA</strong> Page 3.8-21<br />
99-69\SANDAG <strong>EIR</strong><strong>EA</strong> 3.5 to 3.12.wpd 7/17/00
3.8 Socioeconomics<br />
Cumulative ex-vessel dollar value for lobster from 1994-1998 comprised 42.7 percent of all commercial<br />
species landed in San Diego County (Table 3.8-10). Considering only nearshore commercial species since<br />
1981, lobster ranked number one in value representing 45.2 percent of the value for all nearshore species<br />
landed (Table 3.8-11). In the North County areas, lobster represents 68 percent of the commercial catch<br />
landed at Oceanside. Considering only the North County area for most recent two years, 1997-1998,<br />
Encinitas to Solana <strong>Beach</strong> represented about 62 percent of the catch landed at Oceanside while Oceanside<br />
and Del Mar to Torrey Pines represents about 29 percent and 9 percent, respectively, a pattern somewhat<br />
different than that seen over the longer term, where the Oceanside area has normally played a much larger<br />
role in proportion of landings.<br />
Red sea urchins (Strongylocentrotus franciscanus) are ranked number two value to local fishermen.<br />
Red and purple sea urchins are found from Alaska to Cedros Island in Baja California. They majority are<br />
found in rocky bottom habitats from the intertidal zone out to a depth of about 100 feet. According to local<br />
fishermen, urchins take three to five years to reach a commercially viable harvest size. Harvesting of red<br />
sea urchins can occur from 5 to 100 feet, but most of the catch is taken between 20 and 60 feet.<br />
According to fishermen contacted for this project, it is estimated that most of the local catch is taken<br />
between 10 and 50 feet, with a smaller amount harvested somewhat deeper. Urchins are reportedly fished<br />
locally anywhere between Oceanside and San Diego where there is a hard bottom, but kelp areas are<br />
considered the prime fishing locations.<br />
Red urchins are generally landed at San Diego, a processing center, and generally not landed at Oceanside<br />
where there is no processing facility. In terms of harvest area, nearly 99 percent of the red urchins are<br />
caught in the La Jolla to Point Loma fish block. Urchin harvest is conducted by divers. Diving typically is<br />
done from small vessels (22 to 32 feet) with several divers generally using surface supplied air. Urchins<br />
are collected in net bags and hauled to the surface at regular intervals. According to local fishermen, at<br />
least some San Diego area based urchin divers harvest urchins from as far away as northern California.<br />
3.8.3 Kelp Harvesting<br />
Kelp harvesting operations also occur in the proposed project area. The giant kelp, Macrocystis pyrifera,<br />
is found all along the western coast of the United States. Off the Southern California coast, kelp is found<br />
on rocky substrate in wave-exposed areas at depths of 20 to 120 feet. Kelp harvesting has occurred in<br />
California since 1911 and involves the use of cutter barges which harvest the upper the kelp canopy down<br />
Page 3.8-22<br />
<strong>Regional</strong> <strong>Beach</strong> <strong>Sand</strong> <strong>Project</strong> <strong>EIR</strong>/<strong>EA</strong><br />
99-69\SANDAG <strong>EIR</strong><strong>EA</strong> 3.5 to 3.12.wpd 7/17/00
3.8 Socioeconomics<br />
to a depth of about four feet below the water surface. Kelp beds are located near some of the borrow sites<br />
and beaches.<br />
A number of factors can influence the vitality of kelp beds. Grazers such as the halfmoon, opaleye, perch,<br />
sea urchins, and various crustaceans can affect the growth of kelp. Storms frequently pull kelp plants off<br />
the substrate. Sedimentation of the rocky bottom has also been known to retard kelp growth and bury<br />
young plants, preventing development and reproduction. Kelp beds are leased and harvested by Kelco<br />
along the San Diego coast. Those beds located between Leucadia and Solana <strong>Beach</strong> are of prime concern<br />
for the project (Glantz 1999).<br />
3.8.4 Recreational Fishing and Diving<br />
A wide range of marine recreational fishing and diving opportunities exist along the San Diego coast. These<br />
include surf and shoreline fishing, pier fishing, party boat fishing, private boat fishing and diving and<br />
skin/SCUBA diving. National Marine Fisheries Service conducted a study (NMFS 1991) to determine<br />
the extent of recreational marine fishing in California and the economic impact of the activity. Data from<br />
telephone interviews of California Coastal County residents was assessed to estimate annual expenditures,<br />
locations and types of fishing methods, and target fish species. The total number of anglers utilizing San<br />
Diego County fisheries resources in 1989 was estimated at 159,600, with annual expenditures exceeding<br />
$82 million. Fishing from private and charter boats accounted for over $71 million of the total. Fishing<br />
from piers and beaches was a popular activity, with 350,900 and 119,800 trips per year, respectively.<br />
Annual expenditures for pier and beach fishing were $4.9 million and $5.8 million, respectively. The most<br />
common target species for beach fishing were bass, halibut, corbina, white seabass, perch, and croaker.<br />
The sport party boat fishing fleet specializes in carrying fisherman to areas where fish can be caught and<br />
more recently for whale watching. Most of these charters target offshore and pelagic species especially<br />
tuna, yellowtail, albacore, and shark. However, there is a small contingent of operators that specialize is<br />
half and one-day charters that typically fish the nearshore areas and kelp beds. These operators target sand<br />
and kelp bass and California halibut. Oceanside harbor has one to four boats that specialize in this fishery<br />
while Mission and San Diego Bays have a large charter fleet.<br />
Sport diving and spearfishing activity mostly occur in the nearshore waters, and the number of diving trips<br />
in San Diego was about 30,000 per year (NMFS 1991). Most diving occurs in habitats rich in marine life,<br />
especially kelp beds and rocky reefs. Much of the diving in San Diego involves trips to locations not<br />
<strong>Regional</strong> <strong>Beach</strong> <strong>Sand</strong> <strong>Project</strong> <strong>EIR</strong>/<strong>EA</strong> Page 3.8-23<br />
99-69\SANDAG <strong>EIR</strong><strong>EA</strong> 3.5 to 3.12.wpd 7/17/00
3.8 Socioeconomics<br />
accessible other than by boat, including offshore kelp beds, the vessels intentionally sunk as artificial reefs<br />
in “Wreck Alley” off of Mission <strong>Beach</strong>, and even offshore islands and banks. Shoreline diving is also<br />
popular. Borrow site MB-1 is located inside the Wreck Alley area (refer to Section 3.6).<br />
The most common local beach diving locations include the submarine canyon off La Jolla Shores (where<br />
dive instruction classes are typically taught), La Jolla Cove (due to the abundant undersea life there<br />
attributable in part to the area’s protected underwater reserve status), and numerous other sites along the<br />
coast from La Jolla to Oceanside where public access to nearshore reefs is convenient. Photography,<br />
spearfishing for kelp bass and halibut, and diving for spiny lobsters are three of the more popular diving<br />
activities. Spearfishing can involve either skin diving (also known as snorkeling or free diving) or the<br />
SCUBA gear. Sport diving for lobster usually involves SCUBA diving as the lobster must be captured by<br />
hand without the use of snares or any other tools, and individual lobster are often found under reef ledges,<br />
in crevices between rocks, or in other difficult to access areas. Some lobster diving takes place at night,<br />
as lobsters are more likely to leave shelter to forage and are thus easier to capture by hand. Diving for fish<br />
and/or lobster occurred at a rate of about 1,000 trips per month, season permitting. The average number<br />
of divers varies according to season, weather, and sea conditions (NMFS 1991). In recent years, the<br />
popularity of non-consumptive sport dive activities have increased relative to dives oriented toward taking<br />
game.<br />
Page 3.8-24<br />
<strong>Regional</strong> <strong>Beach</strong> <strong>Sand</strong> <strong>Project</strong> <strong>EIR</strong>/<strong>EA</strong><br />
99-69\SANDAG <strong>EIR</strong><strong>EA</strong> 3.5 to 3.12.wpd 7/17/00
3.9 Public Health and Safety<br />
3.9 PUBLIC H<strong>EA</strong>LTH AND SAFETY<br />
For purposes of this <strong>EIR</strong>/<strong>EA</strong>, public health and safety issues are defined as those that directly affect the<br />
continued ability to protect and preserve life and property at locations along the proposed receiver sites.<br />
Specifically, these issues are lifeguard services and recreational safety. In addition, vessel safety is<br />
addressed because dredging activity would occur in the ocean. Safety issues relating to structures and<br />
utilities, including lifeguard towers, are discussed in Section 4.10 (Structures and Utilities). Sediment and<br />
chemical comparisons of dredged material and receiver sites have been completed and there would be no<br />
risk to health or safety. This issue is not addressed further.<br />
3.9.1 Lifeguard Services<br />
At five proposed receiver sites (i.e., South Oceanside, Solana <strong>Beach</strong>, Del Mar, Mission <strong>Beach</strong>, and<br />
Imperial <strong>Beach</strong>), the respective jurisdiction provides lifeguard services. At the eight state beaches,<br />
however, the California Department of Parks and Recreation provides lifeguard services. The lifeguards<br />
are responsible for all recreational safety measures along the beach. Safety measures include manned<br />
lifeguard towers and regular vehicle patrols during the summer months. Lifeguard towers are typically more<br />
heavily staffed on weekends during summer months. The locations of lifeguard towers at each receiver site<br />
are addressed in Section 3.10.<br />
3.9.2 Recreational Safety<br />
Storm drain outfalls occasionally contribute to water pollution at the receiver sites, especially after rainy<br />
periods. Water pollution stemming from these outfalls has resulted in the periodic closing of the region’s<br />
beaches, when water contact is not recommended. In the days after a rain period, tidal action and<br />
longshore currents disperse pollutants and the beaches are reopened for recreation.<br />
3.9.3 Vessel Safety<br />
Commercial boats, fishing boats, and recreational vessels currently traverse the overall project area along<br />
the San Diego region’s coast. Most vessels operate out of Oceanside Harbor, Mission Bay, and San<br />
Diego Bay.<br />
<strong>Regional</strong> <strong>Beach</strong> <strong>Sand</strong> <strong>Project</strong> <strong>EIR</strong>/<strong>EA</strong> Page 3.9-1<br />
99-69\SANDAG <strong>EIR</strong><strong>EA</strong> 3.5 to 3.12.wpd 7/17/00
3.10 Structures and Utilities<br />
3.10 STRUCTURES AND UTILITIES<br />
For the purpose of this <strong>EIR</strong>/<strong>EA</strong>, structures and utilities are defined as sewer outfalls, access stairs and<br />
ramps, storm drain pipes, sea walls, and lifeguard towers. The following section identifies the location of<br />
the existing structures and utilities within or adjacent to the receiver sites. The description of structures and<br />
utilities is based on limited field surveys and prior environmental documentation (Department of the Navy<br />
1997a; 1997b). In addition, city personnel were contacted to determine the location of city sewer and<br />
storm drain ocean outfalls and any other related facilities that could be potentially impacted by<br />
implementation of the proposed action.<br />
3.10.1 Receiver Sites<br />
South Oceanside<br />
A 36-inch sewer outfall pipe is buried almost perpendicular to the shoreline directly north of Loma Alta<br />
Creek. The depth of cover is unknown. This pipe was installed in approximately 1971 (Department of<br />
the Navy 1997a). There are two side-by-side 36-inch storm drains at the end of Marron Street. Two<br />
side-by-side 18-inch storm drains are located directly south of Tyson Street. An 18-inch pipe, half filled<br />
with sand, is located at the end of Forster Street.<br />
Public access stairs are located at the end of Tyson Street, Ash Street, Marron Street, Cassidy Street, and<br />
Vista Way. The bottom elevation of the stairs at Cassidy Street is approximately 6.6 feet above MSL.<br />
Ramp access exists at Wisconsin Street, Forster Street, and just north of Loma Alta Creek. In addition,<br />
there is an access road at Oceanside Boulevard. A number of additional access paths and stairs have been<br />
constructed in front of private homes, including a stairway just north of the creek. Rip-rap (large boulders)<br />
exists to protect beachfront residences and structures. Lifeguard Tower No. 9 is located at the base of<br />
Oceanside Boulevard on top of a concrete and rip-rap structure, and Tower No.11 is located further south<br />
at Buccaneer <strong>Beach</strong> on the sand. Both towers are located approximately 50 feet from the shoreline and<br />
remain in their locations year-round. The platforms for these lifeguard towers are approximately eight feet<br />
high.<br />
<strong>Regional</strong> <strong>Beach</strong> <strong>Sand</strong> <strong>Project</strong> <strong>EIR</strong>/<strong>EA</strong> Page 3.10-1<br />
99-69\SANDAG <strong>EIR</strong><strong>EA</strong> 3.5 to 3.12.wpd 7/17/00
3.10 Structures and Utilities<br />
North Carlsbad<br />
The 50-foot Buena Vista Lagoon weir is located directly north of this receiver site, at the mouth of the<br />
lagoon. An 18-inch-wide by 6-inch-high rectangular concrete drainage outlet structure is located adjacent<br />
to the bottom of the public access stairs off Ocean Street. The top of the structure lies approximately 18<br />
inches above the beach surface. The concrete drainage structure contains two 4-inch storm drain outlets,<br />
which extend approximately 4 feet above the existing beach surface at the base of the stairs.<br />
Public access stairs to the beach are located off Ocean Street, Beech Avenue, Pacific Avenue, Grand<br />
Avenue, and Carlsbad Village Drive. A public access road is located at Pine Avenue. Several residential<br />
properties also have private stairways for beach access, a few of which reach the beach surface. A number<br />
of properties in the vicinity have sea walls and rip-rap to protect against erosion.<br />
Lifeguard Tower No. 9 is located on the sand at the southern end of the receiver site on Pine Avenue. The<br />
tower is surrounded by rip-rap and remains in the same location throughout the year. Its platform is<br />
approximately 15 feet above the sand.<br />
South Carlsbad North<br />
Lifeguard Tower No. 13 is located on the bluff just south of Palomar Airport Road and is permanent.<br />
There are no structures or utilities located on the beach along this receiver site.<br />
South Carlsbad South<br />
One public access stairway is located in the vicinity of the proposed receiver site. The stairway is located<br />
across from Ponto Drive and has beach access from the State Park on top of the bluff. In addition, two<br />
lifeguard towers are located along the beach; approximately 30 yards north of the access staircase and 250<br />
yards south of the access stairs. The towers are moved from the beach in late October to the jetty further<br />
north against the bluff, and replaced on the beach in March.<br />
Batiquitos<br />
An 18-inch storm drain is located at the base of Moorgate Road. Public access stairs are located north<br />
of Sea Bluffs Road. An additional private access stairway is located just south of Sea Bluffs Road. An<br />
Page 3.10-2<br />
<strong>Regional</strong> <strong>Beach</strong> <strong>Sand</strong> <strong>Project</strong> <strong>EIR</strong>/<strong>EA</strong><br />
99-69\SANDAG <strong>EIR</strong><strong>EA</strong> 3.5 to 3.12.wpd 7/17/00
3.10 Structures and Utilities<br />
elevated path with a sea wall and vegetated groundcover also extends along the receiver site. State<br />
Lifeguard Tower No. 2 is located directly north of the receiver site, and Lifeguard Tower No. 1 is located<br />
near the public restrooms. Both towers are annually removed from the beach in late fall and placed back<br />
on the beach in mid-April.<br />
Leucadia<br />
Public access points are located to the south and north ends of the proposed receiver site. An access ramp<br />
is located just south of Jasper Street, while a stairway is located just north of the base of Grandview Street.<br />
Along the site, numerous private access stairs have been built from the bluffs down to the beach. Rip-rap<br />
and seawalls also exist to protect bluff top residences. A lifeguard tower is located at the base of the<br />
access stairs north of Grandview Street. The tower is located on the beach only during the summer months,<br />
and is removed during the winter season.<br />
Moonlight <strong>Beach</strong><br />
One 36-inch, one 60-inch, and three 48-inch storm drain pipes are located at the end of B Street at<br />
Moonlight State <strong>Beach</strong>. The City of Encinitas has excavated several feet around the outlets to expose the<br />
pipes and allow proper drainage flow.<br />
A public stairway is located at D Street. Rip-rap exists at the base of the bluffs on the northern and<br />
southern boundaries of the receiver site. A permanent lifeguard stand is located at the south end of<br />
Moonlight <strong>Beach</strong> at C Street and a temporary tower is placed at the north end of the beach at B Street.<br />
Both are situated on the berm above the low tide beach, and neither tower is moved during the winter<br />
season.<br />
Cardiff<br />
The 30-inch diameter San Elijo sewer outfall is located just south of the mouth of San Elijo Lagoon. The<br />
outfall is buried within the southern end of the proposed Cardiff receiver site.<br />
A cluster of restaurants and shops, as well as a public parking lot, is located to the north of the receiver site.<br />
The restaurants are protected by rip-rap. Just south of the restaurants, a lifeguard access ramp extends<br />
to the beach. A low rip-rap sea wall protects the length of road, restaurants, and parking facilities along<br />
<strong>Regional</strong> <strong>Beach</strong> <strong>Sand</strong> <strong>Project</strong> <strong>EIR</strong>/<strong>EA</strong> Page 3.10-3<br />
99-69\SANDAG <strong>EIR</strong><strong>EA</strong> 3.5 to 3.12.wpd 7/17/00
3.10 Structures and Utilities<br />
the receiver site. State Lifeguard Tower No. 6, located just south of the lagoon mouth, is pulled back to<br />
the parking lot during the winter season. Lifeguard Tower No. 5 is located just south of the restaurants.<br />
This tower is fixed by the cobbles on the beach and is not moved seasonally. Its viewing platform is<br />
approximately 15 feet high.<br />
Solana <strong>Beach</strong><br />
A 60-inch energy dissipator storm drain pipe is located at the west end of Plaza Street. Another storm<br />
drain outlet is located at Seascape Surf, to the south of Fletcher Cove. This storm drain emerges from the<br />
bluff face at approximately 9 to 10 feet above MSL.<br />
There is a public access staircase at Del Mar Shores <strong>Beach</strong> Park, and a public access ramp at Plaza Street<br />
at Fletcher Cove. In addition, private stairs extend to the beach from Seascape Surf. One temporary<br />
lifeguard tower is located within the proposed receiver site at the Seascape Surf access point. Another<br />
tower is located just north of the proposed site at Fletcher Cove. Both towers are annually placed on the<br />
beach the weekend before Memorial Day and removed the weekend after Labor Day.<br />
Del Mar<br />
There is an eight by three-foot storm drain outlet located at 17 th Street near the lifeguard headquarters that<br />
emerges onto the beach. Three 12-inch storm drains exist along the bluffs at Powerhouse Park. There is<br />
also a six-inch storm drain outlet at the west end of 20 th Street and one 12-inch storm drain located<br />
approximately 280 feet north of the 15 th Street cliff.<br />
There is a public access road located south of 17 th Street. There are no access stairs along the receiver<br />
site, but two ramps exist near 15 th Street and Powerhouse Park. The entire beach is accessible to<br />
pedestrians from the public streets which end at the beach. A sea wall extends along the site from 29 th<br />
Street to 19 th Street. In addition, a protective rip-rap wall exists along commercial uses just north of<br />
Powerhouse Park.<br />
R<br />
R<br />
The City’s lifeguard headquarters is located at the foot of 17 th Street. Additional lifeguard towers are<br />
located at 20 th , 25 th , and 29 th Streets. All stations are permanent structures located just east of the beach,<br />
and the 29 th Street tower is located just east of the seawall. All lifeguard stations’ viewing platforms are<br />
Page 3.10-4<br />
<strong>Regional</strong> <strong>Beach</strong> <strong>Sand</strong> <strong>Project</strong> <strong>EIR</strong>/<strong>EA</strong><br />
99-69\SANDAG <strong>EIR</strong><strong>EA</strong> 3.5 to 3.12.wpd 7/17/00
3.10 Structures and Utilities<br />
approximately 20 feet above the sand. No additional structures or utilities presently exist within the<br />
shoreline area of the proposed receiver site.<br />
Torrey Pines<br />
A permanent County of San Diego lifeguard tower is located adjacent to the parking lot at the base of<br />
Torrey Pines Road. Rip-rap has been placed on the beach to protect the road. No additional structures<br />
or utilities presently exist within the shoreline area of the proposed receiver site.<br />
Mission <strong>Beach</strong><br />
There are four access staircases along the receiver site. They are located at the ends of San Juan Place,<br />
El Carmel Place, San Luis Obispo Place, and Santa Barbara Place. Lifeguard Tower No. 16 is located<br />
at the end of Jersey Court, and Lifeguard Tower No.17 is located just west of the access stairs on San Luis<br />
Obispo Place. These towers are temporary and are removed from the site in late October and replaced<br />
in March of each year.<br />
A boardwalk with a 2.5-foot high sea wall that extends the length of the receiver site was built between<br />
1925 and 1928. The seawall is approximately 10 feet above MSL. No additional structures or utilities<br />
presently exist within the shoreline area of the proposed receiver site.<br />
Imperial <strong>Beach</strong><br />
A public access ramp exists at the end of Imperial <strong>Beach</strong> Boulevard. A gated access road used by<br />
lifeguard vehicles is located at the south end of Seacoast Drive. In addition, emergency vehicle access is<br />
also used by lifeguards at Admiralty Way and Descanso Avenue. One temporary lifeguard tower is located<br />
at the end of Imperial <strong>Beach</strong> Boulevard, at the north terminus of the receiver site. Rip-rap protects<br />
residences along the southern portion of the receiver site. No additional structures or utilities presently exist<br />
within the shoreline area of the proposed receiver site.<br />
3.10.2 Borrow Sites<br />
All six borrow sites are located offshore and contain no utilities within their boundaries. For more<br />
information, refer to Section 3.6 (Land Use) and Figures 2-15 to 2-20.<br />
<strong>Regional</strong> <strong>Beach</strong> <strong>Sand</strong> <strong>Project</strong> <strong>EIR</strong>/<strong>EA</strong> Page 3.10-5<br />
99-69\SANDAG <strong>EIR</strong><strong>EA</strong> 3.5 to 3.12.wpd 7/17/00
3.11 Traffic<br />
3.11 TRAFFIC<br />
This existing conditions section for traffic addresses receiver site access for the receiver sites. Vessel traffic<br />
is discussed in Sections 3.9 and 4.9 (Public Health and Safety) and in Section 2.4.<br />
<strong>Regional</strong> access to all receiver sites is provided via Interstate 5 (I-5). West of I-5, access is also provided<br />
via Coast Highway 101, which extends from Oceanside south to Del Mar. North Torrey Pines Road,<br />
Mission Boulevard, and Seacoast Drive provide access to the Torrey Pines, Mission <strong>Beach</strong>, and Imperial<br />
<strong>Beach</strong> receiver sites, respectively. The principal access routes from I-5 for the 13 receiver sites are listed<br />
in Table 3.11-1 below.<br />
Table 3.11-1<br />
Principal Access Routes<br />
Receiver Site<br />
South Oceanside<br />
North Carlsbad<br />
South Carlsbad North<br />
South Carlsbad South<br />
Batiquitos<br />
Leucadia<br />
Moonlight <strong>Beach</strong><br />
Cardiff<br />
Solana <strong>Beach</strong><br />
Del Mar<br />
Torrey Pines<br />
Mission <strong>Beach</strong><br />
Imperial <strong>Beach</strong><br />
Principal Access Route<br />
Oceanside Boulevard<br />
Carlsbad Village Drive<br />
Palomar Airport Road, Poinsettia Drive<br />
Palomar Airport Road, Poinsettia Drive<br />
Poinsettia Drive, La Costa Avenue<br />
La Costa Avenue, Leucadia Boulevard<br />
Encinitas Boulevard<br />
Birmingham Drive<br />
Lomas Santa Fe Drive, Via de la Valle<br />
Via de la Valle, Del Mar Heights Road<br />
Carmel Valley Road, Genesee Avenue<br />
Mission Bay Drive<br />
Imperial <strong>Beach</strong> Boulevard<br />
Existing traffic on the beach access routes is often heavy, as most of the routes serve commercial, motel<br />
or camping, and residential uses as well as the beaches. Traffic is most congested on warm weekends,<br />
when residents from throughout the country and adjacent areas use the beaches. During these peak use<br />
periods, parking areas often are filled to capacity.<br />
<strong>Regional</strong> <strong>Beach</strong> <strong>Sand</strong> <strong>Project</strong> <strong>EIR</strong>/<strong>EA</strong> Page 3.11-1<br />
99-69\SANDAG <strong>EIR</strong><strong>EA</strong> 3.5 to 3.12.wpd 7/17/00
3.12 Air Quality<br />
3.12 AIR QUALITY<br />
This section provides an overview of the air quality in the San Diego region. It is not necessary or possible<br />
to describe air quality at each of the specific borrow sites or receiver sites. Since potential air quality<br />
impacts are addressed in terms of compliance with federal or state regulations, those regulations are<br />
discussed in this section.<br />
3.12.1 Environmental Setting, Climate and Meteorology<br />
The receiver and borrow sites are located in the San Diego Air Basin (SDAB), which is contiguous with<br />
San Diego County. The climate of San Diego County is characterized by warm, dry summers and mild,<br />
wet winters. One of the main determinants of the climatology is a semi-permanent high-pressure area (the<br />
Pacific High) in the eastern Pacific Ocean. In the summer, this pressure center is located well to the north,<br />
causing storm tracks to be directed north of California. This high-pressure cell maintains clear skies for<br />
much of the year. When the Pacific High moves southward during the winter, this pattern chances, and<br />
low-pressure storms are brought into the region, causing widespread precipitation. In San Diego County,<br />
the months of heaviest precipitation are November through April, averaging about 9 to 14 inches annually.<br />
The mean temperature is 62.2ºF, and the mean maximum and mean minimum temperatures are 75.7ºF and<br />
48.5ºF, respectively.<br />
The Pacific High also influences the wind patterns of California. The predominant wind directions at<br />
MCAS Miramar are westerly and west-southwesterly during all four seasons, and the average annual wind<br />
speed is 5.6 mph.<br />
A common atmospheric condition known as a temperature inversion affects air quality in San Diego.<br />
During an inversion, air temperatures get warmer with increasing height rather than cooler. Subsidence<br />
inversions occur during the warmer months (May through October) as descending air associated with the<br />
Pacific high-pressure cell comes into contact with cool marine air. The boundary between the layers of air<br />
represents a temperature inversion which traps pollutants below it. The inversion layer is approximately<br />
2,000 feet MSL during the months of May through October. However, during the winter months<br />
(November through April), the temperature inversion is approximately 3,000 feet MSL. Inversion layers<br />
are important elements of local air quality because they inhibit the dispersion of pollutants, thus resulting in<br />
a temporary degradation of air quality.<br />
<strong>Regional</strong> <strong>Beach</strong> <strong>Sand</strong> <strong>Project</strong> <strong>EIR</strong>/<strong>EA</strong> Page 3.12-1<br />
99-69\SANDAG <strong>EIR</strong><strong>EA</strong> 3.5 to 3.12.wpd 7/17/00
3.12 Air Quality<br />
3.12.2 Applicable Regulations, Plans, and Policies<br />
The Federal Clean Air Act (42 U.S.C. §§ 7401-7671q) requires the adoption of national ambient air<br />
quality standards (NAAQS) to protect the public health and welfare from the effects of air pollution. The<br />
NAAQS have been updated occasionally. Current standards are set for sulfur dioxide (SO 2 ), carbon<br />
monoxide (CO), nitrogen dioxide (NO 2 ), ozone (O 3 ), particulate matter equal to or less than 10 microns<br />
in size (PM 10 ), fine particulate matter equal to or less than 2.5 microns in size (PM 2.5 ), and lead (Pb) 3 . The<br />
State of California Air Resources Board (ARB) has established additional standards which are generally<br />
more restrictive than the NAAQS. Federal and state standards are shown in Table 3.12-1.<br />
In San Diego County, the San Diego APCD is the agency responsible for protecting the public health and<br />
welfare through the administration of federal and state air quality laws, regulations, and policies. Included<br />
in the APCD’s tasks are the monitoring of air pollution, the preparation of the State Implementation Plan<br />
(SIP) for the SDAB, and the promulgation of Rules and Regulations. The SIP includes strategies and<br />
tactics to be used to attain the federal O 3 standard in the County. The elements are taken from the <strong>Regional</strong><br />
Air Quality Strategies (RAQS), which is the APCD plan for attaining the state O 3 standard, which is more<br />
stringent than the federal standard. The Rules and Regulations include procedures and requirements to<br />
control the emission of pollutants and to prevent adverse impacts.<br />
The SD APCD does not have quantitative emissions limits for construction activities. With respect to the<br />
proposed project, APCD Rule 51, Nuisance, is of interest, and includes the following:<br />
A person shall not discharge from any source whatsoever such quantities of air<br />
contaminants or other material which cause injury, detriment, nuisance or annoyance to any<br />
considerable number of persons or to the public or which cause or have a natural tendency<br />
to cause injury or damage to business or property.<br />
3 Standards for 8-hour O3 and PM 2.5 standards became effective on September 15, 1997, and policies and systems to<br />
implement these new standards are being developed. No new controls with respect to the new standards will be required by the<br />
USEPA until after the year 2002. However, on May 14, and June 18, 1999, the United States Court of Appeals rendered<br />
decisions that effectively struck down these standards. On June 28, 1999 the USEPA filed a petition asking the court for a<br />
reversal of the decision.<br />
Page 3.12-2<br />
<strong>Regional</strong> <strong>Beach</strong> <strong>Sand</strong> <strong>Project</strong> <strong>EIR</strong>/<strong>EA</strong><br />
99-69\SANDAG <strong>EIR</strong><strong>EA</strong> 3.5 to 3.12.wpd 7/17/00
3.12 Air Quality<br />
Table 3.12-1<br />
California and National Ambient Air Quality Standards<br />
Ozone (O 3 )<br />
Pollutant<br />
Carbon Monoxide<br />
(CO)<br />
Nitrogen Dioxide<br />
(NO 2 )<br />
Sulfur Dioxide (SO 2 )<br />
Suspended Particulate<br />
Matter (PM 10 )<br />
Averaging Time<br />
California Standards (1) National Standards (2)<br />
Concentration (3) Primary (3,4) Secondary (3,5)<br />
1 Hour 0.09 ppm (180 :g/m3) 0.12 ppm (235 :g/m3)<br />
8 Hour 0.08 ppm 6<br />
8 Hour 9.0 ppm (10 mg/m3) 9.0 ppm (10 mg/m3)<br />
1 Hour 20 ppm (23 mg/m3) 35 ppm (40 mg/m3)<br />
Same as Primary<br />
Standard<br />
Annual Average - 0.053 ppm (100 :g/m3) Same as Primary<br />
1 Hour 0.25 ppm (470 :g/m3) -<br />
Standard<br />
Annual Average - 80 :g/m3 (0.03 ppm) -<br />
24 Hour 0.04 ppm (105 :g/m3) 365 :g/m3 (0.14 ppm) -<br />
3 Hour - - 1300 :g/m3 (0.5 ppm)<br />
1 Hour 0.25 ppm (655 :g/m3) - -<br />
Annual Geometric Mean 30 :g/m3 - -<br />
24 Hour 50 :g/m3 150 :g/m3<br />
Annual Arithmetic Mean<br />
-<br />
50 :g/m3<br />
Fine Particulate 24 Hour 65 :g/m3<br />
Matter (PM 2.5 ) 6 Annual Arithmetic Mean<br />
15 :g/m3<br />
Lead (Pb)<br />
30 Day Average 1.5 :g/m3 - -<br />
Calendar Quarter - 1.5 :g/m3<br />
Sulfates (SO 4 ) 24 Hour 25 :g/m3<br />
Hydrogen Sulfide (HS) 1 Hour 0.03 ppm (42 :g/m3)<br />
Vinyl Chloride<br />
(chloroethene)<br />
Visibility Reducing<br />
Particles<br />
24 Hour 0.010 ppm (26 :g/m3)<br />
8 Hour (10 am-6 pm,<br />
Pacific Standard Time)<br />
Insufficient amount to produce an<br />
extinction coefficient of 0.23 per<br />
kilometer– visibility of ten miles or<br />
more (0.07-30 miles or more for<br />
Lake Tahoe) due to particles when<br />
the relative humidity is less than 70<br />
percent. Method: ARB Method V<br />
(8/18/89).<br />
Source: ARB Fact Sheet 39 (11/91); SCAQMD bulletin (8/97) and www.arb.ca.gov<br />
(1)<br />
California standards, other than ozone, carbon monoxide,<br />
sulfur dioxide (1 hour), nitrogen dioxide, PM 10 , are values that<br />
are not to be equaled or exceeded. The ozone, carbon<br />
monoxide, sulfur dioxide (1 hour), nitrogen dioxide, and PM 10<br />
standards are not to be exceeded.<br />
(2)<br />
National standards, other than ozone and those based on<br />
annual averages or annual geometric means, are not to be<br />
exceeded more than once a year. The ozone standard is<br />
attained when the expected number of days per calendar year<br />
with maximum hourly average concentrations above standard<br />
is equal to or less than one.<br />
(3)<br />
Concentration expressed first in units in which it was<br />
promulgated. Equivalent units given in parentheses are based<br />
upon a reference temperature of 25°C and a reference pressure<br />
of 760 mm of mercury. All measurements of air quality are to<br />
be corrected to a reference temperature of 25°C and a<br />
reference pressure of 760 mm of mercury (1,013.2 millibar).<br />
No Federal Standards<br />
-<br />
-<br />
Same as Primary<br />
Standard<br />
Ppm in this table refers to ppm by volume or micromoles of<br />
pollutant per mole of gas.<br />
(4)<br />
National Primary Standards: The levels of air quality necessary,<br />
with an adequate margin of safety, to protect the public health.<br />
Each state must attain the primary standards within a specified<br />
number of years after that state's implementation plan is<br />
approved by the USEPA.<br />
(5)<br />
National Secondary Standards: The levels of air quality<br />
necessary to protect the public welfare from any known or<br />
anticipated adverse effects of a pollutant. Each state must attain<br />
the secondary standards within a "reasonable time" after the<br />
implementation plan is approved by the USEPA.<br />
(6)<br />
New federal 8-hour ozone and fine particulate matter standards<br />
were promulgated by USEPA on July 18, 1997. The federal 1-<br />
hour ozone standard continues to apply in areas that violated the<br />
standard. Contact USEPA for further clarification and current<br />
federal policies.<br />
<strong>Regional</strong> <strong>Beach</strong> <strong>Sand</strong> <strong>Project</strong> <strong>EIR</strong>/<strong>EA</strong> Page 3.12-3<br />
99-69\SANDAG <strong>EIR</strong><strong>EA</strong> 3.5 to 3.12.wpd 7/17/00
3.12 Air Quality<br />
APCD regulations require persons building, altering or replacing equipment which may emit air pollutants<br />
to obtain a permit called an Authority to Construct. Further, APCD regulations require persons operating<br />
equipment which may emit air pollutants to obtain a Permit to Operate. The APCD is responsible for the<br />
review of applications, approval and issuance of these permits.<br />
3.12.3 Clean Air Act Conformity<br />
The 1990 amendments to Federal Clean Air Act Section 176 required the USEPA to promulgate rules to<br />
ensure that federal actions conform to the appropriate SIP. These rules, known together as the General<br />
Conformity Rule (40 C.F.R. §§ 51.850-.860 and 40 C.F.R. §§ 93.150-160), require any federal agency<br />
responsible for an action in a nonattainment area to determine that the action is either exempt from the<br />
General Conformity Rule’s requirements or positively determine that the action conforms to the applicable<br />
SIP. In addition to the roughly thirty presumptive exemptions established and available in the General<br />
Conformity Rule, an agency may establish that emission rates would be less than specified emission rate<br />
thresholds, known as de minimis limits. An action is exempt from a conformity determination if an<br />
applicability analysis shows that the total direct and indirect emissions from the project will be below the<br />
applicable de minimis thresholds (Table 3.12-2) and will not be regionally significant, which is defined as<br />
representing ten percent or more of an area’s emissions inventory or budget.<br />
R<br />
Table 3.12-2<br />
De Minimis Emission Thresholds for General Conformity Applicability<br />
R<br />
R<br />
1<br />
Pollutant<br />
San Diego Air Basin<br />
CO ROC 1 1<br />
NO X SO X PM 10<br />
Federal Attainment status Attainment Nonattainment Nonattainment Attainment Attainment<br />
Serious Serious<br />
De minimis emissions (tons/year) NA 2 50 50 NA 2 NA 2<br />
Attainment status is for ozone; de minimis limits apply to precursor pollutants Reactive Organic Compounds (ROC) and<br />
Oxide of Nitrogen (NO X ).<br />
2<br />
De minimis thresholds do not apply to attainment pollutants.<br />
Page 3.12-4<br />
<strong>Regional</strong> <strong>Beach</strong> <strong>Sand</strong> <strong>Project</strong> <strong>EIR</strong>/<strong>EA</strong><br />
99-69\SANDAG <strong>EIR</strong><strong>EA</strong> 3.5 to 3.12.wpd 7/17/00
3.12 Air Quality<br />
3.12.4 <strong>Regional</strong> and Local Air Quality<br />
Specific geographic areas are classified as either “attainment” or “nonattainment” areas for each pollutant<br />
based upon the comparison of measured data with NAAQS and state standards. The SDAB, which is<br />
contiguous with San Diego County, currently meets the federal standards for all pollutants except O 3 and<br />
state standards for all pollutants except O 3 and PM 10 . The SDAB is currently classified as a federal and<br />
state “serious” O 3 nonattainment area and a state nonattainment area for PM 10 . The SDAB currently falls<br />
under a federal “maintenance plan” for CO, following a 1998 redesignation as a CO attainment area.<br />
Ambient air pollutant concentrations in the SDAB are measured at ten air quality monitoring stations<br />
operated by San Diego APCD. In the coastal area, O 3 is monitored at Camp Pendleton, Oceanside, Del<br />
Mar, and Chula Vista; PM 10 is monitored at Oceanside and Chula Vista. Table 3.12-3 presents O 3<br />
exceedance of standard data for the county and coastal stations for the 1994-1998 period. Table 3.12-4<br />
presents PM 10 exceedance of standard data for the county and coastal stations for the 1994-1998 period.<br />
3.12.5 Sources of <strong>Regional</strong> and Local Pollution<br />
The most significant regional sources of O 3 , NO 2 , and CO are automobiles and other on-road vehicles.<br />
O 3 is formed by the reaction of volatile organic compounds (VOC) and oxides of nitrogen (NO x ), which<br />
are combustion products from gas and diesel engines. Other important sources of VOC are paints,<br />
coatings and process solvents. The major sources of PM 10 are construction, demolition and dust from<br />
paved and unpaved roads.<br />
<strong>Regional</strong> <strong>Beach</strong> <strong>Sand</strong> <strong>Project</strong> <strong>EIR</strong>/<strong>EA</strong> Page 3.12-5<br />
99-69\SANDAG <strong>EIR</strong><strong>EA</strong> 3.5 to 3.12.wpd 7/17/00
3.12 Air Quality<br />
Station<br />
Table 3.12-3<br />
Ozone – Number of Days Exceeding Federal and State Standards<br />
San Diego County - 1994-1998<br />
Number of Days<br />
Exceeding Federal 1-Hour Standard<br />
Concentration >12 pphm<br />
Number of Days<br />
Exceeding State 1-Hour Standard<br />
Concentration >9 pphm<br />
Number of Days<br />
Exceeding Federal 8-Hour Standard<br />
Concentration >8 pphm<br />
1998 1997 1996 1995 1994 1998 1997 1996 1995 1994 1998 1997 1996 1995 1994<br />
Basinwide 9 1 2 12 9 54 43 51 96 79 35 16 31 48 46<br />
Camp Pendleton 0 0 – – – 9 6 – – – 5 3 – – –<br />
Oceanside 0 0 0 0 0 3 6 4 5 2 1 0 3 0 1<br />
Del Mar 0 0 0 0 0 1 4 2 12 4 0 2 2 3 1<br />
Chula Vista 0 0 0 1 0 2 10 1 7 4 0 3 0 1 0<br />
Source: San Diego APCD 1999, CARB 1999<br />
Camp Pendleton station not operating prior to 1997.<br />
Station<br />
Table 3.12-4<br />
PM 10 – Samples Exceeding Federal and State Standards<br />
San Diego County - 1994-1998<br />
Percent of Samples<br />
above Federal 24 hour<br />
standard of 150 :g/m3<br />
Percent of Samples<br />
above State 24 hour<br />
standard of 50 :g/m3<br />
Exceed Annual<br />
Standard?<br />
1998 1997 1996 1995 1994 1998 1997 1996 1995 1994 Federal State<br />
Basinwide 0 0 0 0 0 NA 26 18 27 29 N Y (1)<br />
Oceanside 0 0 0 0 0 0 0 2 7 4 N N<br />
Chula Vista 0 0 0 0 0 0 3 3 8 3 N N<br />
Sources: San Diego APCD, 1999, CARB 1999<br />
NA - Data not available.<br />
(1)<br />
The state annual standard was exceeded each year 1994-1998 at the Otay Mesa station. The standard was not exceeded at any other station during the 5-year period.<br />
Page 3.12-6<br />
<strong>Regional</strong> <strong>Beach</strong> <strong>Sand</strong> <strong>Project</strong> <strong>EIR</strong>/<strong>EA</strong><br />
99-69\SANDAG <strong>EIR</strong><strong>EA</strong> 3.5 to 3.12.wpd 7/17/00
3.1 Land Use<br />
3.13 NOISE<br />
3.13.1 Introduction<br />
Noise is defined as unwanted or objectionable sound. The effects of noise on people can include<br />
general annoyance, interference with speech communication, sleep disturbance and, in the extreme,<br />
hearing impairment.<br />
Noise Terminology<br />
The human ear is not equally sensitive to all frequencies within the sound spectrum. Therefore, a<br />
method called “A-weighting” is used to filter noise frequencies that are not audible to the human<br />
ear. Noise levels are usually measured and expressed in decibels (dB) and noise levels using the<br />
“A-weighted” noise scale are usually written dB(A) or dBA. Decibels are measured on a logarithmic<br />
scale which quantifies sound intensity in a manner similar to the Richter scale used for earthquake<br />
magnitudes. Thus, a doubling of the energy of a noise source, such as doubling traffic volume,<br />
would increase the noise level by 3 dBA; a halving of the energy would result in a 3 dBA decrease.<br />
Table 3.13-1 shows the relationship of various sound levels to commonly experienced noise events.<br />
Average noise levels over a period of minutes or hours are usually expressed as dB L eq , or the<br />
equivalent noise level for that period of time. The period of time average may be specified; L eq(3)<br />
would be a three hour average; when no period is specified, a one hour average is assumed.<br />
Construction noise standards are usually stated as average noise levels over a period of 1, 8 or 12<br />
hours.<br />
Noise standards for land use compatibility have been established by various jurisdictions, and in<br />
California are usually stated in terms of the Community Noise Equivalent Level (CNEL), which is a<br />
24-hour weighted average measure of community noise. The computation of CNEL adds 5 dB to the<br />
average hourly noise levels between 7 p.m. and 10 p.m. - the evening hours, and 10 dB to the average<br />
hourly noise levels between 10 p.m. and 7 a.m. - the nighttime hours. This weighting accounts for<br />
the increased human sensitivity to noise in the evening and nighttime hours. A similar 24-hour<br />
weighted average is the Day-Night Average noise level (L dn or DNL), which weights only the<br />
nighttime hours, and not the evening hours. CNEL is used primarily in California.<br />
<strong>Regional</strong> <strong>Beach</strong> <strong>Sand</strong> <strong>Project</strong> <strong>EIR</strong>/<strong>EA</strong> Page 3.13-1<br />
99-69\SECT-03.13.DOC 9/24/02
3.13 Noise<br />
Table 3.13-1<br />
Sound Levels of Typical Noise Sources and Noise Environments<br />
Noise Source<br />
(at a Given Distance)<br />
Scale of<br />
A-Weighted<br />
Sound Level<br />
in Decibels<br />
Noise Environment<br />
Human Judgement<br />
of Noise Loudness<br />
(Relative to a<br />
Reference Loudness<br />
of 70 Decibels*)<br />
140<br />
Military Jet Take-off<br />
with After-burner (50 ft)<br />
Civil Defense Siren (100 ft)<br />
130 Carrier Flight Deck<br />
Commercial Jet Take-off (200 ft) 120 Threshold of Pain<br />
*32 times as loud<br />
Pile Driver (50 ft) 110 Rock Music Concert *16 times as loud<br />
Ambulance Siren (100 ft)<br />
Newspaper Press (5 ft)<br />
Power Lawn Mower (3 ft)<br />
Motorcycle (25 ft)<br />
Propeller Plane Flyover (1000 ft)<br />
Diesel Truck, 40 mph (50 ft)<br />
Garbage Disposal (3 ft)<br />
100<br />
90<br />
80<br />
Boiler Room<br />
Printing Press Plant<br />
High Urban Ambient Sound<br />
Very Loud<br />
*8 times as loud<br />
*4 times as loud<br />
*2 times as loud<br />
Passenger Car, 65 mph (25 ft)<br />
Living Room Stereo (15 ft)<br />
Vacuum Cleaner (3 ft)<br />
Electronic Typewriter (10 ft)<br />
70 Moderately Loud<br />
*70 dB<br />
(Reference Loudness)<br />
Normal Conversation (5 ft)<br />
Air Conditioning Unit (100 ft)<br />
60 Data Processing Center<br />
Department Store<br />
*1/2 as loud<br />
Light Traffic (100 ft) 50 Private Business Office *1/4 as loud<br />
Bird Calls (distant) 40 Lower Limit of<br />
Urban Ambient Sound<br />
Quiet<br />
*1/8 as loud<br />
Soft Whisper (5 ft) 30 Quiet Bedroom<br />
20 Recording Studio Just Audible<br />
10 Threshold of Hearing<br />
0<br />
Page 3.13-2<br />
<strong>Regional</strong> <strong>Beach</strong> <strong>Sand</strong> <strong>Project</strong> <strong>EIR</strong>/<strong>EA</strong><br />
99-69\SECT-03.13.DOC 9/24/02
3.13 Noise<br />
Sleep Interference<br />
Sleep interference is a noise concern because sleep is a noise sensitive human activity. Sleep<br />
disturbance studies have identified interior noise levels that have the potential to cause sleep<br />
disturbance. Sleep disturbance does not necessarily mean awakening from sleep, but can refer to<br />
altering the pattern and stages of sleep (City of Solana <strong>Beach</strong> 1988). The California Department of<br />
Public Health has identified 35-45 dBA as the noise level that could cause interruption of sleep<br />
(County of San Diego 1980).<br />
Human Reaction to Sound and Response to Changes in Noise Levels<br />
People tend to compare an intruding noise with the existing background noise. If the new noise is<br />
readily identifiable or considerably louder than the background or ambient, it usually becomes<br />
objectionable. An aircraft flying over a residential area is an example.<br />
Under controlled conditions in an acoustics laboratory, the trained healthy human ear is able to<br />
discern changes in sound levels of 1 dBA, when exposed to steady, single frequency (“pure tone”)<br />
signals in the mid-frequency range. Outside of such controlled conditions, the trained ear can detect<br />
changes of 2 dBA in normal environmental noise. It is widely accepted that the average healthy ear,<br />
however, can barely perceive noise level changes of 3 dBA, whereas a 5 dBA change is readily<br />
noticeable. A 10 dBA change normally is perceived as a doubling, or halving, of the noise level.<br />
Sensitive Noise Receptors<br />
Noise sensitive receptors are generally considered to be human activities or land uses that may be<br />
subject to the stress of significant interference from noise. Land uses which are associated with<br />
sensitive receptors often include residential dwellings, mobile homes, hotels, motels, hospitals,<br />
nursing homes, education facilities, and libraries. Many jurisdictions recognize parks or recreation<br />
areas as noise sensitive land uses. All of the receiver sites include recreational beach areas. The<br />
recreational areas and activities and adjacent land uses are described in Section 3.6 of this <strong>EIR</strong>/<strong>EA</strong>.<br />
The descriptions in subsection 3.13.3 below highlight the non-recreational noise sensitive uses that<br />
would be exposed to noise sources included in the proposed action. These receptors are principally<br />
adjacent to the receiver areas.<br />
<strong>Regional</strong> <strong>Beach</strong> <strong>Sand</strong> <strong>Project</strong> <strong>EIR</strong>/<strong>EA</strong> Page 3.13-3<br />
99-69\SECT-03.13.DOC 9/24/02
3.13 Noise<br />
All of the borrow sites would be located offshore and there would be no adjacent sensitive receptors.<br />
The nearest sensitive receptors to any borrow site are approximately 4,000 feet away. These consist<br />
of residents on the shore near SO-7, SO-6, and SO-5.<br />
Sensitive receptors may also be threatened or endangered noise sensitive biological species. Noise<br />
sensitive avian species in the project area include the California least tern and the western snowy<br />
plover. The locations of these species relative to the receiver sites and borrow sites are described in<br />
Section 3.4 of this <strong>EIR</strong>/<strong>EA</strong>. The closest nesting locations are shown in Figure 3.4-1.<br />
3.13.2 Applicable Standards<br />
The proposed action is a construction project. Most of the jurisdictions in which the project would<br />
occur have construction noise standards which would be applicable to the project. Construction<br />
noise standards are usually found in a “noise ordinance”, and include limitations on the hours that<br />
construction work may be performed, maximum allowable noise levels, or both. In addition to the<br />
specific requirements, each ordinance typically includes a “General Prohibition” on noise that<br />
prohibits disturbing, excessive or offensive noise which causes discomfort or annoyance to<br />
reasonable persons of normal sensitivity. A noise ordinance also usually contains conditions and<br />
procedures for obtaining variances from construction noise limitations. Table 3.13-2 summarizes the<br />
standards applicable at the receiver sites. As noted in Section 2.7, there are no applicable noise<br />
standards at receiver sites within the California State Parks System.<br />
3.13.3 Existing Noise Levels at Receiver Sites<br />
The principal source of noise at each of the receiver sites is the ocean, including breaking waves and<br />
the interaction of water, rocks and sand in the surf area. Noise levels vary with the tide, height of the<br />
waves and the sand-rock composition. In general, all of the receiver sites have relatively high<br />
background noise levels due to constant surf activity. This is typical of a beach environment. The<br />
measured noise levels, and additional noise sources associated with the individual receiver sites, are<br />
described below.<br />
Existing noise levels were measured at the receiver sites between July 26 and September 27, 1999.<br />
A Larson-Davis Laboratories Model 712 Type 2 sound level meter was used. The meter calibration<br />
was checked before and after use. The following parameters were used: Filter: A-weighted;<br />
Page 3.13-4<br />
<strong>Regional</strong> <strong>Beach</strong> <strong>Sand</strong> <strong>Project</strong> <strong>EIR</strong>/<strong>EA</strong><br />
99-69\SECT-03.13.DOC 9/24/02
3.13 Noise<br />
Table 3.13-2 Summary of Applicable Construction Noise Standards<br />
(landscape – see end of file)<br />
<strong>Regional</strong> <strong>Beach</strong> <strong>Sand</strong> <strong>Project</strong> <strong>EIR</strong>/<strong>EA</strong> Page 3.13-5<br />
99-69\SECT-03.13.DOC 9/24/02
3.13 Noise<br />
Response: Slow; Time history period: 5 seconds. Generally, the total measurement time at each<br />
position was on the order of 10-15 minutes, because the ambient noise was relatively constant, and<br />
longer periods were not necessary to determine an average. Occasionally, measurements were cut<br />
short because of extraneous noise sources, such as barking dogs and curious people, or other<br />
conditions that precluded further measurement. Noise measurement locations were chosen at or near<br />
the sensitive receptors closest to the anticipated noise source locations, or at points that are<br />
equivalent. In some instances, access to representative points was not available, which is noted in<br />
the individual site descriptions.<br />
South Oceanside<br />
Sensitive Receptors<br />
The proposed receiver site is bounded on the east by a rip-rap slope. The site would extend from<br />
north of Marron Street, on the north, to south of Cassidy Street, on the south. Sensitive noise<br />
receptors include single and multi-family residences that are east of the beach and rip-rap slope, with<br />
setbacks on the order of 5 to 10 feet. The east sides of these homes face South Pacific Street. South<br />
of Buccaneer <strong>Beach</strong> Park and Morse Street, the homes on the east side of South Pacific Street are<br />
also potential sensitive receptors. These homes are elevated approximately 20 feet above the homes<br />
to the west, thus providing partial views to the beach. The NCTD railroad tracks, which carry<br />
approximately 41 trains per day 1 , are located approximately 800 feet east of the fill site.<br />
Noise Levels<br />
Table 3.13-3 shows the measured noise levels in the South Oceanside receiver site area. From this<br />
data, it may be assumed that noise levels of 62-65 dBA at the beachfront homes during periods when<br />
there is little or no activity on the beach, and little or no train or traffic noise. The range of noise<br />
levels indicates the variance in distance from the homes to the east edge of the fill area and the surf<br />
line. Noise levels would be greater during periods of greater activity on the beach, principally from<br />
voices. Nighttime noise levels at the homes on the east side of South Pacific Street, south of<br />
Cassidy, would be approximately 10 dB less, in the 52-55 dBA range. At these homes, daytime<br />
noise levels would be higher because of traffic on South Pacific Street.<br />
1 One way trips: 17 Amtrak, 18 Coaster and 6 freight. North of the Oceanside transit center, there are less<br />
Coaster passbys, but additional Metrolink trains.<br />
Page 3.13-6<br />
<strong>Regional</strong> <strong>Beach</strong> <strong>Sand</strong> <strong>Project</strong> <strong>EIR</strong>/<strong>EA</strong><br />
99-69\SECT-03.13.DOC 9/24/02
3.13 Noise<br />
Table 3.13-3<br />
South Oceanside Receiver Site – Noise Measurements (1)<br />
Location<br />
SO-A. West end of Oceanside Blvd.<br />
(north central part of fill area), at rip-rap.<br />
Full view of surf to north and south.<br />
SO-B. North of Buccaneer <strong>Beach</strong> Access<br />
central part of fill area), on porch of<br />
vacant home. Full view of surf to north<br />
and south.<br />
SO-C. West end of Cassidy St.(south part<br />
of fill area), on stairs at distance and<br />
elevation of second floor of adjacent<br />
homes. Full view of surf to north and<br />
south.<br />
SO-D. Homes on east side of S. Pacific<br />
St., elevated above beachfront homes on<br />
west side. Views of beach and surf<br />
between beachfront homes.<br />
Measured<br />
Noise Level<br />
dBA, L eq<br />
Comment<br />
62 Some noise from vehicles on S.<br />
Pacific St. and from train.<br />
65 Home to rip-rap distance approx 10<br />
ft. rip-rap to surf line approx. 30 ft.<br />
Some noisy traffic on S. Pacific St.<br />
66 Brief measurements interrupted by<br />
noise from traffic and friendly<br />
pedestrians on stairs.<br />
52-55 Estimated surf noise levels.<br />
(1)<br />
Measurement intervals of 3-10 minutes, July 29, 1999 between 6:00 and 7:00 a.m.<br />
North Carlsbad<br />
Sensitive Receptors<br />
The proposed receiver site would extend from north of Ocean Street, on the north, to just south of<br />
Pine Street. Sensitive noise receptors include single and multi-family residences that are adjacent to<br />
the beach. Some of these homes have rip-rap protection, others do not. The east sides of these<br />
homes face Ocean Street. The <strong>Army</strong> and Navy Academy, a preparatory school, is also adjacent to<br />
the beach, south of Pacific Street.<br />
Noise Levels<br />
<strong>Regional</strong> <strong>Beach</strong> <strong>Sand</strong> <strong>Project</strong> <strong>EIR</strong>/<strong>EA</strong> Page 3.13-7<br />
99-69\SECT-03.13.DOC 9/24/02
3.13 Noise<br />
Table 3.13-4 shows the measured noise levels in the North Carlsbad receiver site area. From this<br />
data, it may be assumed that noise levels of 68-69 dBA at the beachfront homes during periods when<br />
there is little or no activity on the beach.<br />
Page 3.13-8<br />
<strong>Regional</strong> <strong>Beach</strong> <strong>Sand</strong> <strong>Project</strong> <strong>EIR</strong>/<strong>EA</strong><br />
99-69\SECT-03.13.DOC 9/24/02
3.13 Noise<br />
Table 3.13-4<br />
North Carlsbad Receiver Site – Noise Measurements (1)<br />
Location<br />
Measured<br />
Noise Level<br />
dBA, L eq<br />
NC-A. Public access stairway at the north<br />
end of Ocean St (north part of fill area).<br />
On steps even with rear walls of buildings<br />
on either side. Full view of surf to north<br />
and south. 69<br />
NC-B. South of Beech St.(central part of<br />
fill area), on rip-rap even with multifamily<br />
to south. Full view of surf to north<br />
and south. 70<br />
NC-C. Between Oak and Pine Streets<br />
(south part of fill area), on rock even with<br />
first floor of southernmost home. Full<br />
view of surf to north and south. 69<br />
Comment<br />
Some homes further south project<br />
closer to surf. Measurement stopped<br />
when leaf blower put into operation.<br />
Most homes here are set back 20-30<br />
ft. further than the multi-family.<br />
Approx. 40 ft., surf to rip-rap, which<br />
is about 8' deep and 8' high.<br />
Some lifeguard public address noise.<br />
(1) Measurement intervals of 6-8 minutes, August 14, 1999 between 9:00 and 11:00 a.m.<br />
South Carlsbad North<br />
The proposed receiver site would extend from approximately the intersection of Palomar Airport<br />
Road and Carlsbad Boulevard, on the north, southward for a distance of approximately 2,800 feet. In<br />
this area, there are no residences or other sensitive noise receptors adjacent to the beach. The nearest<br />
sensitive noise receptors include single residences that are east of Carlsbad Boulevard on Oceanview<br />
Drive, at a distance of approximately 500 feet.<br />
Noise Levels<br />
Table 3.13-5 shows the measured noise levels in the South Carlsbad North receiver site area. From<br />
this data, it may be assumed that nighttime noise levels would be 52-62 dBA at the north end of the<br />
residential area, and 50-51 dBA L eq at the south end of the area. The large range for noise levels at<br />
the north end reflects the variability in traffic noise, which is the dominant source.<br />
<strong>Regional</strong> <strong>Beach</strong> <strong>Sand</strong> <strong>Project</strong> <strong>EIR</strong>/<strong>EA</strong> Page 3.13-9<br />
99-69\SECT-03.13.DOC 9/24/02
3.13 Noise<br />
Page 3.13-10<br />
<strong>Regional</strong> <strong>Beach</strong> <strong>Sand</strong> <strong>Project</strong> <strong>EIR</strong>/<strong>EA</strong><br />
99-69\SECT-03.13.DOC 9/24/02
3.13 Noise<br />
Table 3.13-5<br />
South Carlsbad North Receiver Site – Noise Measurements (1)<br />
Location<br />
Measured<br />
Noise Level<br />
dBA, L eq<br />
SCN-A. On west side of Oceanview Dr.<br />
at entrance to res. area (central part of fill<br />
area), approx 20 ft. west of front of homes<br />
and 550 ft. from surf line. View of ocean,<br />
but no view of surf. Nearly full view of<br />
Carlsbad Blvd. 66<br />
SCN-B. Intersection of Oceanview Dr.<br />
and Happiness (south part of fill area), at<br />
front of homes Approx 750 ft. to visible<br />
surf. Partial view of surf to south. Bluff<br />
obscures view of Carlsbad Blvd. 54<br />
Comment<br />
Dominant noise is traffic on<br />
Carlsbad Blvd. Can hear waves<br />
when no traffic; wave noise is 52-53<br />
dB L eq .<br />
Traffic noise 55-59 dB; surf noise 52<br />
dB. Coaster train line to east.<br />
(1) Measurement intervals of 6-8 minutes, August 14, 1999 between 9:00 and 11:00 a.m.<br />
South Carlsbad South<br />
Sensitive Receptors<br />
The proposed receiver site would extend from just south of the Encinas Creek outlet approximately<br />
2,800 feet to the south. Most of the area is adjacent to the South Carlsbad State <strong>Beach</strong> Campground.<br />
The east side of the campground faces Carlsbad Boulevard. Sensitive noise receptors include camp<br />
sites at the northern part of the campground. North of the campground, there are no sensitive<br />
receptors west of Carlsbad Boulevard. The area between the fill area and the campground is a steep<br />
bluff, and the campground is approximately 60 feet above the beach.<br />
Noise Levels<br />
Table 3.13-6 shows the measured noise levels in campground area. The noise heard at the camp sites<br />
along the west side of the campground is a combination of traffic noise from Carlsbad Boulevard and<br />
surf noise, along with occasional noise from within the camp ground. Along the east side of the<br />
campground the traffic noise is dominant.<br />
<strong>Regional</strong> <strong>Beach</strong> <strong>Sand</strong> <strong>Project</strong> <strong>EIR</strong>/<strong>EA</strong> Page 3.13-11<br />
99-69\SECT-03.13.DOC 9/24/02
3.13 Noise<br />
Page 3.13-12<br />
<strong>Regional</strong> <strong>Beach</strong> <strong>Sand</strong> <strong>Project</strong> <strong>EIR</strong>/<strong>EA</strong><br />
99-69\SECT-03.13.DOC 9/24/02
3.13 Noise<br />
Table 3.13-6<br />
South Carlsbad South Receiver Site – Noise Measurements (1)<br />
Location<br />
SCS-A. At fence/top of bluff, just north<br />
of northernmost camp site (central part of<br />
fill area). Full view of surf to north and<br />
south.<br />
Measured<br />
Noise Level<br />
dBA, L eq<br />
SCS-B. On stairs above lifeguard tower<br />
#9 (south part of fill area). In line with<br />
adjacent camp sites. Full view of surf to<br />
north and south. 63<br />
65<br />
Comment<br />
Traffic noise from Carlsbad Blvd. is<br />
heard throughout campground along<br />
with surf noise. Peak noise from<br />
motorcycles, heavy trucks and buses<br />
accelerating from traffic light.<br />
Similar to SCS-A, but further from<br />
signal.<br />
(1) Measurement intervals of 1-10 minutes, July 29, 1999 between 7:00 and 8:00 a.m.<br />
Batiquitos<br />
Sensitive Receptors<br />
The proposed receiver site would be located south of Batiquitos Lagoon, with the northern part in<br />
Carlsbad, and the southern part in Leucadia (City of Encinitas). The northern part includes Ponto<br />
<strong>Beach</strong>, a popular recreation area. There are no sensitive noise receptors near the northern or central<br />
part of the receiver site. The closest receptors are residences on the bluffs approximately 60 to 80<br />
feet above. The east sides of these homes face Parliament Road. There is a restaurant, with access<br />
from Coast Highway, overlooking Ponto <strong>Beach</strong>.<br />
Noise Levels<br />
No measurements were taken at the Batiquitos receiver site because noise levels at the homes above<br />
the south end of the site would be anticipated to be similar to those at the Leucadia site. Those noise<br />
levels range from 63 to 66 dBA, L eq .<br />
Leucadia<br />
Sensitive Receptors<br />
<strong>Regional</strong> <strong>Beach</strong> <strong>Sand</strong> <strong>Project</strong> <strong>EIR</strong>/<strong>EA</strong> Page 3.13-13<br />
99-69\SECT-03.13.DOC 9/24/02
3.13 Noise<br />
The proposed receiver site would be located approximately 0.5 miles south of the Batiquitos receiver<br />
site, between Grandview Street and Jasper Street in Leucadia (City of Encinitas). Sensitive receptors<br />
include homes on the bluffs approximately 60 to 80 feet above the beach. The east sides of these<br />
homes face Neptune Avenue.<br />
Noise Levels<br />
Table 3.13-7 shows the measured noise levels near the homes above the beach. Noise levels were<br />
measured at nighttime without other noise sources, and the noise levels of 65-66 dBA L eq may be<br />
considered typical for nighttime ambient noise at these bluff residences.<br />
Table 3.13-7<br />
Leucadia Receiver Site – Noise Measurements (1)<br />
Location<br />
Measured<br />
Noise Level<br />
dBA, L eq<br />
LEU-A. On Grandview beach access<br />
stairs, 20-30' west of homes on bluff to<br />
south (north end of fill area). Full view of<br />
surf to north and south. 66<br />
LEU-B. At northwest corner of Beacon’s<br />
<strong>Beach</strong> parking lot (south central part of fill<br />
area). Even with porch of 1 st house to the<br />
north; windows of the 2 nd . Approx 100<br />
degree exposure. 63<br />
LEU-C. On Beacon’s <strong>Beach</strong> access stairs,<br />
even with homes on bluff to south (south<br />
central part of fill area). Full view of surf<br />
to north and south. 65<br />
Comment<br />
High tide. Range 64-69 dBA; highs<br />
at crashing waves. Noise from<br />
youths playing on beach below.<br />
Range 58-66 dBA. Noise less than<br />
positions A and C because of less<br />
exposure.<br />
Range 60-69 dBA.<br />
(1) Measurement intervals of 3-5 minutes, August 22, 1999 between 8:00 and 9:00 p.m.<br />
Moonlight <strong>Beach</strong><br />
Sensitive Receptors<br />
Page 3.13-14<br />
<strong>Regional</strong> <strong>Beach</strong> <strong>Sand</strong> <strong>Project</strong> <strong>EIR</strong>/<strong>EA</strong><br />
99-69\SECT-03.13.DOC 9/24/02
3.13 Noise<br />
The proposed receiver site would extend from A Street to D Street in the city of Encinitas. The<br />
Moonlight <strong>Beach</strong> recreation area and parking lot are east of the central part of the site. Sensitive<br />
noise receptors include single and multi-family residences that are adjacent to the beach at the north<br />
end. The east sides of these homes face 5 th Street. The southernmost house is nominally at beach<br />
level, with a porch adjacent to the receiver site. There is rip-rap protection approximately 10 feet<br />
high and 8 feet deep at these houses. At the south end of the fill area, there is a day use park on a<br />
bluff approximately 20 feet above the beach, and residences to the east of the park, on the east side of<br />
Moonlight Lane.<br />
Noise Levels<br />
Table 3.13-8 shows the measured noise levels near the receptors north and south of the beach. Noise<br />
levels were measured in early morning without other noise sources. Nighttime noise levels at the<br />
homes close to the beach are estimated at 67-68 dBA.<br />
Table 3.13-8<br />
Moonlight <strong>Beach</strong> Receiver Site – Noise Measurements (1)<br />
Location<br />
Measured<br />
Noise Level<br />
dBA, L eq<br />
MOO-A. West end of beach opposite the<br />
foot of A Street (north end of fill area).<br />
Top of berm. 20' south of first house. 90<br />
degree view of surf to south. View to<br />
north blocked by house. 65<br />
MOO-B. Moonlight overlook on bluff<br />
(south end of fill area). Nearly full<br />
exposure. 65<br />
MOO-C. East side of Moonlight Lane, at<br />
residential building; east of MOO-B 54<br />
MOO-D. On D Street stairs, even with<br />
home on bluff to north (south of fill area).<br />
Approx. 40 feet above beach. Full view<br />
of surf to north and south. 66<br />
Comment<br />
Range 62-67 dBA. Would be louder<br />
with a full exposure.<br />
Range 62-68 dBA.<br />
Bluff shields noise from surf below.<br />
Range 64-68 dBA.<br />
(1) Measurement intervals of 6-12 minutes, August 5, 1999 between 6:00 and 7:30 a.m.<br />
<strong>Regional</strong> <strong>Beach</strong> <strong>Sand</strong> <strong>Project</strong> <strong>EIR</strong>/<strong>EA</strong> Page 3.13-15<br />
99-69\SECT-03.13.DOC 9/24/02
3.13 Noise<br />
Cardiff<br />
Sensitive Receptors<br />
The proposed receiver site would be parallel to Coast Highway and the San Elijo Lagoon. Three<br />
restaurants are built adjacent to the beach just north of the receiver site. The east side (front) of the<br />
restaurants faces Coast Highway. Two restaurants have outdoor dining areas facing the ocean. The<br />
rear of the restaurants are 10 to 15 feet above the beach and are protected somewhat by heavy rock<br />
riprap. The nearest residential receptors are east of Coast Highway and the railroad, more than 1,000<br />
feet from a visible part of the site.<br />
Page 3.13-16<br />
<strong>Regional</strong> <strong>Beach</strong> <strong>Sand</strong> <strong>Project</strong> <strong>EIR</strong>/<strong>EA</strong><br />
99-69\SECT-03.13.DOC 9/24/02
3.13 Noise<br />
Noise Levels<br />
Table 3.13-9 shows the measured noise levels at the rear of one of the restaurants. Noise levels were<br />
measured in late morning, and would be typical during restaurant use hours for surf and highway<br />
noise.<br />
Table 3.13-9<br />
Cardiff Receiver Site – Noise Measurements (1)<br />
Location<br />
Measured<br />
Noise<br />
Level<br />
dBA, L eq<br />
CAR-A. West end of parking lot on south side of<br />
the Chart House (center of fill area). Top of<br />
riprap. Full view of surf. 68<br />
CAR-B. Just inside outdoor dining area. Barrier<br />
(transparent on upper part) between tables and<br />
ocean, but open on the bottom. Building and end<br />
panel provide some shielding from highway<br />
noise. Nearly full exposure. 64<br />
CAR-C. One table north of CAR-B 64<br />
Comment<br />
Includes highway noise and<br />
voices of restaurant staff;<br />
restaurant not open.<br />
(1) Measurement intervals of approx. 5 minutes, September 27, 1999 between 10:00 and 10:30<br />
a.m.<br />
Solana <strong>Beach</strong><br />
Sensitive Receptors<br />
The proposed receiver site would extend south from west end of Plaza Street (the western extension<br />
of Loma Santa Fe Drive) to a point approximately 900 feet south of Dahlia Drive. Sensitive<br />
receptors include single- and multi-family residences on the bluffs approximately 60 feet above the<br />
beach. The east sides of these buildings face Helix Avenue and South Sierra Avenue.<br />
<strong>Regional</strong> <strong>Beach</strong> <strong>Sand</strong> <strong>Project</strong> <strong>EIR</strong>/<strong>EA</strong> Page 3.13-17<br />
99-69\SECT-03.13.DOC 9/24/02
3.13 Noise<br />
No measurements were taken at the Solana <strong>Beach</strong> receiver site because of lack of access; however,<br />
noise levels at the homes on the bluffs above the beach would be similar to those at the Leucadia site<br />
which range from 63 to 66 dBA L eq .<br />
Page 3.13-18<br />
<strong>Regional</strong> <strong>Beach</strong> <strong>Sand</strong> <strong>Project</strong> <strong>EIR</strong>/<strong>EA</strong><br />
99-69\SECT-03.13.DOC 9/24/02
3.13 Noise<br />
Del Mar<br />
Sensitive Receptors<br />
The proposed receiver site is bounded on the east by a short concrete sea wall. The fill area would<br />
extend from north of 27 th Street (south of the San Dieguito River mouth) to south of 17 th Street, near<br />
Powerhouse Park. Sensitive noise receptors include single and multi-family residences that are<br />
immediately east of the sea wall from the north end of the site to just north of 17 th Street. The rear<br />
of the homes are typically two to four feet above the level of the beach. The beach is relatively deep,<br />
on the order of 200 feet from sea wall to surf line. The east sides of the homes face Ocean Front<br />
Street.<br />
At 17 th Street, there are motels and restaurants. Powerhouse Park, a popular recreation area, is south<br />
of 17 th Street. During July and August, there are concerts at Powerhouse Park on alternate Tuesday<br />
evenings. The railroad track is adjacent to the southeast side of Powerhouse Park.<br />
Noise Levels<br />
Table 3.13-10 shows the measured noise levels in the Del Mar receiver site area. From this data, it<br />
may be assumed that noise levels of 59-61 dBA would be typical at the homes and other sensitive<br />
receptors adjacent to the sea wall during periods when there is little or no activity on the beach.<br />
Noise levels would be greater during periods of greater activity on the beach, principally from voices.<br />
Near the southern end of the site, additional noise would come from trains on the railroad tracks east<br />
of Powerhouse Park, and from recreational activities in the park.<br />
Torrey Pines<br />
Sensitive Receptors<br />
The proposed receiver site is located south of the mouth of Peñasquitos Creek, in the area where<br />
North Torrey Pines Road transitions from being adjacent to the beach to an inland route. The area is<br />
part of the Torrey Pines State Reserve. The nearest residential receptors are approximately 2,000<br />
feet northeast of the receiver site, and are separated from the receiver site by North Torrey Pines<br />
Road, the railroad, and Carmel Valley Road.<br />
<strong>Regional</strong> <strong>Beach</strong> <strong>Sand</strong> <strong>Project</strong> <strong>EIR</strong>/<strong>EA</strong> Page 3.13-19<br />
99-69\SECT-03.13.DOC 9/24/02
3.13 Noise<br />
Table 3.13-10<br />
Del Mar Receiver Site – Noise Measurements (1)<br />
Location<br />
Measured<br />
Noise Level<br />
dBA, L eq<br />
DM-A. West end of 29 th Street (north of<br />
fill area), at sea wall, at same distance<br />
from surf line as adjacent homes. Full<br />
view of surf to north and south. 61<br />
DM-B. West end of 18 th Street (south part<br />
of fill area), at sea wall, at same distance<br />
from surf line as adjacent homes. Full<br />
view of surf to north and south. 59<br />
Comment<br />
No other notable noise sources.<br />
Some fishing and running activities<br />
on beach, with no noise measurable<br />
above the surf background.<br />
No other notable noise sources.<br />
Some fishing and running activities<br />
on beach, with no noise measurable<br />
above the surf background.<br />
(1) Measurement intervals of 10-17 minutes, July 26, 1999 between 6:00 and 6:30 a.m.<br />
Noise Levels<br />
No noise levels were measured at this receiver site. There are no adjacent receptors so noise<br />
measurements at this location would not be reflective of any experienced noise levels.<br />
Mission <strong>Beach</strong><br />
Sensitive Receptors<br />
The proposed receiver site is bounded on the east by a short concrete sea wall. The site would<br />
extend from north of Ostend Court, on the north, to Santa Barbara Place, on the south. East of the<br />
sea wall is Ocean Front Walk (also called The Boardwalk), a concrete walk approximately eight feet<br />
wide, that is used extensively by pedestrians, at various speeds. Sensitive noise receptors include<br />
single and multi-family residences that are east of the sea wall, with setbacks on the order of 10 to 25<br />
feet. Sensitive receptors also include the people who use Ocean Front Walk.<br />
Noise Levels<br />
Table 3.13-11 shows the measured noise levels in the Mission <strong>Beach</strong> receiver site area. From this<br />
data, it may be assumed that noise levels of 65 dBA would be typical at Ocean Front Walk, and 63 to<br />
64 dBA at the homes east of Ocean Front Walk during periods when there is little or no activity on<br />
Page 3.13-20<br />
<strong>Regional</strong> <strong>Beach</strong> <strong>Sand</strong> <strong>Project</strong> <strong>EIR</strong>/<strong>EA</strong><br />
99-69\SECT-03.13.DOC 9/24/02
3.13 Noise<br />
the beach. Noise levels would be greater during periods of greater activity on the beach, principally<br />
from voices.<br />
Table 3.13-11<br />
Mission <strong>Beach</strong> Receiver Site – Noise Measurements (1)<br />
Location<br />
MB-A. West end of Nahant Court<br />
(north central part of fill area), at sea<br />
wall. Full view of surf to north and<br />
south.<br />
MB-B. West end of Ormond Court<br />
(north of fill area), at sea wall. Full<br />
view of surf to north and south.<br />
MC-C. West end of Kennebeck Court<br />
at Sea Wall (south central part of fill<br />
area). Full view of surf to north and<br />
south.<br />
Measured<br />
Noise<br />
Level<br />
dBA, L eq<br />
Comment<br />
66 Machinery working beach 700-900 feet to<br />
the north; backup alarms spike meter to<br />
68. One commercial airplane flyover at<br />
70.<br />
Not<br />
applicable<br />
Purpose of measurement was to sample<br />
equipment noise during beach sand<br />
maintenance operations. Case 621 Wheel<br />
Loader with rakes and Case 621B with<br />
bucket. Working noise levels 68-71 dB at<br />
75-100 feet from sea wall. Surf noise<br />
only, est. at 61-65 dB.<br />
65 Most of period included drone of boat<br />
engine approx. 1/4 mile offshore.<br />
(1) Measurement intervals of 10-17 minutes, July 27, 1999 between 7:00 and 8:00 a.m.<br />
Imperial <strong>Beach</strong><br />
Sensitive Receptors<br />
The proposed receiver site is bounded on the east mostly by a rip-rap slope on the order of 10 feet<br />
deep. The fill area would extend from north of Imperial <strong>Beach</strong> Boulevard to approximately 1,000<br />
feet south of Encanto Avenue, on the south. Sensitive noise receptors include single and<br />
multi-family residences that are east of the beach and rip-rap slope, with setbacks on the order of 5 to<br />
10 feet. The Naval Auxiliary Landing Field, Imperial <strong>Beach</strong>, is located 3/4 mile east of the southern<br />
portion of the fill site.<br />
<strong>Regional</strong> <strong>Beach</strong> <strong>Sand</strong> <strong>Project</strong> <strong>EIR</strong>/<strong>EA</strong> Page 3.13-21<br />
99-69\SECT-03.13.DOC 9/24/02
3.13 Noise<br />
Noise Levels<br />
Table 3.13-12 shows the measured noise levels in the Imperial <strong>Beach</strong> receiver site area. From this<br />
data, it may be assumed that noise levels of 65-67 dBA would be typical at the homes closest to the<br />
beach during periods when there is little or no activity on the beach. Noise levels may be at the<br />
higher end of the range at the northen and southern portions of the site than at the central portion<br />
because the surf line is closer to the homes. Homes south of Descanso Avenue are subject to<br />
helicopter noise from Naval Auxiliary Landing Field, Imperial <strong>Beach</strong>.<br />
Page 3.13-22<br />
<strong>Regional</strong> <strong>Beach</strong> <strong>Sand</strong> <strong>Project</strong> <strong>EIR</strong>/<strong>EA</strong><br />
99-69\SECT-03.13.DOC 9/24/02
3.13 Noise<br />
Table 3.13-12<br />
Imperial <strong>Beach</strong> Receiver Site – Noise Measurements (1)<br />
Location<br />
Measured<br />
Noise<br />
Level<br />
dBA, L eq<br />
IB-A. West end of Cortez Ave. (central<br />
part of fill area), on rip-rap. Full view of<br />
surf to north and south. 72<br />
IB-B. Same location as IB-A, but at rear<br />
wall of residence. 67<br />
IB-C. West end of Elkwood Ave. (north<br />
of fill area), even with rear windows of<br />
residences on either side. Level here,<br />
with no rip-rap. Full view of surf to<br />
north and south.<br />
IB-D. Near location IB-C<br />
IB-E. West end of Imperial <strong>Beach</strong> Blvd,<br />
even with rear walls of adjacent<br />
residences. Ful view of surf. 65<br />
IB-F. West end of empty lot between<br />
Descanso and Encanto Aves. Behind riprap,<br />
and even with windows of residence<br />
to the south. 63<br />
IB-G. West end of Encanto Ave., even<br />
with rear walls of adjacent homes. Full<br />
view of surf. 63<br />
67<br />
Comment<br />
Some noise from refuse truck and auto<br />
horns on Seacoast Drive.<br />
Purpose of measurement was to sample<br />
equipment noise during beach sand<br />
maintenance operations. Case 621B<br />
Wheel Loader with bucket. Working<br />
noise levels 68-72 dBA at 50-100 feet<br />
measurement point, with machine<br />
working perpendicular to surf line.<br />
Background surf noise estimated at 67<br />
dBA. A pass parallel to surf at 100 feet<br />
from SLM was 72 dBA.<br />
No beach equipment operating.<br />
Supports background estimate.<br />
One helicopter flyover at 67 dBA.<br />
Includes noise from helicopters and<br />
motorcycle.<br />
(1) Measurement intervals of 3-10 minutes, July 27, 1999 between 10:00 a.m. and 12:00 noon.<br />
<strong>Regional</strong> <strong>Beach</strong> <strong>Sand</strong> <strong>Project</strong> <strong>EIR</strong>/<strong>EA</strong> Page 3.13-23<br />
99-69\SECT-03.13.DOC 9/24/02
3.13 Noise<br />
This page intentionally left blank.<br />
Page 3.13-24<br />
<strong>Regional</strong> <strong>Beach</strong> <strong>Sand</strong> <strong>Project</strong> <strong>EIR</strong>/<strong>EA</strong><br />
99-69\SECT-03.13.DOC 9/24/02
Receiver Site<br />
South Oceanside<br />
Jurisdicti<br />
on<br />
City of<br />
Oceanside<br />
Table 3.13-2<br />
Summary of Applicable Construction Noise Standards<br />
Construction Hours Prohibited<br />
6:00 p.m.-7:00 a.m. weekdays; weekends; Federal holidays O1<br />
North Carlsbad Carlsbad After sunset any day; before 7:00 a.m. weekdays; before 8:00 a.m.<br />
Saturday; Sundays; seven holidays<br />
S. Carlsbad N.<br />
S .Carlsbad S.<br />
Batiquitos<br />
Leucadia<br />
Moonlight<br />
Cardiff<br />
Solana <strong>Beach</strong><br />
California<br />
State<br />
Parks<br />
Solana<br />
<strong>Beach</strong><br />
None<br />
7:00 p.m.-7:00 a.m. weekdays; 7:00 p.m.-8:00 a.m. Saturday;<br />
Sundays; nine holidays SB1<br />
Del Mar Del Mar 7:00 p.m.-7:00 a.m. weekdays; 7:00 p.m.-9:00 a.m. Saturday;<br />
Sundays; City holidays DM1<br />
Torrey Pines<br />
Mission <strong>Beach</strong><br />
California<br />
State<br />
Parks<br />
Construction Noise Limits<br />
75dBA L eq<br />
None<br />
75 dBA L eq (8) at residential<br />
properties<br />
75 dBA L eq at residential<br />
properties<br />
The Torrey Pines conveyance plan includes use of Del Mar’s beach for pipeline conveyance of<br />
sand and a booster pump would be necessary. The use of the City of Del Mar’s beach for this<br />
purpose may necessitate conformance with the City of Del Mar noise ordinance even though the<br />
Torrey Pines receiver site is within State Park’s jurisdiction.<br />
San Diego 7:00 p.m.-7:00 a.m. Monday-Saturday; Sundays; City holidays<br />
except Columbus Day and Washington’s Birthday SD1<br />
75 dBA L eq (12) at residential<br />
properties<br />
Imperial <strong>Beach</strong> Imperial 10:00 p.m.-7:00 a.m. IB1 75 dBA<br />
<strong>Beach</strong><br />
O1 - Applies to grading; Grading Ordinance Section 515. City Engineer may permit operations during specific hours if not<br />
detrimental to health, safety or welfare of residents.<br />
SB1 - Municipal Code Section 7.34, Noise Abatement And Control, Section 7.34.100. Variance procedures in Section 7.34.240-
400<br />
DM1 - Municipal Code Section 9.20.050. Exemption provisions for emergency work or government preempted activities.<br />
SD1 - Municipal Code Section 59.5.0404; the Section also allows exception by permit of the Noise Abatement and Control<br />
Administrator.<br />
IB1 - Municipal Code Section 9.32.020H. Section 9.32.060 allows exemption by permit of the City Manager.
4.0 Environmental Consequences<br />
CHAPTER 4.0<br />
ENVIRONMENTAL CONSEQUENCES<br />
According to federal and state regulations, a finding of whether a proposed action significantly affects the<br />
quality of the human environment is determined by considering the context in which it will occur and the<br />
intensity of the action (40 C.F.R. § 1508.27; CEQA Guidelines § 15126.2[a]). Consistent with these<br />
regulations and guidelines, the impact analyses contained in this chapter follow a step-by-step format where<br />
each potential impact within an issue area is addressed separately. For each impact, there is a separate<br />
subsection on significance thresholds and criteria. The significance threshold is a set of criteria used to<br />
judge whether a given consequence of a specific project alternative is significant. The impact analysis<br />
presentation is organized by alternative. Following the analysis, the level of significance is identified. An<br />
impact is deemed to be either not significant, adverse but not significant, or significant. In the latter<br />
category, impacts may be mitigable (i.e., measures are available to reduce the impact to below a level of<br />
significance), or unmitigable (i.e., the impact cannot be reduced to below a level of significance by mitigation<br />
measures, although mitigation may be proposed to lessen the intensity of the impact). For this project,<br />
several measures have been incorporated into project design as described in Sections 2.4 and 2.5.<br />
As described in Chapter 2.0 (Description of the Proposed Action and Alternatives), the following three<br />
alternatives are considered in detail in this section:<br />
• Alternative 1: Replenishment of 12 receiver sites using approximately 2 million cy of dredged sediment<br />
from six borrow sites. There would be two possible construction variations: (a) would occur on a 24-<br />
hour, 7-day per week schedule and (b) would occur with restrictions on construction times and days<br />
consistent with local noise ordinances, where applicable.<br />
• Alternative 2: Replenishment of nine receiver sites using approximately 2 million cy of dredged<br />
sediment from six borrow sites. There would be two possible construction variations: (a) would occur<br />
on a 24-hour, 7-day per week schedule and (b) would occur with restrictions on construction times<br />
and days consistent with local noise ordinances, where applicable.<br />
• No Action Alternative: No beach replenishment or dredging activities would be implemented.<br />
Detailed analyses of coastal geomorphology and biological resources are contained in technical appendices<br />
C and D, respectively (bound separately). The appendices reflect studies of various alternatives that are<br />
R<br />
R<br />
<strong>Regional</strong> <strong>Beach</strong> <strong>Sand</strong> <strong>Project</strong> <strong>EIR</strong>/<strong>EA</strong> Page 4.1-1<br />
99-69\SANDAG <strong>EIR</strong><strong>EA</strong> 4.1 to 4.13.wpd 7/17/00
4.1 Geology and Soils<br />
not analyzed in detail in this <strong>EIR</strong>/<strong>EA</strong> because they were rejected prior to the distribution of the <strong>EIR</strong>/<strong>EA</strong> but<br />
after some technical analyses were completed. To help the reader understand the relationship between<br />
alternatives in the <strong>EIR</strong>/<strong>EA</strong> and various technical appendices a matrix is provided below.<br />
R<br />
R<br />
R<br />
Appendix C<br />
Appendix D<br />
R<br />
Alternative Characteristics <strong>EIR</strong>/<strong>EA</strong> (Geomorphology)<br />
(Marine Biology)<br />
R<br />
3 million cy at 13 sites N/A<br />
Alternative 1<br />
3 MCY Alternative R<br />
2 million cy at 12 sites Alternative 1<br />
Alternative 2<br />
2 MCY Alternative R<br />
2 million cy at 11 sites N/A<br />
Alternative 3 2 MCY Alternative Modified R<br />
2 million cy at 9 sites Alternative 2<br />
Alternative 4<br />
R<br />
N/A (1)<br />
(1)<br />
Since this alternative was generated by combining sand quantities and configurations of some receiver sites R<br />
within the 3 million cy alternative and some from the 2 million cy alternative which were analyzed in the marine R<br />
biology technical report, the combined analysis is provided only in the <strong>EIR</strong>/<strong>EA</strong>.<br />
R<br />
Page 4.1-2<br />
<strong>Regional</strong> <strong>Beach</strong> <strong>Sand</strong> <strong>Project</strong> <strong>EIR</strong>/<strong>EA</strong><br />
99-69\SANDAG <strong>EIR</strong><strong>EA</strong> 4.1 to 4.13.wpd 7/17/00
4.1 Geology and Soils<br />
4.1 GEOLOGY AND SOILS<br />
The following analysis of coastal geology and littoral processes related to beach replenishment is based on<br />
studies performed in Shoreline Morphology Study, San Diego <strong>Regional</strong> <strong>Beach</strong> <strong>Sand</strong> <strong>Project</strong> (Moffatt<br />
& Nichol 2000a) and the previous <strong>EA</strong>s prepared by the U.S. Navy (Department of the Navy 1997a,<br />
1997b).<br />
4.1.1 Significance Criteria<br />
The protection of unique geologic coastal features and the minimization of erosion are considered when<br />
evaluating potential impacts of a proposed action. For this analysis, an impact to geologic resources would<br />
be significant if it would:<br />
• destroy, permanently cover, or modify any unique geologic or physical features;<br />
• increase erosion of soils, either on or offsite; or<br />
• cause erosion of beach sand.<br />
<strong>Beach</strong> replenishment using dredged sediments is generally considered beneficial in areas where beach<br />
erosion is a problem as material provides recreational beach area and shoreline protection, including<br />
stabilizing fragile bluffs. However, placement of the sand can also create a temporary change in the<br />
shoreline. Over a period of time, the sand would be moved and redistributed from the placement location<br />
alongshore and cross-shore through natural littoral transport creating an equilibrium beach profile. The<br />
equilibrium beach profile would have a similar shape as the pre-fill beach profiles, but may extend further<br />
seaward. The longshore spread of the beach fill would temporarily widen the beaches upcoast and<br />
downcoast of the receiver sites, until natural littoral transport redistributed the sand through the littoral cell.<br />
<strong>Regional</strong> <strong>Beach</strong> <strong>Sand</strong> <strong>Project</strong> <strong>EIR</strong>/<strong>EA</strong> Page 4.1-3<br />
99-69\SANDAG <strong>EIR</strong><strong>EA</strong> 4.1 to 4.13.wpd 7/17/00
4.1 Geology and Soils<br />
4.1.2 Alternative 1<br />
Impacts of Alternative 1a<br />
Receiver Sites<br />
For all receiver sites, sediment deposited on the beach would be spread alongshore and cross-shore<br />
through natural littoral transport. Shoreline positions were modeled based on the anticipated sediment<br />
movement and were predicted for periods of 1, 2, 3, 4, and 5 years after sand placement.<br />
Borrow materials would be similar to the receiving beach because the fill material has been the subject of<br />
grain-size analyses and was found to be compatible with the receiver sites’ existing sediments (Sea<br />
Surveyor 1999). Temporary changes in the functional properties (e.g., permeability) of the existing beach<br />
are expected until the replenishment material is mixed with existing sand and dispersed by coastal<br />
processes, and no long-term impact would occur in terms of grain-size distribution.<br />
For all receiver sites, seismic activity associated with the Rose Canyon fault and other nearby faults may<br />
lead to liquefaction, ground failure, sand volcanoes, and seaward slumping of beach material. The impact<br />
of beach replenishment would be of no greater significance than conditions expected in the absence of<br />
additional sediment.<br />
Coastal Geology<br />
Similar coastal geology processes for each receiver site would occur regardless of the season the<br />
replenishment activity occurs. After placement of sand onto a receiver site, the existing beach area north<br />
and south of the receiver site would widen as a result of longshore and cross-shore spreading. The results<br />
of the modeling indicating the length of time that the beach fill would return to its pre-fill condition are shown<br />
in Table 4.1-1. Seasonal cross-shore movement would transport the fill material offshore in the winter and<br />
back onto the beach in the summer, repeating this trend over subsequent seasons. Also, the longshore<br />
transport changes direction seasonally, moving the sand north in the summer and south in the winter.<br />
Seasonal loss of the beach would occur from natural littoral processes. Placing the material on the beach<br />
in spring instead of summer would increase the chance that more material would be available on the shore<br />
during the peak recreation period. Placing it in late summer/fall increases the opportunity for winter storms<br />
to remove the material prior to heavy summer usage the following year.<br />
R<br />
R<br />
R<br />
R<br />
R<br />
R<br />
Page 4.1-4<br />
<strong>Regional</strong> <strong>Beach</strong> <strong>Sand</strong> <strong>Project</strong> <strong>EIR</strong>/<strong>EA</strong><br />
99-69\SANDAG <strong>EIR</strong><strong>EA</strong> 4.1 to 4.13.wpd 7/17/00
4.1 Geology and Soils<br />
Table 4.1-1<br />
Predicted Retention Time of <strong>Beach</strong> Fill at Each Receiver Site<br />
Receiver Site<br />
Approximate Time for Receiver Site to<br />
Return to Pre-Fill Condition (years)<br />
South Oceanside 1 to 2<br />
North Carlsbad (1) 4 to 5<br />
South Carlsbad North 1<br />
South Carlsbad South (2) 1<br />
Batiquitos (1) 1 to 2<br />
Leucadia (1) 1 to 2<br />
Moonlight <strong>Beach</strong> (1) 1 to 2<br />
Cardiff 4 to 5<br />
Solana <strong>Beach</strong> 1 to 2<br />
Del Mar 1 to 2<br />
Torrey Pines 1 to 2<br />
Mission <strong>Beach</strong> 2 to 3<br />
Imperial <strong>Beach</strong> 2 to 3<br />
(1)<br />
Alternative 1 only.<br />
(2)<br />
Alternative 2 only.<br />
(3)<br />
Under average wave conditions<br />
Source: Moffatt & Nichol 2000a<br />
Near each receiver site, sediment would move from the beach to an offshore sandbar during the winter<br />
season. Sediment movement after beach fill placement would follow natural seasonal and littoral trends.<br />
A minor increase in the average sand thickness at the nearshore bar is anticipated for each receiver site.<br />
Table 4.1-2 provides a summary of the location of the existing seasonal offshore sand bar and the increase<br />
in depth of that bar resulting from the project at the end of the first year. The increased depth is provided<br />
assuming average wave conditions and for average and maximum depths of cover. Appendix F contains<br />
a more detailed table with estimates for the full five year modeling. Generally, project related sediment at<br />
the bar is measurable only off North Carlsbad and Cardiff for that entire time period. No long-term<br />
significant impacts to coastal geology are anticipated due to sediment transport or the increased sediment<br />
thickness at the existing, seasonal offshore bar.<br />
R<br />
R<br />
R<br />
R<br />
R<br />
<strong>Regional</strong> <strong>Beach</strong> <strong>Sand</strong> <strong>Project</strong> <strong>EIR</strong>/<strong>EA</strong> Page 4.1-5<br />
99-69\SANDAG <strong>EIR</strong><strong>EA</strong> 4.1 to 4.13.wpd 7/17/00
4.1 Geology and Soils<br />
Table 4.1-2<br />
Estimated Location of Offshore <strong>Sand</strong> Bar and <strong>Project</strong>-Related Increase in <strong>Sand</strong> Bar Depth<br />
R<br />
R<br />
Receiver Site<br />
Offshore Bar<br />
Range (feet from<br />
back of beach)<br />
Feet Above Average Historical Bar (1)<br />
Alternative 1 Alternative 2<br />
Average Maximum Average Maximum<br />
South Oceanside 600 to 1,750 0.3 0.6 0.3 0.6<br />
North Carlsbad 350 to 1,700 0.7 1.4 0.7 1.4<br />
South Carlsbad<br />
(North and South)<br />
500 to 1,700 0.1 0.2 0.4 0.8<br />
Batiquitos 400 to 2,000 0.4 0.9 0.6 1.3<br />
Moonlight <strong>Beach</strong> 600 to 1,800 0.4 0.8 Not measurable Not measurable<br />
Cardiff 700 to 1,800 0.1 0.3 Not measurable Not measurable<br />
Solana <strong>Beach</strong> 500 to 1,800 Not measurable Not<br />
measurable<br />
Not measurable<br />
Not measurable<br />
Del Mar 700 to 1,450 0.5 0.9 0.5 0.9<br />
Torrey Pines 500 to 1,500 0.4 0.8 0.4 0.8<br />
(1)<br />
At end of year 1, assuming average wave conditions<br />
Note: Values are not included for Leucadia because historic profiles do not exist to calculate the sandbar. Values<br />
are not provided for Mission and Imperial beaches because numerical modeling was not performed due to<br />
simplified coastline conditions and lack of sensitive resources.<br />
R<br />
R<br />
R<br />
Littoral Processes<br />
For each receiver site situated within the South Oceanside Littoral Cell (i.e, South Oceanside to Torrey<br />
Pines) sediment placed onshore would be distributed along the coast by the net littoral sand transport to<br />
the south at approximately 100,000 to 250,000 cy per year. This downcoast net transport movement is<br />
the difference between upcoast and downcoast sand transport rates, which are predominantly driven by<br />
the angle of wave approach to shore.<br />
South Oceanside. Alternative 1 involves placing approximately 380,000 cy of dredged sediment at the<br />
South Oceanside receiver site. Previous placement of fills on the beaches in Oceanside have not shown<br />
dramatic changes in the littoral process. Since 1955, over 13 million cy of fill have been placed onshore<br />
or nearshore in Oceanside by the USACOE and the City with no adverse geologic or soils impacts<br />
recorded. These past beach fills quantities have been in the same range as the proposed fill. Therefore,<br />
based on past fill events, placement of sediment onshore at the South Oceanside receiver site would not<br />
be anticipated to impact the littoral transport process.<br />
Page 4.1-6<br />
<strong>Regional</strong> <strong>Beach</strong> <strong>Sand</strong> <strong>Project</strong> <strong>EIR</strong>/<strong>EA</strong><br />
99-69\SANDAG <strong>EIR</strong><strong>EA</strong> 4.1 to 4.13.wpd 7/17/00
4.1 Geology and Soils<br />
North Carlsbad. Alternative 1 would involve placing approximately 240,000 cy of dredged sediment at<br />
the proposed North Carlsbad receiver site. Previous placement of fills on beaches in Carlsbad have not<br />
shown dramatic changes in the littoral process. Over 12 million cy of fill has been placed onshore in<br />
Carlsbad as a result of maintenance dredging of Agua Hedionda Lagoon and enhancement of Batiquitos<br />
Lagoon. No adverse impacts to littoral transport have occurred. These past beach fills were in the same<br />
range or less than the proposed fill quantity. Therefore, based on past fill events, placement of sediment<br />
onshore at North Carlsbad would not change the littoral transport process.<br />
Remaining Oceanside Littoral Cell Receiver Sites. No significant impacts would occur to the littoral<br />
process. For the other receiver sites in the Oceanside Littoral Cell, (i.e, South Carlsbad North, Batiquitos,<br />
Leucadia, Moonlight <strong>Beach</strong>, Cardiff, Solana <strong>Beach</strong>, Del Mar, and Torrey Pines). The existing offshore<br />
sand berm would increase some amount after the first year, but that thickness would be less than a foot and<br />
typically in the range of less than one-half foot. Only minor increases in thickness to the respective offshore<br />
bars is anticipated. No significant impacts are anticipated. This alternative would also serve to temporarily<br />
stabilize fragile bluffs near the South Carlsbad North, Batiquitos, Leucadia, Moonlight <strong>Beach</strong>, and Torrey<br />
Pines receiver sites.<br />
Mission <strong>Beach</strong>. Alternative 1 would involve placing approximately 100,000 cy of dredged sediment at<br />
the Mission <strong>Beach</strong> receiver site. The length of the coast affected by the beach fill increases each year. The<br />
initial beach fill length is approximately 1,590 feet. At post-project equilibrium, the length of beach<br />
widening increases to 15,000 feet, and at the end of the first year, the length of coast affected increases to<br />
20,000 feet based on an analytical modeling method. The fill remains perceptive along approximately<br />
20,000 feet through the fifth year. Approximately 16 percent of the post-construction beach width at the<br />
project’s centerline remains after five years (Moffatt & Nichol 2000a). No significant impacts are<br />
anticipated due to the replenishment action proposed under Alternative 1.<br />
The net longshore sediment transport rate at Mission <strong>Beach</strong> is predominantly to the south. The beach fill<br />
will likely spread in both directions, but primarily to the south toward Mission Jetty. A sand berm would<br />
be expected to form in the shallow subtidal areas as a result of sediment transported into these zones, but<br />
no significant increases are expected as a result of implementation of Alternative 1.<br />
Imperial <strong>Beach</strong>. Alternative 1 would place approximately 120,000 cy of dredged sediment at the Imperial<br />
<strong>Beach</strong> receiver site. The length of the shoreline that is affected by the beach fill increases each year. The<br />
<strong>Regional</strong> <strong>Beach</strong> <strong>Sand</strong> <strong>Project</strong> <strong>EIR</strong>/<strong>EA</strong> Page 4.1-7<br />
99-69\SANDAG <strong>EIR</strong><strong>EA</strong> 4.1 to 4.13.wpd 7/17/00
4.1 Geology and Soils<br />
initial beach fill length is approximately 2,310 feet, and at post-project equilibrium the length of beach<br />
widening increases to 15,000 feet. At the end of the first year the length of coast affected increases to<br />
20,000 feet based on an analytical modeling method and remains constant to the fifth year (Moffatt &<br />
Nichol 2000a). No significant increases are expected as a result of implementing this alternative.<br />
The net longshore sediment transport at this receiver site is to the north, away from the river inlet. This<br />
effect is caused by wave refraction over the relic Tijuana River delta offshore and to the north of the river<br />
and south of Imperial <strong>Beach</strong>, driving wave-induced currents northward at the project site (USACOE<br />
1991). Based on wave refraction effects occurring at Imperial <strong>Beach</strong> and longshore transport estimates<br />
provided by the USACOE (1991), the fill will likely disperse northward. A sand berm would be expected<br />
to form in the shallow subtidal areas as a result of sediment transported into these zones, but no significant<br />
increases are expected as a result of implementation of Alternative 1.<br />
Borrow Sites<br />
For all six offshore borrow sites, dredge site deepening would alter local bathymetry; however, the<br />
proposed dredging action has been determined to be in accordance with recommendations based on<br />
geotechnical investigations of the proposed borrow sites and accepted engineering practice.<br />
As described in Section 1.1, the proposed dredging activities would take sand from borrow sites outside<br />
(deeper than) the depth of closure and place sand within the three littoral cells. New sand would be<br />
introduced to the system. As such, the borrow sites would not intercept sand that typically rebuild beaches<br />
in the summer. No significant geology and soils impacts are anticipated to occur to the dredge borrow sites<br />
with implementation of Alternative 1.<br />
Mitigation Measures for Alternative 1a<br />
As no significant impacts have been identified, no mitigation measures would be necessary.<br />
Impacts/Mitigation Measures for Alternative 1b<br />
This alternative would not change the impact analysis described above for Alternative 1a. The only<br />
differences under this alternative with respect to geology and soils is that less sand would be dredged and<br />
Page 4.1-8<br />
<strong>Regional</strong> <strong>Beach</strong> <strong>Sand</strong> <strong>Project</strong> <strong>EIR</strong>/<strong>EA</strong><br />
99-69\SANDAG <strong>EIR</strong><strong>EA</strong> 4.1 to 4.13.wpd 7/17/00
4.1 Geology and Soils<br />
placed on the receiver sites and the predicted years in Table 4.1-1 and thickness at the sandbars would<br />
be less. Impacts would continue to be less than significant and no mitigation measures would be necessary.<br />
4.1.3 Alternative 2<br />
Impacts of Alternative 2a<br />
Receiver Sites<br />
Under this alternative, nine receiver sites would receive sand (refer to Table 2-1). At these receiver sites,<br />
impacts would be similar for those described for Alternative 1. Table 4.1-1 shows time estimates for the<br />
erosion of sand replenishment fills. Even though different amounts of sand are proposed for some receiver<br />
sites under Alternative 2, the information given in the table for the receiver sites proposed under Alternative<br />
2 is not expected to substantially differ. The increases in the offshore sand bars for the receiver sites where<br />
more sand is proposed than under Alternative 1 (i.e., South Oceanside, South Carlsbad North, South<br />
Carlsbad South, Torrey Pines, Mission <strong>Beach</strong>, and Imperial <strong>Beach</strong>) would be short-term and would not<br />
cause significant geology and soils impacts. Accordingly, impacts would not be significant. The receiver<br />
sites where no sand is proposed (i.e., North Carlsbad, Batiquitos, Leucadia, and Moonlight <strong>Beach</strong>) would<br />
not benefit from wider beaches under Alternative 2. Additionally, the benefit of added shoreline protection<br />
to fragile bluffs at the Batiquitos, Leucadia, and Moonlight <strong>Beach</strong> receiver sites would not be realized under<br />
this alternative. <strong>Sand</strong> placement in spring would have the same benefits as described for Alternative 1.<br />
R<br />
Borrow Sites<br />
Similar impacts to geology and soils would occur under this alternative. The same borrow sites would be<br />
used under this alternative but at different quantities. The proposed dredging activities would take sand<br />
from borrow sites outside (deeper than) the depth of closure and place sand within the three littoral cells.<br />
New sand would be introduced to the system. As such, the borrow sites would not intercept sand that<br />
typically moves back and forth to the beach; they would not detract from normal littoral processes which<br />
typically rebuild beaches in the summer. No significant geology and soils impacts are anticipated to occur<br />
to the dredge borrow sites with implementation of Alternative 2.<br />
<strong>Regional</strong> <strong>Beach</strong> <strong>Sand</strong> <strong>Project</strong> <strong>EIR</strong>/<strong>EA</strong> Page 4.1-9<br />
99-69\SANDAG <strong>EIR</strong><strong>EA</strong> 4.1 to 4.13.wpd 7/17/00
4.1 Geology and Soils<br />
Mitigation Measures for Alternative 2a<br />
No significant impacts have been identified, and no mitigation measures are necessary for Alternative 2.<br />
Impacts/Mitigation Measures for Alternative 2b<br />
This alternative would not change the impact analysis described above for Alternative 2a. The only<br />
differences under this alternative with respect to geology and soils is that less sand would be dredged and<br />
placed on the receiver sites. Impacts would be less than significant and no mitigation measures would be<br />
necessary.<br />
4.1.4 No Action Alternative<br />
Under the No Action Alternative, no fill would be dredged from the offshore borrow sites, and no sand<br />
would be placed on the proposed receiver beaches. The receiver beaches would continue to erode<br />
undeterred.<br />
Page 4.1-10<br />
<strong>Regional</strong> <strong>Beach</strong> <strong>Sand</strong> <strong>Project</strong> <strong>EIR</strong>/<strong>EA</strong><br />
99-69\SANDAG <strong>EIR</strong><strong>EA</strong> 4.1 to 4.13.wpd 7/17/00
4.2 Coastal Wetlands<br />
4.2 COASTAL WETLANDS<br />
As noted in Sections 2.5 and 3.2, coastal lagoons in the northern part of the San Diego region vary from<br />
having inlets that are always open, intermittently open, or closed to tidal flows. Inlet closures may vary<br />
seasonally from days to several months depending upon lagoon. The main ramification of inlet closure is<br />
a reduction in water quality, which in turn may degrade habitat quality and result in loss of populations. Inlet<br />
closure also can also promote the development of nuisance species such as mosquitos. The degree of<br />
change to habitats and populations is directly related to the duration of inlet closure. Ongoing maintenance<br />
programs are implemented at most of the region’s local lagoons (refer to Table 2-7). Excess sediment is<br />
dredged at some lagoons and at others the inlet is mechanically opened by bulldozer. The evaluation of<br />
potential effects to coastal wetlands is summarized below from the biological resources technical report<br />
(Appendix D) as well as previous Navy analysis (1997a, 1997b).<br />
4.2.1 Impact Significance Criteria<br />
Potential impacts to coastal wetlands would be significant if:<br />
• substantial sediment accretion substantially increased the rate of closure above historical occurrences<br />
at any lagoon, river, or creek mouth; or<br />
• increased turbidity resulted in adverse affects to the water quality in the water body.<br />
4.2.2 Alternative 1<br />
This analysis focuses on the coastal lagoons and river mouths along the coast that would be located near<br />
the potential receiver sites and is organized by water body, in geographic order from north to south.<br />
Nearby receiver sites are identified as appropriate.<br />
No direct impacts to coastal lagoons would occur from the project, which proposes to dredge sands from<br />
offshore borrow sites and replenish beaches away from lagoon mouths. Any potential impacts would be<br />
related to indirect sedimentation or turbidity. The season of construction, late summer or spring, would not<br />
change the conclusions in the analysis.<br />
R<br />
R<br />
<strong>Regional</strong> <strong>Beach</strong> <strong>Sand</strong> <strong>Project</strong> <strong>EIR</strong>/<strong>EA</strong> Page 4.2-1<br />
99-69\SANDAG <strong>EIR</strong><strong>EA</strong> 4.1 to 4.13.wpd 7/17/00
4.2 Coastal Wetlands<br />
Impacts of Alternative 1a<br />
San Luis Rey River<br />
No impacts to the San Luis Rey River are anticipated from the project. Sedimentation from the South<br />
Oceanside beach fill would not be expected to reach the river, which is located over one mile to the north.<br />
Similarly, turbidity plumes would not be expected to travel that far north of the site.<br />
Loma Alta Creek<br />
The Loma Alta Creek is a seasonal freshwater creek that discharges into the ocean near the south end of<br />
the proposed South Oceanside receiver site. The City of Oceanside constructs a sand berm in front of the<br />
creek to prevent flow between Memorial Day and Labor Day, and during the wet season excavates a<br />
temporary channel to facilitate stream flows to the ocean for flood control. Short-term (less than five years)<br />
beach widening on the order of 50 to 100 feet is predicted in the vicinity of the creek (Appendix C). This<br />
may require the winter discharge channel to be lengthened, but because the City currently maintains the<br />
creek outlet on an as-needed basis, no significant impact to the creek habitat would occur. Turbidity<br />
generated from receiver site construction would not be expected to impact the water quality of the creek.<br />
Buena Vista Lagoon<br />
Buena Vista Lagoon is closed to tidal influence by a man-made weir. The City of Oceanside maintains a<br />
discharge outlet to the ocean for flood control. For similar reasons as Loma Alta Creek, no significant<br />
impacts to water or habitat quality would occur.<br />
Agua Hedionda Lagoon<br />
The ocean inlet to Agua Hedionda Lagoon is located over 0.5 mile south of the proposed North Carlsbad<br />
receiver site and over one mile north of the proposed South Carlsbad North receiver site. Turbidity plumes<br />
from receiver site construction are anticipated to be localized, less than 100 to 1,400 feet downcurrent,<br />
under typical current speeds, and would not extend very far into the lagoon even under maximum current<br />
speeds. If project-related turbidity did enter the lagoon, particulate concentrations would be low given the<br />
distance to the lagoon and rapid settling rate of the predominantly sandy material. There would be no<br />
significant impacts to the lagoon due to turbidity.<br />
Page 4.2-2<br />
<strong>Regional</strong> <strong>Beach</strong> <strong>Sand</strong> <strong>Project</strong> <strong>EIR</strong>/<strong>EA</strong><br />
99-69\SANDAG <strong>EIR</strong><strong>EA</strong> 4.1 to 4.13.wpd 7/17/00
4.2 Coastal Wetlands<br />
Modeling predicts a potential worst-case increased sediment flow of approximately 62,500 cy from this<br />
alternative over five years. Much of this material would be present in the first few years and taper off at<br />
the end of five years. The lagoon inlet is continuously open as a result of jetties and routine maintenance<br />
dredging. Sedimentation from littoral transport occurs within the lagoon under existing conditions,<br />
therefore, the proposed project would incrementally increase the volume of sedimentation over that which<br />
occurs naturally. Since maintenance dredge volumes historically have ranged from about 100,000 to<br />
465,000 cy per year, the project’s anticipated volume would not be anticipated to increase the frequency<br />
of planned maintenance activities. It may slightly increase the cost of the dredging effort. As described in<br />
Section 2.5, a lagoon monitoring program would be implemented as part of this project. The monitoring<br />
program is designed to mimic the on-going monitoring as required under the Navy’s USACOE permit.<br />
SANDAG would provide for mitigation of any increased rates of sand accumulation determined to occur<br />
as a result of the project above and beyond existing conditions, as determined by the USACOE and in<br />
consultation with the resource agencies. Mitigation would consist of removing accumulated sediment<br />
attributable to the replenishment project, by funding additional dredge activity during normal maintenance.<br />
Previous monitoring in the lagoon indicates that fewer species and abundance of invertebrates occur in<br />
areas that receive substantial sedimentation in comparison to less disturbed areas. The distribution of<br />
eelgrass also is affected by sedimentation. Maintenance dredging routinely occurs in the outer basin where<br />
benthic invertebrates within the maintenance dredge footprint recolonize rapidly. Maintenance dredging<br />
occurs within set limits designed to avoid significant impacts to eelgrass. Impacts to lagoon fauna and<br />
sensitive vegetated habitats as a result of sedimentation is not expected to be substantially different from<br />
that which occurs in the lagoon under existing conditions. Therefore, project related impacts to lagoon<br />
habitat quality would not be significant.<br />
Batiquitos Lagoon<br />
The ocean inlet at Batiquitos Lagoon remains open continuously due to jetties and maintenance dredging.<br />
The ocean inlet is located about 1,000 feet north of the Batiquitos receiver site. No significant impact<br />
would occur to water quality within the lagoon during construction given that turbidity plumes are<br />
anticipated to be less than 100 to 500 feet downcurrent. Even under maximum current speeds they would<br />
not extend far into the lagoon. If project related turbidity did enter the lagoon, particulate concentrations<br />
would be low given the distance to the lagoon and rapid settling rate of the predominantly sandy material.<br />
<strong>Regional</strong> <strong>Beach</strong> <strong>Sand</strong> <strong>Project</strong> <strong>EIR</strong>/<strong>EA</strong> Page 4.2-3<br />
99-69\SANDAG <strong>EIR</strong><strong>EA</strong> 4.1 to 4.13.wpd 7/17/00
4.2 Coastal Wetlands<br />
Sediment transport modeling results indicated no substantial beach widening at the lagoon entrance nor<br />
substantial sedimentation offshore the inlet (Appendix C). Therefore, potential lagoon closure due to<br />
sandbar formation would not be expected. However, the lagoon would experience sedimentation from the<br />
project. The maximum predicted sediment increase over existing sediment patterns under this alternative<br />
is 27,000 cy of sedimentation over five years, with over half that in the first year after construction. <strong>Project</strong>related<br />
sedimentation either would increase the volume dredged during the existing maintenance dredging<br />
interval, or the dredging may have to be done more frequently. This impact is of most concern within the<br />
first year after construction of the receiver site. As described for the Agua Hedionda Lagoon, the lagoon<br />
monitoring program in Section 2.5 would be implemented to determine how much sand accumulation is<br />
associated with the project and then mitigation would be provided as necessary.<br />
Similar to the discussion for Agua Hedionda Lagoon, lagoon habitat quality is currently affected by<br />
sedimentation and the necessary corrective action of maintenance dredging. Benthic organisms that inhabit<br />
these shallow waters are quick to recolonize. No significant impacts would result from this action.<br />
San Elijo Lagoon<br />
The ocean inlet at San Elijo Lagoon is subject to frequent closure due to its relatively small tidal prism and<br />
frequent blockage by cobbles. Mechanical excavations have resulted in periodic opening of the lagoon for<br />
short durations spanning few to several months. The ocean inlet is located about 1,000 feet north of the<br />
proposed Cardiff receiver site. As with the other lagoons, localized turbidity would not result in significant<br />
impacts to lagoon water quality.<br />
Sediment transport modeling results indicate beach widening at the lagoon entrance and offshore the inlet<br />
(Appendix C). Therefore, there is the potential for the project to contribute to a more frequent closure of<br />
the lagoon after mechanical opening. San Elijo Lagoon currently is mechanically opened three times a year.<br />
It is possible, in the worst-case, that the project may necessitate one additional inlet opening in a year<br />
(approximately 5,000 cy). As part of the project, SANDAG will implement a four-year monitoring<br />
program to determine any increased rates of sedimentation to the lagoon and will provide mitigation for<br />
mouth closures attributable the project (Section 2.5). This measure will ensure no significant impact from<br />
the project on routine inlet maintenance activities.<br />
Page 4.2-4<br />
<strong>Regional</strong> <strong>Beach</strong> <strong>Sand</strong> <strong>Project</strong> <strong>EIR</strong>/<strong>EA</strong><br />
99-69\SANDAG <strong>EIR</strong><strong>EA</strong> 4.1 to 4.13.wpd 7/17/00
4.2 Coastal Wetlands<br />
San Dieguito Lagoon<br />
San Dieguito Lagoon has an intermittently open inlet that is frequently subject to closure under existing<br />
conditions. Historically, the inlet has been opened on an as-needed basis for flood control. Restoration<br />
of the lagoon is planned for the fall of 2001 that includes maintaining an open tidal inlet.<br />
The inlet is located about 1,500 feet north of the proposed Del Mar receiver site and over 2,000 ft south<br />
of the proposed Solana <strong>Beach</strong> receiver site. No significant impact to water quality within the lagoon would<br />
occur during receiver site construction given localized turbidity plumes.<br />
Sediment transport modeling results predicted only short-term (about one year) substantial beach widening<br />
near the lagoon entrance (Alternative C). However, under restored conditions, the project could result in<br />
sedimentation within the lagoon. The maximum predicted project-related sediment increase rate for this<br />
alternative is 12,500 cy over the four years post-restoration, with much of that in the first year. As part of<br />
the project, SANDAG will implement a monitoring program to determine any increased rates of<br />
sedimentation to the lagoon, or mouth closures, and will provide for mitigation of increased rates of<br />
accumulation of sand or mouth closures attributable to the project (Section 2.5). This measure will ensure<br />
no significant impact from the project on routine inlet maintenance.<br />
Los Peñasquitos Lagoon<br />
The ocean inlet at Los Peñasquitos Lagoon is mechanically opened each year (typically two to three times)<br />
to sustain prolonged periods of tidal flushing. The ocean inlet is located about 750 feet north of the<br />
proposed Torrey Pines receiver site. As with the other lagoons, no significant impact to water quality within<br />
the lagoon would occur from localized turbidity plumes.<br />
Sediment transport modeling results indicate only short-term beach widening and limited sedimentation<br />
offshore the inlet. The lagoon could experience some sedimentation from the project, and it is possible,<br />
in the worst-case, that the action may necessitate one additional inlet opening in a year (approximately<br />
5,000 cy). The monitoring program described in Section 2.5 and above would be suitable to verify no<br />
significant impacts.<br />
<strong>Regional</strong> <strong>Beach</strong> <strong>Sand</strong> <strong>Project</strong> <strong>EIR</strong>/<strong>EA</strong> Page 4.2-5<br />
99-69\SANDAG <strong>EIR</strong><strong>EA</strong> 4.1 to 4.13.wpd 7/17/00
4.2 Coastal Wetlands<br />
Mission Bay<br />
The proposed Mission Bay receiver site is almost one mile north of the entrance to Mission Bay. Turbidity<br />
plumes would be very localized (approximately 80 feet) and even under maximum current conditions the<br />
jetty would prevent significant impacts to the bay. Sediment transport from the receiver site is predicted<br />
to migrate south toward the jetty at Mission Bay; however, the jetty is so long that sediment from this action<br />
would not likely be transported into the bay. Some small, incremental quantity of sand may move through<br />
the jetty and contribute to the existing shoals in the channel, but the project’s contribution would not be<br />
measurable given other sand movement.<br />
Tijuana Estuary<br />
No significant impacts to water or habitat quality within the Tijuana Estuary are anticipated from the project.<br />
The receiver site is more than one mile north of the inlet and turbidity plumes are calculated approximately<br />
135 to 80 feet. Turbidity plumes would not be expected to enter the wetland, even under maximum current<br />
speeds. Migration of sand towards the Tijuana River mouth would be unlikely given the net longshore<br />
sediment transport rate being to the north. Therefore, no significant impacts to the estuary are anticipated<br />
from project-related sedimentation.<br />
Mitigation Measures for Alternative 1a<br />
Turbidity would not significantly affect any coastal lagoons so no mitigation would be necessary. As<br />
described in Section 2.5, a monitoring program would be implemented at several lagoons to verify whether<br />
or not project-related sediment would result in increased rates of sand accumulation or mouth closures<br />
attributable to the project. SANDAG has committed to fund the removal of sediment or inlet openings as<br />
determined to be appropriate by the USACOE and in consultation with the resource agencies. No further<br />
measures would be necessary.<br />
Impacts/Mitigation Measures for Alternative 1b<br />
Under this alternative, construction would occur over a longer time period, but less sand would be placed<br />
most receiver sites. Potential effects at individual lagoons would not be any greater under this construction<br />
variation. The monitoring program in Section 2.5 would be implemented to either verify no significant<br />
impact or institute mitigation as necessary.<br />
Page 4.2-6<br />
<strong>Regional</strong> <strong>Beach</strong> <strong>Sand</strong> <strong>Project</strong> <strong>EIR</strong>/<strong>EA</strong><br />
99-69\SANDAG <strong>EIR</strong><strong>EA</strong> 4.1 to 4.13.wpd 7/17/00
4.2 Coastal Wetlands<br />
4.2.3 Alternative 2<br />
Impacts of Alternative 2a<br />
San Luis Rey River<br />
Sediment from the beach fill at South Oceanside is predicted to migrate northward to the vicinity of the San<br />
Luis Rey River mouth after sand placement and potentially widen the onshore beach at this location<br />
approximately one year after sand placement. Because the existing berm that crosses most of the San Luis<br />
Rey River mouth is already at a higher elevation than the predicted contribution from the proposed action,<br />
the migrating sand would not be anticipated to impact the overall configuration of the river mouth.<br />
Stormwater discharge from the river is constrained by flow through eight, 36-inch-diameter pipes that pass<br />
under Pacific Street. The initial small increase in beach width at this location would be reduced over time<br />
as the sand moves back along the shoreline in a southerly direction. The predicted temporary increase in<br />
sediment at this location would not be anticipated to constrain river runoff, therefore, additional maintenance<br />
is not required with implementation of the proposed project.<br />
The City of Oceanside Streets Division is responsible for maintaining the Pacific Street stormwater outlet<br />
on an as-needed basis for flood control. Therefore, no adverse impacts would be anticipated upon<br />
implementation of the proposed action.<br />
Loma Alta Creek/Buena Vista Lagoon<br />
The impacts to these locations would be no worse than under Alternative 1. Impacts would be less than<br />
significant.<br />
Agua Hedionda Lagoon<br />
Under this alternative, there would be no sand placement at the North Carlsbad receiver site but the South<br />
Carlsbad sites (North and South) would receive over twice the volume as under Alternative 1. Given this<br />
configuration, the sand placement would be about one mile from the lagoon mouth. Turbidity plumes would<br />
be localized and there would be no significant impacts. Modeling predicts a potential worst-case increased<br />
sediment flow of approximately 57,500 cy of sediment over five years, of which most would occur in the<br />
<strong>Regional</strong> <strong>Beach</strong> <strong>Sand</strong> <strong>Project</strong> <strong>EIR</strong>/<strong>EA</strong> Page 4.2-7<br />
99-69\SANDAG <strong>EIR</strong><strong>EA</strong> 4.1 to 4.13.wpd 7/17/00
4.2 Coastal Wetlands<br />
first year. As described under Alternative 1, maintenance dredging has historically ranged from about<br />
100,000 to 465,000 cy per year. The volume of sediment possibly entering the lagoon from the project<br />
would not increase the number of times it would be dredged, but may increase the total amount to be<br />
dredged. As described under Alternative 1, SANDAG has committed to a lagoon monitoring program<br />
to determine the amount of sedimentation above natural conditions. Any project-related accumulated<br />
sediment would be removed. Dredging of accumulated sediment, if necessary, would not result in any<br />
significant impacts to lagoon habitat.<br />
Batiquitos Lagoon<br />
Under this alternative, three sites in Encinitas would not receive sand, but sites to the north of the lagoon<br />
would receive more sand than under Alternative 1. It is estimated that possible sediment accumulation from<br />
the project would be on the same order of magnitude as Alternative 1 (27,000 cy over five years), but<br />
likely less. The model predicts well over one half of that volume in the first year after replenishment. As<br />
with Agua Hedionda lagoon, the volume of sediment possibly entering the lagoon from the project may<br />
increase the total amount to be dredged. As described under Alternative 1, SANDAG has committed to<br />
a lagoon monitoring program based on the Navy’s on-going effort to determine the amount of sedimentation<br />
above natural conditions. Any project-related accumulated sediment would be removed. Dredging of<br />
accumulated sediment, if necessary, would not result in any significant impacts to lagoon habitat.<br />
San Elijo Lagoon/San Dieguito Lagoon/Los Peñasquitos Lagoon<br />
The volume of sand at receiver sites Cardiff, Solana <strong>Beach</strong>, and Del Mar would be the same as under<br />
Alternative 1, but would be slightly greater for the Torrey Pines site. The predicted impacts to these three<br />
lagoons would be similar under this alternative; specifically, up to one more inlet opening over the course<br />
of a year during the monitoring period (maximum 5,000 cy). The monitoring program described in Section<br />
2.5 and above would be suitable to verify no significant impacts.<br />
Mission Bay/Tijuana Estuary<br />
Under this alternative, both receiver sites would receive 50 percent more material than under Alternative<br />
1. However, in both cases the increased sediment would not affect significantly coastal bodies. In the case<br />
of Mission Bay, any substantial sediment movement to the south would be prevented from the reaching the<br />
entrance to the bay by a jetty. In Imperial <strong>Beach</strong>, the northward current would prevent sediment from<br />
Page 4.2-8<br />
<strong>Regional</strong> <strong>Beach</strong> <strong>Sand</strong> <strong>Project</strong> <strong>EIR</strong>/<strong>EA</strong><br />
99-69\SANDAG <strong>EIR</strong><strong>EA</strong> 4.1 to 4.13.wpd 7/17/00
4.2 Coastal Wetlands<br />
affecting the estuary. Turbidity plumes would also be very localized. There would be no significant impacts<br />
to either water body.<br />
Mitigation Measures for Alternative 2a<br />
Turbidity would significantly affect any coastal lagoons so no mitigation would be necessary. As described<br />
in Section 2.5, a monitoring program would be implemented to verify whether or not project-related<br />
sediment would result in increased rates of sand accumulation or mouth closures attributable to the project.<br />
SANDAG has committed to fund the removal of sediment or inlet openings as determined to be<br />
appropriate by the USACOE and in consultation with the resource agencies. No further measures would<br />
be necessary.<br />
Impacts/Mitigation Measures for Alternative 2b<br />
Under this alternative, construction would occur over a longer time period but less sand would be placed<br />
most receiver sites. Potential effects at individual lagoons would not be any greater under this construction<br />
variation. The monitoring program in Section 2.5 would be implemented to either verify no significant<br />
impact or institute mitigation as necessary.<br />
4.2.4 No Action Alternative<br />
Under this alternative, there would be no potential for change to lagoon sedimentation volumes or lagoon<br />
mouth closures above the current patterns.<br />
<strong>Regional</strong> <strong>Beach</strong> <strong>Sand</strong> <strong>Project</strong> <strong>EIR</strong>/<strong>EA</strong> Page 4.2-9<br />
99-69\SANDAG <strong>EIR</strong><strong>EA</strong> 4.1 to 4.13.wpd 7/17/00
4.3 Water Resources<br />
4.3 WATER RESOURCES<br />
Potential impacts to water resources (e.g., chemical properties and turbidity) would primarily occur at the<br />
borrow sites as result of dredging, and in nearshore waters adjacent to the beach receiver sites as a result<br />
of their construction. There is also the potential for impacts to occur due to accidental leaks from landbased<br />
construction equipment, although these scenarios are more speculative. The complete technical<br />
analysis is contained in Appendix D. This section summarizes the potential impacts in terms of receiver<br />
sites, borrow sites, and other construction issues. The season of construction, late summer or spring, would<br />
not affect the conclusions in this analysis.<br />
R<br />
R<br />
4.3.1 Significance Criteria<br />
Impacts to water resources are considered in terms of water quality and associated regulations. An impact<br />
to water resources would be significant if it would:<br />
• adversely affect water quality in the long-term;<br />
• endanger public health by creating or worsening health hazards conditions;<br />
• threaten or damage unique biological characteristics, primarily due to turbidity; or<br />
• violate the water quality criteria in the California Ocean Plan.<br />
4.3.2 Alternative 1<br />
Impacts of Alternative 1a<br />
Receiver Sites<br />
None of the fill material would exceed the criteria established in the California Ocean Plan for bacteria,<br />
dissolved oxygen, contaminants and sulfides, nutrients or pH and there would be no impacts associated with<br />
placement of fill material at the receiver sites. The main issue of concern in the nearshore environment is<br />
turbidity. The analysis of turbidity at receiver sites focuses on groups of sites that would receive material<br />
from the same borrow site since turbidity would be a direct consequence of the material type to be placed<br />
on the shore. Generally, fine grain silt/clay materials, of less than 63 µm in size, would remain suspended<br />
<strong>Regional</strong> <strong>Beach</strong> <strong>Sand</strong> <strong>Project</strong> <strong>EIR</strong>/<strong>EA</strong> Page 4.3-1<br />
99-69\SANDAG <strong>EIR</strong><strong>EA</strong> 4.1 to 4.13.wpd 7/17/00
4.3 Water Resources<br />
longer, while larger sand materials (greater than 63 µm in size) would settle very quickly to the bottom in<br />
minutes.<br />
Increased turbidity would occur along the shore as a result of sediment disposal. The action involves<br />
pumping a sand/sea water mixture directly onto the beach from a dredged location offshore. Increased<br />
turbidity would be caused by return water from pumping operations, as suspended sediments in the<br />
sand/sea mixture would flow into the surf zone subsequent to pumping. As described in Section 2.4,<br />
training dikes would be constructed during discharge to direct the flow of discharge and slow the water flow<br />
thereby allowing more sediment to settle onto the beach instead of washing back into the surf zone. This<br />
would reduce the potential water quality impact. The calculated turbidity plumes in this document are<br />
worst-case and do not factor in the reductions associated with training dikes or sand placement onshore<br />
instead of nearshore.<br />
R<br />
R<br />
R<br />
Sediment pumping operations would vary depending on the type of dredge. With the cutterhead dredge,<br />
turbidity would be nearly continuous. Turbidity would occur in pulses with the hopper dredge and the time<br />
intervals between pump cycles would provide for greater settling of the dredged sands.<br />
As described in Appendix D, there have been several nearby beach replenishment projects in the recent<br />
past where turbidity plumes have been monitored. The extent and concentration of turbidity plumes are<br />
directly proportional to the silt/clay content of the replenishment materials. When the silt/sand content<br />
ranges from 2.5 to 10.5 percent, visible turbidity plumes range from approximately 50 to 2,000 feet down<br />
current. However, the concentration of particulates generally was not noticeable above background levels<br />
in the surf zone when the silt/clay content was less than 5 percent. The offshore extent of turbidity is much<br />
more restricted but dependent upon wave conditions, rip currents, and speed and direction of longshore<br />
currents. Measured turbidity plumes did not extend much beyond the surf zone when the silt/clay<br />
concentrations were very low, and generally were limited to water depths less than 10 feet above MLLW<br />
when silt/clay concentrations were 10 percent or less. Even when the silt/clay content ranged from 11 to<br />
18 percent, turbidity plumes were not measured beyond 1,000 feet offshore (about -15 to -20 feet<br />
MLLW).<br />
South Oceanside and North Carlsbad<br />
These two sites would be replenished from SO-9. The silt/clay content from this borrow site ranged from<br />
2 to 11 percent with an average of 8 percent. Native sediments in the Oceanside Cell average 3 percent<br />
Page 4.3-2<br />
<strong>Regional</strong> <strong>Beach</strong> <strong>Sand</strong> <strong>Project</strong> <strong>EIR</strong>/<strong>EA</strong><br />
99-69\SANDAG <strong>EIR</strong><strong>EA</strong> 4.1 to 4.13.wpd 7/17/00
4.3 Water Resources<br />
above MSL and 12 percent below MSL. Turbidity plumes are calculated to be localized within about 100<br />
to 300 feet of the discharge point, and may be visible up to 3,000 feet down current under maximum<br />
current speeds when the finest grain sands are pumped. Both are consistent with the measurements from<br />
Agua Hedionda Lagoon and Oceanside Harbor beach replenishment projects with sediments less than 10<br />
percent silt/clays. Construction would occur at the South Oceanside receiver sites for approximately 30<br />
days and at the North Carlsbad receiver site for 20 days. Depending upon the type of dredge, there may<br />
be continuous turbidity or periodic episodes. However, due to the localized nature of the impact, the grain<br />
size of the material (average 92 percent sand), and the presence of training dikes which would help reduce<br />
turbidity, there would be no significant impacts to water quality at these two receiver sites.<br />
South Carlsbad (North and South), Batiquitos, Leucadia, Moonlight <strong>Beach</strong><br />
All these receiver sites would receive material from the SO-7 borrow site. Percent of fine grain material<br />
(less than 63 µm) would be three percent or less which is equal to the natural condition in the Oceanside<br />
Littoral Cell above MSL. Turbidity plumes are calculated to be localized within 100 feet of the discharge<br />
location, but may extend 1,000 feet down current under maximum current speeds. The average plume<br />
distance, and the conservative maximum plume distance, are both within the range of turbidity plumes<br />
detected during the Agua Hedionda Lagoon replenishment project involving sediments with less than 10<br />
percent silt/clays. Construction at any given receiver site would occur over 10 to 15 days and may be<br />
either relatively continuous or episodic, depending upon the type of dredge. Again, due to the localized<br />
nature of the impact, the grain size of the material (97 percent sand) which is equal to the natural condition,<br />
and the presence of training dikes which would help control and reduce turbidity, there would be no<br />
significant impacts to water quality at these series of receiver sites.<br />
Cardiff<br />
Cardiff would be the only site to receive material from borrow site SO-6. Material from this borrow site<br />
would 97 percent sand, also similar to the existing condition in the Oceanside Littoral Cell above MSL.<br />
Localized turbidity plumes are calculated to be less than 200 feet from the point of discharge, with a<br />
maximum visible plume under the greatest current conditions of 1,500 feet down current. Construction with<br />
training dikes would occur over an estimated 11-day period. As with the other sites, the localized nature<br />
of the short-term impact and the use of training dikes would ensure no significant impact.<br />
<strong>Regional</strong> <strong>Beach</strong> <strong>Sand</strong> <strong>Project</strong> <strong>EIR</strong>/<strong>EA</strong> Page 4.3-3<br />
99-69\SANDAG <strong>EIR</strong><strong>EA</strong> 4.1 to 4.13.wpd 7/17/00
4.3 Water Resources<br />
Solana <strong>Beach</strong>, Del Mar, Torrey Pines<br />
All three receiver sites would utilize material from the SO-5 borrow site. The average silt/clay content of<br />
the sediment layers is 5 percent at this borrow site. Turbidity plumes are calculated to extend about 300<br />
feet from the discharge point on average, but may extend up to 1,500 feet down current under maximum<br />
current speeds. This would be consistent with the range of turbidity plumes detected during the Agua<br />
Hedionda Lagoon replenishment project involving sediments with less than 10 percent silt/clays.<br />
Construction would occur at these three sites for approximately 13, 16 and 20 days, respectively, and<br />
turbidity levels may vary over this time depending upon the type of the dredge. There would be no<br />
significant water quality at these locations given the high sand content (95 percent) and use of training dikes.<br />
Mission <strong>Beach</strong><br />
The sands at MB-1 have an extremely low silt/clay content of 1 percent. Turbidity plumes at this receiver<br />
site are calculated at less than 100 feet on average and less than 350 feet under maximum downcurrent<br />
conditions. Construction may occur over an 11-day period either as a continuous event or periodic,<br />
depending on the dredge type. Given the very high sand content and very localized nature of the effect,<br />
as well as use of training dikes, there would be no significant impacts.<br />
Imperial <strong>Beach</strong><br />
Borrow site SS-1 also has a high sand content of 99 percent and turbidity plumes are estimated to extend<br />
an average of 200 feet but possibly up to 600 feet under maximum current speeds. The duration of this<br />
elevated condition would be on the order of 12 days. Given the very high sand content and very localized<br />
and short-term nature of the effect, as well as use of training dikes, there would be no significant impacts.<br />
Borrow Sites<br />
Dredging at all of the borrow sites was evaluated for potential to exceed the criteria established in the<br />
California Ocean Plan for bacteria, dissolved oxygen, contaminates and sulfides, turbidity, nutrients, and<br />
pH. All of the borrow sites would be of sufficient distance from wastewater outfalls to avoid bacterial<br />
exposure. <strong>Sand</strong>y sediments such as those in the borrow sites would have low organic carbon and<br />
contaminant concentrations, which have the least potential to degrade oxygen concentrations, and they are<br />
located in coastal waters, which remain well oxygenated due to mixing from currents, surge, and tidal<br />
Page 4.3-4<br />
<strong>Regional</strong> <strong>Beach</strong> <strong>Sand</strong> <strong>Project</strong> <strong>EIR</strong>/<strong>EA</strong><br />
99-69\SANDAG <strong>EIR</strong><strong>EA</strong> 4.1 to 4.13.wpd 7/17/00
4.3 Water Resources<br />
movements. Measured contaminant concentrations indicate little potential for biological effects from<br />
contaminant release during sediment resuspension. Dissolved sulfide concentrations were below detection<br />
at all sites and total sulfide concentrations were low in borrow site sediments. Given the predominantly<br />
sandy nature of the borrow site sediments, and the mixing and diluting capacities of the coastal environment,<br />
any increases in nutrients are anticipated to be short-term and not of sufficient concentrations to result in<br />
plankton blooms that could cause red tides. The mixing and diluting capacity of waters at the borrow sites<br />
are considered sufficient to avoid changes in pH as a result of dredging activities. No violation of the<br />
California Ocean Plan objective would occur from dredging any of the borrow sites.<br />
The potential for turbidity impacts associated with dredging at the borrow sites is also addressed in detail<br />
in Appendix D. The California Ocean Plan specifies that discharges shall not result in significant reductions<br />
in natural light at any point outside the initial dilution zone. Water clarity may be determined by numerous<br />
methods including measurement of light transmissivity, irradiance, or secchi disk. Turbidity also may be<br />
determined by collection of water samples and measurement of total suspended solids, chlorophyl<br />
concentrations, and/or national turbidity units (NTU).<br />
The duration and extent of turbidity relates to the concentration and settling rate of the resuspended<br />
material, water depth, turbulence of the water, and current speed. Silts/clays remain in suspension longer<br />
than sands. Turbulence contributes to sediment resuspension. High current speeds will transport turbidity<br />
plumes greater distances than low currents. At the subject borrow sites, suspended sand-sized particles<br />
would tend to settle through the 40-to 80-foot depths of the water column and reach the bottom within<br />
minutes, while finer silt/clay particles could take several hours.<br />
In the open ocean environment of the borrow sites, the extent of the turbidity plume will relate to particle<br />
concentration, size, and settling rate, water depth, current speed and direction, and turbulence. The average<br />
downcurrent turbidity plume distances that may be generated from dredging each borrow site were<br />
estimated based upon the median grain size diameters of the sediment, and three different current speeds,<br />
assuming the utilization of a hopper dredge. (The plume from a cutter dredge would be approximately one<br />
half of those calculated for the hopper dredge.) As shown in Table 4.3-1, the estimated turbidity plume<br />
would range from less than 100 feet to over 500 feet at average current speeds. Visible turbidity plumes<br />
could extend several thousand feet at several of the sites under maximum current conditions, although the<br />
concentration of particulates within the plumes would be highest near the dredge and would decrease with<br />
distance away from the dredge.<br />
<strong>Regional</strong> <strong>Beach</strong> <strong>Sand</strong> <strong>Project</strong> <strong>EIR</strong>/<strong>EA</strong> Page 4.3-5<br />
99-69\SANDAG <strong>EIR</strong><strong>EA</strong> 4.1 to 4.13.wpd 7/17/00
4.3 Water Resources<br />
Table 4.3-1<br />
Estimated Average Turbidity Plumes Resulting from Dredging<br />
(1)<br />
(2)<br />
Borrow Site<br />
Depth (ft)<br />
MLLW<br />
Overall Mean<br />
Grain Size<br />
Diameter<br />
(mm) (1)<br />
Mean Settling<br />
Velocity<br />
(ft/sec)<br />
Estimated Average Downcurrent<br />
Plume Distance (ft) (2) Range<br />
According to Depth and Average<br />
Current Speed<br />
0.2 (0.34)<br />
SO-9 48 to 58 0.16 0.06 272-329<br />
SO-7 50 to 80 0.44 0.18 94-151<br />
SO-6 60 to 80 0.27 0.10 204-272<br />
SO-5 50 to 80 0.15 0.05 340-544<br />
MB-1 55 to 65 0.57 0.26 72-85<br />
SS-1 40 to 53 0.28 0.10 136-180<br />
Overall median of the mean grain size diameters reported for cores (and/or core layers) characterizing the dredge<br />
area.<br />
The estimated plume distances were calculated by the following formula: water depth/particle settling velocity x<br />
current speed (ft/sec).<br />
The duration of turbidity plumes would relate to equipment used and the duration of dredging. Generally,<br />
turbidity associated with the cutterhead dredge is estimated to be less than half that of the hopper dredge<br />
and generally restricted to near the bottom. Because of the continuous operation of the cutterhead dredge,<br />
turbidity would occur for the entire period the dredge is operating. In contrast, the hopper dredge involves<br />
cycles of dredging interspersed with transit time to the mono buoy to pump material onto the beach. The<br />
turbidity plume at the dredging location would be maximum at the surface during dredge or hopper<br />
overflow and dissipate once the hopper dredge moved away. Overflow of the hopper dredge while<br />
underway to the mono buoy location would extend the width of the plume shoreward.<br />
Table 2-2 identifies the various time periods of dredging (including mobilization and demobilization) for each<br />
borrow site. The longest duration would be SO-9 because it has the greatest quantity of material to be<br />
dredged. This site also has a shallow overburden of silt. Therefore, this site represents the greatest<br />
potential for turbidity impacts.<br />
Elevations in turbidity would not result in significant impacts to water quality at SO-9. This conclusion is<br />
based on the relatively localized nature of the expected turbidity plumes for the majority of the dredge<br />
period, and rapid diluting capacity of the open ocean. The larger turbidity plumes associated with use of<br />
a hopper dredge would occur in pulses and not represent a continuous impact at the borrow site, and the<br />
Page 4.3-6<br />
<strong>Regional</strong> <strong>Beach</strong> <strong>Sand</strong> <strong>Project</strong> <strong>EIR</strong>/<strong>EA</strong><br />
99-69\SANDAG <strong>EIR</strong><strong>EA</strong> 4.1 to 4.13.wpd 7/17/00
4.3 Water Resources<br />
continuous turbidity plumes associated with use of a cutterhead dredge would be highly localized. Because<br />
silty sands occur in a shallow and non-uniform overburden at the site, there is the potential for more<br />
extensive turbidity plumes to develop, however, they should be of short duration if they occurred. There<br />
would be no significant turbidity impacts at any other borrow sites.<br />
Water quality monitoring will be required as part of the RWQCB 401 Certification Order which also sets<br />
conditions on proposed operations. If monitoring indicates that RWQCB permit specifications are<br />
exceeded, the dredging operation will be modified/suspended and appropriate measures taken to ensure<br />
compliance. Modification of dredge and/or disposal operations, as necessary, to adhere to the RWQCB<br />
conditions will help ensure no significant impacts to water quality resulting from the alternative.<br />
Combined Turbidity (Borrow and Receiver Sites)<br />
Simultaneous plumes at the borrow site and receiver sites only would be generated if a cutterhead dredge<br />
is used. That dredge involves pumping of sands directly from the borrow site to the receiver site. The<br />
hopper dredge moves between the borrow site and receiver site. Because the borrow sediments are<br />
predominantly sands, turbidity plumes generated at the borrow site with the hopper dredge would be<br />
expected to dissipate during the transit and offloading time required to deliver sands to the receiver site.<br />
The hopper dredge operation involves surface overflows (with suspended particulates) at the borrow site,<br />
therefore, turbidity plumes generated during dredging are greater with this method than with the cutterhead<br />
dredge, which lacks surface overflows. Due to overflow while the hopper dredge is in transit to the<br />
receiver site, there also will be some tailwater discharge behind the vessel that should quickly dissipate.<br />
Because the hopper dredge operation involves these overflows, the sediment conveyed to the receiver site<br />
generally will have less fines than the material conveyed by a cutterhead dredge. The turbidity estimates<br />
of about 1,000 to 3,000 feet identified for receiver sites in prior text represent worst case estimates based<br />
on a maximum current speed, the greater plume generated by the hopper dredge at the borrow site, and<br />
potentially by the cutterhead offshore the receiver site if training dikes were not used and material were<br />
placed directly in the nearshore. Turbidity plumes under more typical current speeds would range from less<br />
than 100 to about 1,000 feet at the borrow site with the hopper dredge and less 500 feet with the<br />
cutterhead dredge. Plumes offshore the receiver sites would be expected to be less than 1,000 ft under<br />
typical current speeds, and training dikes would be used to further control turbidity. Additionally, the<br />
turbidity plume calculations assume placement in the nearshore which would not occur with this project.<br />
All material would be placed on the beach as far landward as possible which would further reduce turbidity.<br />
R<br />
R<br />
R<br />
R<br />
R<br />
R<br />
R<br />
R<br />
R<br />
R<br />
R<br />
R<br />
R<br />
R<br />
R<br />
R<br />
R<br />
R<br />
R<br />
R<br />
R<br />
R<br />
<strong>Regional</strong> <strong>Beach</strong> <strong>Sand</strong> <strong>Project</strong> <strong>EIR</strong>/<strong>EA</strong> Page 4.3-7<br />
99-69\SANDAG <strong>EIR</strong><strong>EA</strong> 4.1 to 4.13.wpd 7/17/00
4.3 Water Resources<br />
Other Construction Issues<br />
Earthmoving equipment and cranes will be used on the beaches to spread the material pumped to the beach<br />
and to place and maintain the discharge pipeline. Vehicle use has some potential for introducing<br />
contaminants to beach fill sediments from minor spills and leaks from the equipment. No significant impacts<br />
are anticipated since no refueling or fuel storage will occur on the beach, and the dredging contractor will<br />
be required to develop a Spill Prevention Control and Counter-Measure Plan (SPCC) prior to initiating<br />
pumping operations. Additional protection will be provided by the contractor using biodegradable (e.g.,<br />
vegetable oil-based) lubricants and hydraulic fluids, and/or electric or natural gas powered equipment,<br />
where practicable.<br />
Mitigation Measures for Alternative 1a<br />
There would be no significant impacts so no mitigation measures would be required. Some monitoring<br />
would be required consistent with the RWQCB permit.<br />
Impacts/Mitigation Measures for Alternative 1b<br />
As shown in Table 2-2, there would be longer construction periods for several receiver and borrow sites<br />
when compared to Alternative 1a. Although the construction period would be longer at these receiver and<br />
borrow sites, the same construction practices (e.g., training dikes) and monitoring would be performed.<br />
Construction would also still be short-term, and no significant impacts to water quality would result with<br />
implementation of this alternative. Some monitoring would be required consistent with the RWQCB permit.<br />
4.3.3 Alternative 2<br />
Impacts of Alternative 2a<br />
Receiver Sites<br />
Construction at receiver sites in South Oceanside, South Carlsbad, Torrey Pines, Mission <strong>Beach</strong>, and<br />
Imperial <strong>Beach</strong> would take incrementally longer under this alternative than Alternative 1 because they would<br />
receive more sand. Still, the impacts would remain localized and training dikes would help reduce turbidity.<br />
No significant impacts to water quality would occur at these receiver sites. Several receiver sites that are<br />
Page 4.3-8<br />
<strong>Regional</strong> <strong>Beach</strong> <strong>Sand</strong> <strong>Project</strong> <strong>EIR</strong>/<strong>EA</strong><br />
99-69\SANDAG <strong>EIR</strong><strong>EA</strong> 4.1 to 4.13.wpd 7/17/00
4.3 Water Resources<br />
slated to receive sand under Alternative 1 are not proposed for sand replenishment under Alternative 2.<br />
As no construction would occur at these sites, even short-term impacts to water quality would not occur.<br />
Borrow Sites<br />
As under Alternative 1, given the predominantly sandy nature of the borrow site sediments, and the mixing<br />
and diluting capacities of the coastal environment, any increases in nutrients are anticipated to be short-term<br />
and not of sufficient concentrations to result in plankton blooms that could cause red tides. The mixing and<br />
diluting capacity of waters at the borrow sites are considered sufficient to avoid changes in pH as a result<br />
of dredging activities. No violation of the California Ocean Plan objective would occur from dredging any<br />
of the borrow sites.<br />
The potential for turbidity impacts associated with dredging at the borrow sites is also addressed in detail<br />
in Appendix D. Modification of dredge and/or disposal operations, as necessary, to adhere to the<br />
RWQCB conditions will help ensure no significant impacts to water quality resulting from the alternative.<br />
Localized increases in turbidity would not result in significant impacts to water quality at any of the borrow<br />
sites. This conclusion is based on the relatively localized nature of the expected turbidity plumes for the<br />
majority of the dredge period, and rapid diluting capacity of the open ocean. The larger turbidity plumes<br />
associated with use of a hopper dredge would occur in pulses and not represent a continuous impact at the<br />
borrow site, and the continuous turbidity plumes associated with use of a cutterhead dredge would be highly<br />
localized. Because silty sands occur in a shallow and non-uniform overburden at the SO-9 site, there is<br />
the potential for more extensive turbidity plumes to develop, however, they should be of short duration if<br />
they occurred.<br />
Water quality monitoring will be required as part of the RWQCB 401 Certification Order which also sets<br />
conditions on proposed operations. If monitoring indicates that suspended particulate concentrations<br />
outside the zone of initial dilution exceeds RWQCB conditions, the dredging operation will be<br />
modified/suspended and appropriate measures taken to ensure compliance.<br />
Mitigation Measures for Alternative 2a<br />
As no significant impacts would occur, no mitigation measures would be necessary. Some monitoring<br />
would be required consistent with the RWQCB permit.<br />
<strong>Regional</strong> <strong>Beach</strong> <strong>Sand</strong> <strong>Project</strong> <strong>EIR</strong>/<strong>EA</strong> Page 4.3-9<br />
99-69\SANDAG <strong>EIR</strong><strong>EA</strong> 4.1 to 4.13.wpd 7/17/00
4.3 Water Resources<br />
Impacts/Mitigation Measures for Alternative 2b<br />
As shown in Table 2-6, there would be longer construction periods for several receiver and borrow sites<br />
when compared to Alternative 2a. Although the construction period would be longer at these receiver and<br />
borrow sites, the same construction practices (e.g., training dikes) and monitoring would be performed.<br />
Construction would also still be short-term, and no significant impacts to water quality would result with<br />
implementation of this alternative. Some monitoring would be required consistent with the RWQCB permit.<br />
4.3.4 No Action Alternative<br />
As no dredging or replenishment activities are proposed under this alternative. No change to water quality<br />
would result, and no mitigation measures would be necessary.<br />
Page 4.3-10<br />
<strong>Regional</strong> <strong>Beach</strong> <strong>Sand</strong> <strong>Project</strong> <strong>EIR</strong>/<strong>EA</strong><br />
99-69\SANDAG <strong>EIR</strong><strong>EA</strong> 4.1 to 4.13.wpd 7/17/00
4.4 Biological Resources<br />
4.4 BIOLOGICAL RESOURCES<br />
Impacts to biological resources can be direct resulting in loss of habitat or individual species, or they can<br />
be indirect resulting in diminished reproduction, impaired foraging and growth, interruption of wildlife<br />
movement, or reduction in habitat quality. Direct impacts to marine biological resources may occur through<br />
burial, removal, or smothering. Indirect impacts may result from decreases in marine water quality<br />
associated with dredging and beach replenishment activities, sediment transport related to movement of<br />
sands from the fill sites, noise, and contaminant releases associated with sediment disturbance, vessel traffic,<br />
and/or construction equipment. Indirect noise impacts to sensitive bird species are addressed in Section<br />
4.13.<br />
Direct impacts would be the same whether the project is constructed in late summer or spring. Indirect<br />
impacts would generally be the same for sedimentation since the analysis considered duration in terms of<br />
a series of seasons, not dependent upon a specific start date. Construction in spring would result in some<br />
activity during the nesting season of the federally listed western snowy plover and California least tern. This<br />
issue is addressed separately in the Final <strong>EIR</strong>/<strong>EA</strong>. Finally, construction in spring may provide benefits to<br />
grunion by establishing sandy beaches where currently there are cobble structures, thereby increasing their<br />
spawning habitat.<br />
R<br />
R<br />
R<br />
R<br />
R<br />
R<br />
R<br />
4.4.1 Significance Criteria<br />
Impacts to marine resources were considered significant if:<br />
• an individual or population of a threatened or endangered species is adversely affected as a result of<br />
the project;<br />
• fisheries protected under Essential Fish Habitat designation are adversely affected; and/or<br />
• long-term adverse impacts from sediment transport would result in the irreversible removal, disturbance<br />
or destruction of sensitive resources. Such sensitive resources are defined to include high relief reefs<br />
and vegetated low relief reefs. Indicator species are feather boa kelp (Egregia menziesii), giant kelp<br />
(Macrocystis pyrifera), surfgrass (Phyllospadix spp.), large sea fans (Muricea spp.), and sea palms<br />
(Eisensia arborea).<br />
<strong>Regional</strong> <strong>Beach</strong> <strong>Sand</strong> <strong>Project</strong> <strong>EIR</strong>/<strong>EA</strong> Page 4.4-1<br />
99-69\SANDAG <strong>EIR</strong><strong>EA</strong> 4.1 to 4.13.wpd 7/17/00
4.4 Biological Resources<br />
4.4.2 Alternative 1<br />
This impact analysis is separated into receiver sites and borrow sites and for each of those locations,<br />
impacts are addressed in terms of direct and indirect. The receiver sites have been designed so that the<br />
sand replenishment footprints would not result in significant direct impacts to biological resources. The<br />
greater potential for significant impacts occurs from the indirect effects of sediment transport where sand<br />
deposition may have long-term effects to sensitive resources.<br />
Impacts of Alternative 1a<br />
Receiver Sites<br />
<strong>Sand</strong> replenishment at the receiver sites would directly impact marine life by burying organisms within the<br />
footprint of the fill. Indirect impacts would occur from turbidity generated during construction of the<br />
receiver sites, migration of sand away from the site via natural transport processes up and down the coast,<br />
mechanical disturbance associated with grading the slope of the fill, and construction noise disturbance.<br />
The complete analysis is contained in Appendix D and summarized below.<br />
Direct Impacts of <strong>Sand</strong> Placement<br />
Construction of the beach receiver sites would result in burial impacts to marine biota. During beach<br />
nourishment, large volumes of sand are placed above and throughout the intertidal zone. The amount of<br />
sand overburden varies in thickness across the footprint of the fill. From the back beach to the top of the<br />
slope, where sand depths would be deeper, all benthic organisms would be smothered. Organisms also<br />
would be buried under decreasing depths of sand towards the toe of the slope and outside edges of the fill.<br />
Past studies of dredge material disposal have demonstrated that some mobile organisms such as clams and<br />
worms are capable of burrowing through deposited materials of one to three feet in thickness. Some<br />
crustaceans such as amphipods and decapods also may escape burial at the leading edge of deposition.<br />
Therefore, not all benthic organisms would be expected to die within the receiver site footprint, particularly<br />
near the edges of the fill.<br />
The loss of benthic organisms within the receiver site footprint is an expected and unavoidable impact<br />
during beach replenishment projects. However, due to the adaptability of organisms within this sandy<br />
Page 4.4-2<br />
<strong>Regional</strong> <strong>Beach</strong> <strong>Sand</strong> <strong>Project</strong> <strong>EIR</strong>/<strong>EA</strong><br />
99-69\SANDAG <strong>EIR</strong><strong>EA</strong> 4.1 to 4.13.wpd 7/17/00
4.4 Biological Resources<br />
habitat, alterations in abundance, diversity, and species composition would be expected to last from a few<br />
weeks to months.<br />
The footprints of the proposed beach receiver sites have been designed to avoid direct burial of sensitive<br />
habitats. There would be no direct impacts to nest locations of western snowy plovers or the California<br />
least tern. <strong>Sand</strong> is the predominant habitat at the proposed receiver sites, although most are characterized<br />
by bands of cobble as well. In some instances, low relief rock and/or small localized reef areas with<br />
coralline turf algae and annual species occur within the footprint of the fill. Due to the widespread<br />
occurrence and rapid recovery rates of these types of organisms, direct impacts to marine life within the<br />
receiver site footprints are expected to be less than significant.<br />
R<br />
R<br />
R<br />
California grunion spawn on sandy beaches in the San Diego region between March and August and have<br />
the potential to be affected by beach replenishment. As described in Section 2.5, SANDAG would<br />
implement a monitoring program during predicted grunion runs to determine if grunion spawning occurs<br />
during construction of the receiver site. If grunion are observed, construction would cease and a buffer<br />
zone established around the area of spawning. The buffer zone would be retained until the eggs hatched<br />
(typically 14 days) and surveys verify that no subsequent spawning has occurred. This project feature<br />
would ensure no significant impact from the project on this species. It should be noted that, if the project<br />
is successful and the beaches are widened, grunion would have additional spawning habitat. This would<br />
be beneficial at several of the receiver sites where either dense cobble or narrow beach width precludes<br />
spawning habitat under existing conditions.<br />
R<br />
R<br />
R<br />
Potential direct impacts to each proposed receiver site are summarized below. None of the receiver sites<br />
are predicted to experience long-term, significant direct impacts. It should be noted that the footprints<br />
shown on the figures on this section are the worst-case, largest footprint, and may be either Alternative 1<br />
or Alternative 2. Refer to Section 2.4 for the exact configuration under each alternative.<br />
South Oceanside. The footprint of the receiver site for this alternative would be approximately 41 acres<br />
and replenishment would involve 380,000 cy. The footprint includes the beach berm and sand slopes into<br />
the water as well as up and down coast as shown in Figure 4.4-1. The footprint assumes a conservative,<br />
gradual slope into the water depth where sand would more quickly mobilize, but where depths would be<br />
minimal. Over time, the replenishment material would be carried offshore/onshore and up and down the<br />
coast by natural processes. The longer term sediment transport evaluation is provided under indirect<br />
impacts. <strong>Sand</strong> and cobble (limited) occur throughout the site, but the area of greater than 30 percent<br />
cobble is centered around Cassidy Street. One high relief rock without surfgrass occurs near Oceanside<br />
<strong>Regional</strong> <strong>Beach</strong> <strong>Sand</strong> <strong>Project</strong> <strong>EIR</strong>/<strong>EA</strong> Page 4.4-3<br />
99-69\SANDAG <strong>EIR</strong><strong>EA</strong> 4.1 to 4.13.wpd 7/17/00
4.4 Biological Resources<br />
Boulevard. The approximate locations of scattered rocks as identified by commercial fisherman are shown<br />
as well. In all but one case, the symbol reflects the general location of such rocks, the extent is not known.<br />
One offshore area, generally south of Cassidy Street, where scattered rock was identified by commercial<br />
fisherman was investigated further for potential indirect impacts related to model-predicted persistent sand<br />
deposition. Figure 4.4-1 shows both the scattered rock symbol and the substrate mapped based on the<br />
side-scan sonar and dive effort in early 2000. The evaluation of indirect impacts to this substrate is<br />
addressed under sediment transport impacts.<br />
Most sedentary or slow moving marine animals within the footprint area would be killed from burial and<br />
construction. Direct impacts would not be significant because of rapid recolonization of the habitat and the<br />
absence of sensitive species. Significant impacts to grunion would be avoided by the process established<br />
in Section 2.5 and summarized briefly above.<br />
North Carlsbad. The footprint of the receiver site would be approximately 29 acres with 240,000 cy.<br />
<strong>Sand</strong> and cobble occur throughout the site although only the larger areas with greater percent sand cover<br />
are illustrated in Figure 4.4-2. Similar to the summary for the South Oceanside receiver site, direct impacts<br />
to marine life within the footprint of the fill would not be significant, and no significant impacts to grunion<br />
are anticipated.<br />
South Carlsbad North. A total of 160,000 cy would fill a footprint of approximately 21 acres. <strong>Sand</strong> and<br />
cobble occur throughout the site (Figure 4.4-3) although the cobble pattern at the northern end is less dense<br />
(less than 30 percent cover). Similar to the summary for the Oceanside receiver site, direct impacts to<br />
marine life within the footprint of the fill would be less than significant and no significant impacts to grunion<br />
are anticipated.<br />
Batiquitos. The footprint at this receiver would be approximately 22 acres and up to 118,000 cy would<br />
be placed at the site. The footprint and nearby resources are shown in Figure 4.4-4. <strong>Sand</strong> and cobble<br />
occur throughout the site. As with the other receiver sites, direct impacts to marine life would not be<br />
significant and no significant impacts to California grunion are anticipated.<br />
Leucadia. The Leucadia footprint would be approximately 13 acres and involve 130,000 cy. <strong>Sand</strong> and<br />
cobble occur within the site as well as a few localized rocks without marine life (refer to Figure 4.4-5).<br />
Patches of surfgrass are located outside the footprint. As with the other receiver sites, direct impacts to<br />
marine life would not be significant and no significant impacts to California grunion are anticipated.<br />
Page 4.4-4<br />
<strong>Regional</strong> <strong>Beach</strong> <strong>Sand</strong> <strong>Project</strong> <strong>EIR</strong>/<strong>EA</strong><br />
99-69\SANDAG <strong>EIR</strong><strong>EA</strong> 4.1 to 4.13.wpd 7/17/00
<strong>Regional</strong> <strong>Beach</strong> <strong>Sand</strong> <strong>Project</strong> <strong>EIR</strong>/<strong>EA</strong><br />
9969 <strong>Beach</strong> Replenishment\Figures\Fig 2-3 South Oceanside Fill 8/31/99<br />
TOP OF SLOPE<br />
Seagaze Drive<br />
* *<br />
TOE OF SLOPE<br />
SAND AT -10, -20, AND -30 ISOBATHS<br />
* *<br />
*<br />
*<br />
Oceanside Blvd<br />
9,900<br />
Rock, High Relief<br />
BUCCANEER<br />
B<strong>EA</strong>CH<br />
PARK<br />
Few Giant Kelp and Sea Fans<br />
Kelly St<br />
*<br />
Vista Way<br />
Scattered Sea Fans<br />
X.X Section Name<br />
*<br />
Approximate location of scattered rocks (per commercial fishermen)<br />
Approximate boundary of model-predicted persistent sediment deposition area<br />
Page 4.4-5<br />
Source: Moffatt & Nichol Engineers, U.S. Navy and MEC<br />
NORTH<br />
0<br />
1600 Feet<br />
Figure 4.4-1<br />
South Oceanside Biological Resources
Page 4.4-6<br />
3,150’<br />
<strong>Regional</strong> <strong>Beach</strong> <strong>Sand</strong> <strong>Project</strong> <strong>EIR</strong>/<strong>EA</strong><br />
9969 <strong>Beach</strong> Replenishment\Figures\Fig 4.4-2 2/2/00<br />
Source: Moffatt & Nichol Engineers and MEC, U.S. Navy<br />
NORTH<br />
0<br />
500 Feet<br />
Surfgrass<br />
Approximate boundary of model-predicted persistent sediment deposition area<br />
Patchy surfgrass, scattered<br />
feather boa,<br />
and few giant kelp<br />
Figure 4.4-2<br />
North Carlsbad Biological Resources
<strong>Regional</strong> <strong>Beach</strong> <strong>Sand</strong> <strong>Project</strong> <strong>EIR</strong>/<strong>EA</strong><br />
9969 <strong>Beach</strong> Replenishment\Figures\Fig 4.4-3 2/2/00<br />
Page 4.4-7<br />
Source: Moffatt & Nichol Engineers and MEC, U.S. Navy<br />
NORTH<br />
0<br />
500 Feet<br />
Figure 4.4-3<br />
South Carlsbad North Biological Resources
Page 4.4-8<br />
1,390’<br />
* *<br />
Giant kelp<br />
35<br />
40<br />
<strong>Regional</strong> <strong>Beach</strong> <strong>Sand</strong> <strong>Project</strong> <strong>EIR</strong>/<strong>EA</strong><br />
9969 <strong>Beach</strong> Replenishment\Figures\Fig 4.4-4 2/2/00<br />
*<br />
Approximate location of scattered rocks (per commercial fishermen)<br />
Source: Moffatt & Nichol Engineers, U.S. Navy, and MEC<br />
NORTH<br />
0<br />
500 Feet<br />
Kelp, scattered feather boa, and sea fans<br />
Approximate boundary of model-predicted persistent sediment deposition area.<br />
45<br />
Figure 4.4-4<br />
Batiquitos Biological Resources
<strong>Regional</strong> <strong>Beach</strong> <strong>Sand</strong> <strong>Project</strong> <strong>EIR</strong>/<strong>EA</strong><br />
9969 <strong>Beach</strong> Replenishment\Figures\Fig 4.4-5 2/2/00<br />
Grandview St<br />
Glaucus St<br />
2,700<br />
Surfgrass<br />
Page 4.4-9<br />
Source: Moffatt & Nichol Engineers, U.S. Navy, and MEC<br />
NORTH<br />
0<br />
500 Feet<br />
Figure 4.4-5<br />
Leucadia Biological Resources
4.4 Biological Resources<br />
Moonlight <strong>Beach</strong>. A total of 88,000 cy would be placed at this receiver site, and the footprint would be<br />
about 10 acres. Figure 4.4-6 illustrates this receiver site and nearby resources. As with the other receiver<br />
sites, direct impacts to marine life would not be significant and no significant impacts to California grunion<br />
are anticipated.<br />
Cardiff. At this receiver site, cobble dominates the mid and upper intertidal and sand and moderate cobble<br />
occur in the lower intertidal. Figure 4.4-7 shows only the more dense cobble, plus the rip-rap that has been<br />
placed seaward of Highway 101. The footprint of fill would be approximately 10 acres and approximately<br />
104,000 cy would be placed at the site. As with the other receiver sites, direct impacts to marine life would<br />
not be significant. Because of the dense and moderate cobble, California grunion are not anticipated to<br />
utilize this site for spawning.<br />
Solana <strong>Beach</strong>. <strong>Sand</strong> and cobble occur throughout the site and the footprint for this alternative would be<br />
approximately 12 acres. Approximately 140,000 cy of material would be placed at the site. Within the<br />
proposed toe of the fill slope are two localized hard substrate areas consisting of low relief rocks and a<br />
sand stone bench with sparse juvenile feather boa kelp, opportunistic coralline turf algae, and little else.<br />
Figure 4.4-8 illustrates the beach footprint and nearby habitat. The lack of invertebrates and sparse<br />
occurrence of algae indicates that the recruitment of feather boa was opportunistic and not a persistent<br />
feature. No surfgrass was present on any of the hard substrate within the footprint. Direct impacts would<br />
not be significant because of rapid recolonization of the sandy habitat and lack of sensitive persistent species<br />
on the hard substrate. Direct impacts to marine life within the sandy portion of the fill footprint, and<br />
California grunion, would be less than significant.<br />
Del Mar. This alternative would have an approximately 29 acre footprint of fill with 180,000 cy. Figure<br />
4.4-9 shows the footprint and nearby habitat. <strong>Sand</strong> and some cobble occur throughout the fill area. There<br />
would be no direct significant impacts to marine resources or California grunion.<br />
Torrey Pines. This alternative would have an approximately 19 acre footprint of fill using 240,000 cy of<br />
material. <strong>Sand</strong> and cobble occur throughout the fill area (Figure 4.4-10). There is a patch of surfgrass just<br />
outside the footprint. There would be no direct significant impacts to marine resources or California<br />
grunion.<br />
Mission <strong>Beach</strong>. Approximately 100,000 cy would be placed at this receiver site under Alternative 1 with<br />
an approximately 20 acre footprint of fill. <strong>Sand</strong> occurs throughout the fill area (refer to Figure 4.4-11).<br />
There would be no significant direct impacts to marine resources or California grunion.<br />
Page 4.4-10<br />
<strong>Regional</strong> <strong>Beach</strong> <strong>Sand</strong> <strong>Project</strong> <strong>EIR</strong>/<strong>EA</strong><br />
99-69\SANDAG <strong>EIR</strong><strong>EA</strong> 4.1 to 4.13.wpd 7/17/00
<strong>Regional</strong> <strong>Beach</strong> <strong>Sand</strong> <strong>Project</strong> <strong>EIR</strong>/<strong>EA</strong><br />
9969 <strong>Beach</strong> Replenishment\Figures\Fig 4.4-6 2/2/00<br />
770’<br />
SPARSE<br />
SURFGRASS<br />
*<br />
SCATTERED F<strong>EA</strong>THER BOA<br />
SCATTERED S<strong>EA</strong> FANS,<br />
SCATTERED F<strong>EA</strong>THER BOA<br />
Surfgrass<br />
*<br />
Approximate location of scattered rocks (per commercial fishermen)<br />
Approximate boundary of model-predicted persistent sediment deposition area<br />
JUVENILE GIANT KELP, SCATTERED S<strong>EA</strong> PALMS, AND S<strong>EA</strong> FANS<br />
Page 4.4-11<br />
Source: Moffatt & Nichol Engineers, U.S. Navy, and MEC<br />
NORTH<br />
0<br />
500 Feet<br />
Figure 4.4-6<br />
Moonlight <strong>Beach</strong> Biological Resources
Page 4.4-12<br />
Surfgrass<br />
780’<br />
*<br />
Approximate location of scattered<br />
rocks (per commercial fishermen)<br />
<strong>Regional</strong> <strong>Beach</strong> <strong>Sand</strong> <strong>Project</strong> <strong>EIR</strong>/<strong>EA</strong><br />
9969 <strong>Beach</strong> Replenishment\Figures\Fig 4.4-7 2/2/00<br />
Source: Moffatt & Nichol Engineers, U.S. Navy, and MEC<br />
NORTH<br />
0<br />
500 Feet<br />
**<br />
Figure 4.4-7<br />
Cardiff Biological Resources
<strong>Regional</strong> <strong>Beach</strong> <strong>Sand</strong> <strong>Project</strong> <strong>EIR</strong>/<strong>EA</strong><br />
9969 <strong>Beach</strong> Replenishment\Figures\Fig 4.4-8 2/2/00<br />
Vegetated<br />
1,800’<br />
* *<br />
*<br />
* * * * * * * * *<br />
Feather boa,<br />
few giant kelp<br />
Giant Kelp<br />
Extent of side scan sonar survey<br />
Page 4.4-13<br />
*<br />
Approximate location of scattered rocks (per commercial fishermen)<br />
Source: Moffatt & Nichol Engineers, U.S. Navy and MEC<br />
NORTH<br />
0<br />
500 Feet<br />
Approximate boundary of model-predicted persistent sediment deposition area<br />
Figure 4.4-8<br />
Solana <strong>Beach</strong> Biological Resources
Page 4.4-14 <strong>Regional</strong> <strong>Beach</strong> <strong>Sand</strong> <strong>Project</strong> <strong>EIR</strong>/<strong>EA</strong><br />
9969 <strong>Beach</strong> Replenishment\Figures\Fig 4.4-9 2/2/00<br />
Source: Moffatt & Nichol Engineers, U.S. Navy and MEC<br />
NORTH<br />
0<br />
*<br />
500 Feet<br />
*<br />
*<br />
Approximate location of scattered rocks (per commercial fishermen)<br />
Approximate boundary of model-predicted persistent sediment deposition area<br />
Approximate boundary of reef (per commercial fishermen)<br />
* *<br />
*<br />
*<br />
Figure 4.4-9<br />
Del Mar Biological Resources<br />
Page X-XX
<strong>Regional</strong> <strong>Beach</strong> <strong>Sand</strong> <strong>Project</strong> <strong>EIR</strong>/<strong>EA</strong><br />
9969 <strong>Beach</strong> Replenishment\Figures\Fig 4.4-10 2/2/00<br />
Surfgrass<br />
Page 4.4-15<br />
Source: Moffatt & Nichol Engineers, U.S. Navy and MEC<br />
NORTH<br />
0<br />
500 Feet<br />
Figure 4.4-10<br />
Torrey Pines Biological Resources
Page 4.4-16<br />
OSTEND CT<br />
<strong>Regional</strong> <strong>Beach</strong> <strong>Sand</strong> <strong>Project</strong> <strong>EIR</strong>/<strong>EA</strong><br />
9969 <strong>Beach</strong> Replenishment\Figures\Fig 4.4-11 2/2/00<br />
Source: Moffatt & Nichol Engineers, U.S. Navy and MEC<br />
NORTH<br />
0<br />
500 Feet<br />
Figure 4.4-11<br />
Mission <strong>Beach</strong> Biological Resources
4.4 Biological Resources<br />
Imperial <strong>Beach</strong>. This alternative would have an approximately 18 acre footprint of fill and 120,000 cy of<br />
material would be placed. <strong>Sand</strong> and cobble occur throughout the fill area (refer to Figure 4.4-12) and<br />
there would be no significant direct impacts to marine resources or California grunion.<br />
Indirect Impacts of <strong>Sand</strong> Placement<br />
This evaluation addressed indirect impacts to shorebirds due to burial of the invertebrate food source, to<br />
various resources due to increased turbidity, and to biological resources from sediment transport.<br />
Shorebird Foraging. There is potential for indirect effects on shorebird foraging from burial of<br />
invertebrates within the footprint of the receiver site. This impact is not considered significant since each<br />
receiver site has unaffected shoreline nearby and recolonization of the receiver site would be rapid. The<br />
closest nest sites of the threatened western snowy plover are approximately 500 feet at Batiquitos, although<br />
the nest location is north of the inlet jetty and the receiver site is south. Other sites are ¼ to five miles from<br />
the proposed receiver sites. The two closest sites (Batiquitos and Cardiff) are characterized by high human<br />
use (which make them less attractive for foraging). Additionally, the Cardiff site has cobble, not sand.<br />
However, concern has been expressed by the USFWS that beach building activity at the Batiquitos site<br />
during nesting season may result in indirect impacts to this species. SANDAG has initiated consultation<br />
with the USFWS and USACOE under Section 7 of the Endangered Species Act to ensure potential<br />
construction impacts are reduced. This could involve scheduling receiver site construction as early in<br />
nesting season as possible for particular sites (i.e., Batiquitos) or completion of selected sites prior to<br />
nesting season. SANDAG will conform to the negotiated agreement reached during the Section 7 process<br />
to avoid significant impacts to the shorebird.<br />
R<br />
R<br />
R<br />
R<br />
R<br />
R<br />
R<br />
R<br />
R<br />
R<br />
R<br />
Some temporary attraction of birds (particularly scavengers such as gulls) to the discharge location to feed<br />
on dead invertebrates and organic matter is anticipated based on observations of other beach replenishment<br />
projects.<br />
Turbidity. Turbidity has the potential to indirectly impact plankton, fish, marine mammals, birds, vegetated<br />
reefs, and benthic invertebrates. As discussed in Section 4.3, turbidity would be expected to be localized<br />
to the discharge location (average 250 feet) under average current conditions, and could extend up to<br />
1,000 to 3,000 feet downcurrent under maximum current speeds at some sites. Plumes would be expected<br />
to be within 1,000 feet from shore. Further, concentrations within the plume would be expected to be no<br />
higher than that which occurs naturally in nearshore waters under higher wave or storm conditions, and with<br />
implementation of longitudinal dikes, would be even less.<br />
<strong>Regional</strong> <strong>Beach</strong> <strong>Sand</strong> <strong>Project</strong> <strong>EIR</strong>/<strong>EA</strong> Page 4.4-17<br />
99-69\SANDAG <strong>EIR</strong><strong>EA</strong> 4.1 to 4.13.wpd 7/17/00
Page 4.4-18<br />
<strong>Regional</strong> <strong>Beach</strong> <strong>Sand</strong> <strong>Project</strong> <strong>EIR</strong>/<strong>EA</strong><br />
9969 <strong>Beach</strong> Replenishment\Figures\Fig 4.4-12 2/2/00<br />
Source: Moffatt & Nichol Engineers, U.S. Navy, and MEC<br />
NORTH<br />
0<br />
788 Feet<br />
Approximate boundary of model-predicted persistent sediment deposition area<br />
Figure 4.4-12<br />
Imperial <strong>Beach</strong> Biological Resources
4.4 Biological Resources<br />
The effects of suspended particulates on plankton are generally considered to be negligible because of the<br />
limited area affected and short exposure time as they drift through the affected area. Fish offshore the<br />
receiver sites, and any marine mammals that ventured close to shore, may temporarily leave the area<br />
affected by turbidity, but would not be expected to be adversely affected in the long-term. Some studies<br />
of beach replenishment have observed fish attraction to turbidity plumes, presumably to feed upon dead<br />
invertebrates and organic particulates that are washed offshore.<br />
Fish-eating birds such as the California brown pelican and California least tern could be impacted in the<br />
vicinity of the receiver site by a temporary reduction in their prey base if fish move away from the turbidity<br />
plume. Given that turbidity would be localized and not extend from site to site, turbidity would not extend<br />
beyond normal foraging distances for either of these species. California least tern forage generally within<br />
a two-mile radius of their nesting site, but may forage as far as five miles away. California brown pelicans<br />
forage over several miles. Since ample alternative forage areas would be available to these species during<br />
receiver site construction, particularly during non-nesting periods, no adverse impacts to these species are<br />
anticipated. There may even be a temporary attraction to the plume areas if fish concentrate within the<br />
plume. Monitoring of a beach replenishment project in Orange County demonstrated that California least<br />
tern preferred to forage inside the turbidity plume (MEC 1997). Attraction of fish-eating birds to dredge<br />
areas has also been noted in San Diego Bay.<br />
R<br />
With the project schedule shifted from later summer to the spring nesting season (April to September), R<br />
additional analysis was undertaken to evaluate potential turbidity impacts to least tern foraging. The least R<br />
tern can forage up to five miles distant, but prefers to remain closer (two miles or less) during the nesting R<br />
season when eggs or baby birds may be threatened by predators. Additionally, the newly hatched birds R<br />
require relatively small fish because they have small beaks and the adults feed them whole, not regurgitated, R<br />
fish. Concern has been expressed that construction of the project during nesting season could increase R<br />
turbidity in the nearby foraging area, necessitating greater distances for foraging and therefore resulting in R<br />
increased predation while the adults are gone from the nest.<br />
R<br />
R<br />
Figures 4.4-13 through 4.4-17 provide a graphic representation of the relative distance between tern R<br />
nesting locations, which are generally near lagoons and river mouths, and the borrow and receiver sites R<br />
where turbidity would be generated. Distances from the nesting locations are shown in one-quarter, one- R<br />
half, one and two mile increments so the relative location of project features is evident. It should be noted R<br />
that the center point for calculating the distances is the river mouth, as requested by the USFWS, but the R<br />
actual nest locations may be well inland from this point. For example, a least R<br />
<strong>Regional</strong> <strong>Beach</strong> <strong>Sand</strong> <strong>Project</strong> <strong>EIR</strong>/<strong>EA</strong> Page 4.4-19<br />
99-69\SANDAG <strong>EIR</strong><strong>EA</strong> 4.1 to 4.13.wpd 7/17/00
2-mile radius<br />
!"#@<br />
Stuart Mesa Rd<br />
1-mile radius<br />
Vande grift Blvd<br />
1/2-mile radius<br />
1/4-mile radius<br />
#<br />
Santa Margarita<br />
River<br />
SO-9<br />
BORROW SITE<br />
DREDGE<br />
AR<strong>EA</strong><br />
OC<strong>EA</strong>NSIDE<br />
HARBOR<br />
Rey River<br />
San Luis<br />
!"#@<br />
MISSION<br />
Overview of San Diego County<br />
DREDGE DISCHARGE LINE<br />
COAST<br />
#<br />
#<br />
<strong>Project</strong> Detail#<br />
#<br />
#<br />
SOUTH OC<strong>EA</strong>NSIDE<br />
RECEIVER SITE<br />
Sources: SANDAG (Base Layers), Moffatt & Nichol Engineers (Site Locations).<br />
2000 0 2000 4000 Feet<br />
Scale: 1' = 4000'<br />
4.4-20<br />
Figure 4.4-13<br />
Relative Proximity of Receiver and Borrow Sites<br />
to Least Tern Foraging Locations<br />
(Santa Margarita River Mouth)<br />
<strong>Regional</strong> <strong>Beach</strong> <strong>Sand</strong> <strong>Project</strong> <strong>EIR</strong>/<strong>EA</strong><br />
9969 SANDAG\GIS\site 1.apr 6/22/00
Alga Rd<br />
E<br />
l Camino Real<br />
College Blvd<br />
Palomar Airport Rd<br />
SOUTH CARLSBAD<br />
NORTH<br />
RECEIVER SITE<br />
!"#@<br />
Camino V<br />
ida Roble<br />
Paseo Del Norte<br />
Carlsbad<br />
Blv<br />
d<br />
2-mile radius<br />
DREDGE DISCHARGE<br />
L<br />
INE<br />
1-mile radius<br />
SO-7<br />
BORROW SITE<br />
1/2-mile radius<br />
1/4-mile radius<br />
#<br />
BATIQUITOS LAGOON<br />
Saxony Rd<br />
La Costa Av<br />
DREDGE<br />
AR<strong>EA</strong><br />
(May expand to<br />
twice surface area)<br />
BATIQUITOS<br />
RECEIVER SITE<br />
Highway 101<br />
LEUCADIA<br />
RECEIVER SITE<br />
Overview of San Diego County<br />
Woodley Rd<br />
DREDGE DISCHARGE<br />
L<br />
INE<br />
#<br />
#<br />
#<br />
<strong>Project</strong> Detail<br />
!"#@<br />
#<br />
#<br />
Sources: SANDAG (Base Layers), Moffatt & Nichol Engineers (Site Locations).<br />
2000 0 2000 4000 Feet<br />
Scale: 1' = 4000'<br />
<strong>Regional</strong> <strong>Beach</strong> <strong>Sand</strong> <strong>Project</strong> <strong>EIR</strong>/<strong>EA</strong><br />
9969 SANDAG\GIS\site 2.apr 6/22/00<br />
MOONLIGHT B<strong>EA</strong>CH<br />
RECEIVER SITE<br />
Figure 4.4-14<br />
Relative Proximity of Receiver and Borrow Sites<br />
to Least Tern Foraging Locations<br />
(Batiquitos Lagoon)<br />
4.4-21
MOONLIGHT B<strong>EA</strong>CH<br />
RECEIVER SITE<br />
Enc<br />
initas<br />
Blvd<br />
2-mile radius<br />
!"#@<br />
Santa Fe Dr<br />
SO-6<br />
BORROW SITE<br />
1-m<br />
ile radius<br />
1/2-mile radius<br />
1/4-mile radius<br />
#<br />
Birmingham Dr<br />
DREDGE<br />
AR<strong>EA</strong><br />
DREDGE<br />
DISCHARGE LINE<br />
San El ijo Sewer Outfa ll<br />
CARDIFF<br />
RECEIVER SITE<br />
SAN<br />
ELIJO<br />
LAGOON<br />
Highway 101<br />
Overview of San Diego County<br />
SOLANA B<strong>EA</strong>CH<br />
RECEIVER SITE<br />
Lomas Santa Fe Dr<br />
!"#@<br />
#<br />
<strong>Project</strong> Detail<br />
#<br />
#<br />
#<br />
#<br />
SO-5<br />
BORROW SITE<br />
DREDGE DISCHARGE LINE<br />
Via De La Valle<br />
SAN<br />
DIEGUITO<br />
LAGOON<br />
Sources: SANDAG (Base Layers), Moffatt & Nichol Engineers (Site Locations).<br />
2000 0 2000 4000 Feet<br />
Scale: 1' = 4000'<br />
4.4-22<br />
Figure 4.4-15<br />
Relative Proximity of Receiver and Borrow Sites<br />
to Least Tern Foraging Locations<br />
(San Elijo Lagoon)<br />
<strong>Regional</strong> <strong>Beach</strong> <strong>Sand</strong> <strong>Project</strong> <strong>EIR</strong>/<strong>EA</strong><br />
9969 SANDAG\GIS\site 3.apr 5/25/00
Pro posed San Diego<br />
Underwater Recreation Area<br />
CDFG Mi sion Bay Artificial Reef (MBAR)<br />
d<br />
Missi<br />
on Bl<br />
v<br />
Lamont St<br />
Garnet Av<br />
Grand Av<br />
I<br />
ngr<br />
aham St<br />
2-mile radius<br />
MISSION B<strong>EA</strong>CH<br />
RECEIVER SITE<br />
MB-1<br />
BORROW SITE<br />
DREDGE<br />
DISCHARGE LINE<br />
MISSION<br />
BAY<br />
DREDGE<br />
AR<strong>EA</strong><br />
1-mile radius<br />
Mi sion Bay Dr<br />
1/2-mile radius<br />
1/4-mile radius<br />
#<br />
!"#A<br />
Ni mitz Blv<br />
d<br />
Voltaire St<br />
Sunset Cliffs Blvd<br />
Naragansett Av<br />
Overview of San Diego County<br />
#<br />
#<br />
#<br />
Point Loma Av<br />
Hill St<br />
Canon St<br />
Rosecrans St<br />
N Harbor Dr<br />
<strong>Project</strong> Detail<br />
#<br />
#<br />
in<br />
Catal<br />
a Blvd<br />
SAN<br />
DIEGO<br />
BAY<br />
Sources: SANDAG (Base Layers), Moffatt & Nichol Engineers (Site Locations).<br />
2000 0 2000 4000 Feet<br />
Scale: 1' = 4000'<br />
<strong>Regional</strong> <strong>Beach</strong> <strong>Sand</strong> <strong>Project</strong> <strong>EIR</strong>/<strong>EA</strong><br />
9969 SANDAG\GIS\site 4.apr 6/22/00<br />
Figure 4.4-16<br />
Relative Proximity of Receiver and Borrow Sites<br />
to Least Tern Foraging Locations<br />
(Mariner's Point-Mission Bay)<br />
4.4-23
t<br />
S<br />
r<br />
l<br />
i<br />
S<br />
ve<br />
ra<br />
Blvd<br />
Otay River<br />
2-mile radius<br />
Highway 75<br />
IMPERAL B<strong>EA</strong>CH<br />
RECEIVER SITE<br />
Elm Av<br />
Coronado Av<br />
1-mile radius<br />
Halo St<br />
Tower Rd<br />
1/2-mile radius<br />
1/4-mile radius<br />
#<br />
TIJUANA RIVER<br />
ESTUARY<br />
Saturn Blvd<br />
SS-1<br />
BORROW SITE<br />
DREDGE<br />
DISCHARGE LINE<br />
Tijuana River<br />
DREDGE<br />
AR<strong>EA</strong><br />
Monument Rd<br />
Overview of San Diego County<br />
International Border<br />
Toll Road 1<br />
#<br />
#<br />
#<br />
<strong>Project</strong> Detail<br />
#<br />
#<br />
Sources: SANDAG (Base Layers), Moffatt & Nichol Engineers (Site Locations).<br />
2000 0 2000 4000 Feet<br />
Scale: 1' = 4000'<br />
4.4-24<br />
Figure 4.4-17<br />
Relative Proximity of Receiver and Borrow Sites<br />
to Least Tern Foraging Locations<br />
(Tijuana River)<br />
<strong>Regional</strong> <strong>Beach</strong> <strong>Sand</strong> <strong>Project</strong> <strong>EIR</strong>/<strong>EA</strong><br />
9969 SANDAG\GIS\site 5.apr 6/22/00
4.4 Biological Resources<br />
tern nesting island was constructed at Batiquitos lagoon just east of the I-5 freeway which is approximately<br />
0.75 mile further inland than the river mouth. R<br />
Based on the figures, borrow sites S0-9, MB-1 and SS-1 would be greater than one mile distant while SO-<br />
7 and SO-6 would be under one mile. Receiver sites at South Oceanside, South Carlsbad North and R<br />
Moonlight <strong>Beach</strong> would be outside the two mile radius. The two closest receiver sites would be Batiquitos R<br />
and Cardiff which are just south of the lagoon mouths at Batiquitos and San Elijo, respectively.<br />
To gain an understanding of the potential impact to tern foraging during nesting season the percentage of<br />
foraging area potentially affected by turbidity within the one and two mile distances was calculated for the<br />
both the cutterhead and hopper dredge. The calculations and supporting technical notes are contained in<br />
Appendix F while key conclusions are summarized in Table 4.4-1. The potential turbidity varies with the<br />
two dredges. With the cutterhead there would be simultaneous dredging and sand placement. With the<br />
hopper dredge there would be tailings at the dredge and mono buoy locations. The percentage calculation<br />
considers both average and maximum typical current conditions. It is an extremely conservative analysis<br />
because it assumes nearshore sand placement not onshore, and no training dikes. Both of these elements<br />
are part of this project’s design and would further reduce turbidity in the near shore. It also does not<br />
consider the available foraging area inside the lagoons themselves, which the terns are known to utilize.<br />
Under the very worst-case conditions of maximum current speed at the two receiver sites closest to the<br />
nesting locations (Batiquitos and Cardiff) the percentage of area affected by the hopper dredge would be<br />
less than four percent of the available foraging area within one mile. At the remaining sites, the percentage<br />
of foraging area affected would range from zero to less than 2.5 percent. With the cutterhead dredge the<br />
percent potentially affected would be a maximum of two percent at the Cardiff site, within one mile.<br />
Considering the two mile radii the percentage would reduce further.<br />
Based on the remaining area available for foraging and the fact that this worst-case analysis likely overstates<br />
the potential impact, impacts associated with construction turbidity during the tern nesting season would<br />
be less than significant. However, the USFWS and USACOE have requested that SANDAG continue<br />
to consult with them under Section 7 of the Endangered Species Act to further reduce the potential for<br />
construction impacts. This process would be completed during the permit negotiation process and would<br />
consider such items as phasing to construct more sensitive sites such as Batiquitos prior to nesting, or early<br />
in the nesting season, other construction methods to minimize turbidity, and predator control.<br />
R<br />
R<br />
R<br />
R<br />
R<br />
R<br />
R<br />
R<br />
R<br />
R<br />
R<br />
R<br />
R<br />
R<br />
R<br />
R<br />
R<br />
R<br />
R<br />
R<br />
R<br />
R<br />
R<br />
R<br />
R<br />
R<br />
R<br />
R<br />
R<br />
R<br />
<strong>Regional</strong> <strong>Beach</strong> <strong>Sand</strong> <strong>Project</strong> <strong>EIR</strong>/<strong>EA</strong> Page 4.4-25<br />
99-69\SANDAG <strong>EIR</strong><strong>EA</strong> 4.1 to 4.13.wpd 7/17/00
4.4 Biological Resources<br />
Table 4.4-1<br />
Percent of Least Tern Foraging Habitat (1) Affected By Worst-Case Turbidity (2)<br />
Within One and Two Mile (3) Radii<br />
Receiver Site<br />
Cutterhead Dredge<br />
Oceanside<br />
Average Current<br />
Within One Mile<br />
Maximum Typical<br />
Currents<br />
Average Current<br />
Within Two Miles<br />
Maximum Typical<br />
Currents<br />
0 0 0.02 0.5 R<br />
N. Carlsbad 0 0 0.02 0.5 R<br />
S. Carlsbad (N) 0.01 0.5 0.003 0.1 R<br />
S. Carlsbad (S) 0.01 0.5 0.009 0.2 R<br />
Batiquitos<br />
Leucadia<br />
Moonlight<br />
Cardiff<br />
Solana <strong>Beach</strong><br />
Del Mar<br />
Torrey Pines<br />
Mission <strong>Beach</strong><br />
Imperial <strong>Beach</strong><br />
Hopper Dredge<br />
Oceanside<br />
0.03 1.1 0.009 0.2 R<br />
0.03 1.1 0.009 0.2 R<br />
0.01 0.5 0.003 0.1 R<br />
0.14 2.0 0.03 0.5 R<br />
0.3 1.0 0.07 0.3 R<br />
0 0 0 0 R<br />
0 0 0 0 R<br />
0.02 0.05 0.007 0.02 R<br />
0.1 0.3 0.03 0.07 R<br />
0 0 0.06 1.0 R<br />
N. Carlsbad 0 0 0.06 1.0 R<br />
S. Carlsbad (N) 0.05 1.8 0.01 0.5 R<br />
S. Carlsbad (S) 0.05 1.8 0.02 0.5 R<br />
Batiquitos<br />
Leucadia<br />
Moonlight<br />
Cardiff<br />
Solana <strong>Beach</strong><br />
Del Mar<br />
Torrey Pines<br />
Mission <strong>Beach</strong><br />
Imperial <strong>Beach</strong><br />
0.07 2.4 0.02 0.6 R<br />
0.07 2.4 0.02 0.6 R<br />
0.07 1.8 0.02 0.5 R<br />
0.3 3.9 0.07 1.0 R<br />
0.3 1.0 0.07 0.3 R<br />
0 0 0 0 R<br />
0 0 0 0 R<br />
0.02 0.15 0.01 0.4 R<br />
0.18 0.5 0.04 0.1 R<br />
(1)<br />
Does not consider habitat within the lagoons which is also known to be used for foraging. R<br />
(2)<br />
Worst-case turbidity assuming nearshore placement and no reduction for training dikes. R<br />
(3)<br />
Radii calculated from river/lagoon mouth, not necessarily exact for tern nesting locations. R<br />
R<br />
R<br />
R<br />
R<br />
R<br />
R<br />
R<br />
R<br />
R<br />
Page 4.4-26<br />
<strong>Regional</strong> <strong>Beach</strong> <strong>Sand</strong> <strong>Project</strong> <strong>EIR</strong>/<strong>EA</strong><br />
99-69\SANDAG <strong>EIR</strong><strong>EA</strong> 4.1 to 4.13.wpd 7/17/00
4.4 Biological Resources<br />
Kelp beds occur from about 1,200 to 4,000 feet offshore, which is outside the distance that turbidity<br />
plumes would be expected to travel offshore. In the unlikely event that turbidity did extend that far<br />
offshore, the particulate concentration would be so low as to have a negligible effect on the kelp bed.<br />
Therefore, no significant indirect impacts to kelp beds are anticipated from turbidity generated from receiver<br />
site construction.<br />
Nearshore vegetated reefs may be impacted by reduced light transmittance and siltation associated with<br />
turbidity plumes. Turbidity will be controlled by the construction of longitudinal dikes and would not be<br />
expected to exceed concentrations that naturally occur in turbid nearshore waters during higher wave or<br />
storm conditions. Similarly, turbidity would not be anticipated to have significant impacts on benthic<br />
invertebrates offshore the receiver sites and within the distance of the expected turbidity plumes. Limited<br />
information from recent beach replenishment projects reported 43 mg/L at the discharge location when the<br />
discharged sediments had a silt/clay content less than 10 percent. Based on the sandy nature of the borrow<br />
site sediments and use of longitudinal dikes to control turbidity, it seems reasonable that suspended<br />
particulate concentrations would be less than 100 mg/L offshore the discharge location and decrease with<br />
increasing distance from that location at the receiver site. As adults, mussels and oysters can tolerate<br />
suspended matter in the range of 100 to 1000 mg/L over reasonably short exposure times. For larvae and<br />
juveniles the effects appear to be negligible below 200 mg/L and slowly increase to critical levels at about<br />
750 mg/L. Juvenile rock lobsters tolerate suspended particulate concentrations of at least 360 mg/L for<br />
several days as well as exposure to sand. Thus, marine invertebrates adapted to living in naturally turbid<br />
nearshore waters have relatively broad tolerance levels that would not be expected to be exceeded by the<br />
project.<br />
Sediment Transport. Fill material placed on individual receiver sites would eventually be washed by<br />
waves and redistributed offshore and alongshore through natural processes. There is the potential for sand<br />
introduced into the system to indirectly impact sensitive resources if material deposits on those resources<br />
at sufficient depth and with persistence to result in irreversible removal, disturbance or destruction of that<br />
resource. As defined in Section 4.4.2, sensitive indicator species consist of surfgrass, feather boa kelp, sea<br />
fans, sea palms, and giant kelp.<br />
Evaluating potential indirect sedimentation impacts is complex and the impact conclusions must be<br />
determined in light of the dynamic ocean system, where season fluctuation of up to three feet of sand has<br />
been monitored and where historic beach replenishment activities have occurred in many of the same<br />
locations as proposed by the <strong>Regional</strong> <strong>Beach</strong> <strong>Sand</strong> <strong>Project</strong>; with an understanding of the life history of<br />
<strong>Regional</strong> <strong>Beach</strong> <strong>Sand</strong> <strong>Project</strong> <strong>EIR</strong>/<strong>EA</strong> Page 4.4-27<br />
99-69\SANDAG <strong>EIR</strong><strong>EA</strong> 4.1 to 4.13.wpd 7/17/00
4.4 Biological Resources<br />
sensitive species and their relative distribution along the coast; and in conservative interpretation of model<br />
predictions. A very detailed evaluation of potential impact associated with sediment transport is provided<br />
in Appendix D, and this summary is provided to briefly describe the methodology and results. Overall,<br />
the evaluation concludes that no significant indirect impacts to sensitive marine resources are anticipated,<br />
although SANDAG would prepare and implement a monitoring plan to verify significant impacts do not<br />
occur. As described in Section 2.5, this monitoring plan would be similar to the Coastal Monitoring Plan<br />
approved by the USACOE in 1997 for the Navy Homeporting project.<br />
The approach to analysis of indirect sedimentation impacts involved the following steps:<br />
(1) Review of life history information for indicator species to understand sensitivity and recovery rates<br />
after disturbance and therefore generate species-specific significance criteria.<br />
(2) Review of historical profile data to establish the range in sand fluctuation that naturally occurs along<br />
beach profiles correlated to individual receiver sites.<br />
(3) Review of historic beach replenishment volumes in the vicinity of the receiver sites to establish the<br />
degree of disturbance to habitats previously experienced from sedimentation.<br />
(4) Review of project-specific model predictions to identify potential depositional areas, and review of<br />
reef height and occurrence of sensitive resources within predicted depositional areas.<br />
• Life History Information. Surfgrass is considered a stress-tolerant species that withstands<br />
sedimentation by having an extensive root system, fibrous leaf sheaths that provide protection from<br />
abrasion, and long leaves (three to five feet) that extend above the sand. While the amount of sand that<br />
would certainly cause mortality is not known, the recovery of surfgrass is tied to the degree of disturbance<br />
to the root system. Surfgrass can recover quickly via regrowth if the root system remains intact. Given that<br />
sand burial does not remove the root system, it is assumed that sedimentation would not be expected to<br />
result in an irreversible impact as long as burial did not persist for several years at the location. An impact<br />
would be significant if sedimentation substantially buried surfgrass (root system and the entire length of<br />
leaves) for more than two consecutive seasons. For this project there were no cases where a reef with<br />
surfgrass would be completely buried for two seasons. So further evaluation of the relative sand depth to<br />
leaf length was also considered.<br />
R<br />
R<br />
R<br />
Feather boa kelp commonly occurs from intertidal to subtidal depths and has a naturally high recruitment<br />
rate on exposed hard substrates and rapid growth. Impacts to feather boa kelp would be expected to last<br />
only as long as a reef was covered by sand. Irreversible impacts to feather boa kelp would not be<br />
Page 4.4-28<br />
<strong>Regional</strong> <strong>Beach</strong> <strong>Sand</strong> <strong>Project</strong> <strong>EIR</strong>/<strong>EA</strong><br />
99-69\SANDAG <strong>EIR</strong><strong>EA</strong> 4.1 to 4.13.wpd 7/17/00
4.4 Biological Resources<br />
expected unless sedimentation permanently buried a reef. Therefore, impacts to feather boa kelp were<br />
considered significant if sedimentation was predicted to substantially bury reef, where the species occurs,<br />
for several years.<br />
Sea palms and sea fans also are considered relatively tolerant of physical stress, living in areas with very<br />
strong waves and occurring from the low intertidal to subtidal. Their occurrence on low to high relief reefs<br />
without interspersed sand patches suggests they may be less tolerant of sedimentation than surfgrass and<br />
feather boa kelp. They also have a longer life span and take longer to reach sexual maturity. Given the<br />
longer life spans of the species and suspected lower tolerance to sedimentation, impacts were considered<br />
significant if sedimentation was predicted to substantially bury a reef where they occurred for greater than<br />
one year.<br />
Giant kelp forms persistent beds, but the extent of the beds may vary considerably year to year in response<br />
to a variety of physical and biological stresses. Giant kelp, particularly in the microscopic and juvenile<br />
stages, is considered highly sensitive to sand movement and disturbance and is one of the first species to<br />
be eliminated under wave or sand scour stresses. Based on the naturally high seasonal variation in kelp bed<br />
size due to a variety of factors, an impact would not be considered irreversible unless sedimentation<br />
affected a substantial part of the historic kelp bed area and persisted such that recruitment potential would<br />
be substantially affected.<br />
• Historic and Proposed <strong>Beach</strong> Replenishment Volumes. In the past 45 years, over 33 million cy<br />
of sand has been artificially introduced to the Oceanside Littoral Cell, approximately 1.3 million cy of sand<br />
has been artificially introduced to the Mission Bay Littoral Cell, and about one million cy has been<br />
introduced to the Silver Strand Littoral Cell (Appendix D). Nearshore areas off Oceanside and Carlsbad<br />
have been exposed to frequent and recent sedimentation from projects similar to, or in excess of, that<br />
proposed with the <strong>Regional</strong> <strong>Beach</strong> <strong>Sand</strong> <strong>Project</strong>. This is also true for Imperial <strong>Beach</strong>. Less frequent<br />
disturbance, but at similar to higher volumes, has occurred off Mission <strong>Beach</strong>. Areas that have been less<br />
subject to sedimentation from beach replenishment occur between Leucadia and Torrey Pines.<br />
• Natural <strong>Sand</strong> Fluctuation. <strong>Beach</strong> profiles have been measured at various frequencies since the 1930s<br />
at 50 transect locations between Oceanside and the U.S.–Mexican border with most of the data being<br />
collected since 1983. In shallow water the changes in sand level are related primarily to wave condition,<br />
whereas changes in sand level in deeper water are more complex. Generally, larger waves in fall and winter<br />
resulted in several feet of sand being removed from the nearshore and redeposited directly outside the cut<br />
<strong>Regional</strong> <strong>Beach</strong> <strong>Sand</strong> <strong>Project</strong> <strong>EIR</strong>/<strong>EA</strong> Page 4.4-29<br />
99-69\SANDAG <strong>EIR</strong><strong>EA</strong> 4.1 to 4.13.wpd 7/17/00
4.4 Biological Resources<br />
portion. In the spring and summer, small waves resulted in the return of sand to the beach and shallow<br />
water area, thus completing the cycle. Cut and fill depths on the order of two to three feet are common<br />
inshore of –25 feet MLLW, and sand depth changes of one-half to one foot are common at depths greater<br />
than –25 feet MLLW.<br />
• Model Interpretation and Conservative Assumptions. The indirect sedimentation analysis is based<br />
on model-predicted, worst-case outputs from the GENESIS model. Input parameters into the model were<br />
conservative with regards to wave energy, gross longshore sediment transport, five year time frame, and<br />
negligible offshore losses except at Scripps Canyon in La Jolla. Worst-case model outputs were<br />
interpreted conservatively with the initial screening based on persistence of project-related sand deposition<br />
for one year or more, regardless of model-predicted sand depth. Finally, worst-case, model-predicted<br />
sand depths were compared to reef heights and resources on that hard substrate to determine the potential<br />
for substantial burial of sensitive resources.<br />
As previously stated, there would be no significant impacts from direct deposition of sand at the receiver<br />
sites. In evaluating indirect sedimentation impacts, the focus was on hard substrate with sensitive resources,<br />
particularly where such resources may experience worst-case, model-predicted persistent sedimentation<br />
of greater relative depth. In general, those locations of greater sand persistence and greater depth<br />
(sedimentation risk) are located where there is an indented shoreline or gradual bathymetry. Less<br />
sedimentation risk would occur at offshore coastlines that curve outward as headlands or have steeper<br />
depth profiles. Locations near receiver sites off South Oceanside, south of North Carlsbad, near<br />
Batiquitos, near Moonlight <strong>Beach</strong>, north of Solana <strong>Beach</strong>, north of Del Mar and offshore Imperial <strong>Beach</strong><br />
are predicted by the model to have a greater risk for sedimentation (depth and duration). The model<br />
indicates that other receiver sites would not have the same risk of indirect sedimentation, specifically South<br />
Carlsbad North, Leucadia, Cardiff, Torrey Pines, and Mission <strong>Beach</strong>.<br />
R<br />
R<br />
Sediment deposition at the Cardiff receiver site is not predicted by the model to have duration of one year<br />
or greater and is therefore not identified with the seven locations above as having greater sedimentation risk<br />
with possible long-term impacts. However, nearby resources were evaluated for potential short-term<br />
impacts. Some sedimentation is predicted by the model to occur offshore the receiver site to a maximum<br />
distance of 1,400 feet from shoreline and to the north toward Cardiff reef. Cardiff reef is a high relief reef<br />
with heights of five to seven feet at the southern edge, closer to shore, and three to four feet further<br />
offshore. Worst-case, model-predicted sand depths of one to two feet would be limited in movement up<br />
and over the reef by its height, and sensitive resources on top of the reef would not be exposed to project-<br />
Page 4.4-30<br />
<strong>Regional</strong> <strong>Beach</strong> <strong>Sand</strong> <strong>Project</strong> <strong>EIR</strong>/<strong>EA</strong><br />
99-69\SANDAG <strong>EIR</strong><strong>EA</strong> 4.1 to 4.13.wpd 7/17/00
4.4 Biological Resources<br />
related sedimentation. There would be no significant indirect sedimentation impact at the Cardiff receiver<br />
site.<br />
The evaluation below describes briefly the potential indirect sedimentation impacts at these six locations<br />
were sedimentation risk (depth and duration) is predicted. A more detailed analysis of each location is<br />
provided in Appendix D.<br />
• Potential Indirect Sedimentation Near South Oceanside. As shown in Figure 4.4-1, a modelpredicted<br />
persistent sediment deposition area would be located offshore the southern end of the receiver<br />
site in a location where commercial fisherman had identified scattered rocks. That area was later mapped<br />
during the side-scan sonar and dive effort and found to contain hard substrate. Two hard substrate areas<br />
in this location (-15 to -25 feet MLLW) have scattered occurrences of sea fans but the heights of the reef<br />
would be above the maximum persistent sedimentation depths and no significant impacts would occur.<br />
Other hard substrates within the area include cobble and rock relief with opportunistic coralline algal turf.<br />
Scattered rocks to the north of Oceanside Boulevard are not considered to be at risk of substantial<br />
sedimentation because model-predicted increases in sand levels are within the historical average resulting<br />
from seasonal variation in sand.<br />
Results of the model predictions exhibit similarity to empirical profile data collected before and after 1983<br />
and 1988 beach replenishment projects. For both of those projects, sedimentation mainly occurred out<br />
from 1,100 to 1,300 feet from the backbeach, and sedimentation was not obvious past 1475 feet from the<br />
backbeach. Similarly, model predictions for this project indicate little sedimentation beyond 1,200 feet<br />
from the backbeach.<br />
• Potential Indirect Sedimentation South of North Carlsbad. Worst-case sedimentation transport from<br />
the North Carlsbad receiver site would be toward the south, and some sedimentation risk is predicted by<br />
the model immediately south of the site (between Oak and Chestnut Avenues), south of Tamarack Avenue,<br />
and south of the discharge jetty for Agua Hedionda Lagoon. Figure 4.4-2 illustrates the biological<br />
resources offshore and just south of the receiver site and Figure 4.4-18 illustrates the resources in those<br />
areas surveyed near the lagoon. Intertidal hard substrate that supports surfgrass is located off Juniper<br />
Avenue (Figure 4.4-2) and south of Cannon Road (Terra Mar) (Figure 4.4-18). Nearshore reef with<br />
various sensitive resources occurs south of the receiver site near Agua Hedionda Lagoon. Historically, kelp<br />
has occurred offshore and further south at depths generally greater than –20 feet MLLW, which is typically<br />
<strong>Regional</strong> <strong>Beach</strong> <strong>Sand</strong> <strong>Project</strong> <strong>EIR</strong>/<strong>EA</strong> Page 4.4-31<br />
99-69\SANDAG <strong>EIR</strong><strong>EA</strong> 4.1 to 4.13.wpd 7/17/00
4.4 Biological Resources<br />
at distances greater than 1,200 feet from the backbeach. Kelp generally has been absent directly offshore<br />
Agua Hedionda Lagoon.<br />
No long-term, significant impacts to intertidal reefs are expected from this alternative because reef heights<br />
generally are above the maximum persistent sand depths at these locations. Several nearshore reefs with<br />
surfgrass occur in the risk area at the southern end of the receiver site (Figure 4.2-2). At three small reefs<br />
with a total area of 0.24 acre, surfgrass may experience partial sedimentation (less than one foot) such that<br />
short-term impacts to growth could occur; however, because the long leaves would extend well above most<br />
of the predicted deposition, there would be no significant, long-term effect. Nearshore reefs with surfgrass<br />
are also located near Tamarack Avenue (Figure 4.4-18) but shallow depositional depths would not result<br />
in significant impacts at this location.<br />
There is one reef location where giant kelp may, under worst-case conditions, experience partial<br />
sedimentation. A 0.73-acre reef just south of the discharge jetty and north of Cannon Road has a sparse<br />
occurrence of giant kelp and sea fans on the higher relief portions of the reef. This location is within the<br />
inshore limit of giant kelp. Maximum worst-case predicted sand cover would be predominantly well below<br />
reef heights, except at the lower parts of the reef where less than four inches is predicted for up to 1.5<br />
years. Given the sensitivity of kelp to sedimentation, there could be partial impacts at the lower portions<br />
of the reef; however, based on the sparseness of kelp cover and its ephemeral nature at this location, the<br />
impact would be less than significant.<br />
Finally, no long-term impacts to sea fans, sea palms or feather boa kelp are anticipated.<br />
• Potential Indirect Impacts Near Batiquitos. Under this alternative, the model predicts sedimentation<br />
risk just south of the lagoon mouth at the Batiquitos receiver site. The nearshore area is cobble with<br />
opportunistic species. No long-term impacts would result since any resources buried would quickly reestablish.<br />
There is a reef complex over 2,000 feet from the back beach at depths greater than -38 feet<br />
MLLW. The complex consists of a larger reef (6.8 acres) that supports sparse amounts of giant kelp,<br />
feather boa and sea fans and a smaller reef (0.5 acre) with sparse kelp (Figure 4.4-4). The reef complex<br />
has heights of zero to 1.5 feet, although most of it is one foot. Furthermore, most of the reef occurs beyond<br />
the depth of closure, which is the seaward limit of normal sand transport. Under worst-case model<br />
predictions, partial sedimentation is indicated for an area of approximately 1.5 acres which is characterized<br />
by sparse giant kelp. Although there maybe some short-term impacts, the overall impact would not be<br />
significant based on the short duration (one and one-half years) of maximum, worst-case predicted<br />
sedimentation and the relatively small amount of reef that would be affected.<br />
Page 4.4-32<br />
<strong>Regional</strong> <strong>Beach</strong> <strong>Sand</strong> <strong>Project</strong> <strong>EIR</strong>/<strong>EA</strong><br />
99-69\SANDAG <strong>EIR</strong><strong>EA</strong> 4.1 to 4.13.wpd 7/17/00
Page 4.4- 33<br />
CHESTNUT AVE<br />
ACACIA AVE<br />
JUNIPER AVE<br />
HEMLOCK AVE<br />
REDWOOD AVE<br />
TAMARACK AVE<br />
CANNON RD<br />
<strong>Sand</strong><br />
Patchy<br />
surfgrass<br />
AGUA HEDIONDA<br />
LAGOON<br />
<strong>Sand</strong><br />
<strong>Sand</strong><br />
Scattered Sea Fans<br />
Patchy surfgrass,<br />
Scattered Feather Boa,<br />
Sea Palms, Sea Fans<br />
Giant Kelp, Sea Fans,<br />
Feather Boa<br />
<strong>Regional</strong> <strong>Beach</strong> <strong>Sand</strong> <strong>Project</strong> <strong>EIR</strong>/<strong>EA</strong><br />
9969 <strong>Beach</strong> Replenishment\Figures\Fig 4.4-13 2/2/00<br />
Source: Mffatt & Nichol Engineers, U.S. Navy, and MEC<br />
NORTH<br />
0<br />
1000 Feet<br />
Kelp<br />
Surfgrass<br />
Low Relief Reef<br />
High Relief Reef<br />
Approximate boundary of model-predicted persistent<br />
sediment deposition area<br />
Figure 4.4-18<br />
Biological Resources Near Agua Hedionda Lagoon in Carlsbad
4.4 Biological Resources<br />
• Potential Indirect Impacts Near Moonlight <strong>Beach</strong>. <strong>Sand</strong> and hard substrate habitats occur in the<br />
vicinity of the Moonlight <strong>Beach</strong> receiver site (Figure 4.4-6). The Encinitas City Marine Life Refuge is<br />
located just south of the receiver site boundary. Refer to Section 3.6. The nearest intertidal hard substrates<br />
that support surfgrass are located north in Leucadia, south of the receiver site off F and G Streets, and<br />
further south off I through K Streets near the surfing sites known as Boneyards and Swami’s. Only the<br />
intertidal surfgrass off F and G Streets is within the map boundaries of Figure 4.4-6.<br />
R<br />
R<br />
Similarly, nearshore reef occurs offshore the receiver site, further north off Leucadia, and further south<br />
towards Swami’s. Historically, kelp has occurred offshore, north, and south of the receiver site at depths<br />
of greater than -20 feet MLLW, which is typically at distances greater than1,200 ft from the backbeach.<br />
The occurrence of kelp directly offshore the receiver site and extending south off H Street has been<br />
characterized by relatively low persistence over the past 30 years.<br />
As shown in Figure 4.4-6, the area of model-predicted persistent deposition is offshore south to I Street.<br />
Under this alternative, sedimentation levels are within the historical average difference in sand depths<br />
resulting from seasonal onshore and offshore migration of sand. Nearly two acres of intertidal reef<br />
consisting of scattered rock with heights ranging from one to four feet occurs near F and G Streets. About<br />
0.6 acres of intertidal surfgrass occurred in several discrete patches (15 feet diameter) on rocks with<br />
heights of two and one-half to four feet at the more seaward portion of the reef (per low tide surveys in<br />
January 2000). These heights are well above the maximum, worst-case persistent sand depth predictions<br />
of 1.1 to 1.5 feet (for average and above average wave conditions, respectively). The nearshore reef with<br />
sparse notation of surfgrass (1 turion per 10 square feet) would also not be overtopped under this<br />
alternative. There would be no long-term significant impact to intertidal or nearshore surfgrass habitat.<br />
Offshore of H and I Streets at depths -15 to -40 feet MLLW there are a variety of low relief reefs with<br />
scattered sea fans, feather boas and at the greatest depths, giant kelp. Predicted sedimentation does not<br />
overtop most of the reefs. Under worst-case model predictions, 0.27 acre of subclimax reef habitat with<br />
sparse feather boa would experience sedimentation for up to two years. This potential impact, under<br />
worst-case model predictions, would not be significant because sediment would not completely cover the<br />
reef, feather boa kelp is tolerant of some sedimentation, and has life characteristics that favor rapid<br />
recolonization. There would be no long-term adverse impact to the Marine Life Refuge.<br />
R<br />
• Potential Indirect Impacts Near Solana <strong>Beach</strong>. <strong>Sand</strong> and reef habitats occur offshore and to the<br />
north and south of the receiver site. Intertidal hard substrate occurs in localized patches north and south<br />
Page 4.4-34<br />
<strong>Regional</strong> <strong>Beach</strong> <strong>Sand</strong> <strong>Project</strong> <strong>EIR</strong>/<strong>EA</strong><br />
99-69\SANDAG <strong>EIR</strong><strong>EA</strong> 4.1 to 4.13.wpd 7/17/00
4.4 Biological Resources<br />
of the receiver site and varies considerably from non-vegetated low relief benches and rock, low relief<br />
vegetated with opportunistic species, to more developed areas that support surfgrass. Intertidal surfgrass<br />
was mapped in January 2000 north of the receiver site at “Pill Box” reef (offshore of Helix Avenue in<br />
Figure 4.4-8), near Tide Park and at “Table Tops” reef (offshore Ocean Street in Figure 4.4-8). Nearshore<br />
hard substrate includes low relief benches that start around the entrance to Fletcher Cove and extend<br />
further north, and higher relief areas near Tide Park and “Table Tops” reef. Nearshore reefs also occur<br />
offshore the southern end of the receiver site and extend further south. Historically, giant kelp has had a<br />
relatively high persistence offshore and north and south of the receiver site at depths greater than -25 feet<br />
MLLW, and less persistence at shallower depths. Kelp canopy was not present in the vicinity of the<br />
receiver site 1999 probably due to El Niño associated losses.<br />
Pill Box reef, which is closest to the site, is not predicted to be a sand depositional area. Less than four<br />
inches of sand above the average profile is predicted under above average wave conditions, and no<br />
measurable persistent sedimentation is predicted under average waves conditions. Predicted sand depths<br />
are well within the range of historical average seasonal differences in sand depth. Furthermore, no<br />
substantial burial of the reef is expected given that predominant relief heights range between one and four<br />
feet. No measurable persistent sedimentation is predicted for the intertidal surfgrass bed at Pill Box reef<br />
and there would be no significant project-related impact.<br />
No measurable persistent sedimentation is predicted for intertidal surfgrass beds located near Tide Park<br />
or at Table Tops reef. Similarly, nearshore reef and historic kelp bed areas near Tide Park and Table Tops<br />
reef are predicted to receive negligible (about two inches) or no persistent sedimentation. Additionally, no<br />
persistent sedimentation is predicted for intertidal, nearshore reef, and historic kelp bed areas offshore and<br />
to the south of the receiver site. Impacts to these resources at these locations would, accordingly, be less<br />
than significant.<br />
As is seen in Figure 4.4-8, the nearshore area is characterized by numerous reefs, some with vegetation<br />
and some without. As with all the nearshore zone, habitat at this location is subject to the dynamic forces<br />
of nature. Areas that were obscured by kelp in January 2000 during the side-scan sonar survey were found<br />
to be almost void of kelp when divers surveyed the same area in March 2000. Storms had removed much<br />
of the kelp from the nearshore reef and only a few giant kelp plants had scattered occurrence on reefs less<br />
than -25 feet MLLW. The winter reef heights range from one to two feet (mainly one and one-half foot)<br />
and summer heights would be expected to be approximately one foot higher based on the historical average<br />
differences in sand depths between winter and summer seasons. Model-predicted, worst-case sediment<br />
<strong>Regional</strong> <strong>Beach</strong> <strong>Sand</strong> <strong>Project</strong> <strong>EIR</strong>/<strong>EA</strong> Page 4.4-35<br />
99-69\SANDAG <strong>EIR</strong><strong>EA</strong> 4.1 to 4.13.wpd 7/17/00
4.4 Biological Resources<br />
depths under this alternative would be under the heights of the reefs at this location and there would be no<br />
significant impacts to remaining vegetation.<br />
Partial sedimentation is, however, predicted under worst-case conditions at two areas supporting giant kelp<br />
in deeper water. These two substrate locations are located between -25 and -35 feet MLLW offshore of<br />
Pill Box reef, adjacent to, but not within, the areas of more persistent kelp as indicated by the 1997 kelp<br />
canopy in Figure 4.4-8. These two substrate areas consist of both sparse juveniles and giant kelp and total<br />
just over one acre. Based on the worst-case model predictions, these two reefs would receive partial<br />
sedimentation, not burial, for no more than one year under above average wave conditions. The temporary<br />
loss of kelp in non-persistent kelp bed areas would not be a significant impact. Substantial, persistent<br />
sedimentation is not predicted for the more offshore, historical kelp beds as indicated by the 1997 kelp<br />
cover in Figure 4.4-8 and there would be no significant impact at these locations.<br />
• Potential Indirect Impacts North of Del Mar. <strong>Sand</strong> is the predominant habitat in the vicinity of the<br />
Del Mar receiver site. Historic kelp bed locations indicate that most hard substrate is located further south<br />
of the receiver site. Commercial fisherman indicate scattered rocks south of the site at depths of<br />
approximately -25 feet MLLW, but the 1997 historic kelp canopy does not enter into the area mapped<br />
in Figure 4.4-9. Intertidal surfgrass is located south of 15 th Street, which indicates hard substrate as well.<br />
The nearest hard substrate to the north includes commercial fishermen identified areas of scattered rock<br />
near the mouth of San Dieguito Lagoon, historic kelp bed areas north of the lagoon, and intertidal and<br />
nearshore reef north of the lagoon. The identified scattered rock off the lagoon mouth was surveyed in<br />
February and March 2000 and the mapped hard substrate is shown in 4.4-9.<br />
Under worst-case model predictions, the only areas of hard substrate with sediment risk are the scattered<br />
rock locations identified by commercial fishermen. All hard substrates within this area included cobble and<br />
rock relief without sensitive resources. They are vegetated only with opportunistic species such as coralline<br />
algal turf. Given the lack of sensitive species, there would be no significant indirect impacts at this location.<br />
Intertidal and nearshore reef areas to the north off San Dieguito Lagoon and to the south of the receiver<br />
site are not predicted to be at risk from substantial sedimentation. Intertidal surfgrass beds located south<br />
between the Del Mar and Torrey Pines receiver sites (not shown in mapped boundary of Figure 4.4-9) are<br />
predicted to experience shallow sedimentation (less than one-half foot) under above average wave<br />
conditions, but not under average wave conditions. That level of sedimentation would not be expected to<br />
result in any long-term significant impacts to the surfgrass beds because they occur on higher relief reef.<br />
Page 4.4-36<br />
<strong>Regional</strong> <strong>Beach</strong> <strong>Sand</strong> <strong>Project</strong> <strong>EIR</strong>/<strong>EA</strong><br />
99-69\SANDAG <strong>EIR</strong><strong>EA</strong> 4.1 to 4.13.wpd 7/17/00
4.4 Biological Resources<br />
Additionally, no measurable sedimentation is predicted for historic kelp bed locations to the north or south<br />
of the receiver site.<br />
• Potential Indirect Impacts at Imperial <strong>Beach</strong>. <strong>Sand</strong> is the predominant habitat offshore Imperial <strong>Beach</strong><br />
(Figure 4.4-12). Kelp have historically occurred offshore with low to moderate persistence at depths of<br />
-20 to -35 MLLW which is at a minimum of 1,900 feet from the shoreline of Imperial <strong>Beach</strong>.<br />
A maximum persistent depths of cover less than four inches is predicted for distances ranging from<br />
approximately 1,900 to 2,300 feet offshore for one year (Figure 4.4-12). After the first year, maximum<br />
persistent predicted sand is one inch. These estimates of sedimentation are within the historical average<br />
differences in sand depth between winter and summer profiles at these distances offshore and there would<br />
be no significant impact.<br />
• Summary of Conclusion, Indirect Sedimentation Impacts. In conclusion, based on worst-case model<br />
predictions, partial sedimentation could occur to hard substrate with indicator species near four receiver<br />
sites: North Carlsbad, Batiquitos, Moonlight <strong>Beach</strong>, and Solana <strong>Beach</strong>. A total of 3.2 acres with giant kelp<br />
could experience partial sedimentation off of North Carlsbad (0.73 acres), near Batiquitos (1.46 acres),<br />
and near Solana <strong>Beach</strong> (1.05 acres). The impact is considered to be less than significant because the kelp<br />
is generally sparse and located in a non-persistent kelp area. A 0.27 acre reef off Moonlight <strong>Beach</strong> is<br />
predicted by the model to experience partial sedimentation and it contains a subclimax community of sparse<br />
feather boa. Impacts would be less than significant in the long-term because sedimentation would not<br />
overtop the reef and feather boa is characterized by rapid re-colonization. Finally, three small reefs totaling<br />
0.24 acre, with some surfgrass, off of North Carlsbad may experience partial sedimentation under worstcase<br />
conditions. This impact would also be less than significant because it is predicted to affect only one<br />
growing season and the leaves would be well above the sand deposition levels, allowing for long-term<br />
recovery.<br />
Borrow Sites<br />
Potential impacts to marine resources would be related to the dredge itself (direct and indirect) and<br />
placement of the dredge equipment (pipelines, etc.). The following section addresses these impacts in that<br />
order.<br />
<strong>Regional</strong> <strong>Beach</strong> <strong>Sand</strong> <strong>Project</strong> <strong>EIR</strong>/<strong>EA</strong> Page 4.4-37<br />
99-69\SANDAG <strong>EIR</strong><strong>EA</strong> 4.1 to 4.13.wpd 7/17/00
4.4 Biological Resources<br />
Direct Impacts of Dredging<br />
Approximately 330 acres of surface area would be needed to provide 2 million cy of sediment for<br />
Alternative 1a from Oceanside to Imperial <strong>Beach</strong>. There are approximately 53 miles of coastline with a<br />
variable shelf width at depths of 40 to 80 feet, or about 0.6 mile offshore. For this alternative, this acreage<br />
represents less than two percent of the available shelf habitat. If SO-7 is expanded and SO-9/SO-6 are<br />
eliminated, the surface area would be approximately 318 acres which is slightly less overall. There would<br />
be no change to the impact conclusion regarding direct impacts.<br />
R<br />
R<br />
R<br />
The dredging of sand sediments from the borrow sites would impact marine biota by the direct removal of<br />
the organisms and alteration of habitat. All of the benthic infauna, epifaunal, and demersal organisms in the<br />
area of excavation would be displaced or destroyed. The extent of the loss and/or displacement is directly<br />
proportional to the area and amount of sediment removed at each site. As discussed in Section 3.4, the<br />
infaunal and epifaunal communities within the dredge areas consist of broadly distributed species and none<br />
would be significantly reduced at the population level from the loss of individuals within the dredge areas.<br />
Mobile epibenthic macroinvertebrates and fish would be expected to move from areas being actively<br />
dredged, but these species would not be lost to the ecosystem nor would migration patterns be affected.<br />
This would be considered an adverse impact, but not significant.<br />
Epibenthic invertebrates and fishes that feed upon benthic biota would suffer a localized, short-term loss<br />
of prey. However, because the active area being dredged would be small and localized, short-term loss<br />
of food on these organisms is judged to be adverse, but not significant.<br />
Dredging at borrow sites would also have some beneficial aspects because many of the infaunal organisms<br />
recruit rapidly to disturbed and newly exposed sediments. This produces heterogeneity in the environment,<br />
which can contribute to increased biodiversity of the community. Furthermore, most epibenthic<br />
invertebrates and demersal fish are opportunistic in their feeding. They could be attracted to disturbed<br />
areas where feeding opportunities may be increased by dredging activity.<br />
Concern has been expressed that borrow site excavations have the potential to trap organic material and<br />
drift kelp. The accumulation and decay of excessive organic material could lead to altered water quality<br />
parameters and possibly degraded benthic biota. However, these concerns have proven to be unfounded<br />
for open coastal areas and in harbors with good tidal flushing (Appendix D). All of the borrow sites are<br />
Page 4.4-38<br />
<strong>Regional</strong> <strong>Beach</strong> <strong>Sand</strong> <strong>Project</strong> <strong>EIR</strong>/<strong>EA</strong><br />
99-69\SANDAG <strong>EIR</strong><strong>EA</strong> 4.1 to 4.13.wpd 7/17/00
4.4 Biological Resources<br />
within open coastal areas and the potential for material trapping would be low. The impact would be less<br />
than significant.<br />
Indirect Impacts of Dredging<br />
As discussed in Section 4.3, dredging of the borrow sites would cause localized turbidity plumes. Indirect<br />
impacts may occur if turbidity plumes and siltation affect sensitive resources beyond the boundaries of the<br />
dredge areas. Turbidity results from suspended particles in the water column that can reduce ambient light<br />
levels and lead to siltation. Turbidity can have a number of adverse effects on marine biota. Turbidity can<br />
reduce ambient light levels in the water, which can impact primary production of plankton and inhibit kelp<br />
and algae recruitment and growth. Turbidity can also affect the feeding efficiency of filter feeding organisms,<br />
including zooplankton.<br />
The location and footprint of the dredge area for each borrow site has been designed to minimize both<br />
direct and indirect impacts from the dredging operations. A minimum 500 foot buffer has been provided<br />
between the dredge area and kelp or reef, except at SO-7 where there is one artificial reef approximately<br />
350 feet distant. Table 4.3-1 provides estimates of the average turbidity plumes from each borrow site,<br />
assuming the hopper dredge which is the worst-case condition for generating turbidity. As shown, they<br />
would range from an estimated 72 to 544 feet and average about 260 feet. The borrow sites with higher<br />
sand content (SO-7, MB-1 and SS-1) would generally have the smaller plumes. The plume estimates and<br />
the nearby known resources of reefs and kelp (Table 3.4-6) were used to evaluate the potential indirect<br />
impacts for each of the borrow sites. A detailed analysis by borrow site is provided in Appendix D;<br />
however, since the impact conclusions would be identical for all sites, only a summary is provided in this<br />
document.<br />
In general, turbidity plumes from the borrow site are predicted to be small for this project as the sands to<br />
be dredged are sandy sediments with low percentages of fines. All reefs and kelp would be beyond the<br />
estimated length of average turbidity plumes. Site SO-6 would be the closest to any resources with<br />
nearshore reefs approximately 500 feet distant and historical kelp shown as 500 feet distant. Kelp mapping<br />
conducted in 1999 shows the nearest kelp was 3,000 feet away. While the probability for some turbidity<br />
to occasionally reach reefs and/or kelp cannot be entirely eliminated, turbidity is a natural occurrence at<br />
these sites. The artificial reefs at all borrow sites naturally experience increased turbidity from storms, rip<br />
currents, and plumes from river and harbor discharges. Therefore, even though there is some potential for<br />
turbidity plumes to reach reefs, the duration would be limited, and the actually amount of turbidity reaching<br />
<strong>Regional</strong> <strong>Beach</strong> <strong>Sand</strong> <strong>Project</strong> <strong>EIR</strong>/<strong>EA</strong> Page 4.4-39<br />
99-69\SANDAG <strong>EIR</strong><strong>EA</strong> 4.1 to 4.13.wpd 7/17/00
4.4 Biological Resources<br />
the area would be expected to be within the range that these resources would naturally experience. Indirect<br />
turbidity impacts would be less than significant.<br />
Dredge Equipment Impacts<br />
The placement of temporary pipelines, the deployment of anchors for moving the cutterhead dredge,<br />
installation of the mono buoy for the hopper dredge, and vessel movements have the potential to affect<br />
sensitive resources. To avoid significant impacts to sensitive resources (i.e., reef habitat with well<br />
developed biota, kelp and kelp habitat, artificial reefs, and surfgrass) pipeline routes and vessel traffic need<br />
to utilize corridors free from these resources. Similarly, anchor and anchor cables used to position the<br />
dredge and to hold pipelines in place must avoid hard bottom habitats, kelp beds, and surfgrass. This is also<br />
good operational practice, as anchors do not hold well on hard bottom. The relationship between<br />
proposed sensitive resources and features at each borrow site is provided below.<br />
SO-9. The proposed pipeline route for this borrow site extends about 10,500 feet south from the borrow<br />
site about 3,000 feet south of the Oceanside Harbor and San Luis Rey River mouth where the pipeline<br />
would then turn to the east and extend about 7,500 feet to the beach. If a hopper dredge is used, the mono<br />
buoy would be located in water depths between 30 to 40 feet located between 2,600 and 4,500 feet,<br />
respectively from the shore. There are no sensitive resources near the proposed pipeline pathway (Table<br />
3.4-6). Commercial fishermen have indicated that there may be an isolated patch reef/scattered rock near<br />
the pipeline route at about the –25-foot depth contour. If this reef exists at the indicated location, then<br />
anchoring and emplacement of the mono buoy would need to avoid this reef with a 300-foot buffer zone.<br />
No significant impacts are expected from the emplacement of temporary pipelines and mono buoy at this<br />
location.<br />
SO-7. There are two pipeline routes proposed for this site to replenish several receiver beaches. For the<br />
South Carlsbad North site, the pipeline would run about 3,000 feet and go directly from the eastern area<br />
of the borrow site to the beach just upcoast from the Batiquitos Lagoon. Sensitive resources in this area<br />
includes a series of artificial reefs located along the eastern edge and inshore of the borrow site (Table 3.4-<br />
6 and Figure 2-16). The locations of these reefs are known and all anchoring activities would have to avoid<br />
these reefs. Near the shoreline where the submerged portion of the pipeline would be placed there are low<br />
lying reefs and some potential surfgrass as identified by commercial fishermen. The pipeline has been<br />
routed so as to go between the low lying reefs and be just south of the potential surfgrass area. If a hopper<br />
dredge were used, the mono buoy would be located in water depths between 30 and 40 feet, which lies<br />
Page 4.4-40<br />
<strong>Regional</strong> <strong>Beach</strong> <strong>Sand</strong> <strong>Project</strong> <strong>EIR</strong>/<strong>EA</strong><br />
99-69\SANDAG <strong>EIR</strong><strong>EA</strong> 4.1 to 4.13.wpd 7/17/00
4.4 Biological Resources<br />
between 1,500 and 1,875 feet from the shoreline, respectively. The location of the mono buoy could be<br />
near the northern most artificial reef. The location for the mono buoy needs to be carefully positioned so<br />
that all anchoring activities, both for the hopper dredge and for the installation of the mono buoy, avoids<br />
these artificial reefs by at least 350 feet. No significant impacts are expected for the emplacement of<br />
temporary pipelines and mono buoy at this location.<br />
The second pipeline for this site would run from the eastern corner of the dredge area and run about 3,000<br />
feet and go directly onshore to a location just south of the Batiquitos Lagoon. Sensitive resources near this<br />
pipeline route include kelp and kelp habitat to the south, artificial reefs inshore and to the north, and<br />
potential surfgrass habitat located south of the pipeline along the shoreline (Table 3.4-6). The pipeline<br />
location has been selected to avoid direct impacts to these resources and all anchoring activities would have<br />
to avoid these resources. Vessel traffic would have to avoid transits through the kelp or across the CDFG<br />
artificial reefs and anchoring of the dredge would have to avoid placing anchors in the kelp beds (refer to<br />
Section 2.4.1 and Table 2-8). If a hopper dredge were to be used, then the location of the mono buoy<br />
would be in water depths of between 30 and 40 feet located between 1,500 and 1,875 feet from the<br />
shoreline, respectively. This location would be south of the artificial reefs and all anchoring activities<br />
associated with mooring the hopper dredge and installing the mono buoy would have to avoid these reefs.<br />
The hopper dredge would be conditioned to avoid transiting over the CDFG reefs, either empty or full.<br />
Thus, no significant impacts are expected for the emplacement of temporary pipelines and mono buoy at<br />
this location.<br />
R<br />
R<br />
R<br />
R<br />
R<br />
R<br />
R<br />
R<br />
R<br />
SO-6. The pipeline for this borrow site would go about 3,000 feet directly onshore from the borrow site<br />
to the Cardiff beach. Sensitive resources and possible constraints include kelp and kelp habitats inshore<br />
and to the north and the San Elijo outfall pipeline located to the south (Table 3.4-6). The proposed pipeline<br />
route would avoid kelp habitat and reefs and run parallel to the outfall pipeline. Vessel traffic would have<br />
to avoid transits through the kelp and anchoring of the dredge would have to avoid placing anchors in the<br />
kelp beds. If a hopper dredge were to be used, then the location of the mono buoy would be in water<br />
depths of between 30 and 40 feet located between 1,680 and 2,440 feet from the shoreline, respectively.<br />
This location would be south of the kelp and reefs and north of the outfall pipeline. All anchoring activities<br />
associated with mooring the hopper dredge and installing the mono buoy would have to avoid kelp habitat<br />
and the outfall pipeline. No significant impacts are expected for the emplacement of temporary pipelines<br />
and mono buoy at this location.<br />
<strong>Regional</strong> <strong>Beach</strong> <strong>Sand</strong> <strong>Project</strong> <strong>EIR</strong>/<strong>EA</strong> Page 4.4-41<br />
99-69\SANDAG <strong>EIR</strong><strong>EA</strong> 4.1 to 4.13.wpd 7/17/00
4.4 Biological Resources<br />
SO-5. There are two pipeline routes proposed for this site to replenish three receiver beaches. For the<br />
Solana <strong>Beach</strong> site, the pipeline would run about 7,500 feet and go from the northeastern corner running<br />
northeast between the Solana <strong>Beach</strong> kelp beds and then turn east to the beach near Plaza Street. Sensitive<br />
resources in this area include kelp beds and kelp habitat and in the nearshore area there are reefs and<br />
surfgrass (Table 3.4-6). Even though these resources are mapped, the final location of the pipeline and<br />
anchor placements would need to avoid kelp beds, vegetated reefs, and surfgrass resources. Near the<br />
shoreline, where the submerged portion of the pipeline would be placed, there are low lying reefs and some<br />
surfgrass. The pipeline has been routed to go between the mapped kelp beds and avoid vegetated reefs<br />
and surfgrass areas. Vessel traffic would have to use corridors between the kelp bed and would not be<br />
allowed to transit through the kelp bed.<br />
If a hopper dredge were used, the mono buoy would be located in water depths between 30 and 40 feet,<br />
which lies between 1,875 and 2,625 feet from the shoreline, respectively. The location of the mono buoy<br />
would have to be inshore of the kelp bed and all anchoring activities, both for the hopper dredge and for<br />
the installation of the mono buoy, would have to avoid kelp, kelp habitat, and reefs. The recovery of the<br />
kelp beds from the recent El Niño has been rapid and aided by the colder than normal winter water<br />
temperature. It is possible that the kelp beds may be too extensive to allow hopper dredge use at this site.<br />
Final decision for selection of dredge type for this site may need to be postponed until the start of the<br />
dredging when a kelp bed reconnaissance would be recommended. No significant impacts are expected<br />
for the emplacement of temporary pipelines and mono buoy at this location.<br />
The second pipeline for this site would run from the southeast corner of the dredge area and run about<br />
4,000 feet and go directly onshore to a location at about 18th Street in Del Mar. Sensitive resources near<br />
this pipeline route include possible kelp, low lying mud reefs to the south, and possible surfgrass to the north<br />
near the shoreline (Table 3.4-6). The pipeline location has been selected to avoid these resources and all<br />
anchoring activities would have to avoid these resources. If the kelp bed inshore of the borrow site is<br />
present then the pipeline route would need to be altered to avoid kelp beds. Vessel traffic would have to<br />
avoid transits through the kelp and anchoring of the dredge would have to avoid placing anchors in the kelp<br />
beds.<br />
If a hopper dredge were to be used, then the location of the mono buoy would be in water depths of<br />
between 30 and 40 feet located between 1,875 and 2,625 feet from the shoreline, respectively. This<br />
location would be south of the potential surfgrass area and north of the reefs and all anchoring activities<br />
associated with mooring the hopper dredge and installing the mono buoy would have to avoid these reefs<br />
Page 4.4-42<br />
<strong>Regional</strong> <strong>Beach</strong> <strong>Sand</strong> <strong>Project</strong> <strong>EIR</strong>/<strong>EA</strong><br />
99-69\SANDAG <strong>EIR</strong><strong>EA</strong> 4.1 to 4.13.wpd 7/17/00
4.4 Biological Resources<br />
and surfgrass areas. No significant impacts are expected for the emplacement of temporary pipelines and<br />
mono buoy at this location.<br />
MB-1. The pipeline from the Mission Bay borrow site would run from the eastern edge of the dredge area<br />
and run about 4,500 feet directly onshore (Figure 2-19). There are no nearby sensitive resources and the<br />
nearest resources are artificial reefs located over 1,000 feet from the proposed pipeline route (Table 3.4-<br />
6). If a hopper dredge is used the mono buoy would be located in water depths between 30 to 40 feet<br />
located between 1,875 and 3,000 feet, respectively from the shore. No significant impacts are expected<br />
from the emplacement of temporary pipelines and mono buoy at this location.<br />
SS-1. The pipeline from the Imperial <strong>Beach</strong> borrow site would run from the northeastern edge of the<br />
dredge area and run about 6,000 feet northeast to the beach (Figure 2-20). There are no nearby sensitive<br />
resources and the nearest resources are kelp beds located over 3,000 feet to the north (Table 3.4-6). If<br />
a hopper dredge is used the mono buoy would be located in water depths between 30 to 40 feet located<br />
between 2,400 and 4,875 feet, respectively, from the shore. No significant impacts are expected from the<br />
emplacement of temporary pipelines and mono buoy at this location.<br />
Mitigation Measures for Alternative 1a<br />
In designing the <strong>Regional</strong> <strong>Beach</strong> <strong>Sand</strong> <strong>Project</strong> measures were taken to minimize impacts to biological<br />
resources and avoid sensitive habitat areas. Pre-design field surveys were conducted to identify the least<br />
sensitive areas for sand borrowing and placement. The selection of borrow sites and receiver beaches; the<br />
placement of buoys, anchors, and pipelines; the selection of methods and equipment for dredging and<br />
deposition of sand; and the establishment of buffer zones to protect sensitive areas were all specifically<br />
selected to minimize biological impacts. Where potentially significant impacts were identified (i.e., impacts<br />
to grunion spawning due to sand placement), measures were developed and incorporated into project<br />
design to reduce these impacts to below a level of significance. Further project design features may be<br />
negotiated with the USFWS as part of the Section 7 process including scheduling selected sites early in or<br />
advance of nesting season and predator control.<br />
R<br />
R<br />
R<br />
Although no significant impacts to sensitive marine resources are anticipated at the receiver sites or at<br />
nearby locations where worst-case sedimentation risk has been predicted by the model, monitoring would<br />
be implemented as described in Section 2.5 to verify that significant impacts do not occur. The monitoring<br />
program would be effective from the date of issuance of an USACOE permit and four years after<br />
<strong>Regional</strong> <strong>Beach</strong> <strong>Sand</strong> <strong>Project</strong> <strong>EIR</strong>/<strong>EA</strong> Page 4.4-43<br />
99-69\SANDAG <strong>EIR</strong><strong>EA</strong> 4.1 to 4.13.wpd 7/17/00
4.4 Biological Resources<br />
replenishment to confirm that sand discharge operations would not result in long-term, net loss of sensitive<br />
marine resources. The final monitoring plan and subsequent monitoring would be conducted by a biologist<br />
familiar with southern California marine waters and biological habitats. SANDAG would submit the final<br />
monitoring plan to the USACOE for approval, in consultation with the resource agencies, at least 15<br />
working days prior to initiating onshore discharge at the receiver sites. The monitoring reports would be<br />
submitted to the USACOE and resource agencies by January 30 th of each year.<br />
SANDAG would mitigate any significant, long-term adverse impacts to sensitive marine resources that<br />
were documented by the monitoring effort to have resulted from discharge activities via restoration or<br />
creation of like habitat at a 1:1 ratio as described in Section 2.5. A “not-to-exceed” cap on mitigation costs<br />
would be negotiated by SANDAG, similar to the previously permitted Navy Homeporting project.<br />
Impacts of Alternative 1b<br />
Under Alternative 1b, the proposed action would be implemented at the same 12 receiver sites using the<br />
same six borrow sites as described for Alternative 1a. The differences would be: 1) under Alternative 1b,<br />
the duration on site at several of the borrow and receiver sites would be extended due to the required<br />
adherence to noise ordinances, and 2) the quantity of sand dredged and deposited on the beaches would<br />
be less for the South Oceanside, North Carlsbad, Solana <strong>Beach</strong>, Del Mar, Torrey Pines, Mission <strong>Beach</strong>,<br />
and Imperial <strong>Beach</strong> sites.<br />
Receiver Sites<br />
Direct impacts resulting from implementation of Alternative 1b would be similar to those identified for<br />
Alternative 1a, as all receiver sites would be the same for both alternatives. The quantity of sand deposited<br />
on the beaches would be less for the South Oceanside, North Carlsbad, Solana <strong>Beach</strong>, Del Mar, Torrey<br />
Pines, Mission <strong>Beach</strong>, and Imperial <strong>Beach</strong> sites. Given the smaller quantity of sand, either the thickness<br />
of the sand would be less, or the length would decrease. There would be no significant direct impacts<br />
under Alternative 1a, and less sand would not result in any direct impacts beyond those previously<br />
discussed.<br />
Indirect impacts resulting from sediment transport related to movement of sands from the fill sites, and the<br />
decreases in marine water quality associated with beach replenishment activities were analyzed in detail<br />
under Alternative 1a. The quantity of sand deposited on the beaches would be less for the South<br />
Page 4.4-44<br />
<strong>Regional</strong> <strong>Beach</strong> <strong>Sand</strong> <strong>Project</strong> <strong>EIR</strong>/<strong>EA</strong><br />
99-69\SANDAG <strong>EIR</strong><strong>EA</strong> 4.1 to 4.13.wpd 7/17/00
4.4 Biological Resources<br />
Oceanside, North Carlsbad, Solana <strong>Beach</strong>, Del Mar, Torrey Pines, Mission <strong>Beach</strong>, and Imperial <strong>Beach</strong><br />
sites, therefore, fewer relative impacts would be anticipated at these locations. No additional indirect<br />
impacts beyond those previously discussed under Alternative 1a would be anticipated.<br />
Borrow Sites<br />
Under Alternative 1b, less sand would be dredged from borrow sites SO-9, SO-5, MB-1, and SS-1, as<br />
smaller quantities would be deposited at the corresponding receiver sites. Under this alternative, it is<br />
possible that the same underwater surface area would be affected, less than two percent of the shelf-area,<br />
but dredged at a shallower depth. Alternatively, less surface area could be dredged at the same depths.<br />
Either impact would be less than significant. The borrow sites would not be degraded as a result of the<br />
proposed action because the impacted area is small and the biota appears to recover quickly from physical<br />
alterations. As with Alternative 1a, there would be no significant indirect turbidity impacts from activity at<br />
the borrow sites.<br />
Mitigation Measures for Alternative 1b<br />
As with Alternative 1a, there would be no direct or indirect significant impacts to marine resources;<br />
however, SANDAG would implement a monitoring program for verification. That program is described<br />
in Section 2.5. If significant, long-term adverse impacts to marine resources are documented by the<br />
monitoring effort resulting from project discharge activities, then restoration or creation of like habitat at 1:1<br />
ratio would be implemented as described in Section 2.5. A “not-to-exceed” cap on mitigation costs would<br />
be negotiated by SANDAG, similar to the previously permitted Navy Homeporting project.<br />
4.4.3 Alternative 2<br />
Impacts of Alternative 2a<br />
Receiver Sites<br />
As with Alternative 1, the construction of receiver sites would directly impact marine life by burying<br />
organisms within the footprint of the fill. As concluded in that alternative, where direct placement would<br />
affect sand, cobble, or seasonal hard substrate, the impact would be less than significant due to rapid<br />
recolonization of affected species, and because of project design features which would avoid impacts to<br />
<strong>Regional</strong> <strong>Beach</strong> <strong>Sand</strong> <strong>Project</strong> <strong>EIR</strong>/<strong>EA</strong> Page 4.4-45<br />
99-69\SANDAG <strong>EIR</strong><strong>EA</strong> 4.1 to 4.13.wpd 7/17/00
4.4 Biological Resources<br />
California grunion where they may occur. In Alternative 2, there would be one new receiver site (South<br />
Carlsbad South) and the size of the footprints would increase at the South Oceanside, South Carlsbad<br />
North, Torrey Pines, Mission <strong>Beach</strong> and Imperial <strong>Beach</strong> receiver sites. Other receiver sites would be<br />
eliminated and there would be no direct impacts at the North Carlsbad, Batiquitos, Leucadia, or Moonlight<br />
<strong>Beach</strong> receiver sites.<br />
Direct Impacts of <strong>Sand</strong> Placement<br />
The potential effects at new or larger sites under this alternative are discussed below.<br />
South Oceanside/Torrey Pines/Mission <strong>Beach</strong>/Imperial <strong>Beach</strong>. All of these receiver sites are<br />
characterized by sand and/or sand and cobble in the larger footprint areas and greater fill quantities (refer<br />
to Section 2.4). Direct impacts to marine resources would be identical, that is, less than significant.<br />
South Carlsbad South. This receiver site would have a footprint of approximately 15 acres for<br />
approximately 142,000 cy. <strong>Sand</strong> and cobble occur throughout the site. A localized hard substrate area,<br />
approximately 185 feet in length, consisting of low relief rocks and bench with opportunistic coralline turf<br />
algae and few marine resources occurs within the proposed toe of the slope of the fill (Figure 4.4-19).<br />
Similar to the Solana <strong>Beach</strong> site, direct impacts would be less than significant, because the hard bottom<br />
area lacks sensitive species and clearly experiences normal sediment activity. Significant direct impacts to<br />
California grunion would be avoided.<br />
Indirect Impacts<br />
Under Alternative 2, the receiver sites at North Carlsbad and within the northern portion of the City of<br />
Encinitas (excluding Cardiff) would not undergo replenishment. Receiver sites at South Oceanside, Torrey<br />
Pines, Mission <strong>Beach</strong> and Imperial <strong>Beach</strong> would receiver more sand. The receiver site at South Carlsbad<br />
South would receive sand that it would not receive under Alternative 1. The pattern of sand placement<br />
would not change the significance conclusions regarding temporary reduction in foraging prey for shorebirds<br />
or turbidity at receiver sites; indirect impacts would be less than significant. There would be relative<br />
differences; however, because there would be no temporary prey reductions or turbidity at those locations<br />
where sand would not be placed.<br />
Page 4.4-46<br />
<strong>Regional</strong> <strong>Beach</strong> <strong>Sand</strong> <strong>Project</strong> <strong>EIR</strong>/<strong>EA</strong><br />
99-69\SANDAG <strong>EIR</strong><strong>EA</strong> 4.1 to 4.13.wpd 7/17/00
<strong>Regional</strong> <strong>Beach</strong> <strong>Sand</strong> <strong>Project</strong> <strong>EIR</strong>/<strong>EA</strong><br />
9969 <strong>Beach</strong> Replenishment\Figures\Fig 4.4-14 2/2/00<br />
Page 4.4-47<br />
Source: Moffatt & Nichol Engineers, U.S. Navy and MEC<br />
NORTH<br />
0<br />
500 Feet<br />
Figure 4.4-19<br />
South Carlsbad South Biological Resources
4.4 Biological Resources<br />
The variation in sand replenishment would also have a relative difference in potential indirect sediment<br />
transport impacts, although there would be no significant indirect sedimentation impacts to marine resources<br />
under Alternative 2. The key difference under Alternative 2 would be the change in the patterns of potential<br />
sedimentation risk. Under Alternative 1, areas of greater sedimentation risk were identified off South<br />
Oceanside, south of North Carlsbad, near Batiquitos, near Moonlight <strong>Beach</strong>, north of Solana <strong>Beach</strong>, north<br />
of Del Mar, and off Imperial <strong>Beach</strong>. Each of these same areas is addressed below to allow for comparison<br />
of alternatives. There would be no measurable sedimentation at resources near the South Carlsbad South<br />
receiver site, and it is not discussed further in this text (Appendix D). Indirect sediment impacts at Torrey<br />
Pines, Mission <strong>Beach</strong> and Imperial <strong>Beach</strong> would not be significant even with the greater quantity of sand<br />
associated with this alternative (refer to the 3 million cy analysis at these three receiver sites in Appendix<br />
D).<br />
It should be noted that this complete alternative is not evaluated in Appendix D. The three southern-most<br />
sites are identical to the 3 million cy alternative that is evaluated in Appendix D. Other significance<br />
conclusion are based on predicted patterns as derived from the 2 million cy analysis in Appendix D,<br />
professional judgement and worst-case assumptions. The intent is to provide full disclosure of the potential<br />
worst-case indirect impacts.<br />
Potential Indirect Sedimentation Impacts Near Oceanside. Marine resources near South Oceanside<br />
are limited as most of the nearshore area is sand. <strong>Sand</strong> was mapped previously by the Navy at -10, -20<br />
and -30 isobaths (Department of the Navy 1997a, 1997b). Isolated scattered rock identified by<br />
commercial fisherman have been verified in one location; specifically, at the southern end of the receiver<br />
site where worst-case sedimentation risk was predicted by the model for Alternative 1. Under Alternative<br />
2, the amount of sand would be greater than under Alternative 1 but the receiver site would be 5,600 feet<br />
longer (over one mile to the north) and the beach width after sand placement would be 60 feet narrower.<br />
While the replenishment material would enter the seasonal sand cycle and result in some indirect<br />
sedimentation, the indirect impact would not be any greater than assumed under Alternative 1. This is<br />
because the material on the narrower, longer beach would be relatively less exposed to the dynamic system<br />
and would not erode as fast. Also, it would be spread further north and would not likely result in<br />
sedimentation risks greater than those identified under Alternative 1 (Moffatt & Nichol 2000d).<br />
Mapped hard substrate is primarily cobble and rock relief with no sensitive species. Two locations with<br />
scattered sea fans are at the model-predicted seaward edge of the area of higher sedimentation risk.<br />
Empirical data from replenishment projects in 1983 and 1988 indicate no obvious sedimentation at the<br />
Page 4.4-48<br />
<strong>Regional</strong> <strong>Beach</strong> <strong>Sand</strong> <strong>Project</strong> <strong>EIR</strong>/<strong>EA</strong><br />
99-69\SANDAG <strong>EIR</strong><strong>EA</strong> 4.1 to 4.13.wpd 7/17/00
4.4 Biological Resources<br />
distances where hard substrate is either mapped or indicated by commercial fisherman. The indirect<br />
sediment impacts under this alternative would be the less than significant.<br />
Potential Indirect Sedimentation Impacts Near North Carlsbad. Under Alternative 2, there would be<br />
no replenishment at the North Carlsbad receiver site, but a greater amount would be placed at the South<br />
Oceanside receiver site and that greater amount would be configured differently. Under Alternative 1, the<br />
total replenishment amount at South Oceanside and North Carlsbad would be 620,000 cy, while under<br />
Alternative 2 the total would be 570,000. Sediment transport would continue to be toward the south,<br />
although 50,000 cy less sand would be introduced to the system overall, that sand would be less likely to<br />
erode from the South Oceanside receiver sites at as fast a rate and it would have farther to travel to reach<br />
the North Carlsbad sediment risk area. While the potential for worst-case, indirect sedimentation would<br />
certainly be less at this location under Alternative 2 than under Alternative 1, the transport patterns under<br />
this alternative have not been modeled and it is difficult to predict with certainty how much less. Under<br />
Alternative 1, an area of approximately 0.13 acre of surfgrass and 0.73 acre with giant kelp would receive<br />
partial sedimentation based on worst-case model predictions. Under Alternative 2, the area to experience<br />
partial inundation would be less, but this analysis does not speculate how much less. In either case, the<br />
indirect impact would be less than significant.<br />
Potential Indirect Sedimentation Impacts Near Batiquitos/Moonlight <strong>Beach</strong>. Under Alternative 2<br />
neither of these two receiver sites would receive sand, nor would the Leucadia receiver site located in<br />
between these two locations. Because there would be no sand introduced in this area of the coast, there<br />
would be no potential indirect sedimentation impacts under this alternative.<br />
Potential Indirect Sedimentation Impacts North of Solana <strong>Beach</strong> and North of Del Mar. Under<br />
Alternative 2, these two receiver sites would receive the same amount of replenishment material as under<br />
Alternative 1 and the potential impacts would be identical. The area of sedimentation risk off Del Mar is<br />
characterized by cobble and rock relief with no sensitive indicators. There would be no significant impact.<br />
North of Solana <strong>Beach</strong> there is the worst-case potential for sedimentation to result in partial sedimentation<br />
on two reefs (totaling approximately one acre) with both sparse juveniles and giant kelp. The temporary<br />
loss of kelp in a non-persistent kelp bed area would not be a significant impact.<br />
Summary of Indirect Sedimentation Impacts. Under Alternative 2a, worst-case, conservative estimates<br />
of partial sedimentation impacts total just over two acres. Near North Carlsbad, potential impacts could<br />
occur to less than 1.73 acres with giant kelp and less than 0.24 acre with surfgrass. This acreage amount<br />
<strong>Regional</strong> <strong>Beach</strong> <strong>Sand</strong> <strong>Project</strong> <strong>EIR</strong>/<strong>EA</strong> Page 4.4-49<br />
99-69\SANDAG <strong>EIR</strong><strong>EA</strong> 4.1 to 4.13.wpd 7/17/00
4.4 Biological Resources<br />
is likely an over-estimation. There is also the potential for partial sedimentation on reef habitat with giant<br />
kelp near Solana <strong>Beach</strong> totaling 1.05 acres, based on worst-case model predictions. Impacts at all these<br />
locations would be less than significant because the surfgrass leaves would extend well above the predicted<br />
sand deposition levels, allowing for long-term recovery, and the kelp is generally sparse and in nonpersistent<br />
kelp locations.<br />
Borrow Sites<br />
As with Alternative 1, the potential effects at borrow sites are described in terms of direct and indirect<br />
impacts, plus dredge equipment.<br />
Direct Impacts of Dredging<br />
Alternative 2a would require about 330 acres of surface area for dredging or less than two percent of the<br />
shelf habitat, however, because more material would be needed from borrow sites MB-1 and SS-1, the<br />
depth of dredge would be one to three feet deeper at these locations. As discussed in the previous analysis<br />
for Alternative 1a, the borrow sites would not be degraded as a result of the proposed action. Recovery<br />
of the infauna appears to be rapid and undergoes a succession dependent upon grain size. Fish and<br />
macroinvertebrates are plentiful and diversity appears to be enhanced within the excavated areas. While<br />
abundances may be lower for some period, fish within the borrow excavations tend to be larger. Although<br />
the presence of the borrow excavations would constitute a long-term alteration of benthic habitat with<br />
impacts on species composition, the impact would not be significant. The impacted area would be relatively<br />
small and the biota appears to recover quicker than the physical alterations.<br />
Indirect Impacts of Dredging<br />
All sensitive reef and kelp resources would have a 500-foot buffer, except at SO-7 where one artificial reef<br />
would be 350 feet distant, so turbidity at those locations would not be greater than normal conditions. Even<br />
with additional sand dredged from MB-1 and SS-1, the buffers would be retained and turbidity plumes<br />
would be localized. These two sites in particular have high sand content and low silt levels with accordingly<br />
small turbidity plumes.<br />
Page 4.4-50<br />
<strong>Regional</strong> <strong>Beach</strong> <strong>Sand</strong> <strong>Project</strong> <strong>EIR</strong>/<strong>EA</strong><br />
99-69\SANDAG <strong>EIR</strong><strong>EA</strong> 4.1 to 4.13.wpd 7/17/00
4.4 Biological Resources<br />
Dredge Equipment Impacts<br />
Dredging operations would be the same as those discussed under Alternative 1. Therefore, impacts<br />
resulting from implementation of Alternative 2a would be similar to those identified for Alternative 1a. No<br />
additional impacts beyond those previously discussed under Alternative 1a would be anticipated.<br />
Mitigation Measures for Alternative 2a<br />
As described under Alternative 1a, measures were taken during design to minimize impacts to biological<br />
resources and avoid sensitive habitat areas. Where potentially significant impacts were identified (i.e.,<br />
impacts to grunion spawning due to sand placement), measures were developed and incorporated into<br />
project design to reduce these impacts to below a level of significance (refer to Section 2.5). Additionally,<br />
monitoring would be implemented as described in Section 2.5 to verify that significant indirect sedimentation<br />
impacts do not occur. If significant, long-term adverse impacts to sensitive marine resources are<br />
documented by the monitoring effort to have resulted from discharge activities, SANDAG would mitigate<br />
via restoration or creation of like habitat at a 1:1 ratio as described in Section 2.5. A “not-to-exceed” cap<br />
on mitigation costs would be negotiated by SANDAG, similar to the previously permitted Navy<br />
Homeporting project.<br />
Impacts of Alternative 2b<br />
Receiver Sites<br />
Direct impacts resulting from implementation of Alternative 2b would be similar to those identified for<br />
Alternative 2a, as all receiver sites would be the same. The relative quantity of sand deposited on the<br />
beaches would be less for the South Oceanside, North Carlsbad, Solana <strong>Beach</strong>, Del Mar, Torrey Pines,<br />
Mission <strong>Beach</strong>, and Imperial <strong>Beach</strong> sites. Given the smaller quantity of sand, either the thickness of the<br />
sand would be less, or the length would decrease. There would be no significant direct impacts under<br />
Alternative 2a, and less sand would not result in any direct impacts beyond those previously discussed.<br />
Indirect impacts resulting from sediment transport related to movement of sands from the fill sites, and the<br />
decreases in marine water quality associated with beach replenishment activities were analyzed in detail<br />
under Alternative 2a.<br />
<strong>Regional</strong> <strong>Beach</strong> <strong>Sand</strong> <strong>Project</strong> <strong>EIR</strong>/<strong>EA</strong> Page 4.4-51<br />
99-69\SANDAG <strong>EIR</strong><strong>EA</strong> 4.1 to 4.13.wpd 7/17/00
4.4 Biological Resources<br />
Borrow Sites<br />
Under Alternative 2b, less sand would be dredged from borrow sites SO-9, SO-5, MB-1, and SS-1, as<br />
smaller quantities would be deposited at the corresponding receiver sites. Under this alternative, it is<br />
possible that the same underwater surface area would be affected, 1.8 percent of the shelf-area, but<br />
dredged at a shallower depth. Alternatively, less surface area could be dredged at the same depths. Either<br />
impact would be less than significant. The borrow sites would not be degraded as a result of the proposed<br />
action because the impacted area is small and the biota would recover quickly. As with Alternative 2a,<br />
there would be no significant indirect turbidity impacts from activity at the borrow sites.<br />
Mitigation Measures for Alternative 2b<br />
As with Alternative 2a, there would be no direct or indirect significant impacts to marine resources;<br />
however, SANDAG would implement a monitoring program for verification. That program is described<br />
in Section 2.5. If significant, long-term adverse impacts to marine resources are documented by the<br />
monitoring effort resulting from project discharge activities, then restoration or creation of like habitat at 1:1<br />
ratio would be implemented as described in Section 2.5. A “not-to-exceed” cap on mitigation costs would<br />
be negotiated by SANDAG, similar to the previously permitted Navy Homeporting project.<br />
4.4.4 No Action Alternative<br />
Under this alternative, there would be no direct or indirect effects of material removal at the borrow sites.<br />
The potential for increased biodiversity at borrow sites would not be realized. There would be no potential<br />
for even partial project-related sedimentation to marine resources as no new sand would be introduced;<br />
however, there would also be no potential for improved shore bird and grunion habitat at currently cobblefilled<br />
beaches.<br />
Page 4.4-52<br />
<strong>Regional</strong> <strong>Beach</strong> <strong>Sand</strong> <strong>Project</strong> <strong>EIR</strong>/<strong>EA</strong><br />
99-69\SANDAG <strong>EIR</strong><strong>EA</strong> 4.1 to 4.13.wpd 7/17/00
4.5 Cultural Resources<br />
4.5 CULTURAL RESOURCES<br />
This analysis is summarized from a cultural resources technical report included as Appendix E. The season<br />
of construction has no bearing on the potential impact evaluation.<br />
R<br />
R<br />
4.5.1 Significance Criteria<br />
The federal criteria used to evaluate resources that may be affected by this project are those provided in<br />
the NHPA. The National Register criteria are presented in 36 C.F.R. 60 as follows:<br />
The quality of significance in American history, architecture, archeology, and culture is present<br />
in districts, buildings, structures, and objects that possess integrity of location, design, setting,<br />
materials, workmanship, feeling, and association, and:<br />
A. That are associated with events that have made a significant contribution to the broad<br />
patterns of our history; or<br />
B. That are associated with the lives of persons significant in our past; or<br />
C. That embody the distinctive characteristics of a type, period, or method of<br />
construction, or that represent the work of a master, or that possess high artistic<br />
values, or that represent a significant and distinguishable entity whose components<br />
may lack individual distinction; or<br />
D. That have yielded, or may be likely to yield, information important in prehistory or<br />
history.<br />
A cultural resource is considered “historically significant” under CEQA if the resource meets<br />
the criteria for listing on the California Register of Historical Resources. These criteria define<br />
an “important” archaeological resource as one which:<br />
A. Is associated with events that have made a significant contribution to the broad<br />
patterns of California’s history and cultural heritage; or<br />
B. Is associated with the lives of persons important in our past; or<br />
C. Embodies the distinctive characteristics of a type, period, region, or method of<br />
construction, or represents the work of an important creative individual, or possess<br />
high artistic values; or<br />
<strong>Regional</strong> <strong>Beach</strong> <strong>Sand</strong> <strong>Project</strong> <strong>EIR</strong>/<strong>EA</strong> Page 4.5-1<br />
99-69\SANDAG <strong>EIR</strong><strong>EA</strong> 4.1 to 4.13.wpd 7/17/00
4.5 Cultural Resources<br />
D. Has yielded, or may be likely to yield, information important in prehistory or history.<br />
4.5.2 Alternative 1<br />
Impacts of Alternative 1a<br />
Evaluations of potential impacts to cultural resources within proposed borrow sites can be considered in<br />
terms of (1) prehistoric resources, where previously exposed river valleys were available for human<br />
habitation and remaining artifacts would be contained in now buried materials; and (2) historic resources,<br />
where shipwrecks and other more modern human artifacts may be located. Table 4.5-1 identifies the<br />
probability for prehistoric resources to be located within a dredge area as well as the targets in the sidescan<br />
sonar which suggests the need for further investigation of potential historic resources. Side-scan<br />
targets can be difficult to interpret and noted targets may, in fact, be non-sensitive resources such as<br />
scattered gravel or a bed of sand dollars. Methods to determine with certainty include field verification by<br />
diver or remotely operated vehicle (ROV).<br />
Table 4.5-1<br />
Summary of Cultural Resource Investigation Results at Borrow Sites<br />
Borrow Site<br />
SO-9<br />
Potential for Occurrence<br />
of Prehistoric Materials in Dredge Area (1)<br />
High, but maximum potential below nine<br />
feet.<br />
SO-7 Moderate None<br />
SO-6 High None (3)<br />
SO-5 Moderate to High None<br />
MB-1<br />
Moderate to High, maximum potential<br />
below 12 feet<br />
Potential for Occurrence of Historic Resources<br />
in Dredge Area (2)<br />
12 identified targets; all likely remains of scattered R<br />
rock reef experiment, no-side scan sonar data for R<br />
approximately 10 percent of dredge area<br />
3 identified targets<br />
SS-1 High No side scan sonar available<br />
(1)<br />
(2)<br />
(3)<br />
Based on dredge area location relative to historic river channel.<br />
Based on interpretation of side-scan sonar data.<br />
Identified target, likely shipwreck, offshore from western boundary, 250 foot buffer must be maintained during<br />
dredge<br />
Page 4.5-2<br />
<strong>Regional</strong> <strong>Beach</strong> <strong>Sand</strong> <strong>Project</strong> <strong>EIR</strong>/<strong>EA</strong><br />
99-69\SANDAG <strong>EIR</strong><strong>EA</strong> 4.1 to 4.13.wpd 7/17/00
4.5 Cultural Resources<br />
During project design, every effort has been made to locate the dredge areas to avoid high probability<br />
locations to the maximum extent possible; however, the dredge area location is driven by numerous factors<br />
including sand quantity, biological resources (i.e., avoiding reefs) and engineering considerations (i.e.,<br />
avoiding ocean outfalls). Additionally, in the underwater environment within which prehistoric resources<br />
may be located it is extremely difficult to apply the typical terrestrial methodology of surveys for resources,<br />
testing to determine significance, data recovery and/or site avoidance. Therefore, when determining<br />
potential for occurrence of prehistoric materials, a conservative conclusion has been provided.<br />
To avoid potentially significant impacts, a monitoring program has been defined in Section 2.5 that would<br />
be implemented prior to, and during, the dredge. As part of that program, verification of potential historic<br />
resources would be undertaken at SO-9, MB-1 and SS-1 using divers, ROV’s and/or supplementary side<br />
scan sonar. Any substantial historic resources would be avoided and a buffer defined to avoid potential<br />
indirect impacts. Monitoring would be instituted as material is dredged from each borrow site. If<br />
monitoring identifies substantial artifacts suggesting that dredging had entered into an archaeological site,<br />
then the dredging operation would be permanently relocated away from that site and a 250-foot wide buffer<br />
would be established around the site. The location of the site would be recorded for the appropriate<br />
clearinghouse.<br />
Mitigation Measures for Alternative 1a<br />
As described in Section 2.5, a monitoring program would be implemented prior to and during the dredge<br />
operation to verify no dredging impacts to underwater archaeological resources (historic or prehistoric).<br />
If sites are identified, they would be recorded and avoided. No further measures would be necessary.<br />
Impacts/Mitigation Measures for Alternative 1b<br />
This alternative’s impacts would be similar to Alternative 1a, and no significant impacts would occur. No<br />
mitigation measures would be necessary.<br />
<strong>Regional</strong> <strong>Beach</strong> <strong>Sand</strong> <strong>Project</strong> <strong>EIR</strong>/<strong>EA</strong> Page 4.5-3<br />
99-69\SANDAG <strong>EIR</strong><strong>EA</strong> 4.1 to 4.13.wpd 7/17/00
4.5 Cultural Resources<br />
4.5.3 Alternative 2<br />
Impacts of Alternative 2a<br />
Under Alternative 2a, the dredge volume would increase at SO-5, MB-1 and SS-1 when compared to<br />
Alternative 1. The increased volume at MB-1 and SS-1 would result dredging at greater depths, an<br />
incremental increase of three feet and one foot, respectively. This would incrementally increase the<br />
potential for entering sediments with cultural resources. The increased depth would not change the<br />
conclusions in Table 4.5-1. The increased volume could be achieved at SO-5 without a change in acreage<br />
or depth of the dredge area. As with Alternative 1, a monitoring program would be implemented to verify<br />
that no significant impacts would occur.<br />
Mitigation Measures for Alternative 2a<br />
As described in Section 2.5, a monitoring program would be implemented to verify no dredging impacts<br />
to underwater cultural resources. If encountered, the site would be recorded and avoided. No further<br />
measures would be necessary.<br />
Impacts/Mitigation Measures for Alternative 2b<br />
This alternative’s impacts would be similar to Alternative 2a, and no significant impacts would occur. No<br />
mitigation measures would be necessary.<br />
4.5.4 No Action Alternative<br />
Under the No Action Alternative, no dredging or beach replenishment activities would occur, and erosion<br />
at the region’s beaches would continue without intervention. No impacts to cultural resources would occur,<br />
and no monitoring would be instituted.<br />
Page 4.5-4<br />
<strong>Regional</strong> <strong>Beach</strong> <strong>Sand</strong> <strong>Project</strong> <strong>EIR</strong>/<strong>EA</strong><br />
99-69\SANDAG <strong>EIR</strong><strong>EA</strong> 4.1 to 4.13.wpd 7/17/00
4.6 Land and Water Use<br />
4.6 LAND AND WATER USE<br />
This analysis of land and water use impacts addresses the alternatives’ compatibility with existing and<br />
planned land uses; conformance with local land use plans; and compatibility with recreational uses.<br />
Compatibility with existing land and water uses is assessed to determine to whether the proposed land and<br />
water uses (i.e., dredging and beach replenishment) would conflict with existing, planned, and adjacent<br />
uses. Conformance with land use plans is based on consistency between the proposed use and adopted<br />
plans such as the general plans discussed in Section 3.4. Permitting requirements are discussed in Section<br />
2.7 of this <strong>EIR</strong>/<strong>EA</strong>. Noise-related land use issues are described in Section 4.13. Information regarding<br />
potential impacts to commercial fishing operations is found in Section 4.8 (Socioeconomics).<br />
4.6.1 Significance Criteria<br />
The significance of potential land use impacts associated with implementation of the proposed action is<br />
based on the level of land use sensitivity in areas that would be affected. In general, land use and<br />
recreational impacts would be significant if they would:<br />
• be inconsistent or non-compliant with applicable land use patterns or policies;<br />
• preclude the viability of existing or planned land use activities;<br />
• preclude continued use or occupation of an area;<br />
• be incompatible with adjacent or vicinity land use to the extent that public health or safety is threatened;<br />
or<br />
• result in long-term impacts to the quality or quantity of existing recreational opportunities.<br />
4.6.2 Alternative 1<br />
Impacts of Alternative 1a<br />
Receiver Sites<br />
As described in Section 3.6, the general plans, community plans, and LCP’s of all applicable jurisdictions<br />
recognize the need to implement beach replenishment activities and the proposed project would be<br />
consistent with guiding documents at all receiver sites. In fact, several jurisdictions have adopted policies<br />
<strong>Regional</strong> <strong>Beach</strong> <strong>Sand</strong> <strong>Project</strong> <strong>EIR</strong>/<strong>EA</strong> Page 4.6-1<br />
99-69\sect-04.06.wpd 7/19/00
4.6 Land and Water Use<br />
and goals specifically in support of a regional approach to sand replenishment and erosion control. Artificial<br />
nourishment with excavated sand is clearly identified as an acceptable response for erosion control.<br />
Recreational activities at all receiver sites include some or all of the following: surfing, swimming, diving, surf<br />
fishing, sport fishing, sailing, picnicking, and sun bathing. Several beaches support adjacent public<br />
campgrounds. During replenishment, there would be temporary beach closures but following project<br />
completion, total recreational beach area would be increased. Both the short-term closure and long-term<br />
benefits are addressed below.<br />
Because of public safety concerns associated with heavy equipment operations on the beach, replenishment<br />
operations would require the receiver site and offshore area be closed temporarily to the public during<br />
construction. The length of closure would vary by receiver site; the greater the volume of sand the longer<br />
the period of restricted access. (Table 2-2 identifies the total construction period associated with each<br />
receiver site, including mobilization and demobilization.) Access restriction would result in a temporary<br />
redistribution of beach activities to surrounding areas. However, the area restricted would be limited only<br />
to the smaller area where activity would occur over a daily period, not the entire length of the receiver site.<br />
This length ranges from 100 to 325 feet closed per day, and averages about 200 feet (Table 2-4).<br />
The potential affect to beach users would be greatest during summer periods of high activity so initiating<br />
construction during spring instead of late summer would result in more potential conflicts. However, sand<br />
placement in spring would maximize the available material during the peak usage period because it would<br />
be less likely washed away by winter storms. As noted in Section 2.4.1, SANDAG would coordinate the<br />
schedule at individual receiver sites to the extent possible to avoid major holidays and special events.<br />
R<br />
R<br />
R<br />
R<br />
R<br />
The worst-case situation would occur at the South Oceanside receiver site which would receive 380,000<br />
cy of material over a 30-day period. Within that month, the typical length closed on a given day would be<br />
175 feet. Receiver sites at South Carlsbad North, Batiquitos, Leucadia, Moonlight <strong>Beach</strong>, Cardiff, Solana<br />
<strong>Beach</strong>, Del Mar, Mission <strong>Beach</strong>, and Imperial <strong>Beach</strong> would have localized restrictions over an estimated<br />
10 to 16 days. Construction at the Torrey Pines and North Carlsbad receiver sites would occur over<br />
approximately 20 days. At all receiver sites, access restriction would be a temporary localized effect and<br />
would not result in a permanent significant condition. Conversely, without beach replenishment, beach use<br />
could decline as beaches continue to deteriorate (i.e., erode).<br />
Page 4.6-2<br />
<strong>Regional</strong> <strong>Beach</strong> <strong>Sand</strong> <strong>Project</strong> <strong>EIR</strong>/<strong>EA</strong><br />
99-69\sect-04.06.wpd 7/19/00
4.6 Land and Water Use<br />
With the movement of replenished beach sand through the littoral processes, offshore bars could develop<br />
over time, thereby affecting surf breaks (i.e., beach breaks). Some sediment accumulation is anticipated<br />
in reef areas, however, natural transport processes move sediments through these reef areas under normal<br />
conditions. Changes in the formation of offshore sandbars is a naturally occurring event, and there are<br />
seasonal periodic changes to surfing localities. This project would not have a significant, long-term impact<br />
to surfing.<br />
Once the receiver sites have been replenished, recreation activities would resume and be enhanced.<br />
Replenishment would create additional recreational beach area as calculated in Appendix C. Following<br />
replenishment, an estimated 85 acres of new recreational area would be created. It should be noted that<br />
the benefit is also temporary. At the majority of locations, the added recreation beach would either not<br />
persist for five years, or added beach area would be less than one acre after five years. Where beach area<br />
would be created, an estimated 252 acres of recreational beach currently exists. Post-construction, total<br />
recreational beach area would be approximately 378 acres.<br />
No direct impacts would occur to the City of Encinitas Marine Life Refuge because there would be no sand<br />
placement. Potential impacts to reefs and biological resources in the vicinity are discussed in Section 4.4.<br />
R<br />
R<br />
Finally, the replenishment action would not preclude the viability of any planned land use, either onshore<br />
or offshore.<br />
Borrow Sites<br />
At all proposed borrow sites, kelp harvesting operations would not be affected. The borrow locations have<br />
been specifically sited to avoid these resources. For information on impacts to kelp, refer to Section 4.4<br />
(Biological Resources). For information on impacts to commercial fishing, refer to Section 4.8.<br />
Whale watching activities would not be adversely affected near any of the proposed borrow sites. As<br />
described in Section 4.4 (Biological Resources), marine mammals such as whales would not be adversely<br />
affected. Therefore, the dredging and replenishment operations would not negatively affect whale watching<br />
operations.<br />
<strong>Regional</strong> <strong>Beach</strong> <strong>Sand</strong> <strong>Project</strong> <strong>EIR</strong>/<strong>EA</strong> Page 4.6-3<br />
99-69\sect-04.06.wpd 7/19/00
4.6 Land and Water Use<br />
Similarly, recreational fishing activities would not be significantly affected by the proposed dredging or<br />
replenishment operations. Boaters would be restricted from areas in the vicinity of the dredge sites and<br />
pipelines, but this would be a short-term effect to localized areas.<br />
SO-9<br />
Direct impacts to the 12 artificial reefs near SO-9 would be avoided given their distance to the proposed<br />
dredging (a minimum of 500 feet for mapped reefs and 350 feet on recently re-located experimental rock<br />
scatter). Consultation with CDFG would be necessary prior to dredging for purposes of notification and<br />
a letter of non-objection must be obtained from CDFG (Bedford 1999). While the distance to these<br />
artificial reefs varies, and distant reefs may be used for recreational diving during the dredge, the reefs that<br />
are closest (up to 500 feet) may be closed for safety reasons. In the worst-case scenario, recreational<br />
diving would be temporarily restricted at the nearest reefs for a period of approximately 50 days (worstcase).<br />
Given the availability of other available dive sites in the region, and the short-term nature of closure,<br />
impacts would not be significant.<br />
R<br />
R<br />
R<br />
R<br />
R<br />
SO-7<br />
The Encina Wastewater Authority’s sewer line (1.6 miles north) and SONGS artificial reef (750 feet north)<br />
would not be negatively impacted by dredging operations at SO-7 because both are of sufficient distance<br />
away to avoid impacts during dredging at this borrow source. The 12 artificial reefs in the vicinity of SO-7<br />
would also be avoided. Consultation with CDFG would be necessary before dredging could occur for<br />
purposes of notification and a letter of non-objection must be obtained from CDFG (Bedford 1999).<br />
Recreational diving would be temporarily restricted for a period of approximately 50 days (possibly longer<br />
if SO-9 and/or SO-6 are not utilized). Given the availability of other available dive sites in the region, and<br />
the short-term nature of closure, impacts would not be significant.<br />
R<br />
R<br />
SO-6<br />
Due to the short-term nature of dredging and distance from the underwater park, no significant long-term<br />
impacts to the features within the lease area are anticipated.<br />
Page 4.6-4<br />
<strong>Regional</strong> <strong>Beach</strong> <strong>Sand</strong> <strong>Project</strong> <strong>EIR</strong>/<strong>EA</strong><br />
99-69\sect-04.06.wpd 7/19/00
4.6 Land and Water Use<br />
SO-5<br />
The San Diego-La Jolla Underwater Park is located approximately two miles south of SO-5, which is<br />
adequate distance to avoid any adverse impacts to the park. No other land or water use impacts would<br />
occur under Alternative 1.<br />
MB-1<br />
MB-1 is within the Mission Bay Artificial Reef (which includes Wreck Alley) and is adjacent to the San<br />
Diego Underwater Recreation Area. As illustrated in Figure 2-19, there are no artificial reefs within the<br />
dredge area itself. The closest artificial reef utilized primarily by sport fishermen is the Mission Bay Bridge<br />
Wreckage Site No. 1, located approximately 1,000 feet to the south. The closest sunken structures or<br />
wrecks frequently utilized by sport scuba divers are the NOSC Tower, the Ruby E, and the Yukon, located<br />
approximately 1,800, 2,000, and 3,000 feet from the dredge site, respectively. While these are the most<br />
popular local wrecks for dive charter businesses as well as recreational divers, these artificial reefs/dive<br />
sites would not be directly impacted during dredge operations. Turbidity plumes are not projected to reach<br />
the dive sites. There may be increased underwater noise experienced by those visiting nearby underwater<br />
sites, and dive and fishing vessels transiting between features may have to maneuver to avoid the dredge<br />
operations, but dredging operations would be short-term (approximately 11 days). A letter of nonobjection<br />
from CDFG would be required for dredging activities within the MBAR (Bedford 1999).<br />
Impacts would be less than significant.<br />
SS-1<br />
Given the distance from the borrow site to the City of San Diego outfall and ocean monitoring stations,<br />
there would be no long-term effect from dredging activities.<br />
Mitigation Measures for Alternative 1a<br />
No significant impacts have been identified; accordingly, no mitigation measures are necessary.<br />
Impacts/Mitigation Measures for Alternative 1b<br />
This alternative would differ from Alternative 1a in that construction of the proposed action would comply<br />
with applicable jurisdictions’ noise ordinances. Because dredging and replenishment activities would take<br />
a longer amount of time, the receiver sites would be closed longer than under Alternative 1a (refer to Table<br />
<strong>Regional</strong> <strong>Beach</strong> <strong>Sand</strong> <strong>Project</strong> <strong>EIR</strong>/<strong>EA</strong> Page 4.6-5<br />
99-69\sect-04.06.wpd 7/19/00
4.6 Land and Water Use<br />
2-2). Although this alternative would take longer to implement, activity at any given receiver site would be<br />
short-term in nature and the length closed on any given day would be minimal (Table 2-4).<br />
As with Alternative 1a, closure of the receiver sites would result in a short-term redistribution of<br />
recreational activities to adjacent areas; however, replenishment would result in a beneficial impact overall.<br />
In comparison to Alternative 1 a, there would be less sand at most beaches so the relative benefit would<br />
decrease slightly. No significant long-term impacts to land and water use are anticipated. Accordingly,<br />
no mitigation measures would be necessary.<br />
4.6.3 Alternative 2<br />
Impacts of Alternative 2a<br />
Receiver Sites<br />
Under this alternative, land use and recreation impacts would be similar to those described for Alternative<br />
1, although the length of time and locations of receiver site access restriction would vary. There would be<br />
no access restrictions at the North Carlsbad, Batiquitos, Leucadia, or Moonlight <strong>Beach</strong> receiver sites which<br />
would eliminate short-term impacts, as well as benefits. <strong>Sand</strong> volumes would increase at the Oceanside,<br />
South Carlsbad North, Del Mar, Torrey Pines, Mission <strong>Beach</strong>, and Imperial <strong>Beach</strong> receiver sites.<br />
Maximum length of restricted access would continue to be the South Oceanside site which would be 42<br />
days (Table 2-6). Other sites with more sand would experience additional construction (and restricted<br />
access) for several days to a week. The South Carlsbad North site would have restricted access over a<br />
total 13-day period. As discussed, access restriction would apply to a localized area and not the entire site.<br />
Refer to Table 2-4 for typical lengths at specific receiver sites. Recreation impacts would be short-term<br />
and would be less than significant at all receiver sites.<br />
Replenishment under this alternative would also provide benefits by creating new recreational beach area.<br />
A total of approximately 92 acres would be created but distributed at fewer locations relative to Alternative<br />
1, for a total post-construction recreational beach area of approximately 345 acres. Long-term (five years)<br />
beach area of one acre or greater would only be present at South Oceanside and Cardiff.<br />
Page 4.6-6<br />
<strong>Regional</strong> <strong>Beach</strong> <strong>Sand</strong> <strong>Project</strong> <strong>EIR</strong>/<strong>EA</strong><br />
99-69\sect-04.06.wpd 7/19/00
4.6 Land and Water Use<br />
Borrow Sites<br />
Under this alternative, water use and recreation impacts would be similar to those described for Alternative<br />
1. Differences between Alternative 1 and Alternative 2 also include relative recreation impacts at SO-9,<br />
closure would be approximately 42 days instead of 50. At SO-7, the dredge area would be restricted for<br />
32 days instead of 50. The overall impact would be short-term and less than significant.<br />
Mitigation Measures for Alternative 2a<br />
As no significant impacts to land and water use or recreation have been identified, no mitigation measures<br />
would be necessary with implementation of this alternative.<br />
Impacts/Mitigation Measures for Alternative 2b<br />
This alternative would differ from Alternative 2a in that construction of the proposed action would comply<br />
with applicable jurisdictions’ noise ordinances (refer to Table 2-6). Because dredging and replenishment<br />
activities would take a longer amount of time, the receiver sites would be closed longer than under<br />
Alternative 2a (refer to Table 2-4 and Table 2-6). Although this alternative would take longer to<br />
implement, it would still be short-term. There would also be less relative benefit under this alternative as<br />
the sand quantity would be less.<br />
As with Alternative 2a, closure of the receiver sties would result in a short-term redistribution of<br />
recreational activities to adjacent areas. Replenishment would result in a beneficial impact to recreation;<br />
no significant impacts to land and water use are anticipated. Accordingly, no mitigation measures would<br />
be necessary.<br />
4.6.4 No Action Alternative<br />
No dredging or beach replenishment activities would occur under the No Action Alternative. There would<br />
be no land and water use or recreation impacts under this alternative and no mitigation measures would be<br />
necessary. No recreational beach area would be created and this alternative would not fulfill the goals and<br />
policies of the various general plans and LCPs as described in Section 3.6, nor satisfy the project purpose<br />
and need.<br />
<strong>Regional</strong> <strong>Beach</strong> <strong>Sand</strong> <strong>Project</strong> <strong>EIR</strong>/<strong>EA</strong> Page 4.6-7<br />
99-69\sect-04.06.wpd 7/19/00
4.7 Aesthetics<br />
4.7 AESTHETICS<br />
Construction of the project in spring instead of late summer would potentially increase the number of<br />
sensitive viewers experiencing the project, but that would not change the significance conclusion.<br />
R<br />
R<br />
4.7.1 Significance Criteria<br />
San Diego’s coastal beaches are some of the region’s most important visual resources. For this reason,<br />
the coastal areas of San Diego County are considered a highly sensitive visual resource. Coastal beaches<br />
offer scenic views that are considered a trademark of the southern California area. Additionally, all of the<br />
13 possible receiver sites would be visible to either residents, scenic drivers or recreationalists, and in some<br />
cases all three types of viewers. For these viewer types the scenic quality does affect the value of an<br />
activity and they are considered sensitive viewers. Therefore, construction or operation that would cause<br />
permanent degradation of existing views along coastal beaches would be considered significant.<br />
Degradation may result from scale and size of project features, site design, color and texture contrast, or<br />
permanent introduction of light and glare.<br />
4.7.2 Alternative 1<br />
Under Alternative 1a, the beach nourishment activities could potentially occur over a 24-hour period, up<br />
to seven days per week. This activity would provide the maximum sand within the minimum overall time<br />
frame but would involve more disturbance in an average day. Additionally, lights may be necessary to<br />
allow for construction after the sun sets.<br />
Impacts of Alternative 1a<br />
Receiver Sites/Temporary Pipeline Routes<br />
South Oceanside<br />
The proposed action would alter existing views along the receiver site during proposed beach replenishment<br />
operations because a pipeline would discharge sand, grading equipment (typically two large machines)<br />
would construct a training dike and move the sand and pipelines around the site, and several construction<br />
personnel would operate the equipment. If the hopper dredge is used, then it would make periodic<br />
<strong>Regional</strong> <strong>Beach</strong> <strong>Sand</strong> <strong>Project</strong> <strong>EIR</strong>/<strong>EA</strong> Page 4.7-1<br />
99-69\SANDAG <strong>EIR</strong><strong>EA</strong> 4.1 to 4.13.wpd 7/17/00
4.7 Aesthetics<br />
deliveries to the site. This boat would be anchored just offshore while the load of sand is delivered via<br />
pipeline to the site. If the cutterhead dredge is used, delivery would be made entirely via pipeline.<br />
Construction lights would be placed at the work place to allow for construction after daylight hours. Under<br />
this construction scenario, activity and associated lighting could occur anytime within a 24-hour period.<br />
The City of Oceanside has a Light Pollution Ordinance (Ordinance No. 091-46) which prohibits certain<br />
types of outdoor lights and restricts outdoor lighting between 11:00 p.m. and sunrise. The intent of this<br />
ordinance is to support Palomar Observatory by restricting certain light fixtures which emit undesirable light<br />
rays into the night sky. There are exemptions for various activities and types of lighting. One exemption<br />
allows outdoor facilities to remain illuminated to complete specific organized activities that are in progress<br />
and under illumination at 11:00 p.m. The proposed construction lighting would be short-term in nature and<br />
exempt.<br />
The proposed action is anticipated to take up to 30 days at the South Oceanside receiver site. <strong>Sand</strong><br />
placement operations during this time would degrade existing coastal views in the area. Residents along the<br />
site and users of Buccaneer <strong>Beach</strong> Park would have clear views of the activity when the sand placement<br />
would occur near those specific uses. More distant views would be available for persons using the pier<br />
or the Strand. <strong>Sand</strong> placement would not affect the entire length of the receiver site for the 30-day<br />
construction period. Instead, approximately 175 linear feet would be affected in any one day. <strong>Sand</strong><br />
placement activities at the southern end of the receiver site would be over one mile from the Strand and<br />
about 2,000 feet from Buccaneer <strong>Beach</strong> which would reduce the visual contrast of the action for those<br />
viewers. The overall contrast of the action at a specific land use or individual sensitive viewer would vary<br />
over time because the construction activities would be continually moving along the site length.<br />
Subsequent to beach replenishment operations, the receiver site beach would be enhanced. <strong>Sand</strong><br />
replenishment would widen the existing beach, thereby eliminating views of the eroded beach area south<br />
of Wisconsin Street. Operations would be short-term overall and the daily construction area would travel<br />
down the beach which would reduce the visual contrast to any one sensitive viewer. The end result would<br />
be enhancement of this important resource, and visual impacts would be considered less than significant.<br />
Core samples have been taken from borrow site SO-9 which would supply the material for this receiver<br />
site (Sea Surveyor 1999). The beach fill material from this borrow sites will likely be slightly darker in color<br />
than existing beach sand due to organic materials in the sediment. As is typical in beach nourishment<br />
projects, the material would be washed and reworked by waves, bleached under exposure to the sun, and<br />
mixed with existing sand. Any discoloration of the sediment would be short-term (USACOE 1984) and<br />
Page 4.7-2<br />
<strong>Regional</strong> <strong>Beach</strong> <strong>Sand</strong> <strong>Project</strong> <strong>EIR</strong>/<strong>EA</strong><br />
99-69\SANDAG <strong>EIR</strong><strong>EA</strong> 4.1 to 4.13.wpd 7/17/00
4.7 Aesthetics<br />
no permanent adverse visual conditions would result from the discoloration of fill materials at the receiver<br />
beach.<br />
The delivery pipeline would make landfall south of 9 th Street and be placed on the beach to reach the<br />
receiver site. During construction, viewers along the Strand would see trucks and crew assembling the<br />
pipeline which could take two to four days. In the remaining time period, the pipeline would be inert on<br />
the beach. Because the pipeline would serve both the South Oceanside and the North Carlsbad receiver<br />
sites, the pipeline could be on the beach for approximately 50 days. The pipeline would be clearly visible<br />
when placed on the light sand because of its size (up to three feet in diameter) and dark color. However,<br />
where the pipeline would be placed at the base of the Strand or along dark rip-rap the contrast would be<br />
reduced overall. Views for most residents looking west at the beach would be substantially eliminated<br />
because other features such as rip-rap would intervene. The visual contrast would be considered less than<br />
significant, given the following: the presence of other man-made features such as sea walls and rip-rap<br />
which reduce the visual contrast; the location of the pipe as far up the beach as possible to avoid wave<br />
action, which would also reduce the strong contrast with light colored sand; and the temporary nature of<br />
the feature.<br />
North Carlsbad<br />
Similar to the South Oceanside receiver site, views of the North Carlsbad receiver site would be degraded<br />
during pumping and construction operations associated with the proposed action. At this site, the sand<br />
fill area would be conducted entirely seaward of the 1998 surveyed mean high tide line. Immediately<br />
following construction, the beach area directly in front of the existing revetment would remain at the current<br />
elevation, approximately six feet above MLLW. At an estimated 35 feet seaward of the revetment, a slope<br />
would extend up to the top of the replenishment fill at 12 feet above MLLW. Residents would view this<br />
higher berm near the middle of the beach and extending seaward, the berm would not block views of the<br />
ocean but would present a not-typical beach view. Immediately following the placement, wave action and<br />
tentative beach maintenance would serve to flatten the berm and reduce the elevation difference.<br />
Ultimately, replenishment would serve to enhance this degraded beach. Further, beach replenishment<br />
operations would be short-term (approximately 20 days). No permanent adverse visual impact would<br />
occur. Impacts to aesthetic resources would not be significant.<br />
The sand source for this receiver site would be SO-9 which has slightly darker material due to the presence<br />
of organics. Over time the fill material would be washed by waves, bleached by the sun, and mixed with<br />
<strong>Regional</strong> <strong>Beach</strong> <strong>Sand</strong> <strong>Project</strong> <strong>EIR</strong>/<strong>EA</strong> Page 4.7-3<br />
99-69\SANDAG <strong>EIR</strong><strong>EA</strong> 4.1 to 4.13.wpd 7/17/00
4.7 Aesthetics<br />
the existing material to reduce the contrast. No permanent visual effects would result and the impact would<br />
be less than significant.<br />
The pipeline to serve this site would extend south from Oceanside. Where it would be located at the base<br />
of the walkway or up against the existing slopes, the contrast would be reduced and much of the view from<br />
existing residences would be obscured. Where it would be placed on sand not adjacent to the features,<br />
it would be more visible. However, no permanent visual effects would result and the impact would be less<br />
than significant.<br />
South Carlsbad North<br />
Views at this receiver site would be available to campers at the state park. During construction, which<br />
would last approximately 15 days, the receiver site would be degraded from pumping and construction<br />
operations. In any given day, approximately 200 linear feet would be affected by direct closure. However,<br />
the proposed action would ultimately improve long-term views in the area through the enhancement of the<br />
existing beach. Because of the short-term nature of the project and the fact that construction would move<br />
along the site minimizing the visual contrast at any one location, no permanent adverse visual impact would<br />
occur.<br />
The dredged fill material for this site would come from SO-7. The material from this borrow site has been<br />
found to be relatively light in color with less organics than the other borrow sites so the contrast between<br />
the fill material and the existing sand would be reduced (Sea Surveyor 1999). Eventually, natural processes<br />
including wave washing, sun exposure, and mixture with existing sand would eliminate any noticeable<br />
differences between sediment color.<br />
In a past sand replenishment project near this site, there has been very strong contrast between the receiver<br />
site and the sand source. As a result, the replenished beach was not utilized by beach-goers until the color<br />
contrast was reduced. The previous situation resulted when nourishment material from a roadway<br />
construction project was placed on the beach. That material was very reddish in color and had a content<br />
of 80 percent sand and 20 percent silt. The red color was linked to the silt layer which covered the sand<br />
grains. Once the nourishment material was worked by wave action causing the silt to wash off, and the<br />
remaining sand mixed with the existing sand, then the site was utilized. Under the currently proposed<br />
project, the nourishment source will not be more than 10 percent silt. Additionally, the core samples from<br />
the borrow site indicate that the nourishment material will not appear red. Therefore, while there will be<br />
Page 4.7-4<br />
<strong>Regional</strong> <strong>Beach</strong> <strong>Sand</strong> <strong>Project</strong> <strong>EIR</strong>/<strong>EA</strong><br />
99-69\SANDAG <strong>EIR</strong><strong>EA</strong> 4.1 to 4.13.wpd 7/17/00
4.7 Aesthetics<br />
a short-term color contrast between the receiver sand and nourishment material, it should not result in<br />
public avoidance.<br />
The pipeline for this receiver site would be located on the beach from just north of Batiquitos Lagoon to<br />
the site. There are no permanent residents to view this temporary pipeline. Because the pipeline would<br />
be located at the base of the bluffs it would be outside the field of vision for drivers along Carlsbad<br />
Boulevard, except where the roadway is near the lagoon mouth and height differential would not obscure<br />
views. The short-term nature of the pipeline and reduced visibility to sensitive viewers support a finding<br />
of no significant impact.<br />
Batiquitos<br />
At this receiver site residents on the bluffs would be able to view the construction activity for approximately<br />
12 days. As with the other receiver sites, the short-term nature of the impact would be out-weighed by<br />
the overall enhancement of the beach. The visual impact of construction would be considered less than<br />
significant. Material for nourishment would be from SO-7 which has relatively lighter sand color than from<br />
other borrow sites, so the contrast between the existing and new material would be relatively less. Any<br />
contrast would eventually be eliminated by wave action, exposure to the sun, and seasonal mixing.<br />
The pipeline for this site would come directly onshore from the borrow site approximately 0.8 mile offshore.<br />
The visual impact is discussed in the borrow site section below.<br />
Leucadia<br />
This receiver site is much like the southern portion of Batiquitos with residents along high bluffs viewing a<br />
sand and cobble beach. Construction activities would occur over approximately 13 days and typically<br />
cover 325 linear feet in a day. As with the other receiver sites, the overall contrast of the action at any<br />
given sensitive viewer would vary over time because the construction activity would continually move down<br />
the beach. The nourishment material would be from SO-7 which has relatively lighter in color material,<br />
likely resulting in less contrast with the existing sand. The short-term visual change would not be considered<br />
significant and the enhanced beach would result in a visual benefit.<br />
The pipeline to serve this site would be located at the base of the bluffs. While visible, the contrast would<br />
be minimized by its location next to a much larger cliff face and dark colored rip-rap. Additionally, the<br />
<strong>Regional</strong> <strong>Beach</strong> <strong>Sand</strong> <strong>Project</strong> <strong>EIR</strong>/<strong>EA</strong> Page 4.7-5<br />
99-69\SANDAG <strong>EIR</strong><strong>EA</strong> 4.1 to 4.13.wpd 7/17/00
4.7 Aesthetics<br />
viewscape of expansive ocean would not be obscured for either beach users or residents. The visual<br />
impact would not be significant.<br />
Moonlight <strong>Beach</strong><br />
In this location the viewers would include not only residents on the bluff tops but park users at Moonlight<br />
State <strong>Beach</strong>. Construction activity would occur over approximately 10 days with construction in a typical<br />
day affecting approximately 150 linear feet of beach. As with the other receiver sites, the overall contrast<br />
of the action would be reduced at any given sensitive viewer because the construction activity would<br />
continually move down the beach. The material for this site would be from SO-7 which has relatively<br />
lighter material likely resulting in less contrast with the existing sand. The short-term visual change would<br />
not be considered significant and the enhanced beach would result in a visual benefit.<br />
The pipeline in this location would be at the base of the bluffs only in the northern and southern portions.<br />
At Moonlight State <strong>Beach</strong> Park, the pipe would be placed as far landward as possible. The visual contrast<br />
would not be significant.<br />
Cardiff<br />
This receiver site is characterized completely by cobbles and placement of material would greatly enhance<br />
the beach. Construction activities would occur over an approximately 11-day time period. Nearby viewers<br />
can be characterized as drivers, users of the beach, and persons at Restaurant Row. There are residential<br />
viewers in the hills to the north and south of San Elijo Lagoon. Their views include numerous elements<br />
including the lagoon, beach and ocean. All material would be piped from borrow site SO-6 which has<br />
organics similar to SO-9. The contrast between the dark cobbles and sand would not be significant, in part<br />
because the contrast between the two types of materials would overshadow the color contrast, and the two<br />
darker tones may be more of a match. Overall, the view of sand placement equipment would be shortterm,<br />
there are numerous elements in the viewscape which minimize the overall importance of the receiver<br />
site itself, and the enhancement of the beach from cobble to sand would be beneficial. The visual impact<br />
would be less than significant.<br />
Page 4.7-6<br />
<strong>Regional</strong> <strong>Beach</strong> <strong>Sand</strong> <strong>Project</strong> <strong>EIR</strong>/<strong>EA</strong><br />
99-69\SANDAG <strong>EIR</strong><strong>EA</strong> 4.1 to 4.13.wpd 7/17/00
4.7 Aesthetics<br />
Solana <strong>Beach</strong><br />
This receiver site has sand and cobble below bluffs with residences constructed along the top, as well as<br />
a recreation area at Fletcher Cove. Construction activities would occur up to 13 days and typical<br />
construction in one day would be approximately 200 feet. The activity would move along the length of the<br />
beach which would reduce the visual contrast to any one viewer. The delivery pipeline would extend<br />
across the water’s surface from SO-7 and make landfall at the northern end of the receiver site. However,<br />
this pipeline would only serve this single site and would be utilized up to 13 days. The views of construction<br />
and dredging equipment would be short-term and less than significant.<br />
The borrow site that would serve this receiver site (SO-5) has organics that will likely make the material<br />
slightly darker than the existing sand. The color contrast would be reduced by wave action, exposure to<br />
the sun, and mixing, and there would be no permanent adverse visual conditions.<br />
Del Mar<br />
At this site, the receiver beach is directly fronted by homes at the same elevation so there would be clear,<br />
foreground views of the construction process. The activity would occur for approximately 16 days under<br />
this alternative, typically 250 linear feet a day. The activity would move along the length of the beach which<br />
would reduce the visual contrast to any one viewer. Similar to the Cardiff site, more distant viewers on the<br />
hills would view the receiver site as one element of a viewscape including the expansive ocean and other<br />
beach scenes. The short-term activity at this one location would not be a permanent, adverse change.<br />
The delivery pipeline would extend directly offshore from SO-5. As described in Solana <strong>Beach</strong>, the slightly<br />
darker material will be washed and worked over time so there would also be no permanent visual impact.<br />
Torrey Pines<br />
Foreground viewers of this site are limited to recreationalists at the state beach and drivers on North Torrey<br />
Pines Road. Distant views are available from residents on the hills north of Carmel Valley Road.<br />
Construction activities would occur for up to 20 days and would enhance and widen this thin and cobble<br />
beach. The nourishment material would be slightly darker but would be washed by waves, exposed to the<br />
sun and eventually mixed with the existing sand to eliminate the contrast. The visual impact is regarded as<br />
less than significant.<br />
<strong>Regional</strong> <strong>Beach</strong> <strong>Sand</strong> <strong>Project</strong> <strong>EIR</strong>/<strong>EA</strong> Page 4.7-7<br />
99-69\SANDAG <strong>EIR</strong><strong>EA</strong> 4.1 to 4.13.wpd 7/17/00
4.7 Aesthetics<br />
The delivery pipeline would extend south from the Del Mar receiver site, primarily at the base on the bluffs<br />
south of Sea Coast Park. In this location it would not be visible from residents along the bluff tops, but it<br />
would be visible to beach users. The contrast would be reduced by its placement against the large bluffs.<br />
As it would extend across the lagoon mouth and enter the site, it would be on the sand where its size and<br />
darker color would make more it readily visible. Given the presence of other man made features such as<br />
rip-rap as well as the temporary nature of the feature, the visual impact would be less than significant.<br />
Mission <strong>Beach</strong><br />
Like Del Mar, this receiver site consists of residences built behind a low sea wall at the same elevation as<br />
the sandy beach so there are clear, foreground views of the construction activity. Views would be available<br />
to residents and users of the boardwalk. At this site, construction would occur along the site for 11 days,<br />
typically 250 linear feet per day. The activity would move along the length of the beach, which would<br />
reduce the visual contrast to any one viewer. Material from borrow site MB-1 is also characterized by<br />
lighter material so the contrast between the fill material and existing sand would be less noticeable and<br />
eventually the contrast would not be visible at all. Because operations would be short-term and the end<br />
result would be enhancement of this important resource, the visual impact is regarded as less than<br />
significant.<br />
Imperial <strong>Beach</strong><br />
The majority of this receiver site is characterized by a cobble beach. Existing residents front the beach<br />
behind rip-rap protection and have clear, foreground views of the construction activity. Construction<br />
activity would be approximately 12 days. An estimated 300 linear feet per day would be affected over the<br />
more than one-half mile long site. The activity would move along the length of the beach, which would<br />
reduce the visual contrast to any one viewer. As fill material is placed on the site, it would be washed and<br />
bleached to blend with the existing sand. Because of the short-term nature of the activity and the beneficial<br />
enhancement of this degraded beach, the visual impact would be regarded as less than significant.<br />
Borrow Sites<br />
Visual impacts as a result of dredging activities at all borrow sites would be similar. For this impact<br />
analysis, the SO-7 borrow site is addressed as a representative worst-case scenario because it would have<br />
the longest duration of construction, and has the closest sensitive viewers.<br />
Page 4.7-8<br />
<strong>Regional</strong> <strong>Beach</strong> <strong>Sand</strong> <strong>Project</strong> <strong>EIR</strong>/<strong>EA</strong><br />
99-69\SANDAG <strong>EIR</strong><strong>EA</strong> 4.1 to 4.13.wpd 7/17/00
4.7 Aesthetics<br />
At its closest point, SO-7 would be located approximately 0.8 mile offshore. Residents on the bluffs would<br />
have some view of the dredging operation for its entire duration. Because SO-7 would serve five receiver<br />
sites (Table 2-2) dredging would continue within the dredge area for approximately 50 days. The dredge<br />
area is approximately 50 acres in size. Depending on the type of dredge the view would be slightly<br />
different. The cutterhead dredge would appear as a boat working in one area for some time, then moving<br />
to another nearby location, and then another within the dredge area and would remain offshore. While<br />
possibly visible, it would appear on the horizon much like many other boats (fishing, pleasure, etc.) which<br />
are active along the coast. It would not be highly evident or dominate the landscape. The hopper dredge<br />
would come to shore periodically which would make it more visible, but this would not be a permanent<br />
significant visual impact.<br />
Similar to SO-7, visual impacts at all borrow sites would be short-term. Dredging activities would not be<br />
highly evident or dominate the landscape. Accordingly, impacts would be less than significant.<br />
Mitigation Measures for Alternative 1a<br />
No significant impacts have been identified, and no mitigation measures would be necessary.<br />
Impacts/Mitigation Measures for Alternative 1b<br />
Under this alternative, sand placement activities would occur within a more restricted time frame when the<br />
noise ordinance of a local jurisdiction would be applicable. The more restrictive noise ordinance would<br />
not apply to receiver sites at South Carlsbad North, Batiquitos, Leucadia, Moonlight or Cardiff which are<br />
served by borrow sites SO-7 and SO-6. Construction at the remaining receiver sites would be restricted<br />
to generally 7 p.m., Monday through Friday, between 8:00 a.m. and 7:00 p.m. on Saturdays, and excluded<br />
entirely on Sundays and holidays (Section 2.4). There would be no need for lights for nighttime<br />
construction. However, the overall construction length would be increased by one-third and the amount<br />
of sand placed would be reduced by one-half (refer to Table 2-2). Visual impacts are discussed below<br />
for the receiver sites where construction practices would vary under Alternative 1b than that previously<br />
described under Alternative 1a.<br />
<strong>Regional</strong> <strong>Beach</strong> <strong>Sand</strong> <strong>Project</strong> <strong>EIR</strong>/<strong>EA</strong> Page 4.7-9<br />
99-69\SANDAG <strong>EIR</strong><strong>EA</strong> 4.1 to 4.13.wpd 7/17/00
4.7 Aesthetics<br />
Receiver Sites/Temporary Pipeline Routes<br />
At the South Oceanside, North Carlsbad, Solana <strong>Beach</strong>, Del Mar, Torrey Pines, Mission <strong>Beach</strong>, and<br />
Imperial <strong>Beach</strong> receiver sites, the construction period would be longer than Alternative 1a (refer to Table<br />
2-2). Although the time period would be longer, there would be no nighttime construction lights which<br />
would eliminate short-term light and glare associated with Alternative 1a. While there would be less sand<br />
overall, there would still be an improvement to the existing degraded condition. Because the construction<br />
activity would move along the beach no single viewer would have impacts from construction over the entire<br />
time period and because the end result would be enhancement of this important visual resource, there<br />
would be no permanent, significant visual impact.<br />
Borrow Sites<br />
Dredging activity would occur over a longer duration at borrow sites SO-9, SO-5, MB-1 and SS-1<br />
because they would have to halt dredging until construction could resume at the receiver sites. Table 2-2<br />
identifies the longer time frame for each borrow site. Because of the distance between borrow sites and<br />
viewers, the relatively small size of dredge area when viewed in the ocean horizon, and the other boating<br />
activity that is also visible there would be no permanent significant visual impact. No mitigation measures<br />
would be necessary.<br />
4.7.3 Alternative 2<br />
Impacts of Alternative 2a<br />
Receiver Sites/Temporary Pipelines<br />
Under Alternative 2a, beach nourishment activities could occur anytime within 24 hours a day, seven days<br />
a week. Lights may be necessary to allow for sand placement on the receiver site after the sun sets. The<br />
total number of sites would be less under this alternative than under Alternative 1 as the North Carlsbad,<br />
Batiquitos, Leucadia, and Moonlight <strong>Beach</strong> receiver sites would not receive sand. Nearby sensitive<br />
receptors, typically residents, at those sites would not experience even short-term visual effects, nor would<br />
they experience the visual benefit of enhanced beaches. Under this alternative, beach replenishment<br />
activities at the Cardiff, Solana <strong>Beach</strong> and Del Mar receiver sites would be identical to Alternative 1a and<br />
the impacts would be identical – short-term views of construction resulting in long-term beach<br />
Page 4.7-10<br />
<strong>Regional</strong> <strong>Beach</strong> <strong>Sand</strong> <strong>Project</strong> <strong>EIR</strong>/<strong>EA</strong><br />
99-69\SANDAG <strong>EIR</strong><strong>EA</strong> 4.1 to 4.13.wpd 7/17/00
4.7 Aesthetics<br />
enhancement. Four other receiver sites would have a larger footprint under this alternative, but impacts<br />
would be similar to those described for Alternative 1. The South Carlsbad South receiver site is proposed<br />
for sand replenishment under this alternative, and is addressed below.<br />
South Carlsbad South<br />
<strong>Beach</strong> replenishment at the South Carlsbad South receiver site would have visual impacts identical to South<br />
Carlsbad North. Nearby viewers would be campers in the State Park. During implementation views<br />
would temporarily degraded but on any given day only 200 linear feet would be affected by direct closure.<br />
Construction is anticipated to occur over a 13-day time period. Fill for this site would come from SO-7<br />
which would be slightly lighter in color than the receiver site, but natural processes would eliminate any<br />
noticeable differences and the impact would not be significant. As with Alternative 1, there would be no<br />
significant, long-term impact associated with the pipeline. Because of the short-term nature of the project<br />
and long-term enhancement benefit, visual impacts would not be considered significant.<br />
Borrow Sites<br />
Visual impacts associated with borrow sites would be similar to Alternative 1. Some borrow activity would<br />
be decreased in duration (i.e., SO-9 and SO-7) while some would take longer (MB-1). The overall time<br />
of borrow activity would be an estimated two weeks less under Alternative 2 than Alternative 1. Still, there<br />
would not be long-term, significant visual impacts.<br />
Mitigation Measures for Alternative 2a<br />
No mitigation would be required as no significant impacts have been identified.<br />
Impacts/Mitigation Measures for Alternative 2b<br />
Under this alternative, construction at some sites would occur over a longer time period (refer to Table 2-<br />
6). As noted under Alternative 1b, there would be no lights for nighttime construction which would<br />
eliminate one short-term change to the visual environment; however, the reduction in sand volume<br />
associated with this alternative would result in reduced long-term visual benefits. No mitigation would be<br />
necessary.<br />
<strong>Regional</strong> <strong>Beach</strong> <strong>Sand</strong> <strong>Project</strong> <strong>EIR</strong>/<strong>EA</strong> Page 4.7-11<br />
99-69\SANDAG <strong>EIR</strong><strong>EA</strong> 4.1 to 4.13.wpd 7/17/00
4.7 Aesthetics<br />
4.7.4 No Action Alternative<br />
With the No Action Alternative, the beaches would not be enhanced. Where there are visible cobbles they<br />
would remain, and where the beach overall is narrow it would not be widened. Adjacent residents and<br />
beach users would not experience the disturbance of construction or views of the pipeline; however, they<br />
would not experience the benefits of more scenic beaches.<br />
Page 4.7-12<br />
<strong>Regional</strong> <strong>Beach</strong> <strong>Sand</strong> <strong>Project</strong> <strong>EIR</strong>/<strong>EA</strong><br />
99-69\SANDAG <strong>EIR</strong><strong>EA</strong> 4.1 to 4.13.wpd 7/17/00
4.8 Socioeconomics<br />
4.8 SOCIOECONOMICS<br />
As stated in Section 3.8, NEPA requires consideration of “economic” and “social” effects (40 C.F.R. §§<br />
1502.16 and 40 C.F.R. §§ 1508.8) but CEQA only requires evaluation of population and housing such<br />
that increased population or housing results in physical impacts. There would be no housing constructed<br />
with this project and no increase in population so there is no applicable CEQA analysis.<br />
The social and economic effects of the action would be beneficial. The nourished beaches would have<br />
wider and larger sand areas, or would replace cobblestone beaches with sand-covered beaches.<br />
Expansive sandy beaches provide greater recreational opportunities, opportunity for public access, and<br />
enhance tourism in the region. Public property and infrastructure would have additional protection from<br />
wave action and storm events while the sand remained at the wider location. Either of the two action<br />
alternatives would result in satisfying the project purpose and need of replenishing eroded beaches.<br />
The primary focus of this impact analysis therefore, is the socioeconomic effect to commercial fisheries,<br />
kelp harvesting and recreation fishing/diving from a NEPA perspective. There would be no substantial<br />
difference in effect based on season of construction because this analysis considers the larger, regional<br />
fishery and long-term health. As with Section 4.4, it considers potential impacts overtime with no particular<br />
start date. NEPA does not require explicit definition of significance criteria. Potential impacts specific to<br />
environmental justice concerns are addressed in Sections 6.6 and 6.7.<br />
R<br />
R<br />
R<br />
R<br />
4.8.1 Alternative 1<br />
Impacts of Alternative 1a<br />
Commercial Fisheries<br />
Numerous interactions with commercial fisherman and their representatives have identified four main areas<br />
of concern regarding the beach replenishment project. These concerns all focus on the potential for loss<br />
of resources and income and can be summarized as follows:<br />
• <strong>Sand</strong> placed on the beaches will move from the beaches onto sensitive habitat areas causing immediate<br />
loss of commercial resources associated with these habitats (e.g., lobster, crab, urchin), effectively<br />
causing area preclusion for some period of time,<br />
<strong>Regional</strong> <strong>Beach</strong> <strong>Sand</strong> <strong>Project</strong> <strong>EIR</strong>/<strong>EA</strong> Page 4.8-1<br />
99-69\SANDAG <strong>EIR</strong><strong>EA</strong> 4.1 to 4.13.wpd 7/17/00
4.8 Socioeconomics<br />
• Turbidity plumes from the project would cause commercial resources to move from the area for some<br />
period of time, effectively causing area preclusion for some period of time,<br />
• Movement of the sand from the beaches onto sensitive subtidal habitat areas would adversely affect<br />
nursery habitat causing significant long-term damage (through population reduction) to the fishery, and<br />
• Dredging operations will lead to loss of fishing gear and equipment as well as limit access to fishing<br />
areas.<br />
These three concerns (area preclusion, adverse effects to nursery habitat, and gear loss/limit access) are<br />
each discussed below.<br />
It is appropriate to note that commercial trawl and gill netting operations would not be directly affected by<br />
this project because these activities are not permitted within three miles of the coast. California halibut<br />
(ranked 4 th in value among local nearshore species) are commercially fished using nets and trawls and these<br />
methods are generally restricted to waters at least three miles from shore. Since the borrow sites are all<br />
located approximately one mile or less from shore, no significant impacts are predicted for this component<br />
of the fishery.<br />
Area Preclusion Issues<br />
Socioeconomic impacts to the commercial fishery can be examined in terms of the regional fishery and<br />
individual fishing (local level) operations.<br />
Preclusion in <strong>Regional</strong> Perspective. In terms of the regional fishery, there would be no significant impact<br />
to the overall San Diego region fishery from the proposed project. This conclusion is based on the<br />
distribution of the commercial catch among fish blocks along the coast, and the relatively low contribution<br />
of the North County area, where most dredging and sand placement would occur, to the overall area<br />
fishery. Looking at the three North County fish blocks in terms of aggregate value over the years 1987 to<br />
1998, for the five most valuable nearshore species currently fished, the North County accounted for 23<br />
percent of area lobster value, 0.6 percent of area urchin value, 30 percent of rock crab value, 12 percent<br />
of halibut value, and 14 percent of sheephead value. In order to result in even a 10 percent reduction of<br />
the overall San Diego county fishery for any of these species, the project would have to degrade the North<br />
County lobster catch by over approximately 43 percent; rock crab catch by one-third; and nearly eliminate<br />
Page 4.8-2<br />
<strong>Regional</strong> <strong>Beach</strong> <strong>Sand</strong> <strong>Project</strong> <strong>EIR</strong>/<strong>EA</strong><br />
99-69\SANDAG <strong>EIR</strong><strong>EA</strong> 4.1 to 4.13.wpd 7/17/00
4.8 Socioeconomics<br />
the North County halibut (with a 83 percent decline) and sheephead (with a 71 percent decline) fisheries.<br />
None of these conditions are considered likely to result from the proposed project.<br />
Setting aside the halibut, sheephead, and urchin fisheries as having relatively low levels of effort in the North<br />
County, it is possible that there would be localized impacts on the lobster and rock crab fisheries. That is,<br />
if fishermen are displaced from certain areas, effort will be directed toward other areas. This shift in effort<br />
could result in a marked increase in fishing pressure on the areas to which the effort was redirected and<br />
cause localized overfishing of these resources. This type of impact, except for small areas, is not<br />
considered likely for several reasons. First, the model-predicted sand movement shows a concentration<br />
of longer term sand deposits in relatively few, relatively small areas. These are typically near the mouths<br />
of lagoons (there are several in the North County) and/or where the coast contains a feature that is irregular<br />
enough to disrupt the smooth flow of sand in the nearshore area (North Carlsbad and Moonlight <strong>Beach</strong><br />
areas). Second, fishermen will attempt to avoid reducing their catch per unit by not placing too much gear<br />
in any one area. Third, fishermen move traps that are not productive, so that effort is redistributed based<br />
on relative level of success.<br />
Preclusion in the Local Level Perspective. Using available quantitative data to examine small, localized<br />
impacts within the North County area is difficult. In general, there is an inherent difficulty in using available<br />
quantitative data to assess localized impacts to the fishery. CDFG data are collected by two separate<br />
geographies: fish block data for catch and port data for landings. Landings data are useful for a look at<br />
fisheries in a general area, but (particularly in the case of larger ports) may include data from resources<br />
caught considerable distances away from the port. Fish block data, while more closely tied to the actual<br />
distribution of resources, is less useful in understanding localized impacts. Fish blocks encompass an area<br />
that is 10 minutes longitude by 10 minutes latitude, except as reduced in size where a particular block<br />
intersects the coastline (Figure 3.8-1). In general, these areas are too large to capture localized project<br />
impacts. While the CDFG data have inaccuracies, they are the best available data and are supplied by<br />
local fishermen (and fish buyers) themselves. Potential inaccuracies are somewhat minimized, however,<br />
by using data from more than one block, and checking San Diego port data against Oceanside port data.<br />
Another problem in quantifying potential impacts attributable to the project is the inherent variability of the<br />
fishery from year to year. The relatively large (normal) fluctuations seen from year to year could serve to<br />
either dampen or accentuate project-related impacts. For example, lobster landings at Oceanside dropped<br />
approximately four-fold volume and value from 1997 to 1998. In this case, the trend is generally attributed<br />
<strong>Regional</strong> <strong>Beach</strong> <strong>Sand</strong> <strong>Project</strong> <strong>EIR</strong>/<strong>EA</strong> Page 4.8-3<br />
99-69\SANDAG <strong>EIR</strong><strong>EA</strong> 4.1 to 4.13.wpd 7/17/00
4.8 Socioeconomics<br />
to longer term effects of El Niño, but the fact that many variables are involved make future predictions<br />
difficult.<br />
One way to examine the potential impacts of preclusion to the local commercial fishery is to assess the<br />
impact of previous similar projects in the same area, at least on a general level. Local commercial fishermen<br />
have expressed concerns that previous beach replenishment operations have caused the loss of commercial<br />
resources and created a “dead zone” off the beach, which has taken several years to return to normal. The<br />
concern is that the proposed project will create similar impacts.<br />
There have been numerous beach replenishment projects in the proposed project area that have been more<br />
or less similar to the proposed project. For example, between 1954 and 1988 there were 37 major beach<br />
replenishment projects for Oceanside and Carlsbad (mainly the beaches near Agua Hedionda Lagoon),<br />
or an average of about one project per year. Average annual sand volumes for these projects were over<br />
600,000 cy per year (USACOE 1991). Between 1981 and 1999, there have been over 28 major beach<br />
replenishment projects for Oceanside and Carlsbad that have placed more than 9.8 million cy of sand on<br />
the beach, which averages out to over 515,000 cy per year for these beaches (Coastal Environments 1998<br />
and Appendix D). By way of contrast, Alternative 1 would deposit 760,000 cy on the beaches of<br />
Oceanside and Carlsbad. This volume would exceed the annual average but is within the historical range<br />
of previous projects. There have been seven other replenishment projects for Carlsbad and Oceanside that<br />
were larger than 900,000 cy between 1954 and 1996 (USACOE 1991, Coastal Environments 1998).<br />
To understand the relationship to previous projects and the performance of the local commercial fishery,<br />
an evaluation was performed of landings reported and past replenishment projects. In 1995, over 2 million<br />
cy was placed on the beaches at Carlsbad. Commercial lobster landings reported for the port of<br />
Oceanside for the following year (1996) were at record levels for both volume and value, far outdistancing<br />
any of the previous 15 years (see Figure 3.8-2). Landings of rock crab at Oceanside in 1996 were also<br />
high. In fact, it was the best year for rock crab since 1981. During 1996, there was an additional 802,000<br />
cy sand put on the beaches at Oceanside and Carlsbad. Following the large beach replenishment projects<br />
of 1995 and 1996, the lobster catch in 1997 was the best year ever, surpassing the 1996 record year in<br />
terms of volume and value of catch landed at Oceanside. The reported rock crab harvest for 1997 was<br />
down from 1996 levels, but still accounted for the highest volume and value of landings for any other year<br />
since 1981. Thus, based on the CDFG data for Oceanside landings, there is no evidence of local impacts<br />
to the lobster or crab fisheries as a result sand replenishment projects in 1995 and 1996.<br />
Page 4.8-4<br />
<strong>Regional</strong> <strong>Beach</strong> <strong>Sand</strong> <strong>Project</strong> <strong>EIR</strong>/<strong>EA</strong><br />
99-69\SANDAG <strong>EIR</strong><strong>EA</strong> 4.1 to 4.13.wpd 7/17/00
4.8 Socioeconomics<br />
Generally, beach replenishment has occurred for decades and there still appears to be an abundance of<br />
sensitive habitats, while the commercial catch reported for Oceanside remains high for most commercial<br />
species. The catch trends for commercial species landed at the port of San Diego generally are similar to<br />
the trends for landing at Oceanside (Figure 3.8-2), suggesting that area factors are much more important<br />
than local factors in determining catch. This also suggests that the numerous beach replenishment projects<br />
in the North County have had minimal effect on commercial resources. If beach replenishment does impact<br />
commercial catch, then these impacts must be localized and fisherman make up deficits by fishing in other<br />
areas. This would imply that resources are well distributed within each fish block so that localized impacts<br />
have little effect overall.<br />
It appears that declines in local fisheries may be more strongly linked to variables other than beach sand<br />
replenishment. It is known that El Niño events and winter storms have significant impacts on commercial<br />
fisheries. The 1997-98 El Niño has been followed by a precipitous drops in commercial catch for almost<br />
every species for all of San Diego county. These regional trends in catch data are indicative of large scale<br />
oceanographic events and not localized projects such as beach replenishment. The 1982-83 El Niño had<br />
a much less measurable impact. Other factors include winter storms that cause loss of equipment and<br />
hinder fisherman from working their traps.<br />
Based on the available baseline fisheries data, there is likely to be no significant regional or localized impact<br />
in the San Diego area or the North County subarea fisheries. Impacts may be felt at the individual fishing<br />
operation level as a result of displacement from favored fishing locations; however, the individual<br />
operational level impacts cannot be accurately quantified with the currently available data.<br />
Alternative 1 would require approximately 147 days of dredging with an additional 30-40 days for<br />
equipment movements. Even though the dredging duration will extend for months, only a small area of the<br />
60 mile coastline would be affected at any one time. That is, with only one or (possibly) two dredges<br />
operational for the project, the actual area that would be affected at any point in time would be localized<br />
and not preclude other areas from being fished. Additionally as described in Section 2.4, SANDAG is<br />
committed to coordinating dredge operations with the commercial fisherman so that, via timely notification,<br />
areas can be fished the maximum amount of time and only the area of active dredge would be restricted.<br />
Thus, there would be no significant long-term preclusion impacts as a result of the dredging operations.<br />
<strong>Regional</strong> <strong>Beach</strong> <strong>Sand</strong> <strong>Project</strong> <strong>EIR</strong>/<strong>EA</strong> Page 4.8-5<br />
99-69\SANDAG <strong>EIR</strong><strong>EA</strong> 4.1 to 4.13.wpd 7/17/00
4.8 Socioeconomics<br />
Loss of Nursery Habitat<br />
The nearshore trap fisheries most likely to be affected include lobster, crab, and fish (mainly sheephead).<br />
While direct impacts of the proposed project can be evaluated relative to the commercial resources,<br />
indirect effects cannot easily be predicted. There is essentially no available information upon which to<br />
objectively evaluate the effects of turbidity and sand transport upon the recruitment, growth, and maturation<br />
of juvenile lobster on the North County coast. NEPA Regulations promulgated by the Council on<br />
Environmental Quality (CEQ) address the required approach where incomplete or unavailable information<br />
is an issue (40 C.F.R. 1502.22). Generally, the fact that information is unavailable must be indicated and<br />
existing, credible scientific evidence which is relevant must be summarized so that methods generally<br />
accepted by the scientific community can be utilized. Section 3.8 summarizes the limited studies in New<br />
Zealand on sediment/ turbidity and juvenile lobsters. This impact analysis uses that data as well as a focus<br />
on the effects of the project on habitats which support lobster populations, specifically surfgrass for nursery<br />
and hard bottom for shelter/foraging. Fish block data for Port of Oceanside landings indicate that 62<br />
percent of the catch came from the Encinitas/Solana <strong>Beach</strong> fish block area, 29 percent for Oceanside, and<br />
9 percent from Del Mar/Torrey Pines. These landings data tend to correlate with the amount of hard<br />
bottom and surfgrass resources reported from within each of these areas. This general correlation tends<br />
to support this approach of evaluating effects to lobster with effects to surfgrass or substrate.<br />
Lobsters are creatures of the nearshore zone and are adapted to wave surge, turbidity, siltation and sand<br />
burial of habitat. Juvenile lobsters spend one to two years in the nearshore area and are dependent upon<br />
surfgrass and hard bottom reef habitats as a nursery area and a refuge from predators. The effects of the<br />
beach replenishment and subsequent redistribution of the sands upon these habitats has the potential to<br />
cause loss of commercial resources. The project has been designed to avoid indirect impacts to intertidal<br />
surfgrass which would minimize potential impacts to lobster nursery areas (Section 4.4). However, some<br />
nearshore low-lying reefs, including one with nearshore surfgrass, would be temporarily covered by sand<br />
redistribution and this could cause a short-term loss of habitat for juvenile lobsters. The significance of this<br />
effect upon juvenile lobsters is difficult to determine, but it is judged to be less than significant based upon<br />
the small area of predicted reef burial compared to the total available reef habitat. As noted in Section 4.4,<br />
three small reefs south of the North Carlsbad receiver site, with a total area of 0.24 acre has surfgrass<br />
which may experience partial sedimentation. However, in relation to the approximately 40 acres of<br />
observed intertidal zone surfgrass reefs from Oceanside to Torrey Pines, and the assumed presence of a<br />
similar sized area in the nearshore area along this same stretch of coast, the area of surfgrass experiencing<br />
partial sedimentation is insignificant. Under the worst-case assumption, partial sedimentation is predicted<br />
Page 4.8-6<br />
<strong>Regional</strong> <strong>Beach</strong> <strong>Sand</strong> <strong>Project</strong> <strong>EIR</strong>/<strong>EA</strong><br />
99-69\SANDAG <strong>EIR</strong><strong>EA</strong> 4.1 to 4.13.wpd 7/17/00
4.8 Socioeconomics<br />
on up to 3.2 acres of reefs that support some giant kelp at five locations and 0.3 acre of reef with feather<br />
boa near the three receiver sites from North Carlsbad to Solana <strong>Beach</strong>. While increases in turbidity and<br />
sand burial will occur from the proposed project, these effects are similar to those of beach replenishment<br />
projects that have been ongoing for over four decades with no apparent effect on resources. Therefore,<br />
the proposed projects may have an adverse impact on the area’s ability to function as juvenile lobster<br />
habitat, but this effect is judged to be short-term and less than significant. Localized impacts are predicted<br />
to occur over the combined 3.7 acres of reef areas supporting surfgrass, kelp, and feather boa that may<br />
experience partial sedimentation under worst-case assumptions, and may be significant for small areas, but<br />
are not expected to result in a significant impact to lobsters at the local population level.<br />
Natural turbidity and silting of reefs from coastal lagoons and river discharges following winter storms does<br />
not seem to produce the same effect as catch rates generally remained high in these areas (Guth 1999).<br />
This suggests that it may not be strictly turbidity or siltation effects causing perceived resource loss off of<br />
replenished beach sites, and other unmeasured or unknown factors may be responsible. These factors<br />
could include sediment contaminants and pathogens that are exposed during dredging and redistributed<br />
during beach replenishment. Testing of borrow site sediments found no evidence of chemical contamination<br />
(Section 3.3). The closest wastewater outfall to any proposed borrow site is at SO-6 which is over 4,000<br />
ft from the discharge area. The other borrow sites are in excess of two miles from wastewater outfalls.<br />
Thus, there is little potential for the borrow site sediments to be a reservoir of pathogens.<br />
Direct impacts from dredging the borrow sites would not cause significant impacts to the lobster fishery.<br />
The area that would be affected by dredging the borrow sites represents from less than two percent of the<br />
available nearshore habitat and the dredge activity at any one location would be limited. Turbidity and<br />
siltation from dredging would also be localized and short-term (Section 4.3 and 4.4). After dredging,<br />
borrow sites would be deeper than surrounding areas but these areas are not expected to affect lobster<br />
movement or distribution. Therefore while increases in turbidity and siltation from dredging the borrow sites<br />
would be considered adverse in the short-term, no long-term significant impacts are expected to<br />
commercial species.<br />
The second most important commercial fishing resource, on the San Diego county level, is red urchins. This<br />
fishery, however, is highly concentrated outside of the North County area, with the La Jolla/Point Loma<br />
fish block alone accounting for 99 percent of the catch. This part of the fishery would not be affected by<br />
the proposed project. However, for a few fisherman in the North County, red urchins are an important<br />
resource. Red urchins inhabit kelp beds and nearby hard bottom reefs. These habitats will not be affected<br />
<strong>Regional</strong> <strong>Beach</strong> <strong>Sand</strong> <strong>Project</strong> <strong>EIR</strong>/<strong>EA</strong> Page 4.8-7<br />
99-69\SANDAG <strong>EIR</strong><strong>EA</strong> 4.1 to 4.13.wpd 7/17/00
4.8 Socioeconomics<br />
by dredging at the borrow sites. <strong>Sand</strong> redistribution from the beaches to nearshore low-lying reefs could<br />
temporarily cover some potential urchin habitat, however, these low-lying reefs are not prime habitat for<br />
red urchins who prefer higher reefs offering shelter from predation and increased potential to trap drift kelp,<br />
the preferred food source for this species. As described in Section 4.4, sedimentation on high relief reefs<br />
(over three feet) is not predicted. Partial sedimentation may occur on up to 3.2 acres of reefs which<br />
support some giant kelp at three locations (0.73 acre, North Carlsbad; 1.46 acres, Batiquitos; and 1.05<br />
acres, Solana <strong>Beach</strong>). Another 0.27 acre reef near Moonlight <strong>Beach</strong> with feather boa kelp would also<br />
experience partial sedimentation. As the sedimentation impact to kelp is minimal, the movement of sand<br />
into the subtidal from the beaches would not be significant.<br />
Localized decreases in visibility due to turbidity from borrow site dredging or from the beaches could affect<br />
diving conditions. This effect would be localized and of limited duration, and would not be significant.<br />
The rock crab/live fish fishery is another locally important commercial fishery. Rock crab was the third<br />
most valuable resource in the San Diego county. Landings for rock crab were highest for Point Loma/La<br />
Jolla area (58 percent), followed by the North County areas which were about 6 percent for Del<br />
Mar/Torrey Pines, 7 percent for Encinitas/Solana <strong>Beach</strong>, and about 29 percent for Oceanside. Within the<br />
North County area, crab is second in importance only to lobster. The majority of the crab fishing is in<br />
water depths greater than 90 feet. Proposed borrow sites are located at water depths from 50 to 80 feet,<br />
so there would be no significant impacts from the project to these resources.<br />
Sheephead is an important emerging fishery. Sheephead are inhabitants of kelp and rocky habitats. These<br />
habitats will not be affected by the borrow site dredging and therefore no significant effects are predicted.<br />
Redistribution of sand from the beaches would temporarily cover some low lying reef areas causing some<br />
short-term loss of potential sheephead habitat. However, sheephead are highly mobile and the amount of<br />
low-lying reef that will be affected is small and the loss is only temporary. As noted in Section 4.4, three<br />
small reefs totaling 0.24 acre south of the North Carlsbad receiver site, with surfgrass, may experience<br />
partial sedimentation. Similarly, under worst-case assumptions, 3.5 acres of reefs supporting kelp or<br />
feather boa from North Carlsbad to Solana <strong>Beach</strong> would experience partial sedimentation. Therefore,<br />
while some temporary impacts to low-lying reef may occur, this effect to sheephead would be considered<br />
less than significant.<br />
California halibut utilize the nearshore area and lagoons as feeding and nursery areas. Thus, the project<br />
could potentially affect this species. The project has been designed to avoid significant long-term impacts<br />
Page 4.8-8<br />
<strong>Regional</strong> <strong>Beach</strong> <strong>Sand</strong> <strong>Project</strong> <strong>EIR</strong>/<strong>EA</strong><br />
99-69\SANDAG <strong>EIR</strong><strong>EA</strong> 4.1 to 4.13.wpd 7/17/00
4.8 Socioeconomics<br />
to the coastal lagoons so no impacts to the lagoon nursery areas are expected. Some areas of the<br />
nearshore may temporarily be covered by sand moving off the beaches onto the subtidal area. This is not<br />
significant to halibut as their habitat is the sand bottom and they are well adapted to changes in near shore<br />
sand levels. Any dislocation of halibut due to turbidity or sand movement would be localized and<br />
temporary. Any effects from the proposed project on halibut is considered less than significant.<br />
Gear Loss<br />
Vessel traffic and dredge operations have the potential to conflict with traps. To reduce the potential for<br />
trap loss and conflict, and to minimize impacts associated with the incompatibility of dredge operations and<br />
fishing activities, pipeline corridors and vessel traffic lanes have been selected to avoid areas of kelp and<br />
hard bottom. As described in Section 2.4, SANDAG has committed to a protocol of coordination with<br />
commercial fisherman and the dredge operator to minimize, to the extent possible, gear conflict and<br />
disruption of fishing locations. As described in that text, transit corridors and the dredge locations for each<br />
borrow site would be noticed well in advanced of activity and a third party observer would be aboard the<br />
dredge to document any fishing gear in the noticed areas. Such gear, if damaged or destroyed, would not<br />
require compensation. If gear outside the noticed areas is damaged or destroyed, compensation would<br />
be the responsibility of the contractor. Significant potential impacts would be avoided by the process, or<br />
compensation would be provided as appropriate.<br />
Kelp Harvesting<br />
The project has been designed to minimize effects on kelp and kelp habitat. Dredging of the borrow sites<br />
would cause localized turbidity and siltation. However, the borrow sites have been designed to provide<br />
a minimum 500-foot buffer zone from kelp beds and potential kelp habitat (Section 4.4). This buffer zone<br />
is judged to be sufficient as the distances from the dredging will generally be much greater than 500 feet<br />
from these resources, the duration of turbidity will be intermittent and reach potential resources for only a<br />
few days at most. Therefore, the impact is considered less than significant. Turbidity from the beach sites<br />
and subsequent redistribution of the beach sand to the nearshore area could have adverse effects. As<br />
previously discussed, a total of 3.2 acres of reef with giant kelp may experience partial sedimentation under<br />
worst-case model predicted assumptions, near three receiver sites from North Carlsbad to Solana <strong>Beach</strong>.<br />
However, kelp habitat is generally not of high quality within the littoral cell (generally less than 30 ft depths)<br />
and effects from the beach receiver sites beyond the littoral cell are highly localized and represent a very<br />
small area.<br />
<strong>Regional</strong> <strong>Beach</strong> <strong>Sand</strong> <strong>Project</strong> <strong>EIR</strong>/<strong>EA</strong> Page 4.8-9<br />
99-69\SANDAG <strong>EIR</strong><strong>EA</strong> 4.1 to 4.13.wpd 7/17/00
4.8 Socioeconomics<br />
Recreational Fishing and Diving<br />
Impacts to the recreational fishing and diving include potential loss of resources, exclusion from<br />
fishing/diving areas, and decreased visibility for divers due to turbidity plumes. Sport diving for lobster and<br />
fishing for halibut in the nearshore area could be affected by the project as sand moves off of the receiver<br />
sites. Turbidity from the beaches and presence of pipelines will preclude usage of small areas for short<br />
periods. In the longer term, access for shore diving and surf fishing may improve with the placement of<br />
sand on the beaches.<br />
Because the borrow sites are located offshore of the beaches, surf fishing and beach diving most likely<br />
would not be affected by dredging and therefore no impacts are predicted. However, as discussed in<br />
Section 4.6, dredge area MB-1 is within the Mission Bay Artificial Reef (which includes Wreck Alley) and<br />
is adjacent to the San Diego Underwater Recreation Area. Wreck Alley contains the most popular local<br />
wrecks for dive charter businesses as well as recreational divers, but turbidity plumes are not projected to<br />
reach the dive sites. Divers may experience increased underwater noise at nearby wrecks, and dive boats<br />
and fishing vessels transiting between features may have to maneuver to avoid the dredge operations, but<br />
these inconveniences will be of short duration as dredging operations are only anticipated to last 11 days<br />
under Alternative 1a. Risk to the safety of divers from straying underwater into the dredge area is not<br />
expected to be an issue, as the closest wreck/sunken structure artificial reef is approximately 1,000 feet<br />
away from the dredge area. Further, divers typically descend to and ascent from the these offshore sites<br />
using permanently attached buoy/mooring lines, and normally do not stray from the structures farther than<br />
the limit of visibility. Therefore, these effects are considered less than significant.<br />
Sport fishing boats could be affected by dredging operations and turbidity plumes from the beaches. Some<br />
loss of sport fishing area would occur during actual dredge operations but this area would be substantially<br />
less than the available nearshore areas for sport fishing and short-term in nature at individual dredge<br />
locations. The impact would be less than significant.<br />
Mitigation Measures for Alternative 1a<br />
There would be no long-term significant impacts to commercial fisheries. As described in Section 2.4, a<br />
coordinated protocol would be implemented to notice commercial fisherman of dredge areas and transit<br />
locations and a gear compensation method is provided. This would provide fisherman the knowledge to<br />
Page 4.8-10<br />
<strong>Regional</strong> <strong>Beach</strong> <strong>Sand</strong> <strong>Project</strong> <strong>EIR</strong>/<strong>EA</strong><br />
99-69\SANDAG <strong>EIR</strong><strong>EA</strong> 4.1 to 4.13.wpd 7/17/00
4.8 Socioeconomics<br />
schedule their activities around the short-term dredge and construction activities associated with the<br />
project.<br />
Impacts of Alternative 1b<br />
The impacts of Alternative 1b would be similar to those identified for Alternative 1a, but they would be<br />
proportionally less based on the lesser area of preclusion resulting from a lesser volume of sand placed on<br />
the beaches.<br />
Mitigation Measures for Alternative 1b<br />
No significant impacts were identified; therefore, no mitigation measures are required. The protocol would<br />
apply for coordination with commercial fisherman in Section 2.4.<br />
4.8.2 Alternative 2<br />
Impacts of Alternative 2a<br />
The impacts of Alternative 2a would be similar to those identified for Alternative 1a, but somewhat smaller<br />
in area and different in specific location. Under worst-case assumptions, partial sedimentation of less than<br />
1.78 acres of reef that support some giant kelp is predicted. This partial sedimentation could occur near<br />
two receiver sites (North Carlsbad, 0.73 acre; Solana <strong>Beach</strong>, 1.05 acres). Less than 0.24 acre of reef<br />
area (to the south of the North Carlsbad receiver site) supporting surfgrass is predicted to experience<br />
partial sedimentation under worst-case assumptions. While temporary adverse impacts to commercial<br />
fisheries target species may occur on a localized basis, or at the individual fishing operation level due to<br />
temporary displacement from favored fishing sites, no significant commercial fisheries impacts are identified<br />
for Alternative 2a.<br />
Mitigation Measures for Alternative 2a<br />
No significant impacts were identified; therefore, no mitigation measures are required.<br />
<strong>Regional</strong> <strong>Beach</strong> <strong>Sand</strong> <strong>Project</strong> <strong>EIR</strong>/<strong>EA</strong> Page 4.8-11<br />
99-69\SANDAG <strong>EIR</strong><strong>EA</strong> 4.1 to 4.13.wpd 7/17/00
4.8 Socioeconomics<br />
Impacts of Alternative 2b<br />
The impacts of Alternative 2b would be similar to those identified for Alternative 2a, but they would be<br />
proportionally less based on the lesser area preclusion resulting from a lesser volume of sand placed on the<br />
beaches.<br />
Mitigation Measures for Alternative 2b<br />
No significant impacts were identified; therefore, no mitigation measures are required.<br />
Page 4.8-12<br />
<strong>Regional</strong> <strong>Beach</strong> <strong>Sand</strong> <strong>Project</strong> <strong>EIR</strong>/<strong>EA</strong><br />
99-69\SANDAG <strong>EIR</strong><strong>EA</strong> 4.1 to 4.13.wpd 7/17/00
4.9 Public Health and Safety<br />
4.9 PUBLIC H<strong>EA</strong>LTH AND SAFETY<br />
Public health and safety concerns are those that could have an impact on the welfare of the public affected<br />
by the proposed action. The following specific safety issues are addressed: public access and safety during<br />
project construction, lifeguard services, recreational safety, vessel traffic and safety, and potential public<br />
health and safety impacts resulting from the formation of beach scarps (i.e., the cut in the beach berm face<br />
caused by wave action). Potential impacts to the lifeguard towers (structures) on individual receiver sites<br />
are addressed in Section 4.10. While there would be more people present at each receiver site during the<br />
summer period potentially effected by a spring construction schedule, but the overall impact conclusions<br />
would not change given the short-term nature of the activity at any individual beach.<br />
R<br />
R<br />
R<br />
4.9.1 Significance Criteria<br />
For this analysis, determination of significance of potential public health and safety impacts is based on the<br />
level of safety precautions that would be implemented during replenishment activities. An impact to public<br />
health and safety would be significant if it would:<br />
• create a health hazard or potential health hazard;<br />
• expose people to potential health hazards; or<br />
• create navigation hazards or result in unsafe conditions for vessel traffic.<br />
4.9.2 Alternative 1<br />
Impacts of Alternative 1a<br />
Receiver Sites<br />
The following analysis is applicable to all 12 possible receiver sites.<br />
Public Access and Safety<br />
During the implementation of Alternative 1, the active construction zones at each receiver site would need<br />
to be closed to public access to prevent an unsafe condition. This is due primarily to the amount of heavy<br />
equipment that would be used to grade the beaches at these sites. Accordingly, during discharge<br />
<strong>Regional</strong> <strong>Beach</strong> <strong>Sand</strong> <strong>Project</strong> <strong>EIR</strong>/<strong>EA</strong> Page 4.9-1<br />
99-69\SANDAG <strong>EIR</strong><strong>EA</strong> 4.1 to 4.13.wpd 7/17/00
4.9 Public Health and Safety<br />
operations, a portion of the beach would be closed at each site. This closure would affect the existing<br />
beach and offshore areas between the dredge (and its pipeline) and the receiver site. For more information<br />
on the closure at each receiver site, refer to Tables 2-2 and 2-4.<br />
During beach replenishment operations, the contractor selected to perform the beach building operations<br />
would provide all necessary safety measures in the vicinity of the receiver beaches, including fencing,<br />
barricades, and flag personnel, as necessary. The portion of the beach receiving sand would be closed to<br />
the public during the actual replenishment construction activities (Table 2-4). When all sand has been<br />
discharged and spread out at the closed section of the receiver site, the operation would continue along the<br />
receiver site to a new section of beach to be replenished. This would continue until the entire receiver site<br />
has been replenished. During replenishment operations, the land pipeline would be covered with sand at<br />
key access points. The sand covered parts of the pump line will create pedestrian bridges, at<br />
approximately 300-foot intervals, to ensure sufficient public access. As such, no significant impacts to<br />
public health or safety would result. This alternative would result in public health and safety benefits by<br />
adding sand to the eroded areas adjacent fragile bluffs.<br />
Lifeguard Services<br />
During construction of Alternative 1, the pipeline would be buried in front of accessways and launches for<br />
lifeguard boats and vehicles. A sand, cobble, or earthen ramp would allow for access from lifeguard<br />
stations, over the pipeline, and to the ocean. Similar ramps would provide north-south access over the<br />
discharge line for lifeguard vehicles and pedestrians. As such, lifeguard services would not be impeded with<br />
implementation of Alternative 1.<br />
The following receiver sites have temporary lifeguard towers in place during the summer months:<br />
Batiquitos, Leucadia, Moonlight <strong>Beach</strong>, Cardiff, Solana <strong>Beach</strong>, Mission <strong>Beach</strong>, and Imperial <strong>Beach</strong>. If<br />
sand replenishment occurs during the summer season when the temporary lifeguard towers are onsite,<br />
SANDAG will coordinate with the respective jurisdiction to temporarily relocate the towers during<br />
construction. Temporary relocation would not impair the ability of lifeguards to ensure public safety since<br />
this portion of the beach would be closed to the public during construction activities. The towers would<br />
be replaced after sand placement, before the beach is reopened for recreational uses. Near permanent<br />
lifeguard towers, sand would be dug out where necessary to preserve the line-of-sight from tower viewing<br />
platforms. As long-term beach safety would not be affected by implementation of the proposed action, no<br />
significant impacts to lifeguard stations would occur.<br />
Page 4.9-2<br />
<strong>Regional</strong> <strong>Beach</strong> <strong>Sand</strong> <strong>Project</strong> <strong>EIR</strong>/<strong>EA</strong><br />
99-69\SANDAG <strong>EIR</strong><strong>EA</strong> 4.1 to 4.13.wpd 7/17/00
4.9 Public Health and Safety<br />
Recreational Safety<br />
As described in Section 3.9, extensive sediment characterization analyses were conducted for the proposed<br />
receiver sites as part of this project (Sea Surveyor 1999; FRH 1997). These analyses were conducted<br />
in accordance with USACOE, USEPA, and RWQCB procedures for dredged sediment. Based on<br />
sediment studies, it was determined that the dredged material from the offshore borrow sites is suitable for<br />
beach replenishment and does not pose a threat to public health and safety. No impacts would occur with<br />
implementation of this alternative.<br />
Although not anticipated, the possibility exists that unforseen wastes and materials could be dredged from<br />
the offshore borrow sites. Borrow sites have been tested for the suitability of the dredge materials to be<br />
placed on the receiver beaches; nonetheless, illegal dumping activities do occur in offshore waters and the<br />
proposed borrow sites might contain hazardous or dangerous materials. In the event that hazardous or<br />
dangerous materials are found in dredge spoils, dredging and disposal activities would immediately stop.<br />
An evaluation would be made to determine the extent of the contamination and most appropriate treatment<br />
of the site.<br />
Scarps<br />
Scarp height is a function of the breaking wave height and the elevation of the existing beach berm. Scarps<br />
develop naturally along the beach profile and vary in height due to significant changes in the beach profile<br />
(i.e., a drastic drop in elevation).<br />
Large scarps may result in safety hazards due to substantial changes in the beach profile (i.e., a drastic drop<br />
in elevation). Because scarps are a function of beach berm height, placement of fill on the receiver sites<br />
would not increase scarp height, provided fill is placed to the height of the existing beach berm (Department<br />
of the Navy 1997b). The proposed action specifies that beach fill would not be placed above the height<br />
of the existing beach berm. Therefore, safety impacts due to increased scarp heights would not occur upon<br />
implementation of this alternative.<br />
Borrow Sites (Vessel Safety)<br />
The potential for a vessel to collide with a dredge or support vessel would be extremely remote. The<br />
dredge would be equipped with markings and lights in accordance with U.S. Coast Guard regulations. The<br />
<strong>Regional</strong> <strong>Beach</strong> <strong>Sand</strong> <strong>Project</strong> <strong>EIR</strong>/<strong>EA</strong> Page 4.9-3<br />
99-69\SANDAG <strong>EIR</strong><strong>EA</strong> 4.1 to 4.13.wpd 7/17/00
4.9 Public Health and Safety<br />
location and schedule of the dredge would be published in the U.S. Coast Guard Local Notice to Mariners.<br />
Thus, local boaters should be aware of the location of the dredge. A hopper dredge would travel at<br />
relatively slow speeds (approximately 1.7 knots) during actual dredging operations. The travel speed<br />
would also be slow (approximately 5 knots) during the transport of sand from the borrow sites to the<br />
receiver sites.<br />
For vessel safety reasons, an approximate 500- by 500-foot buffer area would be maintained around the<br />
dredge offshore waters, to allow proper anchoring and pump line operation. To ensure that no vessels<br />
would enter the offshore restricted zone, the anchoring area would be included in the Notice to Mariners,<br />
which is overseen by the U.S. Coast Guard. Also, any pump lines used during beach replenishment efforts,<br />
whether they be floating or submerged, would be clearly marked as navigational hazards. This short-term<br />
increase in vessel traffic would be negligible as compared to the total areal vessel traffic, and the limited<br />
distance of travel to set and remove the pump line. Accordingly, significant impacts to public health and<br />
safety would not result with implementation of this alternative.<br />
Mitigation Measures for Alternative 1a<br />
No significant impacts have been identified; accordingly, no mitigation measures would be necessary.<br />
Impacts/Mitigation Measures for Alternative 1b<br />
This alternative would differ from Alternative 1a in that construction of the proposed action would comply<br />
with applicable jurisdictions’ noise ordinances (refer to Table 2-2). Because dredging and replenishment<br />
activities would take a longer amount of time, public access to the actual zones of construction would be<br />
closed for a longer period of time. Also, lifeguard towers would be moved for a longer period of time until<br />
construction is completed. Although this alternative would take longer to implement, it would still be shortterm,<br />
and no significant impacts are anticipated. Accordingly, no mitigation measures would be necessary.<br />
4.9.3 Alternative 2<br />
Impacts of Alternative 2a<br />
Public health and safety impacts under this alternative would be similar to those described for Alternative<br />
1. The South Carlsbad South receiver site proposed under this alternative also has temporary lifeguard<br />
Page 4.9-4<br />
<strong>Regional</strong> <strong>Beach</strong> <strong>Sand</strong> <strong>Project</strong> <strong>EIR</strong>/<strong>EA</strong><br />
99-69\SANDAG <strong>EIR</strong><strong>EA</strong> 4.1 to 4.13.wpd 7/17/00
4.9 Public Health and Safety<br />
towers in place during summer months. If sand replenishment occurs during the summer season when the<br />
temporary lifeguard towers are onsite, SANDAG will coordinate with the respective jurisdiction to<br />
temporarily relocate the towers during construction. Temporary relocation would not impair the ability of<br />
lifeguards to ensure public safety since this portion of the beach would be closed to the public during<br />
construction activities. The towers would be replaced after sand placement, before the beach is reopened<br />
for recreational uses. This alternative would benefit those areas threatened by bluff failure. However,<br />
Encinitas beaches near fragile bluffs (i.e., Batiquitos, Leucadia, and Moonlight receiver sites) would not<br />
receive this benefit under Alternative 2. No other differences exist between the alternatives that would<br />
result in impacts to public health and safety. Accordingly, impacts would be less than significant.<br />
Mitigation Measures for Alternative 2a<br />
No mitigation measures would be necessary because no significant impacts have been identified.<br />
Impacts/Mitigation Measures for Alternative 2b<br />
This alternative would differ from Alternative 2a in that construction of the proposed action would comply<br />
with applicable jurisdictions’ noise ordinances (refer to Table 2-6). Because dredging and replenishment<br />
activities would take a longer amount of time, public access to the actual zones of construction would be<br />
closed for a longer period of time. Also, lifeguard towers would be moved for a longer period of time until<br />
construction is completed. Although this alternative would take longer to implement, it would still be shortterm,<br />
and no significant impacts are anticipated. Accordingly, no mitigation measures would be necessary.<br />
4.9.4 No Action Alternative<br />
Under the No Action Alternative, no dredging or replenishment activities would occur. At some receiver<br />
beaches, waves would continue to erode fragile bluffs that support property and structures, including<br />
housing. The erosion would continue unabated. Public health and safety would likely deteriorate without<br />
sand replenishment activities.<br />
<strong>Regional</strong> <strong>Beach</strong> <strong>Sand</strong> <strong>Project</strong> <strong>EIR</strong>/<strong>EA</strong> Page 4.9-5<br />
99-69\SANDAG <strong>EIR</strong><strong>EA</strong> 4.1 to 4.13.wpd 7/17/00
4.10 Structures and Utilities<br />
4.10 STRUCTURES AND UTILITIES<br />
This section addresses structures and utilities that could be affected by implementation of the proposed<br />
action. The season of construction has no bearing on the impact analysis.<br />
R<br />
4.10.1 Significance Criteria<br />
Impacts to structures and utilities would be significant if they would (1) result in the need for new systems<br />
or (2) result in substantial alterations to existing systems. Because an increase in service demand would<br />
not occur with the proposed action, this analysis focuses on displacement or disruption of structures and<br />
utilities.<br />
4.10.2 Alternative 1<br />
Impacts of Alternative 1a<br />
Receiver Sites<br />
South Oceanside<br />
A buried sanitary sewer ocean outfall pipe located just north of Loma Alta Creek would not be impacted<br />
by Alternative 1. The pipe would not be displaced and interruption in service would not occur because<br />
the pipe is located beneath the surface. The proposed beach fill would be beneficial for this outfall structure<br />
because the sand would serve as additional cover to protect the pipeline. The existing outlets for the storm<br />
drains at the end of Marron Street, Tyson Street, and the pipe at Forster Street would be below the<br />
proposed sand fill. As described in Section 2.4, sand placement around storm drain outlets would be dug<br />
out to allow proper drainage. Accordingly, impacts would be less than significant.<br />
The bottom of the public stairs at the end of Tyson Street, Ash Street, Marron Street, Cassidy Street, and<br />
Vista Way may be covered by the fill, which would tend to stabilize the stairways. As public access to the<br />
beach via these stairways would not be affected, significant impacts would not occur upon implementation<br />
of Alternative 1. The public access ramps at Wisconsin Street, Forster Street, and just north of Loma Alta<br />
Creek would not be affected. The access road at Oceanside Boulevard would also not be impacted<br />
because sand placement would cover only the lower end of the road. A private stairway with access to<br />
<strong>Regional</strong> <strong>Beach</strong> <strong>Sand</strong> <strong>Project</strong> <strong>EIR</strong>/<strong>EA</strong> Page 4.10-1<br />
99-69\sect-04.10.wpd 7/19/00
4.10 Structures and Utilities<br />
the beach is located north of the creek. No adverse impacts to this structure would occur as a result of<br />
Alternative 1. Existing private stairways to the beach may be partially covered. No impacts would occur,<br />
however, because the fill would provide additional protection to the stairway and would not impact access<br />
to the beach.<br />
<strong>Sand</strong> placement around stationary lifeguard towers within the replenishment footprint would be conducted<br />
by placing sand around the towers without removing them. The proposed fill at Tower No. 9 would not<br />
be higher than the lifeguard’s line-of-sight since the tower is raised atop the concrete/rip-rap structure. At<br />
Tower No. 11, the proposed fill would be approximately 13 feet above MLLW compared to the<br />
lifeguard’s platform just under 11 feet above MLLW. As described in Section 2.4, the portion of the<br />
proposed fill that is higher than the viewing platform would be removed to preserve line-of-sight views for<br />
lifeguards. The sand will provide additional protection against storm surge damage and would temporarily<br />
benefit the lifeguard towers; no adverse impacts would occur.<br />
North Carlsbad<br />
The Buena Vista Lagoon Weir north of the receiver site would not be impacted by any sand placed within<br />
the site boundaries. Its associated drainage outlet structure is located adjacent to the bottom of the public<br />
access stairway off Ocean Street, with two storm drain outlets located approximately 8.5 feet above the<br />
existing beach surface at the base of the stairs. The top of the proposed sand fill would lie approximately<br />
9.6 feet above the existing surface. Potential impacts could occur if beach replenishment activities blocked<br />
the opening of the drains and interrupted service. However, implementation of Alternative 1 would require<br />
storm drain discharge flow paths to remain unobstructed; therefore, significant impacts to storm drains<br />
would not occur.<br />
As discussed in Section 3.10, public access stairs are located off Ocean Street, Beech Avenue, Grand<br />
Avenue, and Carlsbad Village Drive. In addition, several residential properties have private stairways for<br />
beach access, several of which reach the beach surface. Many private stairways end above the beach<br />
surface. Although implementation of Alternative 1 would raise the beach surface and cover the bottom<br />
portion of some of these stairways with sand, beach access would not be restricted. Some existing stairs<br />
may reach the sand surface which would be a beneficial effect. Overall, adverse impacts to access stairs<br />
would not occur upon implementation of Alternative 1. <strong>Beach</strong> access via the access road at Pine Avenue<br />
would not be impacted, since sand placement would not extend past the base of the road.<br />
Page 4.10-2<br />
<strong>Regional</strong> <strong>Beach</strong> <strong>Sand</strong> <strong>Project</strong> <strong>EIR</strong>/<strong>EA</strong><br />
99-69\sect-04.10.wpd 7/19/00
4.10 Structures and Utilities<br />
Several properties along this stretch of beach have sea walls. Although weep holes (i.e., small holes<br />
designed to drain accumulated water) would be covered upon implementation of the proposed project, the<br />
majority of sea wall tops would not be covered. Several properties have terraced sea walls and<br />
landscaping; the lower terraces of which would be covered by the sand fill. As additional sand fill would<br />
stabilize the shoreline and protect against erosion, implementation of Alternative 1 would not significantly<br />
impact sea walls in the vicinity of the North Carlsbad receiver site.<br />
Lifeguard Tower No. 9, although a temporary structure, is surrounded by rocks for erosion protection, and<br />
is not moved during the winter season. <strong>Sand</strong> would be placed as close to the tower as possible to provide<br />
additional protection against damage. The viewing platform for this tower is approximately 18 feet above<br />
MLLW, and the proposed beach fill would be approximately 12 feet above MLLW. As such, no viewing<br />
interference would occur to this lifeguard tower. No negative impacts would occur to the tower with<br />
implementation of the Alternative 1.<br />
South Carlsbad North<br />
The only structure located within the sand receiver site is Lifeguard Tower No. 13, which is located high<br />
on the bluff above the sand. No impacts would occur to the tower with sand placement.<br />
Batiquitos<br />
The storm drain at Moorgate Road is approximately 4.9 feet above the sand, and the proposed fill at the<br />
Batiquitos receiver site would be approximately 12 feet above MLLW. Measures to ensure continued flow<br />
through the storm drain would be implemented to prevent impacts to the storm drain.<br />
The lower portions of both the public and private access stairs may be covered with sand. This would have<br />
the beneficial effect of stabilizing the structures. <strong>Sand</strong> placement would not extend past the sea wall,<br />
although some weep holes may be covered during sand placement. Although portions of the vegetated<br />
groundcover may be covered by fill, no impacts would occur because the fill would minimize erosion,<br />
similar to the groundcover.<br />
If placement occurs during the summer season, when the lifeguard towers are located on the beach,<br />
SANDAG would coordinate with the State to temporarily relocate the towers from the site during<br />
<strong>Regional</strong> <strong>Beach</strong> <strong>Sand</strong> <strong>Project</strong> <strong>EIR</strong>/<strong>EA</strong> Page 4.10-3<br />
99-69\sect-04.10.wpd 7/19/00
4.10 Structures and Utilities<br />
construction. For public health and safety issues related to lifeguard towers, refer to Section 4.9 (Public<br />
Health and Safety).<br />
Leucadia<br />
Lower portions of the public access stairways, ramp, and seasonal lifeguard tower would not be covered<br />
by fill during sand placement, as the receiver site does not encompass these structures. Beneficial impacts<br />
would occur to the numerous private stairways that extend to the beach within the receiver site footprint,<br />
as the proposed fill would provide additional support.<br />
Moonlight <strong>Beach</strong><br />
Storm drain pipes are located at the end of B Street at Moonlight State <strong>Beach</strong> and include one 36-inch,<br />
one 60-inch, and three 48-inch pipes. The invert elevations of these storm drain outlets are approximately<br />
8 feet above MLLW, which is approximately 2 feet below the top of the proposed beach fill. Low<br />
drainage flow typically seeps under any sand or cobble that has accrued over the outlet at these locations.<br />
During heavy drainage discharge, the flow creates its own path to the ocean. Nonetheless, sand placed<br />
at the receiver sites near the storm drain pipes would be excavated to allow proper drainage. Adverse<br />
impacts to storm drain outlets would be consequently avoided.<br />
Public access stairways are located within the vicinity of the proposed receiver site, with stairway base<br />
elevations ranging from 1.6 to 11.5 feet. Alternative 1 would cover the bottom portion of the stairways<br />
with fill, which would tend to stabilize the stairways and structures. <strong>Beach</strong> access would not be affected<br />
by implementation of Alternative 1.<br />
The lifeguard towers located at B and C Streets are not moved during the winter season. <strong>Sand</strong> would be<br />
placed as close to the base of the towers as possible and would provide beneficial impacts to the towers<br />
through stabilization and reduced erosion. Both towers’ platforms are approximately 18 feet above MLLW<br />
because they are located on a berm. The proposed beach fill would be approximately 12 feet above<br />
MLLW. As such, no viewing interference would occur to this lifeguard tower, and no impacts would<br />
occur.<br />
Page 4.10-4<br />
<strong>Regional</strong> <strong>Beach</strong> <strong>Sand</strong> <strong>Project</strong> <strong>EIR</strong>/<strong>EA</strong><br />
99-69\sect-04.10.wpd 7/19/00
4.10 Structures and Utilities<br />
Cardiff<br />
The proposed sand fill would provide additional protective covering for the sewer outfall pipe which would<br />
be a beneficial effect.<br />
<strong>Sand</strong> placement would not extend to the rip-rap protection surrounding the parking lot or restaurants,<br />
therefore, no impacts would occur. Lower portions of the lifeguard access ramp may be covered with fill,<br />
but this would not impact access to the beach. If placement occurs during the summer months when<br />
Lifeguard Tower No. 6 is located on the beach, SANDAG would coordinate with the State to temporarily<br />
relocate it from the beach until after construction is completed (see also Section 4.9, Public Health and<br />
Safety). <strong>Sand</strong> would be placed as close as possible to Lifeguard Tower No. 5 in order to provide<br />
additional protection against erosion and storm surge. The proposed fill would be approximately 12 feet<br />
above MLLW, and the 15-foot viewing platform would not be affected. No viewing interference would<br />
occur to this lifeguard tower. Beneficial impacts would therefore occur to this lifeguard tower.<br />
Solana <strong>Beach</strong><br />
The proposed sand replenishment project would provide additional protective covering for the buried<br />
sewer outfall pipe, which would be a beneficial effect. Drainage through the storm drain to the ocean would<br />
be maintained by excavating a channel in the fill; therefore, no adverse impact is anticipated. The storm<br />
drain outlet located at Seascape Surf is high enough (i.e., at least 18 feet above MLLW) to avoid impacts<br />
by the 12 feet above MLLW beach fill proposed under Alternative 1. Therefore no significant impacts are<br />
anticipated.<br />
The public and private access ramp and stairs are located above the proposed fill area. Access to the<br />
beach would not be impacted. If sand placement occurs during the summer months when the lifeguard<br />
tower at Seascape Surf is located on the beach, SANDAG would coordinate with the City of Solana<br />
<strong>Beach</strong> to temporarily relocate them until construction is completed. The Fletcher Cove lifeguard tower<br />
would remain unaffected by beach replenishment activities. Refer to Section 4.9 for an evaluation of public<br />
health and safety.<br />
<strong>Regional</strong> <strong>Beach</strong> <strong>Sand</strong> <strong>Project</strong> <strong>EIR</strong>/<strong>EA</strong> Page 4.10-5<br />
99-69\sect-04.10.wpd 7/19/00
4.10 Structures and Utilities<br />
Del Mar<br />
<strong>Sand</strong> would be placed in front of the 17 th Street storm drain outlet, but would be excavated to allow proper<br />
drainage. Other storm drain outlets are located in the bluffs and would not be impacted by the proposed<br />
replenishment; no impacts would occur to storm drain outlets.<br />
The two access ramps near Powerhouse Park would not be affected by this alternative. Access to the<br />
beach would not be impacted.<br />
R<br />
R<br />
The permanent lifeguard towers would not be affected or blocked by the proposed fill. The viewing<br />
platforms are approximately 20 feet off the sand while the proposed beach fill would be approximately 11<br />
feet above MLLW. No impacts are anticipated to result from implementation of Alternative 1.<br />
Torrey Pines<br />
The permanent lifeguard tower located at the public parking lot at the base of Torrey Pines Road is located<br />
outside the proposed sand receiver site and would not be impacted by sand replenishment. No additional<br />
access points or structures exist within the vicinity of the proposed receiver site, and no impacts would<br />
occur upon implementation of Alternative 1.<br />
Mission <strong>Beach</strong><br />
The access stairs are incorporated into the boardwalk and are landward of the proposed receiver site.<br />
<strong>Beach</strong> access via these stairs would not be impacted, and access to the boardwalk itself would not be<br />
affected.<br />
Lifeguard Towers Nos.16 and 17 are seasonal towers that are removed from the beach the last weekend<br />
in October. If replenishment occurs while the towers are in place, SANDAG would coordinate with the<br />
City of San Diego to temporarily relocate them out of the receiver site until after replenishment is<br />
completed. Refer to Section 4.9 for public health and safety issues.<br />
Page 4.10-6<br />
<strong>Regional</strong> <strong>Beach</strong> <strong>Sand</strong> <strong>Project</strong> <strong>EIR</strong>/<strong>EA</strong><br />
99-69\sect-04.10.wpd 7/19/00
4.10 Structures and Utilities<br />
Imperial <strong>Beach</strong><br />
The public access ramp and gated access road are located above the proposed fill area and would not be<br />
impacted by sand replenishment. Emergency vehicle access at the ends of Admiralty Way and Descanso<br />
Avenue would not be impacted. If sand replenishment occurs during the summer season when the lifeguard<br />
tower is located within the receiver site, SANDAG would coordinate with the City of Imperial <strong>Beach</strong> to<br />
temporarily relocate it during construction. Section 4.9 (Public Health and Safety) addresses the effects<br />
of lifeguard tower relocation and beach usage.<br />
Borrow Sites<br />
Impacts to structures and utilities located within the proposed borrow sites are discussed in Section 4.6<br />
(Land Use).<br />
Mitigation Measures for Alternative 1a<br />
No significant impacts to utilities or structures were identified; no mitigation measures are required.<br />
Impacts/Mitigation Measures for Alternative 1b<br />
This alternative would differ from Alternative 1a in that construction of the proposed action would comply<br />
with applicable jurisdictions’ noise ordinances (refer to Table 2-2). Because dredging and replenishment<br />
activities would take a longer amount of time, the receiver sites would be closed longer than under<br />
Alternative 1a (refer to Table 2-2 and Table 2-4). Although this alternative would take longer to<br />
implement, it would still be short-term.<br />
As with Alternative 1a, replenishment would result in a beneficial impact to structures and utilities by<br />
stabilizing them; no significant impacts to structures and utilities are anticipated. Accordingly, no mitigation<br />
measures would be necessary.<br />
<strong>Regional</strong> <strong>Beach</strong> <strong>Sand</strong> <strong>Project</strong> <strong>EIR</strong>/<strong>EA</strong> Page 4.10-7<br />
99-69\sect-04.10.wpd 7/19/00
4.10 Structures and Utilities<br />
4.10.3 Alternative 2<br />
Impacts of Alternative 2a<br />
Receiver Sites<br />
Implementation of this alternative would result in similar effects to structures and utilities as analyzed for<br />
Alternative 1. <strong>Sand</strong> placement is beneficial for structures since it provides additional support and protection<br />
against erosion and storm damage during winter months.<br />
At the South Carlsbad South receiver site, the bottom portion of the public access stairway located at the<br />
State <strong>Beach</strong> may be covered by fill during sand placement. However, this action would tend to stabilize<br />
the stairways and structures. In addition, two lifeguard towers are located onsite with base elevations<br />
ranging from 6 feet to 12 feet. These towers are removed during the winter season and placed against the<br />
bluff north of the receiver site. If sand placement occurs during the summer season when the towers are<br />
within the site, SANDAG will coordinate with the City of Carlsbad to temporarily relocate the towers<br />
during construction. For public health and safety issues related to lifeguard towers, refer to Section 4.9<br />
(Public Health and Safety).<br />
Borrow Sites<br />
Impacts to structures and utilities located within the proposed borrow sites are discussed in Section 4.6<br />
(Land Use).<br />
Mitigation Measures for Alternative 2a<br />
No significant impacts to utilities or structures were identified under this alternative. Therefore, no mitigation<br />
measures are required with project implementation.<br />
Impacts/Mitigation Measures for Alternative 2b<br />
This alternative would differ from Alternative 2a in that construction of the proposed action would comply<br />
with applicable jurisdictions’ noise ordinances (refer to Table 2-6). Because dredging and replenishment<br />
activities would take a longer amount of time, the receiver sites would be closed longer than under<br />
Page 4.10-8<br />
<strong>Regional</strong> <strong>Beach</strong> <strong>Sand</strong> <strong>Project</strong> <strong>EIR</strong>/<strong>EA</strong><br />
99-69\sect-04.10.wpd 7/19/00
4.10 Structures and Utilities<br />
Alternative 2a (refer to Table 2-4 and Table 2-6). Although this alternative would take longer to<br />
implement, it would still be short-term.<br />
As with Alternative 2a, replenishment would result in a beneficial impact to structures and utilities by<br />
stabilizing them; no significant impacts to structures and utilities are anticipated. Accordingly, no mitigation<br />
measures would be necessary.<br />
4.10.4 No Action Alternative<br />
No dredging or beach replenishment activities would occur under the No Action Alternative. There would<br />
be no impacts to structures and utilities under this alternative and no mitigation measures would be<br />
necessary. The beneficial effect of stabilizing structures such as stairways and outfalls would not occur<br />
under this alternative.<br />
<strong>Regional</strong> <strong>Beach</strong> <strong>Sand</strong> <strong>Project</strong> <strong>EIR</strong>/<strong>EA</strong> Page 4.10-9<br />
99-69\sect-04.10.wpd 7/19/00
4.11 Traffic<br />
4.11 TRAFFIC<br />
This traffic impact section addresses the potential for the various alternatives to impact existing vehicular<br />
traffic and parking conditions in the vicinity of the receiver sites. It acknowledges the attractiveness of<br />
beaches during summer and potential parking conflicts. The analysis would not change given a spring<br />
construction start instead of late summer. Vessel traffic and safety concerns are discussed in Section 4.9<br />
(Public Health and Safety).<br />
R<br />
R<br />
R<br />
4.11.1 Significance Criterion<br />
Traffic and parking impacts would be significant if beach replenishment activities resulted in a long-term<br />
impact to access routes, local streets, or parking areas in the vicinity of the receiver sites.<br />
4.11.2 Alternative 1<br />
Impacts of Alternative 1a<br />
Implementation of Alternative 1 would require delivery of construction equipment and the commuting of<br />
work crews to the receiver sites. Construction vehicles would be driven to and kept on site for the duration<br />
of beach replenishment activities. At a maximum, 12 personnel would be working at a receiver site at any<br />
one time. <strong>Beach</strong> replenishment activities associated with Alternative 1 would not significantly affect traffic,<br />
as Alternative 1 would generate very few trips. The small increases in traffic volumes during replenishment<br />
would be temporary; and no long-term impacts to existing traffic and circulation patterns would occur.<br />
Replenishment personnel would park in public parking areas and would not create significant parking<br />
impacts given the small number of spaces required at each site.<br />
Subsequent to the completion of replenishment, some changes in traffic could also occur. The<br />
replenishment of receiver sites where there is currently little sand, such as Moonlight and Cardiff, could<br />
make these locations more attractive to both residents and tourists, and it is expected that traffic could<br />
increase accordingly. The use of parking would also increase. Some of the increase would come from new<br />
users, and some would come from users of adjacent, currently sandy, but less convenient beaches. In the<br />
latter case, there would be some decrease in traffic at the adjacent beaches.<br />
<strong>Regional</strong> <strong>Beach</strong> <strong>Sand</strong> <strong>Project</strong> <strong>EIR</strong>/<strong>EA</strong> Page 4.11-1<br />
99-69\sect-04.11.wpd 7/19/00
4.11 Traffic<br />
The replenishment of beaches with the most existing sand, such as Del Mar and Mission <strong>Beach</strong>, would also<br />
increase the attractiveness of the beach. However, the increase in use is likely to be less pronounced than<br />
at the currently rocky beaches, and increases in traffic and parking congestion would also be less.<br />
The most severe traffic and parking congestion would continue to occur on warm summer weekends and<br />
holidays, and the improvement of the beaches with sand replenishment may induce additional use that<br />
would marginally increase the congestion. Traffic and parking congestion at beaches is an accepted<br />
occurrence, and it is not common practice to design infrastructure to accommodate these peak loads.<br />
Additionally, the relatively limited amount of sand placed at an individual receiver site is predicted to remain<br />
noticeable at the beach for an average of two years (Table 4.1-1). This would reduce the long-term<br />
attractiveness of a site relative to other nearby locations, or to its condition prior to project implementation.<br />
The long-term impact of the proposed beach sand replenishment on traffic and parking would not be<br />
significant.<br />
Mitigation Measures for Alternative 1a<br />
No mitigation would be required.<br />
Impacts/Mitigation Measures for Alternative 1b<br />
With implementation of the longer construction schedule proposed under Alternative 1b, construction<br />
vehicles would require vicinity parking and access for a longer period of time, and more construction<br />
vehicle trips would result. Impacts during replenishment activities would still be less than significant due to<br />
the short-term nature of this alternative. No mitigation measures would be necessary.<br />
The post-replenishment impacts would be the same as for Alternative 1a, and would not be significant. No<br />
mitigation measures would be necessary.<br />
4.11.3 Alternative 2<br />
Impacts of Alternative 2a<br />
Alternative 2 would result in similar impacts to those described for Alternative 1. Impacts would be less<br />
than significant.<br />
Page 4.11-2<br />
<strong>Regional</strong> <strong>Beach</strong> <strong>Sand</strong> <strong>Project</strong> <strong>EIR</strong>/<strong>EA</strong><br />
99-69\sect-04.11.wpd 7/19/00
4.11 Traffic<br />
Mitigation Measures for Alternative 2a<br />
No mitigation would be required.<br />
Impacts/Mitigation Measures for Alternative 2b<br />
This alternative would differ from Alternative 2a in that construction of the proposed action would comply<br />
with applicable jurisdictions’ noise ordinances (refer to Table 2-6). Because dredging and replenishment<br />
activities would take a longer amount of time, construction vehicles would require vicinity parking and<br />
access to the receiver sites for a longer period of time. Also, more construction vehicle trips would result.<br />
Impacts would still be less than significant due to the short-term nature of construction under this alternative.<br />
No mitigation measures would be necessary.<br />
4.11.4 No Action Alternative<br />
As no beach replenishment activities would occur, no traffic impacts would result.<br />
<strong>Regional</strong> <strong>Beach</strong> <strong>Sand</strong> <strong>Project</strong> <strong>EIR</strong>/<strong>EA</strong> Page 4.11-3<br />
99-69\sect-04.11.wpd 7/19/00
4.12 Air Quality<br />
4.12 AIR QUALITY<br />
The principal sources of pollutant emissions for the proposed action include the following:<br />
• Combustion emissions from diesel engines used in dredging operations;<br />
• Combustion emissions from diesel engine driven booster pumps used for sand conveyance;<br />
• Combustion emissions from construction equipment at receiver sites used to install, position and remove<br />
conveyance piping and pumps, construct training berms, and distribute sand; and<br />
• Fugitive dust from earth (sand) moving operations.<br />
Generally, air quality is a regional issue, and potential impacts to air quality are evaluated on a regional<br />
basis. Localized impacts may be considered in cases of potential severe traffic congestion or the release<br />
of toxic air pollutants. Neither of these cases are applicable to the proposed action. Therefore, the air<br />
quality impact analysis considers the project as a whole, and not by individual receiver and borrow sites.<br />
Air quality impacts are also not dependent upon the season of construction.<br />
R<br />
4.12.1 Significance Criteria<br />
Air quality impacts would be considered significant if the action would<br />
• violate any federal or state ambient air quality standard;<br />
• contribute to an existing or projected air quality violation; or<br />
• expose sensitive receptors to criteria or toxic pollutant concentration in violation of applicable healthbased<br />
legal limit.<br />
As noted in Section 3.12, the SDAPCD does not have quantitative emissions limits for construction<br />
activities. It may be reasonably assumed for nonattainment pollutants, that if the project conforms to the<br />
SIP, then emissions would not violate any ambient air quality standard nor contribute to an existing or<br />
projected air quality violation. It may also be assumed that if the standards for nonattainment pollutants are<br />
applied to attainment pollutants, then conformance to these standards would result in emissions that would<br />
be less than significant.<br />
<strong>Regional</strong> <strong>Beach</strong> <strong>Sand</strong> <strong>Project</strong> <strong>EIR</strong>/<strong>EA</strong> Page 4.12-1<br />
99-69\sect-04.12.wpd 7/19/00
4.12 Air Quality<br />
Conformance to the SIP is demonstrated by obtaining of appropriate permits from the APCD, or by<br />
demonstrating that emissions would be less than de minimis thresholds established by the EPA.<br />
4.12.2 Alternative 1<br />
Impacts of Alternative 1a<br />
Dredge Operation Emissions<br />
The principal source of emissions from the dredge would be the diesel engines used for dredge propulsion,<br />
driving dredging pumps, and driving electric generators. These would be large diesel engines, and shortterm<br />
NO x emission rates would very likely exceed the APCD thresholds for daily emissions, for new and<br />
modified sources. This would require the applicant to obtain an Authority to Construct and Permit to<br />
Operate. As part of the permitting procedure, an Air Quality Impact Analysis would be performed, if<br />
necessary, to provide data relative to the anticipated NO x emission rates, and to demonstrate that state and<br />
federal air quality standards would not be violated, and there would be no significant impact. The air quality<br />
impact analysis would examine the health risk of toxic pollutant emissions (if any), and the permit process<br />
would assure avoidance of a significant impact. During the dredge operation in San Diego Bay for the<br />
Homeporting project, the Navy obtained a Permit to Operate which specified various conditions regarding<br />
fuel use, dredge limits, etc. A copy of the Permit to Operate for the dredge used on that project is included<br />
in Appendix F. It should be noted that dredge activity for the Homeporting project was related to creating<br />
a boat basin for a new carrier in San Diego Bay with a much larger quantity of dredged material. The<br />
conditions in that permit were project-specific and would not necessarily be applicable to the proposed<br />
action. Alternatively, an individual dredging vessel may be Registered with the California ARB and not<br />
require a specific air quality permit for this project.<br />
R<br />
R<br />
R<br />
R<br />
R<br />
A second important emissions source would be the smaller vessels supporting the dredge. These vessels<br />
include an anchor scow, a survey boat, and a small boat that would shuttle the dredge crews to shore and<br />
back. A tug would also be used for initial placement and removal of the dredge at each source site. The<br />
support vessels would be powered by diesel or gasoline engines, and would have associated combustion<br />
emissions. Estimated emissions based on very preliminary data were calculated using boat engine size and<br />
emission factor data from a recent EIS analysis for dredging in San Diego Harbor (DON 1999).<br />
Preliminary estimated emissions are shown in Table 4.12-1. These emissions will be finalized through the<br />
permit process.<br />
Page 4.12-2<br />
<strong>Regional</strong> <strong>Beach</strong> <strong>Sand</strong> <strong>Project</strong> <strong>EIR</strong>/<strong>EA</strong><br />
99-69\sect-04.12.wpd 7/19/00
4.12 Air Quality<br />
Table 4.12-1<br />
Alternative 1a – Estimated Emissions<br />
Emission Source<br />
Total Emissions - tons<br />
CO ROC NO x SOx PM 10<br />
Support Boats 2.08 0.44 4.07 0.50 0.17<br />
Mobilization and Demobilization 0.15 0.05 0.51 0.05 0.04<br />
<strong>Sand</strong> Placement 0.43 0.14 2.13 0.54 0.27<br />
Total Emissions 2.7 0.6 6.7 1.1 0.5<br />
General Conformity de minimis Thresholds (1) 100 50 50 100 100<br />
Exceed threshold? No No No NA NA<br />
SDAB forecast emissions for 2010 (2) 317,550 65,700 54,750 4,380 54,750<br />
Exceed ten percent of SDAB emissions? No No No NA NA<br />
Permitted Emissions Sources<br />
Dredge 3.06 43.97 223.48 13.47 14.41<br />
Slurry Booster Pump Engine 0.95 0.13 4.32 0.07 – (3)<br />
Total Emissions, including permitted sources 7 45 235 15 12<br />
(1)<br />
De minimis thresholds for SDAB nonattainment pollutants VOC and NO x , and maintenance pollutant CO.<br />
The basin is in federal attainment for PM 10 ; de minimis thresholds for SO x and PM 10 nonattainment are used<br />
for NEPA and CEQA significance determinations.<br />
(2)<br />
Forecast emissions from California ARB 2000. Forecast emissions for 2000-2001 would differ from those for<br />
(3)<br />
2010, but the differences would be small compared with the totals. The order of magnitude is satisfactory for<br />
comparison with project emissions.<br />
Emission factor not provided in source document.<br />
Pump Operation Emissions<br />
As described in Section 2.4, booster pumps would be necessary where pipelines would convey sand, as<br />
a slurry, to the receivers sites, and the conveyance distance would be approximately 10,000 feet or greater.<br />
Booster pumps would be necessary along the length from the Oceanside to North Carlsbad receiver sites,<br />
and to convey material to South Carlsbad North, Moonlight <strong>Beach</strong>, and Torrey Pines. The exact locations<br />
of pumps is not known at this time. At some onshore locations, electric power may be available to drive<br />
the pumps, and pollutant emissions would not be of concern. At other locations, including off shore, a<br />
diesel engine would be required to drive the pump, and NO x emissions would an issue. If the pump engine<br />
is over 50 brake horsepower (bhp), an Authority to Construct and Permit to Operate would be required,<br />
as described above for the dredge engines. Dredge pumps may also be Registered with the California<br />
ARB as described for dredge vessels.<br />
R<br />
R<br />
R<br />
R<br />
<strong>Regional</strong> <strong>Beach</strong> <strong>Sand</strong> <strong>Project</strong> <strong>EIR</strong>/<strong>EA</strong> Page 4.12-3<br />
99-69\sect-04.12.wpd 7/19/00
4.12 Air Quality<br />
Construction Equipment Emissions<br />
Construction equipment would be used at each receiver site to install equipment, distribute the sand<br />
received from the dredge, and remove the equipment. It was assumed that a large forklift (or small crane)<br />
and a wheeled bulldozer or loader would be used for equipment installation and removal. For sand<br />
placement, two wheeled loaders would be used, with occasional support from the forklift. There might also<br />
be a small engine-generator to provide light for night operations. For the duration of operations, the data<br />
from Table 2-2 was used, with the assumption that mobilization and demobilization would each take three<br />
days at each receiver site. The results of the calculations based on preliminary data are shown in Table<br />
4.12-1. Emission factors are taken from EPA document AP-42 and the South Coast Air Quality<br />
Management District CEQA Air Quality Handbook (1993). Spreadsheets showing the data and emission<br />
factors used in the calculations are included in Appendix F.<br />
Table 4.12-1 also contains an entry for estimated pump operations emissions. The data on this line shows<br />
estimated emissions for a diesel engine operating at 500 horsepower for 20 hours per day for 78 days.<br />
These quantities were used to analyze a case where a slurry pump engine would have emissions less than<br />
the APCD permit thresholds.<br />
Dust Emissions<br />
<strong>Project</strong>s that include major earthmoving activities usually are analyzed for the impact of dust emissions. The<br />
proposed action includes many sand conveyance and distribution activities. However, for these operations,<br />
the sand would be quite moist, and the potential for dust generation would be very low. Activities on dry<br />
sand would be limited to mobilization at each site (one to two days) and crew access, both would be of<br />
relatively short duration. Therefore, impacts from dust generation resulting from earthmoving, and from the<br />
movement of vehicles on the beaches, would be less than significant.<br />
Applicability Analysis for General Conformity<br />
In order to assess whether the proposed action is exempt from a General Conformity analysis, the total<br />
construction equipment emissions are compared with the General Conformity de minimis thresholds in<br />
Table 4.12-1. The emissions from dredging and pumping operations that would be allowed by a Permit<br />
to Operate (or ARB Registration) are not included in the comparison. The determination is in accordance<br />
with 40 C.F.R. §51.853(d)(1) and §93.153(d)(1) which states that a conformity determination is not<br />
R<br />
R<br />
Page 4.12-4<br />
<strong>Regional</strong> <strong>Beach</strong> <strong>Sand</strong> <strong>Project</strong> <strong>EIR</strong>/<strong>EA</strong><br />
99-69\sect-04.12.wpd 7/19/00
4.12 Air Quality<br />
required for the portions of the action that would be permitted by the San Diego APCD under the New<br />
Source Review program. As seen in the table, the estimated emissions of CO, ROC and NOx would be<br />
less than the threshold values. The emissions are also compared to the area’s annual emissions forecast,<br />
and it is seen that the project-related emissions of these three pollutants would be much less than ten<br />
percent of the area emissions. Therefore, the proposed action is presumed to conform to the SIP, and a<br />
formal conformity determination is not required.<br />
A Record of Non-Applicability (RONA) is a memorandum required by Department of Navy policy that<br />
reflects the determination of an authorized official that a formal conformity analysis is not required. A draft<br />
RONA is included in Appendix F.<br />
NEPA and CEQA Significance<br />
The NEPA and CEQA impact analysis differ from the General Conformity analysis in that emissions of SO 2<br />
and PM 10, attainment pollutants, are considered, as well as the nonattainment pollutant emissions 5 .<br />
Therefore, SO and PM 10 are included in estimated emissions calculations of Table 4.12-1, as well as<br />
threshold values.<br />
As stated in Section 4.12-1, the emissions of the project would not be significant if they would conform to<br />
the SIP, and they would not expose sensitive receptors to pollutant concentrations. The issuance of permits<br />
for major emissions sources, and the comparison of estimated project emissions with threshold values for<br />
other sources, as shown in Table 4.12-1, demonstrate conformance with the SIP. The project would not<br />
cause a violation of the 1-hour or 8-hour CO standard, because the project would not produce severe<br />
traffic congestion, toxic pollutants or extraordinary quantities of fugitive dust. Thus, no sensitive receptors<br />
would be exposed to pollutant concentrations. The California Air Resources Board (ARB) has identified<br />
particulate emissions from diesel engine exhaust as toxic air contaminants. The ARB is now conducting<br />
studies to determine if further controls will be required. At this time, no methods have been promulgated<br />
for evaluating the impact of diesel engine exhaust. The intensity of operations, one or two pieces of<br />
equipment moving back and forth on the beach, would be small compared with uses such as heavy traffic<br />
or industrial warehouse operations, and it may be assumed that the impact of diesel emissions on local<br />
residents would be less than significant. As noted above, there would be no extraordinary quantities of<br />
5 This evaluation does not address lead, hydrogen sulfide or vinyl chloride. Although these pollutants are<br />
regulated by the state or federal government, through ambient air quality standards, little to no emission of these<br />
substances would result from implementation of the proposed action.<br />
<strong>Regional</strong> <strong>Beach</strong> <strong>Sand</strong> <strong>Project</strong> <strong>EIR</strong>/<strong>EA</strong> Page 4.12-5<br />
99-69\sect-04.12.wpd 7/19/00
4.12 Air Quality<br />
fugitive dust. Thus, no sensitive receptors would be exposed to pollutant concentrations. It is concluded<br />
that the air quality impacts of Alternative 1a would be less than significant.<br />
For purposes of full disclosure, the estimated emissions from the dredge and slurry booster pump engine<br />
are provided in Table 4.12-1. These emissions are not compared to the General Conformity de minimis<br />
thresholds for determining significance because they are permitted.<br />
R<br />
R<br />
R<br />
Mitigation Measures for Alternative 1a<br />
No significant impacts have been identified; accordingly, no mitigation measures are necessary.<br />
Impacts/Mitigation Measures for Alternative 1b<br />
Under this alternative, the same receiver sites would receive sand and the same borrow sites would be<br />
dredged for material, but operations would occur over a different schedule. It would be necessary to<br />
obtain an Authority to Construct and a Permit to Operate from APCD for the dredge operation.<br />
Dredge(s), support boats, booster pumps and construction equipment would generate emissions. While<br />
the duration of construction would be longer overall, the total emissions would not increase because there<br />
would be no emissions during the period when construction was not occurring. The estimated emissions<br />
values in Table 4.12-1 would not be exceeded by this variation. The draft RONA in Appendix F would<br />
apply to this alternative as well. The minimal amount of traffic and lack of fugitive dust, plus conformity with<br />
the SIP would support the conclusion of no significant impact.<br />
4.12.3 Alternative 2<br />
Impacts of Alternative 2a<br />
The dredge operations would be similar in nature to Alternative 1, although the amount of material from<br />
each borrow site would vary. APCD would require an Authority to Construct and Permit to Operate<br />
which would specify operational conditions for fuel type and amounts, specific vessels, etc. Estimated<br />
construction emissions for equipment used to place sand at each receiver site and locate the pipelines are<br />
provided in Table 4.12-2 and the supporting calculations are provided in Appendix F. These estimated<br />
emissions are less than the threshold values and the proposed action is presumed to conform with the SIP.<br />
There is a very low potential for dust generation because the material being moved is extremely wet.<br />
Page 4.12-6<br />
<strong>Regional</strong> <strong>Beach</strong> <strong>Sand</strong> <strong>Project</strong> <strong>EIR</strong>/<strong>EA</strong><br />
99-69\sect-04.12.wpd 7/19/00
4.12 Air Quality<br />
Therefore there would be no air quality impacts. Finally, the RONA for Alternative 1 would also apply<br />
to this alternative.<br />
Table 4.12-2<br />
Alternative 2a – Estimated Emissions<br />
Emission Source<br />
Total Emissions - tons<br />
CO ROC NO x SOx PM 10<br />
Support Boats 1.96 0.42 3.94 0.49 0.16<br />
Mobilization and Demobilization 0.11 0.04 0.39 0.04 0.03<br />
<strong>Sand</strong> Placement 0.44 0.15 2.19 0.56 0.27<br />
Total Construction Equipment Emissions 2.5 0.6 6.5 1.1 0.5<br />
General Conformity de minimis Thresholds (1) 100 50 50 100 100<br />
Exceed threshold? No No No NA NA<br />
SDAB forecast emissions for 2010 (2) 317,550 65,700 54,750 4,380 54,750<br />
Exceed ten percent of SDAB emissions? No No No NA NA<br />
Permitted Emissions Sources<br />
Dredge 2.86 41.14 209.10 12.60 13.48<br />
Slurry Booster Pump Engine 0.95 0.13 4.32 0.07 – (3)<br />
Total Emissions, including permitted sources 6 42 220 14 11<br />
(1)<br />
De minimis thresholds for SDAB nonattainment pollutants VOC and NO x , and maintenance pollutant CO. The<br />
basin is in federal attainment for PM 10 ; de minimis thresholds for SO x and PM 10 nonattainment are used for<br />
NEPA and CEQA significance determinations.<br />
(2)<br />
Forecast emissions from California ARB 2000. Forecast emissions for 2000-2001 would differ from those for<br />
2010, but the differences would be small compared with the totals. The order of magnitude is satisfactory for<br />
comparison with project emissions.<br />
(3)<br />
Emission factor not provided in source document.<br />
Mitigation Measures for Alternative 2a<br />
Because there would be no significant impacts, no mitigation is required.<br />
Impacts/Mitigation Measures for Alternative 2b<br />
Under this alternative, construction would occur over a start-stop schedule instead of continuous. It would<br />
be necessary to obtain an Authority to Construct and Permit to Operate from APCD for the dredge<br />
operation. Dredge(s), support boats, booster pumps and construction equipment would generate<br />
emissions. While the duration of construction would be longer overall, the total estimated emissions would<br />
<strong>Regional</strong> <strong>Beach</strong> <strong>Sand</strong> <strong>Project</strong> <strong>EIR</strong>/<strong>EA</strong> Page 4.12-7<br />
99-69\sect-04.12.wpd 7/19/00
4.12 Air Quality<br />
not increase because there would be no emissions during the period when construction was not occurring.<br />
The estimated emissions values in Table 4.12-2 would not be exceeded by this variation. The draft RONA<br />
in Appendix F would apply to this alternative as well. The minimal amount of traffic and lack of fugitive<br />
dust, plus conformity with the SIP would support the conclusion of no significant impact. No mitigation<br />
would be necessary.<br />
4.12.4 No Action Alternative<br />
No air quality impacts would result since no construction would occur. No mitigation measures would be<br />
necessary.<br />
Page 4.12-8<br />
<strong>Regional</strong> <strong>Beach</strong> <strong>Sand</strong> <strong>Project</strong> <strong>EIR</strong>/<strong>EA</strong><br />
99-69\sect-04.12.wpd 7/19/00
4.13 Noise<br />
4.13 NOISE<br />
The principal noise sources attributable to the proposed action would be diesel engines on the dredge, on<br />
construction equipment at the receiver sites, and at the booster pump sites. The noise sources would not<br />
vary from site to site. Noise impacts are evaluated at sensitive receptors at, and near the receiver sites.<br />
Some of the receiver sites are similar to each other in the relationships of the sensitive receptors to the<br />
beach areas. For brevity, similar sites are grouped together. This analysis is also not dependent upon the<br />
season of project construction because it focuses on permanent receptors (residents) which would be<br />
present regardless.<br />
R<br />
R<br />
R<br />
4.13.1 Significance Criteria<br />
Noise impacts would be considered significant if the action would<br />
C<br />
C<br />
C<br />
C<br />
C<br />
result in daytime noise levels at any sensitive receptor in excess of the applicable construction noise<br />
limits, as listed in Table 3.13-2;<br />
carry out noise-generating activities during the hours prohibited by the applicable construction noise<br />
ordinance, as specified in Table 3.13-2;<br />
result in average hourly nighttime noise levels greater than 45 dBA L eq , or 5 dBA above the ambient<br />
noise level, whichever is greater, at any residence for more than three consecutive nights;<br />
result in average hourly nighttime noise levels greater than 45 dBA L eq , or 5 dBA above the ambient<br />
noise level, whichever is greater, at any residence if there has been no notification to the resident; or<br />
result in noise levels to sensitive threatened or endangered species in excess of standards set by the<br />
resource agency with jurisdiction over the species.<br />
4.13.2 Alternative 1<br />
Noise Sources<br />
The dominant noise generated during dredging and placement of sand will be the noise from diesel engines<br />
used to drive various pieces of equipment. On the dredge, the engines would be used for propulsion, to<br />
power the dredge equipment, and to provide electric power. At the receiver sites, diesel engines would<br />
<strong>Regional</strong> <strong>Beach</strong> <strong>Sand</strong> <strong>Project</strong> <strong>EIR</strong>/<strong>EA</strong> Page 4.13-1<br />
99-69\sect-04.13.wpd 7/19/00
4.13 Noise<br />
be used in bulldozers, loaders, forklifts, and cranes, as this equipment may be required. Diesel engines may<br />
also be used to drive booster pumps when needed to convey the sand slurry over distances greater than<br />
10,000 feet.<br />
Diesel engine noise levels for construction equipment are quoted in the literature as 85-90 dBA at 50 feet<br />
from the engine. These are noise levels that may occur when the engine is under a heavy load; that is the<br />
equipment is pushing, lifting, etc. Noise levels from the engine are less than 85-90 dBA when the<br />
equipment is moving from one location to another without working, or when the equipment is idling. A<br />
typical duty cycle for a piece of construction equipment includes all three phases: working, moving and<br />
idling. Therefore, the average noise levels over a period of time would be less than 85-90 dBA.<br />
<strong>Beach</strong> maintenance was in progress when site visits were made to the Mission <strong>Beach</strong> and Imperial <strong>Beach</strong><br />
receiver sites in July 1999. In both cases, the equipment in use were Case 621B wheeled loaders. Two<br />
of the machines were equipped with buckets, one with a rake. Working noise levels for this machine were<br />
measured, and then ambient background noise was mathematically removed, to generate an estimated noise<br />
level of 74-77 dBA at a distance of 50 feet. Idling noise levels are estimated at 65-68 dBA at 50 feet.<br />
These may be considered typical noise levels for all beach equipment that may be used for the project.<br />
It is also noted that construction equipment are equipped with mandatory backup alarms, and sand<br />
distribution requires construction equipment to change direction frequently. Therefore, the diesel engine<br />
noise would be accompanied at some times by the backup alarms.<br />
The diesel engines used on the dredge would be much larger than those used in construction equipment,<br />
and the noise generated would be greater. However, the engines would be housed in structures which<br />
would reduce the noise, and noise levels exceeding 90 dBA at a distance of 50 feet would not be<br />
anticipated.<br />
The diesel engine used to drive a slurry pump would also be larger than one used in construction equipment.<br />
These engines normally are provided in an enclosure that will provide noise reduction. A noise level of 70<br />
dBA at 50 feet is assumed for purposes of noise analysis (Department of the Navy 1997b).<br />
Page 4.13-2<br />
<strong>Regional</strong> <strong>Beach</strong> <strong>Sand</strong> <strong>Project</strong> <strong>EIR</strong>/<strong>EA</strong><br />
99-69\sect-04.13.wpd 7/19/00
4.13 Noise<br />
Impacts of Alternative 1a<br />
Alternative 1a specifies work 24 hours per day, 7 days per week. However, nighttime and weekend work<br />
is prohibited by local ordinance at the South Oceanside, North Carlsbad, Solana <strong>Beach</strong>, Del Mar, Mission<br />
<strong>Beach</strong> and Imperial <strong>Beach</strong> receiver sites. Night and weekend work at the Torrey Pines site might also be<br />
limited if the Del Mar ordinance prevented the night and weekend operation of a booster pump conveying<br />
sand to Torrey Pines. Implementation of Alternative 1a would be a potential significant impact. In order<br />
to avoid a significant impact, SANDAG would obtain a variance, or equivalent, from each local authority<br />
prior to the commencement of work at each site. As part of the previous sand replenishment project<br />
initiated by the Navy, noise variances were granted, where applicable, to allow construction to proceed<br />
under the 7/24 schedule (Department of Navy 1997a, 1997b). Under this alternative, the local jurisdiction<br />
would issue a variance or construction would proceed under the schedule allowed by that locality, as<br />
applicable (Alternative 1b or 2b). Therefore, there would be no situation where construction would<br />
proceed under the 7/24 schedule but not allowed under special variance or exemption. There would be<br />
no significant noise impact.<br />
Receiver Sites<br />
South Oceanside, North Carlsbad, Moonlight <strong>Beach</strong>, Cardiff, Del Mar, Mission <strong>Beach</strong>, and Imperial<br />
<strong>Beach</strong> - <strong>Beach</strong> Front Receptors<br />
At each of these receiver sites, except Cardiff, beachfront homes are at or near the same elevation as the<br />
beach restoration area, and within 50 feet of the nearest points of planned sand distribution. At Cardiff,<br />
the sensitive receptors adjacent to the beach are restaurants. The dominant existing noise at each of these<br />
sites is the surf, and ambient surf noise levels range from 63-69 dBA L eq , as described in Section 3.13.<br />
During beach restoration, the principal project noise at the beachfront homes and restaurants would be that<br />
of the construction equipment. When working at that point of the beach closest to the homes, construction<br />
noise levels at the homes would be anticipated to occasionally exceed 75 dBA. Maximum hourly average<br />
noise levels, because of working cycles and changes of location, would be expected to be on the order of<br />
65 dBA L eq . This noise level is of similar magnitude as the ambient surf noise. The peak construction noise<br />
event would be a diesel engine under load, sounding the backup alarm close by a residence. This would<br />
easily be heard by residents. The average noise change would be noticed because of a difference in<br />
<strong>Regional</strong> <strong>Beach</strong> <strong>Sand</strong> <strong>Project</strong> <strong>EIR</strong>/<strong>EA</strong> Page 4.13-3<br />
99-69\sect-04.13.wpd 7/19/00
4.13 Noise<br />
character from the ambient surf noise, and because the overall average noise level would be anticipated to<br />
increase 3-6 dBA.<br />
As the work would move away from any individual receptor, the noise level would decrease, and at a<br />
distance of 200 feet, a decrease of 10-12 dBA would be anticipated. At that distance, maximum<br />
construction noise levels would be 65 dBA or less, and average noise levels on the order of 55 dBA L eq .<br />
At nighttime, when work would occur within 200 feet of a residence, the change in noise environment could<br />
be anticipated to disturb the sleep of some residents. While closing the windows would reduce the noise<br />
level, the change in the volume and character of the noise, if one normally sleeps with windows open, may<br />
disturb sleep as much as an increase in noise would. The nighttime construction noise would be an adverse<br />
impact. However, the impact would be less than significant because residents would be notified at least<br />
one week in advance of the work near their homes, and the work would last no longer than three<br />
consecutive days within a distance where the noise might cause a sleep disturbance.<br />
The approximate minimum distance from the dredge to beachfront receivers is 4,500 feet. This occurs at<br />
the Cardiff and Del Mar receiver sites. Noise attenuation from a point source, at that distance, due to the<br />
spreading of energy and atmospheric effects would be approximately 45 dBA. With a 90 dBA source<br />
noise at the dredge, the resulting noise level at a beach front residence would be approximately 45 dBA.<br />
With the normal prevailing onshore wind, noise levels may seem slightly greater. However, a noise level<br />
of 45 dBA would be much less than the normal ambient noise level from wave activity on the beach, and<br />
noise from the dredge would not be expected to be audible.<br />
Booster pumps are anticipated be required for replenishment at the Oceanside, North Carlsbad and Torrey<br />
Pines receiver sites. The pump for Torrey Pines would likely be located at or near the Del Mar receiver<br />
site. If pump noise is 70 dBA L eq , and the pump can be located at least 250 feet from a sensitive receptor,<br />
then the noise at the receptor would be 56 dBA L eq . This noise would be at least 5 dBA below the ambient<br />
noise levels of 61-69 dBA, and would not be a significant impact. If a suitable location cannot be found<br />
at a distance of 250 feet or greater, there is a choice of noise abatement measures to maintain less than<br />
significant noise impacts: (1) A sand berm can be constructed around the pump to reduce noise; (2) it may<br />
be possible to use an electric motor to drive the pump, rather than a diesel engine.<br />
Page 4.13-4<br />
<strong>Regional</strong> <strong>Beach</strong> <strong>Sand</strong> <strong>Project</strong> <strong>EIR</strong>/<strong>EA</strong><br />
99-69\sect-04.13.wpd 7/19/00
4.13 Noise<br />
South Carlsbad North<br />
The closest residences to this receiver site are 550 to 750 feet from the beach area. Most of the beach<br />
area where sand would be distributed is not directly visible because of the topography. Line of site<br />
construction equipment noise would be more than 20 dBA less at the residences than at the beach, and<br />
would not likely be discernable above the traffic noise from Carlsbad Boulevard. The noise impact would<br />
not be significant. There is no potential impact at this site from dredge or booster pump noise.<br />
Batiquitos, Leucadia, and Solana <strong>Beach</strong> - Bluff Receptors<br />
Sensitive noise receptors at these three sites are residences located on bluffs above the receiver sites.<br />
Ambient surf noise levels at these homes are estimated at 63-66 dBA L eq . The topography and slightly<br />
greater distance from these homes to the sand replenishment area, when compared with the beach front<br />
homes at South Oceanside, Moonlight <strong>Beach</strong>, etc., would maximum reduce noise levels to approximately<br />
70 dBA for short peak noises, and 60 dBA L eq for an hourly average.<br />
Impacts would be similar to those at the sites with beach front homes. The peak construction noise event<br />
would be a diesel engine under load, sounding a backup alarm while close to a house. This event would<br />
be heard by residents. The average noise change would be noticed because of a difference in character<br />
from the ambient surf noise, and because the overall average noise level would be anticipated to increase<br />
2 to 4 dBA. At nighttime, when work would occur within 200 feet of a residence, the change in noise<br />
environment could be anticipated to disturb the sleep of some residents. While closing the windows would<br />
reduce the noise level, the change in the volume and character of the noise may disturb sleep as much as<br />
an increase in noise would. The nighttime construction noise would be an adverse impact. However, the<br />
impact would be less than significant because residents would be notified at least one week in advance of<br />
the work near their homes, and the work would last no longer than three consecutive days within a distance<br />
where the noise might cause a sleep disturbance.<br />
The approximate minimum distance from the dredge to bluff top sensitive receivers is 4,000 feet, which<br />
would occur at the Batiquitos receiver site. At that distance, noise attenuation from a point source would<br />
be approximately 43 dBA. With a 90 dBA source noise at the dredge, the resulting noise level at bluff top<br />
residences would be approximately 47 dBA. With the normal prevailing onshore wind, noise levels may<br />
seem slightly greater. However, a noise level of 47 dBA would be much less than the normal ambient noise<br />
level from wave activity on the beach, and noise from the dredge would not be expected to be audible.<br />
<strong>Regional</strong> <strong>Beach</strong> <strong>Sand</strong> <strong>Project</strong> <strong>EIR</strong>/<strong>EA</strong> Page 4.13-5<br />
99-69\sect-04.13.wpd 7/19/00
4.13 Noise<br />
Booster pumps are anticipated be required for replenishment at the Leucadia and Moonlight <strong>Beach</strong> receiver<br />
sites. The pump would likely be located in the Batiquitos/Leucadia area. If pump noise is 70 dBA L eq , and<br />
the pump can be located at least 250 feet from a sensitive receptor, then the noise at the receptor would<br />
be 56 dBA L eq . This noise would be at least 5 dBA below the ambient noise levels, and would not be a<br />
significant impact. If a suitable location cannot be found at a distance of 250 feet or greater, there is a<br />
choice of noise abatement measures to maintain less than significant noise impacts: (1) A sand berm can<br />
be constructed around the pump to reduce noise; (2) it may be possible to use an electric motor to drive<br />
the pump, rather than a diesel engine.<br />
Torrey Pines<br />
The nearest residential receptors to this site are approximately 2,000 feet away, and are closer to major<br />
roadways than the beach area. Under favorable atmospheric conditions, project related noise may be<br />
faintly heard at these receptors. There would be no significant noise impact.<br />
Sensitive Bird Species<br />
There are no specific noise standards set by the USFWS for the California least tern or the western snowy<br />
plover (Hays 2000). The noise standard set for nesting sites of other southern California threatened or<br />
endangered species (i.e., California gnatcatcher, least Bell’s vireo) is 60 dBA (County of San Diego 1991).<br />
Noise levels at 200 feet from the receiver beaches are projected to be, at peak, approximately 65 dBA<br />
and on average approximately 55 dBA L eq . The distance from the receiver sites to the closest nesting<br />
locations are shown in Table 4.13-1. Some nesting sites are shown to be in proximity to the receiver<br />
beaches (i.e., just inland of Cardiff), they are all greater than 200 feet from the construction areas.<br />
Therefore, due to the distance between the existing colonies and the proposed project sites (greater than<br />
200 feet) and the high ambient surf noise levels (63 to 69 dBA L eq ), construction activities would not be<br />
expected to have a significant impact on the California least tern or western snowy plover colonies.<br />
Mitigation Measures for Alternative 1a<br />
No significant impacts have been identified; accordingly, no mitigation measures are necessary.<br />
Page 4.13-6<br />
<strong>Regional</strong> <strong>Beach</strong> <strong>Sand</strong> <strong>Project</strong> <strong>EIR</strong>/<strong>EA</strong><br />
99-69\sect-04.13.wpd 7/19/00
4.13 Noise<br />
Table 4.13-1<br />
Potential Noise Levels at the Closest Sensitive Bird Locations<br />
Receiver Site Bird Species Distance Closest Location (dBA Leq) (dBA)<br />
Noise Levels<br />
Construction<br />
On Site within 50 feet at 200 feet<br />
Ambient Peak Average Peak Average<br />
South Oceanside California least tern 2-5 mi. north Santa Margarita River Camp Pendleton 62-65 75 65 65 55<br />
western snowy plover 2-5 mi. north Santa Margarita River Camp Pendleton<br />
North Carlsbad California least tern 2-5 mi. north Santa Margarita River Camp Pendleton 68-69 75 65 65 55<br />
western snowy plover w/in 1 mi. south Agua Hedionda Lagoon<br />
South Carlsbad California least tern approx. 1.8 mi. south Batiquitos Lagoon 52-62 75 65 65 55<br />
western snowy plover approx. 1.8 mi. south Batiquitos Lagoon<br />
Batiquitos California least tern approx. 0.25 mi. inland Batiquitos Lagoon 63-66 75 65 65 55<br />
western snowy plover approx. 0.25 mi. inland Batiquitos Lagoon<br />
Leucadia California least tern approx. 0.25 mi. inland Batiquitos Lagoon 65-66 75 65 65 55<br />
western snowy plover approx. 0.25 mi. inland Batiquitos Lagoon<br />
Moonlight <strong>Beach</strong> California least tern approx. 2.5 mi. inland Batiquitos Lagoon 67-68 75 65 65 55<br />
western snowy plover approx. 2.5 mi. inland Batiquitos Lagoon<br />
Cardiff California least tern just inland San Elijo Lagoon 64-68 75 65 65 55<br />
western snowy plover just inland San Elijo Lagoon<br />
Solana <strong>Beach</strong> California least tern less than 1 mi. San Dieguito Lagoon 63-66 75 65 65 55<br />
western snowy plover less than 1 mi. San Dieguito Lagoon<br />
Del Mar California least tern less than 1 mi. San Dieguito Lagoon 59-61 75 65 65 55<br />
western snowy plover less than 1 mi. San Dieguito Lagoon<br />
Torrey Pines California least tern less than 1 mi. Los Peñasquitos Lagoon nd 75 65 65 55<br />
western snowy plover less than 1 mi. Los Peñasquitos Lagoon<br />
Mission <strong>Beach</strong> California least tern less than 1 mi. Mission <strong>Beach</strong> 63-65 75 65 65 55<br />
western snowy plover less than 0.5 mi. Mission <strong>Beach</strong><br />
Imperial <strong>Beach</strong> California least tern less than 1 mi. Tijuana Estuary 65-67 75 65 65 55<br />
western snowy plover less than 1 mi. Tijuana Estuary<br />
nd = no data available<br />
(dBA<br />
Leq)<br />
(dBA)<br />
(dBA<br />
Leq)<br />
<strong>Regional</strong> <strong>Beach</strong> <strong>Sand</strong> <strong>Project</strong> <strong>EIR</strong>/<strong>EA</strong> Page 4.13-7<br />
99-69\SANDAG <strong>EIR</strong><strong>EA</strong> 4.1 to 4.13.wpd 7/17/00
4.13 Noise<br />
Impacts of Alternative 1b<br />
Under this alternative, the same receiver sites would receive sand and the same borrow sites would be<br />
dredged for material, but operations would occur over a different schedule. At receiver sites where local<br />
noise ordinances prohibit night and weekend work, the work schedule would be limited to comply with the<br />
ordinances. There would be no potential significant impact related to violation of hours limitations, and no<br />
variances would be required or obtained.<br />
There would be adverse, but not significant nighttime noise impacts at the Batiquitos, Leucadia, Moonlight<br />
<strong>Beach</strong> and Cardiff receiver sites as described for Alternative 1a. Residents near these sites would be<br />
notified at least one week prior to the start of the work, and the period of nearest impact would not exceed<br />
three consecutive days. The noise from dredge and booster pump operations would be the same as for<br />
Alternative 1a.<br />
Mitigation Measures for Alternative 1b<br />
No significant impacts have been identified; accordingly, no mitigation measures are necessary.<br />
4.13.3 Alternative 2<br />
Impacts of Alternative 2a<br />
Alternative 2a, like Alternative 1a, specifies work 24 hours per day, 7 days per week. Nighttime and<br />
weekend work is prohibited by local ordinance at the South Oceanside, Solana <strong>Beach</strong>, Del Mar, Mission<br />
<strong>Beach</strong> and Imperial <strong>Beach</strong> receiver sites. Night and weekend work at the Torrey Pines site might also be<br />
limited if the Del Mar ordinance prevented the night and weekend operation of a booster pump conveying<br />
sand to Torrey Pines. Implementation of Alternative 2a would be a potential significant impact. In order<br />
to avoid a significant impact, SANDAG would obtain a variance, or equivalent, from each applicable local<br />
authority prior to the commencement of work at each site. As described under Alternative 1a, construction<br />
would only proceed under the schedule allowed by ordinance or variance; therefore, there would be no<br />
significant noise impact.<br />
Impacts at the sites with beach front or bluff top homes or businesses would be the same as those<br />
described for Alternative 1a, with likely adverse, but not significant nighttime noise impacts. Residents near<br />
Page 4.13-8<br />
<strong>Regional</strong> <strong>Beach</strong> <strong>Sand</strong> <strong>Project</strong> <strong>EIR</strong>/<strong>EA</strong><br />
99-69\sect-04.13.wpd 7/19/00
4.13 Noise<br />
these sites would be notified at least one week prior to the start of the work, and the period of impact<br />
would not exceed three consecutive days. There would be no potential impacts to residents near the North<br />
Carlsbad, Batiquitos, Leucadia or Moonlight <strong>Beach</strong> sites, as these sites would not be used with Alternative<br />
2.<br />
The South Carlsbad South receiver site, not a part of Alternative 1, would be included in Alternative 2.<br />
The sensitive receptor area at this site is the South Carlsbad State <strong>Beach</strong> Campground, located on the bluff<br />
above the beach. Construction equipment generated noise levels at this site would be similar to those<br />
described for bluff top sites in Alternative 1a, approximately 70 dBA for short peak noises, and 60 dBA<br />
L eq for an hourly average. There would likely be some adverse, short-term, but not significant noise<br />
impacts. The character of impact would be slightly different from that at the bluff top homes, as the<br />
background ambient noise at the camp sites would have more traffic noises, and the residents tents would<br />
provide less noise insulation than a normal home. Visitors to the campground would be notified at least one<br />
week prior to the start of the work, or as soon as feasible, given the transient nature of campground<br />
occupancy. The period of nearby impact would not exceed three consecutive days.<br />
Sensitive bird species (California least tern or western snowy plover) would be located far enough away<br />
that even peak noise levels would be lower than the ambient noise generated by wave action (Table 4.13-<br />
1).<br />
Mitigation Measures for Alternative 2a<br />
No significant impacts have been identified; accordingly, no mitigation measures are necessary.<br />
Impacts of Alternative 2b<br />
Under this alternative, the same receiver sites would receive sand and the same borrow sites would be<br />
dredged for material as for Alternative 2a, but operations would occur over a different schedule. At<br />
receiver sites where local noise ordinances prohibit night and weekend work, the work schedule would be<br />
limited to comply with the ordinances. There would be no potential significant impact related to violation<br />
of hours limitations, and no variances would be required or obtained.<br />
There would be adverse, but not significant nighttime noise impacts at the south Carlsbad South receiver<br />
site as described for Alternative 2a and at the Cardiff receiver site as described for Alternative 1a.<br />
<strong>Regional</strong> <strong>Beach</strong> <strong>Sand</strong> <strong>Project</strong> <strong>EIR</strong>/<strong>EA</strong> Page 4.13-9<br />
99-69\sect-04.13.wpd 7/19/00
4.13 Noise<br />
Residents near the Cardiff site would be notified at least one week prior to the start of the work; visitors<br />
to the campground would be notified as soon as feasible. The period of impact would not exceed three<br />
consecutive days. The noise from dredge and booster pump operations would be the same as for<br />
Alternatives 1 and 2a.<br />
Mitigation Measures for Alternative 2b<br />
No significant impacts have been identified; accordingly, no mitigation measures are necessary.<br />
4.13.4 No Action Alternative<br />
Under this alternative, there would be no dredge activity, construction at receiver sites or pipeline pumps,<br />
and there would be no noise levels above ambient conditions at any locations. There would be no noise<br />
impacts.<br />
Page 4.13-10<br />
<strong>Regional</strong> <strong>Beach</strong> <strong>Sand</strong> <strong>Project</strong> <strong>EIR</strong>/<strong>EA</strong><br />
99-69\sect-04.13.wpd 7/19/00
5.0 Cumulative <strong>Project</strong>s and Impacts<br />
CHAPTER 5.0<br />
CUMULATIVE PROJECTS AND IMPACTS<br />
CEQA Guidelines require a discussion of significant environmental impacts that would result from projectrelated<br />
actions in combination with “closely related past, present, and probable future projects” located in<br />
the immediate vicinity (CEQA Guidelines, § 15130 [b][1][A]). These cumulative impacts are defined as<br />
“two or more individual effects which, when considered together, are considerable or which compound or<br />
increase other environmental impacts” (CEQA Guidelines, § 15355).<br />
Federal regulations implementing NEPA (40 C.F.R. §§ 1500-1508) require that the cumulative impacts<br />
of a proposed action be assessed. NEPA defines a cumulative impact as an “impact on the environment<br />
which results from the incremental impact of the action when added to other past, present, and reasonably<br />
foreseeable future actions” (40 C.F.R. § 1508.7).<br />
In general, effects of a particular action or group of actions would be considered cumulative impacts under<br />
the following conditions:<br />
• effects of several actions occur in a common location;<br />
• effects are not localized (i.e., can contribute to effects of an action in a different location);<br />
• effects on a particular resource are similar in nature (i.e., affects the same specific element of a<br />
resource); and<br />
• effects are long-term (short-term impacts tend to dissipate over time and cease to contribute to<br />
cumulative impacts).<br />
5.1 DESCRIPTION OF CUMULATIVE PROJECTS<br />
Cumulative projects considered in this analysis consist of other ongoing or proposed beach nourishment<br />
projects adjacent to the receiver sites; capital improvement or development projects proposed adjacent<br />
to receiver sites; and proposed actions adjacent to the borrow sites. The time frame for considering<br />
cumulative future projects is from 2000 to 2005. This time frame is selected because the sand dispersion<br />
model estimates that most sand placed at individual receiver sites will be redistributed within the littoral<br />
system within five years (Moffatt & Nichol 2000a).<br />
R<br />
R<br />
<strong>Regional</strong> <strong>Beach</strong> <strong>Sand</strong> <strong>Project</strong> <strong>EIR</strong>/<strong>EA</strong> Page 5-1<br />
99-69\SANDAG <strong>EIR</strong><strong>EA</strong> 5 to 10.wpd 7/17/00
5.0 Cumulative <strong>Project</strong>s and Impacts<br />
Potential cumulative projects for both project receiver and borrow sites are identified in Table 5-1. The<br />
table identifies the project name, the jurisdiction within which the action will occur, a brief description and<br />
the anticipated schedule. As noted, some projects will occur annually. Other pertinent, recently completed<br />
beach nourishment projects are included as well, although this is not intended to be an exhaustive list of all<br />
historical beach nourishment projects in the San Diego region. In fact, as described in Section 4.8, there<br />
were over 35 major beach replenishment projects between Oceanside and Carlsbad between 1954 and<br />
1988. Between 1981 and 1996, 18 replenishment projects placed more than 10.5 million cy in the same<br />
area (Coastal Environments 1998).<br />
As described in Section 1.1.1, SANDAG has prepared a Shoreline Preservation Strategy to address<br />
concerns about shoreline erosion along the San Diego region coastline. That document has a menu of<br />
possible solutions including beach replenishment, construction of retention structures such as groins,<br />
construction of property protection structures such as sea walls, and policies to regulate beach and bluff<br />
development such as building set-backs and irrigation control. At present, the Shoreline Preservation<br />
Strategy is a strategic planning document with no authority for implementation, no list of specific projects,<br />
no identified locations for features such as groins, berm, sea walls, and extremely limited funding for the<br />
estimated $150 million cost (beach building component only). As also noted in Sections 1.1.1 and 2.1.4,<br />
the $14.3 million dollar budget for the RBSP project is one-time-only funding and the local assessment to<br />
fund coastal monitoring is approximately $70,000. Therefore, the Shoreline Preservation Strategy is not<br />
considered a “reasonably foreseeable project.”<br />
R<br />
R<br />
R<br />
R<br />
R<br />
R<br />
R<br />
R<br />
R<br />
R<br />
R<br />
5.2 ANALYSIS OF CUMULATIVE IMPACTS<br />
5.2.1 Geology and Soils<br />
The three littoral cells along the coast of the San Diego region have been experiencing a reduction of natural<br />
sand sources for beach replenishment and the beaches fed by this process have been eroding over time.<br />
Implementation of the proposed replenishment action would therefore be a beneficial impact and would<br />
cumulatively contribute to the reduction of erosion at the identified beach sites. Over the long term, only<br />
relatively minor increases in the thickness of sand on the beaches and offshore bars are anticipated, similar<br />
to changes in thickness that should naturally occur seasonally. Past beach replenishment projects have<br />
occurred in similar locations and have not changed the littoral processes off the coast. The projects listed<br />
in Table 5-1 would not affect the transport of sediment off the coast, although they would provide<br />
additional sand sources to sustain the littoral cells. Therefore, implementation of the proposed action would<br />
be a cumulatively beneficial impact to geology and soils.<br />
Page 5-2<br />
<strong>Regional</strong> <strong>Beach</strong> <strong>Sand</strong> <strong>Project</strong> <strong>EIR</strong>/<strong>EA</strong><br />
99-69\SANDAG <strong>EIR</strong><strong>EA</strong> 5 to 10.wpd 7/17/00
5.0 Cumulative <strong>Project</strong>s and Impacts<br />
Table 5-1<br />
List of Cumulative <strong>Project</strong>s<br />
<strong>Project</strong> Jurisdiction Description Schedule<br />
Oceanside Harbor<br />
Maintenance<br />
Dredging<br />
Oceanside Harbor<br />
Precise Plan<br />
Amendment<br />
Manchester<br />
Resort <strong>Project</strong><br />
Buena Vista Lagoon<br />
Weir Replacement<br />
<strong>Project</strong><br />
The Bandstand<br />
Sewer Lift Station<br />
Replacement<br />
La Paz County<br />
<strong>Sand</strong>-for-Trash<br />
Pilot Program<br />
Oceanside<br />
Oceanside<br />
Oceanside<br />
Oceanside<br />
Oceanside<br />
Oceanside<br />
Oceanside Harbor is dredged annually by the USACOE to maintain sufficient depth for boat traffic. Dredged Annually in<br />
material is typically disposed of by placing it on Oceanside beaches south of Tyson Street. The average the spring<br />
amount of material placed on the beach is 175,000 cy. The most recent activity (February 2000) placed<br />
272,000 cubic yards.<br />
This project includes proposals to expand the existing marina access and capacity, expand the existing Fall boat2001<br />
launch, improve area beaches, and construct a marine research and interpretive center. The research center<br />
and expanded boat launch ramp would be located in the eastern portion of the marina. The beach<br />
improvement portions of the project would include constructing a boardwalk, picnic facilities, and concession<br />
and public sanitation buildings on the Pacific Coast side of the marina. In addition, adequate additional<br />
parking would be constructed as part of the amendment.<br />
This proposed project is in the planning and engineering phase, and must complete the CEQA process. 2001 It to 2003<br />
consists of three hotel towers containing 150 time-share units on 10.3 acres. Construction is estimated at<br />
approximately 2 years. The project area extends from the eastern beach edge inland adjacent to the Oceanside<br />
Pier. During construction, it is anticipated that Pacific Street from Seagaze Drive to Civic Center Drive and<br />
Pier View Way and Mission Avenue between Pacific Street and Myers Street would be closed to through<br />
traffic.<br />
The City of Oceanside has proposed to replace the existing weir at the mouth of the Buena Vista Lagoon Sept. 2000<br />
located at the border of the cities of Oceanside and Carlsbad. The project would replace the existing 50 foot<br />
long weir with an 80- by 10-foot weir. The new weir design would decrease beach erosion downstream and<br />
increase flows through the mouth of the lagoon during storm events while maintaining the freshwater<br />
characteristic of the lagoon.<br />
The proposed project would relocate the existing sewer lift station near the Oceanside Pier south to Tyson Fall 2000<br />
Park. The project would involve lift station construction, as well as extensive construction along the Strand<br />
for pipe installation.<br />
This project involved an exchange of San Diego trash for Arizona sand. Solid waste was shipped to Arizona March 1997<br />
and the sand displaced was used to replenish San Diego regional beaches. Approximately 1,000 cy of sand<br />
were placed on the beach at the foot of Oceanside Boulevard. This project has been discontinued and no<br />
additional phases are planned.<br />
<strong>Regional</strong> <strong>Beach</strong> <strong>Sand</strong> <strong>Project</strong> <strong>EIR</strong>/<strong>EA</strong> Page 5-3<br />
99-69\SANDAG <strong>EIR</strong><strong>EA</strong> 5 to 10.wpd 7/17/00
5.0 Cumulative <strong>Project</strong>s and Impacts<br />
Table 5-1. Continued<br />
<strong>Project</strong> Jurisdiction Description Schedule<br />
Pacific Street Bridge<br />
Widening<br />
Agua Hedionda<br />
Lagoon<br />
Maintenance<br />
Dredging<br />
Bristol Cove<br />
Dredging <strong>Project</strong><br />
Oceanside<br />
Carlsbad<br />
Carlsbad<br />
The approved project involves widening the opening under the Pacific Street Bridge at Loma Alta Creek Fall to 1999 to<br />
allow improved movement of water both from the creek and tidal flushing in the lagoon and creek. Spring 2000<br />
This lagoon has undergone maintenance dredging since 1955 and in that period, over 5.9 million cy may Annual have<br />
been removed. This dredged material has been placed on adjacent beaches in Carlsbad. In 1998, over 59,000 dredging,<br />
cy were dredged from the middle basin, and over 214,000 cy were dredged from the inner basin. In 1999, permit an expires<br />
estimated 155,000 cy were dredged from the outer basin.<br />
in 2001<br />
Dredging of 20,000 cy of silt from the Bristol Cove boat channel at the intersection of Park Drive and Cover May 1998<br />
Drive to restore it to its original -9 MSL elevation. Although this dredged material was not directly placed on<br />
Carlsbad beaches, it was placed in a future borrow pit within the outer basin of the Agua Hedionda lagoon<br />
which displaced sand for placement onto nearby Carlsbad beaches.<br />
Batiquitos Lagoon<br />
Enhancement<br />
<strong>Project</strong><br />
Carlsbad A phased project to restore Batiquitos Lagoon was initiated in 1995, which has resulted in the dredging Likely of 1.8<br />
million cy of sediment from the lagoon. Dredged material was used as beach nourishment material for annually<br />
Carlsbad, both south of Agua Hedionda Lagoon and north of Batiquitos Lagoon. 1.6 million cy of sand were<br />
placed on Encinas <strong>Beach</strong> (near proposed South Carlsbad receiver sites) and 200,000 cy were placed adjacent<br />
to the lagoon inlet (proposed Batiquitos receiver site). Continued dredging and placement is planned to<br />
maintain the lagoon, and may need to be conducted annually. Dredging and placement in May 1999 yielded<br />
10,000 cy; half of which were placed on Carlsbad beaches and the other half of which were placed in least<br />
tern nesting areas in the lagoon. The most recent dredging (February 2000) anticipates placement of 50,000<br />
to 70,000 cy at Encinitas/South Ponto <strong>Beach</strong>.<br />
Carlsbad Boulevard/<br />
Descanso Lot<br />
Subdivision<br />
Carlsbad<br />
As a by-product of a condominium construction project, 20,000 cy of sand were placed at Ponto <strong>Beach</strong> July (near 1996<br />
proposed South Carlsbad receiver sites).<br />
Moonlight <strong>Beach</strong> Encinitas The city sponsors yearly beach replenishment to place approximately 1,000 cy of sediment on Moonlight Annually,<br />
<strong>Beach</strong>. The sand is purchased and trucked to the site. The most recent replenishment with imported sand prior to<br />
was placement of 1,327 cy in Spring 1999.<br />
Memorial Day<br />
San Elijo Lagoon<br />
Mouth Opening<br />
Encinitas<br />
This project dredges the mouth of the San Elijo Lagoon to maintain the opening and places the cobble and At a minimum,<br />
sand material south of the mouth on Cardiff <strong>Beach</strong>. Dredging occurs on an as-needed basis. An average annually of in the<br />
6,000 cy has been placed on the beach annually. The most recent maintenance dredging (May 1999) resulted spring<br />
in the placement of approximately 10,000-15,000 cy of sand. In 1999, the mouth was opened three times.<br />
Page 5-4<br />
<strong>Regional</strong> <strong>Beach</strong> <strong>Sand</strong> <strong>Project</strong> <strong>EIR</strong>/<strong>EA</strong><br />
99-69\SANDAG <strong>EIR</strong><strong>EA</strong> 5 to 10.wpd 7/17/00
5.0 Cumulative <strong>Project</strong>s and Impacts<br />
Table 5-1. Continued<br />
<strong>Project</strong> Jurisdiction Description Schedule<br />
Lomas Santa Fe<br />
Drive Grade<br />
Separation<br />
Presnell/Colton Sea<br />
Cave<br />
Fletcher Cove<br />
Master Plan<br />
Mission <strong>Beach</strong><br />
Boardwalk<br />
Widening<br />
Solana <strong>Beach</strong><br />
Solana <strong>Beach</strong><br />
Solana <strong>Beach</strong><br />
San Diego<br />
As a by-product of a roadway project, 51,000 cy of material were placed at Fletcher Cove and 3,000 cy was February 1999<br />
placed at Tide <strong>Beach</strong> Park.<br />
Construct one temporary geotube breakwater at the northern headland of Fletcher Cove and one 80-foot Spring groin2000<br />
at the southern headland of Fletcher Cove to allow low volume beach fill in cove thereby providing access for<br />
seawall construction<br />
Redevelopment of Fletcher Cove <strong>Beach</strong> Park and surrounding business district including construction of 2001-2002 a<br />
parking garage, new lifeguard station, additional open space, pedestrian paths, and other upgrades.<br />
This project would widen the existing Mission <strong>Beach</strong> Boardwalk by 12 feet (9 feet of concrete and 3 feet Phase of I began<br />
landscaped buffer). Construction of Phase 1 will include a 750-foot length of the boardwalk from Ventura in early to 2000<br />
Pacific <strong>Beach</strong> Drive. Funding for a portion of Phase I from Ventura Place to Santa Barbara Place is currently<br />
available. Phase II will include that portion from the South Mission <strong>Beach</strong> jetty to San Fernando Place.<br />
Phase III will include that portion from Pacific <strong>Beach</strong> Drive. to Oliver Avene and Phase IV would include<br />
expansion between Pacific <strong>Beach</strong> Drive and Thomas Avenue. All construction will be limited to the months<br />
between Labor Day and Memorial Day.<br />
SD Underwater San Diego<br />
Recreation Area and<br />
HMCS Yukon<br />
Creation of a 450-acre underwater recreation area, 1.85 miles from Mission <strong>Beach</strong> shoreline near borrow Spring site 2000<br />
MB-1. Placement of a 360-foot-long sunken Canadian vessel, HMCS Yukon, to a depth of 100 feet to serve<br />
as diving and fishing area. Recreation area will serve as designated area for at least three more similar ships at<br />
3 to 5 year intervals.<br />
Global West Fiber<br />
Optic Cable <strong>Project</strong><br />
U.S. Coast Guard’s<br />
Ballast Point<br />
Dredging<br />
San Diego<br />
Imperial <strong>Beach</strong><br />
This project involves the placement of a fiber optic cable that runs offshore and parallel to the coastline2001<br />
between San Diego and San Francisco at 3 to 12 miles offshore. One onshore connection is proposed at<br />
Mission <strong>Beach</strong>, near the terminus of Grand Avenue. The cable would lie approximately 3,000 feet north of<br />
the proposed MB-1 borrow site.<br />
Material from maintenance dredging for the Ballast Point berthing area resulted in placement of approximately February 2000<br />
51,000 cy of material in the nearshore area just south of the pier in 1995. Permits were issued in 1999 for an<br />
identical project for up to 45,000 cy of sand in the same offshore area, which was implemented in early 2000.<br />
<strong>Regional</strong> <strong>Beach</strong> <strong>Sand</strong> <strong>Project</strong> <strong>EIR</strong>/<strong>EA</strong> Page 5-5<br />
99-69\SANDAG <strong>EIR</strong><strong>EA</strong> 5 to 10.wpd 7/17/00
5.0 Cumulative <strong>Project</strong>s and Impacts<br />
Table 5-1. Continued<br />
<strong>Project</strong> Jurisdiction Description Schedule<br />
U.S. Navy<br />
Homeporting<br />
<strong>Project</strong><br />
CDFG Artificial<br />
Reef Program<br />
Oceanside, Del Mar<br />
and San Diego<br />
Various locations<br />
offshore of the San<br />
Diego Region’s<br />
Coastline<br />
As part of a project to dredge the North Island berthing area and the main navigation channel into San Diego Ended<br />
Harbor, up to 5.5 million cy were permitted for beach nourishment at 11 receiver sites in the San Diego October 1997<br />
region. The project was discontinued in 1997 when munitions were found in the dredged material. Before<br />
termination, Oceanside received 102,000 cy of sand that was placed onshore. Approximately 170,00 cy were<br />
placed in the nearshore zone off Del Mar and 12,000 cy were placed in the nearshore off Mission <strong>Beach</strong>.<br />
CDFG has been permitted by the USACOE to place up to 22,000 tons of rubble at the kelp reef site nearVarious<br />
MB-1. With an additional 22,000 tons of material, the total amount of rubble placed at the kelp reef site<br />
would be 35,000 tons. The purpose of the rubble is to create hard bottom surfaces so that kelp may attach.<br />
Page 5-6<br />
<strong>Regional</strong> <strong>Beach</strong> <strong>Sand</strong> <strong>Project</strong> <strong>EIR</strong>/<strong>EA</strong><br />
99-69\SANDAG <strong>EIR</strong><strong>EA</strong> 5 to 10.wpd 7/17/00
5.0 Cumulative <strong>Project</strong>s and Impacts<br />
5.2.2 Coastal Wetlands<br />
Dredge and discharge operations associated with the proposed action and other sand replenishment<br />
projects in the area are being implemented for the purpose of beach enhancement and replenishment. No<br />
cumulative impacts to coastal wetlands are expected beyond those discussed for the individual sites. Inlet<br />
maintenance programs currently sustain Loma Alta Creek, Buena Vista Lagoon, Agua Hedionda Lagoon,<br />
Encinas Creek, Batiquitos Lagoon, San Elijo Lagoon, San Dieguito Lagoon, and Los Peñasquitos Lagoon.<br />
Also, as described in Section 2.5 of this document, SANDAG would participate in a four-year monitoring<br />
effort to help determine potential impacts to lagoons associated with this specific project. These<br />
maintenance programs ensure the continued value and function of the wetlands. Therefore, no significant<br />
cumulative impacts to coastal wetland functioning would occur with implementation of the proposed action.<br />
5.2.3 Water Resources<br />
The proposed action would be implemented in accordance with RWQCB permit specifications and<br />
monitoring per the framework described in Section 2.5. The proposed action incorporates training dikes<br />
to reduce, as much as possible, water quality/hydrological impacts. All identified cumulative projects are<br />
required to comply with permit guidelines as well. The proposed project would not produce long-term<br />
turbidity at the borrow sites or receiver sites; as impacts would be temporary, no cumulative impacts would<br />
result when considered in conjunction with other reasonably foreseeable projects. Cumulative impacts<br />
would be less than significant.<br />
5.2.4 Biological Resources<br />
Implementation of the proposed action and other beach replenishment projects would be expected to cause<br />
short-term cumulative impacts to nonsensitive species (mobile and nonmobile invertebrates) that inhabit the<br />
intertidal and surf zone of the sandy beaches where replenishment activities would occur. However, upon<br />
completion of replenishment activities, these nonsensitive species would repopulate the affected areas.<br />
Strict engineering design of specific projects would ensure that beach replenishment is limited to areas that<br />
would not have long-term impacts to sensitive habitats or species. No impacts to grunion would be<br />
anticipated to occur, due to implementation of a monitoring programs that would halt replenishment<br />
activities if grunion were observed spawning. In fact, creation of larger sandy beaches may benefit grunion<br />
and other species such as shore birds. There is uncertainty in predicting long-term indirect impacts from<br />
adding cumulative quantities of sand to this inherently dynamic ocean system. All the sand replenishment<br />
<strong>Regional</strong> <strong>Beach</strong> <strong>Sand</strong> <strong>Project</strong> <strong>EIR</strong>/<strong>EA</strong> Page 5-7<br />
99-69\SANDAG <strong>EIR</strong><strong>EA</strong> 5 to 10.wpd 7/17/00
5.0 Cumulative <strong>Project</strong>s and Impacts<br />
projects listed in Table 5-1 represent a very small portion of the overall sand that used to enter these littoral<br />
cells and the system will continue to lose sand to underwater canyons. No cumulative impacts are<br />
predicted.<br />
No other reasonably foreseeable projects would use the borrow sites proposed under the <strong>Regional</strong> <strong>Beach</strong><br />
<strong>Sand</strong> <strong>Project</strong>. <strong>Project</strong>-level impacts, as assessed in Section 4.4 of this document, would be less than<br />
significant. Accordingly, no cumulatively significant impacts would occur at the borrow sites.<br />
5.2.5 Cultural Resources<br />
The proposed action is the only project that would have a potential effect to underwater archaeological sites<br />
as none of the other projects involved offshore dredging at this depth. The project itself would have no<br />
significant impacts, following implementation of measures to monitor for and avoid resources, and there<br />
would be no cumulative impact.<br />
5.2.6 Land and Water Use<br />
As discussed in Section 4.6, beach replenishment activities would generally be compatible with existing land<br />
and water uses. No inconsistencies with federal, state, or local land use plans have been identified and<br />
most land use plans encourage beach replenishment. The reasonably foreseeable projects would start at<br />
various times and would not create cumulatively significant impacts to land use. Given the various planned<br />
start dates for the reasonably foreseeable projects, combined with the beneficial impacts to land use that<br />
would occur with implementation of the proposed action, no significant cumulative land use impacts would<br />
occur.<br />
Recreational activities would be temporarily relocated to other local beaches and dive sites during dredging,<br />
sand placement, and construction activities. It is unlikely that other replenishment activities or other<br />
reasonably foreseeable projects in the same vicinity would occur concurrently, which would enable<br />
surrounding beaches to accommodate additional recreational users. Because beach closure would only<br />
occur on a short-term basis, and nearby recreational opportunities would be continued, no cumulative<br />
recreation impacts would occur.<br />
<strong>Beach</strong> replenishment activities are designed to increase and enhance recreational opportunities at beaches<br />
for both residents and tourists. The implementation of this action would increase the width and quality of<br />
Page 5-8<br />
<strong>Regional</strong> <strong>Beach</strong> <strong>Sand</strong> <strong>Project</strong> <strong>EIR</strong>/<strong>EA</strong><br />
99-69\SANDAG <strong>EIR</strong><strong>EA</strong> 5 to 10.wpd 7/17/00
5.0 Cumulative <strong>Project</strong>s and Impacts<br />
the proposed receiver beaches, increasing the value of beach recreational activities for both the local and<br />
regional tourist industry. Implementation of this project would therefore cumulatively benefit the<br />
recreational value of San Diego regional beaches.<br />
5.2.7 Aesthetics<br />
Cumulative visual impacts are dependent on the scenic quality of the region and the type of proposed<br />
project. The coastal region of San Diego County is considered to be highly scenic. <strong>Sand</strong> placement<br />
activities and other reasonably foreseeable projects along the proposed receiver beach sites and adjacent<br />
areas would result in short-term visual impacts that would cease at the end of construction activities. The<br />
proposed action and other replenishment projects would be considered to have long-term beneficial visual<br />
impacts, as beach replenishment would widen San Diego beaches currently affected by erosion and<br />
improve coastal views. Therefore, implementation of these actions would have cumulatively beneficial<br />
visual impacts along the coast.<br />
5.2.8 Socioeconomics<br />
<strong>Sand</strong> replenishment activities would occur in uninhabited areas reserved for recreational uses. There would<br />
be no direct cumulative impacts to population or housing from this proposed action in conjunction with<br />
other reasonably foreseeable projects. One element of the purpose and need of the project, and other<br />
similar projects, is enhancement of this valuable resource which draws tourists and strengthens the<br />
economy. Additionally, beach nourishment would protect residential structures. The proposed action and<br />
others like it would result in beneficial impacts to the local and regional population and the economy.<br />
Although temporary impacts to fishermen may occur due to restricted fishing areas during construction, no<br />
cumulative impacts are expected to occur because this impact would be short-term. No cumulative impacts<br />
are expected to occur to sensitive habitats (reefs), and therefore no cumulative impacts to the commercially<br />
important species dependent upon those habitats are anticipated. Localized impacts may displace<br />
fishermen from favored locations as the sand moves off the beaches and deposits on low relief hard<br />
substrate and scattered reefs. As these areas are few, the aggregate size is small, other fishing areas will<br />
remain available, and recent sand replenishment projects in the same area have not significantly impacted<br />
North County commercial fisheries catch over the long-term, these impacts are not considered cumulatively<br />
significant.<br />
<strong>Regional</strong> <strong>Beach</strong> <strong>Sand</strong> <strong>Project</strong> <strong>EIR</strong>/<strong>EA</strong> Page 5-9<br />
99-69\SANDAG <strong>EIR</strong><strong>EA</strong> 5 to 10.wpd 7/17/00
5.0 Cumulative <strong>Project</strong>s and Impacts<br />
5.2.9 Public Health and Safety<br />
Safety measures associated with the proposed action include onshore and offshore closure to public access,<br />
safety buffer zones, onshore barricades, and safety personnel as necessary. Other beach nourishment<br />
projects would institute the same type of buffer zones and barricades. These safety measures would only<br />
be utilized on a short-term basis for the length of individual beach replenishment activities. Although<br />
seasonal lifeguard towers may need to be temporarily relocated during replenishment activities, impacts<br />
would not be significant. No cumulative impacts are expected to occur along the length of the pipeline since<br />
the pipe would be buried or spanned by access ramps at critical public and lifeguard access points.<br />
Navigational signage would be placed around a 500-foot buffer surrounding the borrow site, as well as<br />
along floating or submerged sections of the sand transport pipe, to alert boats to remain outside of the<br />
construction activities. Other proposed projects would not utilize a similar pipeline delivery system from<br />
borrow sites. Therefore, no cumulative impacts to public health and safety are expected to occur.<br />
5.2.10 Utilities and Structures<br />
<strong>Regional</strong> demand for existing utility services such as water, sewer, gas and electric, solid waste, and<br />
wastewater would not be incrementally increased by implementation of the proposed action. Short-term<br />
cumulative interruption of services would be avoided by project-by-project monitoring efforts. It is not<br />
anticipated that any long-term disruption impacts would occur. Therefore, no cumulative impacts to utilities<br />
or structures are anticipated.<br />
5.2.11 Traffic<br />
As discussed in Section 4.11, there would not be long-term traffic impacts because only a minor increase<br />
in vehicular activity to the receiver sites is anticipated and because construction would be temporary.<br />
Cumulative impacts would not be significant when considering the other reasonably foreseeable projects,<br />
since few projects would require the use of the same routes for construction vehicles at the same time of<br />
the <strong>Regional</strong> <strong>Beach</strong> <strong>Sand</strong> <strong>Project</strong>’s construction activities.<br />
5.2.12 Air Quality<br />
The analysis of air pollutant emissions to determine conformance to ambient air quality standards is a<br />
regional analysis that, by its nature, is cumulative. The state implementation plan (SIP) and 2010 emissions<br />
Page 5-10<br />
<strong>Regional</strong> <strong>Beach</strong> <strong>Sand</strong> <strong>Project</strong> <strong>EIR</strong>/<strong>EA</strong><br />
99-69\SANDAG <strong>EIR</strong><strong>EA</strong> 5 to 10.wpd 7/17/00
5.0 Cumulative <strong>Project</strong>s and Impacts<br />
inventory consider foreseeable projects and cumulative growth. Section 4.12 demonstrates conformance<br />
with the SIP. There would be no significant cumulative air quality impacts.<br />
5.2.13 Noise<br />
Construction activities associated with the proposed action would generate changes in noise levels in the<br />
vicinity of the receiver beaches for the duration of the project. However, these noise changes would not<br />
contribute to cumulative noise impacts due to the distance between the proposed receiver beaches. In<br />
addition, beach replenishment activities would not likely occur concurrently with other projects similar in<br />
nature. Increases in noise levels would only be short-term and noise levels would return to existing values<br />
upon completion of beach replenishment activities. Therefore, no cumulative noise impacts would occur.<br />
<strong>Regional</strong> <strong>Beach</strong> <strong>Sand</strong> <strong>Project</strong> <strong>EIR</strong>/<strong>EA</strong> Page 5-11<br />
99-69\SANDAG <strong>EIR</strong><strong>EA</strong> 5 to 10.wpd 7/17/00
6.0 Other Considerations Required by CEQA/NEPA<br />
CHAPTER 6.0<br />
OTHER CONSIDERATIONS REQUIRED BY CEQA/NEPA<br />
This section addresses other topics required by CEQA and NEPA in an <strong>EIR</strong>/<strong>EA</strong>. These include: an<br />
analysis of significant unavoidable adverse impacts to the environment (NEPA, 42 U.S.C. § 4321 et seq.;<br />
and CEQA, Cal. Pub. Res. Code, § 21000 et seq., as amended); the relationship between local short-term<br />
uses of the environment and long-term productivity (NEPA); the identification of any irreversible and<br />
irretrievable commitments of resources (NEPA and CEQA); an analysis of growth-inducing impacts<br />
(CEQA); a discussion of effects found not to be significant (CEQA); a discussion of Executive order 13045<br />
(Environmental Health and Safety Risk to children, 62 Fed. Reg. 19885 (1997)); and a discussion of issues<br />
related to Executive Order 12898 (Environmental Justice, 59 Fed. Reg. 7629 (1994)).<br />
6.1 SIGNIFICANT UNAVOIDABLE ADVERSE EFFECTS<br />
The <strong>EIR</strong>/<strong>EA</strong> evaluated the proposed alternatives with respect to numerous issues, including Geology and<br />
Soils, Coastal Wetlands, Water Resources, Biological Resources, Cultural Resources, Land and Water<br />
Use, Aesthetics, Socioeconomics, Public Health and Safety, Utilities, Traffic, Air Quality, and Noise and<br />
Odor. All of the potential impacts associated with the proposed project will be mitigated to below levels<br />
of significance and are not considered significant or unavoidable.<br />
6.2 SHORT-TERM USES AND LONG-TERM PRODUCTIVITY<br />
The objective of the proposed action is to replenish the San Diego region’s eroding beaches by dredging<br />
material from offshore borrow sites and placing directly onshore. This action would widen existing beaches<br />
in order to reduce erosion potential and thereby protect structures, as well as increase recreation<br />
opportunities for long-term use. Disposal of beach-compatible dredged material on the receiver sites would<br />
support SANDAG’s Shoreline Preservation Strategy; policies contained in the Oceanside, Carlsbad,<br />
Encinitas, Solana <strong>Beach</strong>, Del Mar, Imperial <strong>Beach</strong>, and San Diego Coastal State Park System General<br />
Plans; and the project objectives. Implementation of the proposed action would not result in any<br />
environmental impacts that would significantly narrow the range of beneficial uses of the environment or<br />
pose long-term risks to health, safety, or the general welfare of the public communities surrounding the<br />
receiver sites. Rather, the project would provide for future beneficial beach resources (e.g., recreational<br />
activities).<br />
<strong>Regional</strong> <strong>Beach</strong> <strong>Sand</strong> <strong>Project</strong> <strong>EIR</strong>/<strong>EA</strong> Page 6-1<br />
99-69\SANDAG <strong>EIR</strong><strong>EA</strong> 5 to 10.wpd 7/17/00
6.0 Other Considerations Required by CEQA/NEPA<br />
6.3 IRREVERSIBLE/IRRETRIEVABLE COMMITMENTS OF RESOURCES<br />
Resources which are irreversibly or irretrievably committed to a project are those that are typically used<br />
on a long-term or permanent basis; however, some are considered short-term resources that cannot be<br />
recovered and are thus considered irretrievable. These resources may include the use of non-renewable<br />
resources such as fuel, wood, or other natural or cultural resources. Human labor is also considered a nonretrievable<br />
resource because labor used for the proposed action would not be used for other purposes.<br />
The unavoidable destruction of natural resources which limit the range of potential uses of that particular<br />
environment would also be considered an irreversible or irretrievable commitment of resources.<br />
The proposed beach replenishment activities in the cities of Oceanside, Carlsbad, Encinitas, Solana <strong>Beach</strong>,<br />
Del Mar, San Diego, and Imperial <strong>Beach</strong> would result in the placement of approximately 2 million cubic<br />
yards of dredged beach-compatible fill material. The project is necessary to protect the existing beaches,<br />
which provide recreational opportunities not only for residents, but also contribute to the regional tourist<br />
industry. The proposed action would result in the consumptive use of nonrenewable energy sources and<br />
labor required to operate dredges, trucks, pumping equipment, and grading equipment. These<br />
commitments of resources could have otherwise been applied to projects other than the proposed action.<br />
However, the proposed action would not result in the use of a substantial amount of resources and would<br />
be short-term in nature. Additionally, no natural resources would be permanently destroyed and beach<br />
replenishment would be considered beneficial to the region.<br />
6.4 GROWTH INDUCEMENT<br />
Under CEQA, an <strong>EIR</strong> must discuss the ways in which the proposed action and alternatives could foster<br />
economic or population growth or the construction of additional housing, either directly or indirectly, in the<br />
area of population growth or the construction of additional housing, either directly or indirectly, in the area<br />
surrounding the proposed action. Analysis of growth-inducing effects includes those characteristics of the<br />
action that may encourage and facilitate activities that, either individually or cumulatively, would affect the<br />
environment. Population increases, for example, may impose new burdens on existing community service<br />
facilities. Similarly, improvement of access routes may encourage growth in previously undeveloped areas.<br />
Growth may be considered beneficial, adverse, or of no significance environmentally, depending on its<br />
actual impacts to the environmental resources present.<br />
Page 6-2<br />
<strong>Regional</strong> <strong>Beach</strong> <strong>Sand</strong> <strong>Project</strong> <strong>EIR</strong>/<strong>EA</strong><br />
99-69\SANDAG <strong>EIR</strong><strong>EA</strong> 5 to 10.wpd 7/17/00
6.0 Other Considerations Required by CEQA/NEPA<br />
The proposed action would result in temporary increase in a beach area and sand cover at each of the<br />
receiver sites. A benefit of the project would be enhancement or continuation of the recreational usage of<br />
each of the receiver sites. It must be emphasized, however, that such recreational benefits would be<br />
temporary (a maximum lifespan of the project is approximately 5 years). For use in evaluating the growth<br />
inducing impact of the proposed action, it is assumed that the level of beach use at each site would remain<br />
near current levels or increase slightly. The resulting temporary recreational benefits derived from the<br />
additional beach area would not be expected to increase the demand for public services and utilities, nor<br />
create a need for additional recreational facilities above current projections.<br />
6.5 EFFECTS FOUND NOT TO BE SIGNIFICANT<br />
CEQA Guidelines Section 15128 requires that the environmental document include a brief discussion of<br />
various environmental issues that were determined not to be significant. The Initial Study prepared for<br />
project (contained in Appendix B) evaluated several issues found not to be significant, and were therefore<br />
not analyzed in this <strong>EIR</strong>/<strong>EA</strong>. These issues were hazards and hazardous materials, mineral resources, public<br />
services, agricultural resources, and population and housing.<br />
The remainder of the issue areas found in the Initial Study was evaluated in detail in this document in<br />
Chapter 4.0. Environmental effects have been identified as either significant or not significant. Impacts<br />
identified as significant were determined to exceed some or all threshold values expressed in this document<br />
as “Significance Criteria.” Effects found not to be significant did not exceed thresholds stated as<br />
“Significance Criteria.”<br />
This analysis determined that the proposed San Diego <strong>Regional</strong> <strong>Beach</strong> <strong>Sand</strong> <strong>Project</strong> would not have a<br />
significant effect on any of the evaluated issue areas. Although no long-term significant impacts are<br />
expected, a monitoring plan would be implemented during construction and for five years following<br />
completion, to verify no significant impacts. If monitoring identifies significant impacts, mitigation would be<br />
provided with the commitments in Section 2.5.<br />
In other instances, consequences of the replenishment were found to be beneficial, such as the positive<br />
effect of enhanced local recreational opportunities for both residents and tourists.<br />
<strong>Regional</strong> <strong>Beach</strong> <strong>Sand</strong> <strong>Project</strong> <strong>EIR</strong>/<strong>EA</strong> Page 6-3<br />
99-69\SANDAG <strong>EIR</strong><strong>EA</strong> 5 to 10.wpd 7/17/00
6.0 Other Considerations Required by CEQA/NEPA<br />
6.6 PROTECTION OF CHILDREN FROM ENVIRONMENTAL H<strong>EA</strong>LTH RISKS AND<br />
SAFETY RISKS<br />
On April 21, 1997 President Clinton signed Executive Order 13045, Protection of Children From<br />
Environmental Health Risks and Safety Risks (62 Fed. Reg. 19885 (1997)). The policy of the Executive<br />
Order states that:<br />
A growing body of scientific knowledge demonstrates that children may suffer<br />
disproportionately from environmental health risks and safety risks. These risks arise<br />
because: children’s neurological, immunological, digestive, and other bodily systems are<br />
still developing; children eat more food, drink more fluids, and breathe more air in<br />
proportion to their body weights than adults; children’s size and weight may diminish their<br />
protection from standard safety features; and children’s behavior patterns may make them<br />
more susceptible to accidents because they are less able to protect themselves. Therefore,<br />
to the extent permitted by law and appropriate, and consistent with the agency’s mission,<br />
each Federal agency:<br />
(a)<br />
(b)<br />
shall make it a high priority to identify and assess environmental health risks and<br />
safety risks that may disproportionately affect children; and<br />
ensure that its policies, programs, activities, and standards address disproportionate<br />
risks to children that result from environmental health risks or safety risks.<br />
There would be no disproportionate impacts to children during implementation of the proposed sand<br />
replenishment project. No significant impacts would occur and there is no indication that any impacts<br />
would disproportionately accrue to children. Areas of replenishment would be restricted during project<br />
implementation for safety reasons and no long-term effects would occur after the beach areas were<br />
reopened for public use. Air quality impacts would be experienced on a regional basis rather than a<br />
localized basis and no disproportionate impacts to children are anticipated. Short-term noise impacts<br />
during construction are likely to extend into neighborhoods off-site (as discussed in Section 4.14), but there<br />
is no evidence that children are likely to be subject to disproportionate impacts through learning disruption.<br />
In summary, no disproportionate impacts to environmental health risks and/or safety risks to children are<br />
likely to occur with project implementation.<br />
Page 6-4<br />
<strong>Regional</strong> <strong>Beach</strong> <strong>Sand</strong> <strong>Project</strong> <strong>EIR</strong>/<strong>EA</strong><br />
99-69\SANDAG <strong>EIR</strong><strong>EA</strong> 5 to 10.wpd 7/17/00
6.0 Other Considerations Required by CEQA/NEPA<br />
6.7 ENVIRONMENTAL JUSTICE<br />
This section summarizes potential impacts from sand replenishment with respect to issues of environmental<br />
justice, as mandated by Executive Order 12898. The “Executive Order on Federal Actions to Address<br />
Environmental Justice in Minority Populations and Low-Income Populations,” issued on February 11,<br />
1994, requires that the relative impacts of federal actions on minority populations and low-income<br />
populations be addressed to avoid the placement of a disproportionate share of adverse impacts of these<br />
actions on these groups. On April 21, 1995, the Secretary of Defense submitted a formal environmental<br />
justice strategy and implementation plan to the USEPA.<br />
In order to comply with the executive order, this <strong>EIR</strong>/<strong>EA</strong> process included gathering demographic and<br />
income information from SANDAG and the 1990 census to identify areas of low-income and/or high<br />
minority populations in the areas contiguous with the receiver sites that would potentially be exposed to<br />
impacts. These receiver sites were then assessed for disproportionate impacts to low-income and minority<br />
populations.<br />
As discussed in Section 3.8, none of the areas adjacent to the project site(s) have minority populations<br />
greater proportion than the San Diego Region as a whole. There are a few project census tracts which<br />
have percent of minority populations higher than their jurisdictional city average, but the difference is not<br />
substantial and the overall minority percentage remains lower than the County as a whole. Thus, in<br />
comparison to the adjacent cities and the county, the census tracts contiguous with the sand replenishment<br />
project area cannot be considered a high minority population area.<br />
All but one project specific census tract (CT 102 in Imperial <strong>Beach</strong>) has a median income greater than the<br />
County median ($35,028). However, even within the Imperial <strong>Beach</strong> tract, the median income is<br />
substantially higher than that of the city ($30,029), indicating that this tract does not contain a<br />
disproportionate number of low-income individuals.<br />
The proposed sand replenishment project would not have a disproportionate impact on minority<br />
populations or low-income populations because the areas encompassed by the replenishment sites do not<br />
include disproportionately high minority populations or low-income populations compared to the contiguous<br />
cities or the county.<br />
<strong>Regional</strong> <strong>Beach</strong> <strong>Sand</strong> <strong>Project</strong> <strong>EIR</strong>/<strong>EA</strong> Page 6-5<br />
99-69\SANDAG <strong>EIR</strong><strong>EA</strong> 5 to 10.wpd 7/17/00
6.0 Other Considerations Required by CEQA/NEPA<br />
6.8 ESSENTIAL FISH HABITAT ASSESSMENT<br />
This section provides an assessment of potential impacts to Essential Fish Habitat (EFH). The Magnuson-<br />
Stevens Fishery Conservation and Management Act, as amended by the Sustainable Fisheries Act of 1996<br />
(Public Law 104-267), sets forth a number of new mandates for the National Marine Fisheries Service<br />
(NMFS), eight regional fishery management councils (Councils), and other federal agencies to identify and<br />
protect important marine fish habitat. The Councils, with assistance from NMFS, are required to delineate<br />
EFH for all managed species. Federal agencies which fund, permit or carry out activities that may<br />
adversely impact EFH are required to consult with the NMFS and respond in writing to the Fisheries’<br />
Services recommendations.<br />
The Navy performed an EFH assessment of the <strong>Regional</strong> <strong>Beach</strong> <strong>Sand</strong> Replenishment <strong>Project</strong>. The<br />
proposed action would involve dredging at six potential borrow sites and use of that material to replenish<br />
beaches. The borrow sites would be located outside the littoral cells at water depths generally 40 to 80<br />
feet (Table 2-3). The borrow sites would be located in an area designated as EFH in the Coastal Pelagics<br />
Fisheries Management Plan (FMP) and the Pacific Groundfish FMP.<br />
The Coastal Pelagics FMP includes four finfish (Pacific sardine, chub mackeral, northern anchovy, and jack<br />
mackeral) as well as market squid. Coastal pelagic finfish are wide ranging species that generally inhabit<br />
the upper portion of the water column and not found near the bottom. The Pacific Groundfish FMP<br />
includes 83 species, generally having more restricted ranges with many of these species being found on or<br />
near the bottom. Many of the Pacific groundfish are rockfish (Sebastes sp) typically found in association<br />
with hard substrate habitats. Generally, the EFH for both plans is defined as the ocean area from the coastal<br />
lagoons up to 200 miles offshore (Hoffman 2000).<br />
The EFH source documents prepared by the Pacific Fishery Management Council (1998a and 1998b)<br />
identify that dredging is a direct impact to benthic habitats but also has indirect effects to adjacent habitats<br />
due to removal of prey, turbidity, etc. Conservation measures are recommended in the source documents.<br />
Pertinent measures for type of dredging proposed include provision of the latitude and longitude coordinates<br />
of the dredge site for Geographic Information System (GIS) tracking, sediment testing for contaminants,<br />
avoidance of kelp beds and subaquatic vegetation in the placement of pipelines and accessory equipment,<br />
and control measures to minimize turbidity.<br />
Page 6-6<br />
<strong>Regional</strong> <strong>Beach</strong> <strong>Sand</strong> <strong>Project</strong> <strong>EIR</strong>/<strong>EA</strong><br />
99-69\SANDAG <strong>EIR</strong><strong>EA</strong> 5 to 10.wpd 7/17/00
6.0 Other Considerations Required by CEQA/NEPA<br />
As addressed in Section 4.4, proposed dredging in the six borrow sites would result in impacts to<br />
approximately 398 acres of surface area, representing less than two percent of the available shelf habitat.<br />
All four of the Coastal Pelagic finfish species can be found in the borrow site areas as these nearshore<br />
waters are productive and these species move through these areas while foraging. In contrast, only a<br />
portion of the 83 species comprising the Pacific Groundfish FMP would be found in the borrow site habitat.<br />
The following lists provides a summary of the FMP species and where they might be expected relative to<br />
the borrow sites<br />
Species that are commonly found in habitats typified by the borrow sites:<br />
• California Skate<br />
• Jack Mackerel<br />
• California Scorpionfish<br />
• Curlfin Sole<br />
• English Sole<br />
• Pacific <strong>Sand</strong>dab<br />
• Petrale Sole<br />
Species that may occasionally occur in habitats represented by the borrow sites, but generally are more<br />
often associated with hard bottom habitats:<br />
• Lingcod<br />
• Cabezon<br />
• Kelp Greenling<br />
• Black-and-Yellow Rockfish<br />
• Blue Rockfish<br />
• Brown Rockfish<br />
• Calico Rockfish<br />
• Copper Rockfish<br />
• Gopher Rockfish<br />
• Grass Rockfish<br />
• Kelp Rockfish<br />
• Olive Rockfish<br />
• Rosy Rockfish<br />
• Squarespot Rockfish<br />
• Starry Rockfish<br />
• Treefish<br />
• Vermilion Rockfish<br />
• Window Rockfish<br />
Species that may occasionally occur in habitats represented by the borrow sites, but generally found inshore<br />
of these sites:<br />
• Leopard Shark<br />
• Spiny Dogfish<br />
<strong>Regional</strong> <strong>Beach</strong> <strong>Sand</strong> <strong>Project</strong> <strong>EIR</strong>/<strong>EA</strong> Page 6-7<br />
99-69\SANDAG <strong>EIR</strong><strong>EA</strong> 5 to 10.wpd 7/17/00
6.0 Other Considerations Required by CEQA/NEPA<br />
Species that many occasionally occur in habitats represented by the borrow sites, but generally found<br />
offshore of these sites:<br />
• Soupfin Shark<br />
• Big Skate<br />
• Longnose Skate<br />
• Ratfish<br />
• Greenspotted Rockfish<br />
Species not found in the San Diego area or deep water species include:<br />
• Finescale Codling<br />
• Pacfic Rattail<br />
• Pacific Cod<br />
• Pacific Whiting<br />
• Sablefish<br />
• Aurora Rockfish<br />
• Bank Rockfish<br />
• Black Rockfish<br />
• Blackgill Rockfish<br />
• Bocaccio<br />
• Bronzespotted Rockfish<br />
• Canary Rockfish<br />
• Chilipepper<br />
• China Rockfish<br />
• Cowcod<br />
• Darkblotched Rockfish<br />
• Dusky Rockfish<br />
• Flag Rockfish<br />
• Greenstriped Rockfish<br />
• Greenblotched Rockfish<br />
• Harlequin Rockfish<br />
• Longspine Thornyhead<br />
• Mexican Rockfish<br />
• Pacific Ocean Perch<br />
• Pink Rockfish<br />
• Quillback Rockfish<br />
• Redbanded Rockfish<br />
• Redstripe Rockfish<br />
• Rosethorn Rockfish<br />
• Rougheye Rockfish<br />
• Sharpchin Rockfish<br />
• Shortbelly Rockfish<br />
• Shortraker Rockfish<br />
• Shortspine Thornyhead<br />
• Silvergray Rockfish<br />
• Speckled Rockfish<br />
• Splitnose Rockfish<br />
• Stripetail Rockfish<br />
• Tiger Rockfish<br />
• Yelloweye Rockfish<br />
• Yellowmouth Rockfish<br />
• Yellowtail Rockfish<br />
• Arrowtooth Flounder<br />
• Butter Sole<br />
• Dover Sole<br />
• Flathead Sole<br />
• Rex Sole<br />
• Rock Sole<br />
• <strong>Sand</strong> Sole<br />
• Starry Flounder<br />
Page 6-8<br />
<strong>Regional</strong> <strong>Beach</strong> <strong>Sand</strong> <strong>Project</strong> <strong>EIR</strong>/<strong>EA</strong><br />
99-69\SANDAG <strong>EIR</strong><strong>EA</strong> 5 to 10.wpd 7/17/00
6.0 Other Considerations Required by CEQA/NEPA<br />
During dredging activities, fish would move from the area of active dredge, but these species would not be<br />
lost to the ecosystem nor would migration patterns be affected. Fish that feed on benthic biota would<br />
experience short-term loss of prey, but because the active area of dredge would be relatively small, the<br />
affect would not be significant. A minimum 500-foot buffer has been established between the dredge area<br />
and any kelp or reef (300 feet at SO-7 from the artificial reefs). Under average current conditions, turbidity<br />
plumes from hopper dredge operations are anticipated to average approximately 260 feet, but range from<br />
72 to 544 feet (Table 4.3-1). Any turbidity plumes that would extend to the reefs or kelp would be very<br />
limited and within the range that these resources naturally experience from storms, rip currents, etc. All<br />
dredging operations would be performed in conformance with the permit conditions established by the 401<br />
permit issued by the <strong>Regional</strong> Water Quality Control Board. The proposed action would not result in longterm<br />
or significant effects to sustainable fisheries present in the Coastal Pelagics or Pacific Groundfish<br />
FMPs.<br />
<strong>Regional</strong> <strong>Beach</strong> <strong>Sand</strong> <strong>Project</strong> <strong>EIR</strong>/<strong>EA</strong> Page 6-9<br />
99-69\SANDAG <strong>EIR</strong><strong>EA</strong> 5 to 10.wpd 7/17/00
7.0 Consultation and Coordination<br />
CHAPTER 7.0<br />
CONSULTATION AND COORDINATION<br />
7.1 AGENCY COORDINATION VIA SHORELINE EROSION COMMITTEE (SEC)<br />
Close coordination has occurred between SANDAG, the Navy, local jurisdictions and regulatory agencies<br />
since the inception of this project. SANDAG identified the need for beach sand replenishment in 1993 and<br />
prepared its San Diego <strong>Regional</strong> Shoreline Preservation Strategy. Since that time the SEC has worked<br />
to find sand sources and design beach nourishment projects to improve property protection, increase<br />
recreational capacity and enhance tourism potential. The SEC is comprised of representatives from the<br />
following agencies:<br />
• City of Carlsbad<br />
• City of Encinitas<br />
• City of Del Mar<br />
• City of Solana <strong>Beach</strong><br />
• City of Coronado<br />
• City of San Diego<br />
• City of Imperial <strong>Beach</strong><br />
• City of Oceanside<br />
• County of San Diego<br />
• San Diego Unified Port District<br />
• U.S. Navy<br />
Technical Advisors<br />
• State Department of Fish & Game<br />
• National Marine Fisheries Service<br />
• U.S. Environmental Protection Agency<br />
• State Department of Parks and Recreation<br />
• California Coastal Commission<br />
• State Lands Commission<br />
• State Department of Boating & Waterways<br />
<strong>Regional</strong> <strong>Beach</strong> <strong>Sand</strong> <strong>Project</strong> <strong>EIR</strong>/<strong>EA</strong> Page 7-1<br />
99-69\sect-07.wpd 7/19/00
7.0 Consultation and Coordination<br />
• U.S. <strong>Army</strong> Corps of Engineers<br />
Community Advisors<br />
• California Coastal Coalition (CalCoast)<br />
• Economic Development Corporation<br />
• Sportsfishing Association of California San Diego Chapter<br />
• Surfrider Foundation<br />
• California Lobster and Trap Fishermen’s Association<br />
• Greater San Diego Chamber of Commerce<br />
• San Diego Council of Divers, Inc.<br />
• San Diego North County Convention and Visitors Bureau<br />
• Sierra Club<br />
The alternatives analyzed in this document are the result of an iterative process to present information to<br />
the resource agencies, obtain their input, incorporate modifications into project design, and present the<br />
revised plan. Seven interactive meetings were held between March 1999 and February 2000 to facilitate<br />
this process as discussed below. The resource agencies listed below were participants in the process and<br />
are also part of the larger SEC.<br />
• U.S. <strong>Army</strong> Corps of Engineers<br />
• U.S. Fish and Wildlife Service<br />
• U.S. Department of the Navy<br />
• National Marine Fisheries Service<br />
• California Coastal Commission<br />
• California Department of Fish and Game<br />
• California Department of Parks and Recreation<br />
• California <strong>Regional</strong> Water Quality Control Board (Region 9)<br />
• California State Lands Commission<br />
The first interactive working meeting occurred on March 25, 1999. At that meeting, anticipated project<br />
schedule and project approach as well as the data sources available were presented. Resource agency<br />
staff requested additional information on the borrow sites and some receiver sites, as well as a comparison<br />
Page 7-2<br />
<strong>Regional</strong> <strong>Beach</strong> <strong>Sand</strong> <strong>Project</strong> <strong>EIR</strong>/<strong>EA</strong><br />
99-69\sect-07.wpd 7/19/00
7.0 Consultation and Coordination<br />
between the Navy’s previously permitted project and the proposed action. Field surveys of the receiver<br />
sites and bounce dives in the borrow sites were completed in May, June, and July 1999.<br />
A meeting was held on May 6, 1999 to present results of monitoring data that had been made available<br />
subsequent to the March meeting, describe in more detail the engineering modeling approach, and present<br />
the comparison table (<strong>Regional</strong> <strong>Beach</strong> <strong>Sand</strong> <strong>Project</strong> and the Homeporting <strong>Project</strong>). The resource agencies<br />
offered additional information regarding design constraints, e.g., artificial reefs.<br />
On June 28, 1999 results of modeling were presented to the agencies. Based on the known resources, the<br />
agencies directed modification of the project at the North Carlsbad, Leucadia, Solana <strong>Beach</strong>, and Torrey<br />
Pines receiver sites. Those changes were made and the model re-run.<br />
An overview of the impact methodology and preliminary impact conclusions were presented on August<br />
6, 1999. The impact conclusions were provided for the modified action incorporating design changes<br />
recommended in the June meeting. Consensus was reached on some issue areas and in some instances<br />
further clarification was required. Based on that feedback, additional engineering was performed.<br />
Discussion occurred regarding the appropriate criteria for use in determining locations of possible impacts<br />
due to sediment transport.<br />
The impact analysis continued based on modeling output. On November 29, 1999 another resource<br />
agency meeting was held to present the results of the analysis to date, based on the three alternatives which<br />
had been derived at that time. The framework for future monitoring was discussed primarily in terms of<br />
the existing permit issued to the Navy.<br />
In January 2000 the SEC authorized mapping of locations where the model predicted sand deposition, but<br />
where no data was available to determine whether or not sensitive resources may be affected. A meeting<br />
was held on January 14, 2000 to present the mapping methodology and gain consensus prior to<br />
undertaking the mapping later in January. At that time, sensitivity of various reef types was discussed.<br />
Consistent with the Navy analysis, potential areas of long-term effect would be related to sand deposition<br />
at high value habitat, e.g., high relief reefs, vegetated low relief reefs or at kelp beds. A meeting to present<br />
the preliminary results of the mapping effort was held on February 17, 2000.<br />
Subsequent to the release of the Draft <strong>EIR</strong>/<strong>EA</strong> for public review, SANDAG met with agency staff to<br />
address responses to comment letters received. On May 10, 2000, SANDAG met with staff from CDFG<br />
R<br />
R<br />
<strong>Regional</strong> <strong>Beach</strong> <strong>Sand</strong> <strong>Project</strong> <strong>EIR</strong>/<strong>EA</strong> Page 7-3<br />
99-69\sect-07.wpd 7/19/00
7.0 Consultation and Coordination<br />
to discuss borrow sites and artificial reefs. On May 15, 2000, SANDAG staff met with USACOE,<br />
USFWS, CDFG, NMFS and the Navy to address lagoon monitoring, surfgrass significance criteria,<br />
project schedule, nesting season for federally listed bird species, and the Section 7 consultation process.<br />
R<br />
R<br />
R<br />
Because of the aggressive project time line, local jurisdictions and state agencies have also been involved<br />
in coordinating the permitting effort. A meeting was held on July 8, 1999 with representatives of the<br />
California State Lands Commission, California Coastal Commission, the Port of San Diego, and all seven<br />
local jurisdictions to clarify the permit needs of each agency and coordinate the process within the structure<br />
of each entity. A subsequent meeting was held with the California Coastal Commission on December 28,<br />
1999 regarding the permitting time line. The permits required to implement this action are identified in<br />
Section 2.7.<br />
7.2 PUBLIC COORDINATION<br />
Extensive public coordination has occurred, and will continue to occur, as part of this proposed action.<br />
Public involvement opportunities to date include the ongoing SEC meetings which are open to the public,<br />
the <strong>EIR</strong> notification process via the Notice of Preparation (NOP), and other presentations to various<br />
community groups and interested parties. When the <strong>EIR</strong>/<strong>EA</strong> is considered for certification by the<br />
SANDAG Board there will be a public hearing on the document. Individual jurisdictions will likely have<br />
public meetings and utilize the certified <strong>EIR</strong>/<strong>EA</strong> for local discretionary actions such as issuing coastal<br />
permits or noise variances.<br />
7.2.1 SEC Meetings<br />
The SEC meets monthly generally on the first Thursday of every month. (The meeting is not scheduled in<br />
August.) Meetings are open to the general public. Members of the print media are typically present and<br />
subsequent to the meeting articles may appear in the Coast News, North County Times, San Diego<br />
Union-Tribune, or other community papers.<br />
7.2.2 Notice of Preparation to Prepare the Draft <strong>EIR</strong><br />
In conformance with CEQA, an NOP to prepare a Draft <strong>EIR</strong> was distributed by SANDAG to numerous<br />
federal, state and local agencies involved with funding or approving the action, and to other interested<br />
organizations and members of the public. A copy of the NOP, the NOP distribution list and copies of all<br />
Page 7-4<br />
<strong>Regional</strong> <strong>Beach</strong> <strong>Sand</strong> <strong>Project</strong> <strong>EIR</strong>/<strong>EA</strong><br />
99-69\sect-07.wpd 7/19/00
7.0 Consultation and Coordination<br />
letters received in response to the NOP are provided in Appendix B. Section 1.4 of this document<br />
provides a summary of the comments received in response to the NOP.<br />
7.2.3 Other Meetings With Interested Parties<br />
In September and October 1999, SANDAG staff made public presentations regarding the <strong>Regional</strong> <strong>Beach</strong><br />
<strong>Sand</strong> <strong>Project</strong> at the cities of Oceanside, Carlsbad, Solana <strong>Beach</strong>, Encinitas, Del Mar, San Diego,<br />
Coronado and Imperial <strong>Beach</strong>. All meetings were held at the local city hall. The City of San Diego<br />
sponsored a second meeting at the Belmont Park Community Room, near the Mission <strong>Beach</strong> receiver site.<br />
Throughout October and November 1999, SANDAG staff made presentations to staff members for<br />
various state and federally elected officials, environmental groups such as the Sierra Club, Audubon<br />
Society, Surfrider Foundation, and interested parties such as recreational divers and commercial fisherman.<br />
The commercial fisherman interest group has participated in three meetings with SANDAG staff and<br />
consultants from August to December 1999 to provide input on the biological analysis as well as the<br />
process itself. Many of these same groups attend the monthly SEC meetings and participate in that forum<br />
as well.<br />
<strong>Regional</strong> <strong>Beach</strong> <strong>Sand</strong> <strong>Project</strong> <strong>EIR</strong>/<strong>EA</strong> Page 7-5<br />
99-69\sect-07.wpd 7/19/00
8.0 List of Preparers and Contributors<br />
CHAPTER 8.0<br />
LIST OF PREPARERS AND CONTRIBUTORS<br />
Personnel responsible for preparation of this <strong>EIR</strong>/<strong>EA</strong> include the following:<br />
San Diego Association of Governments (SANDAG)<br />
401 B Street, Suite 800<br />
San Diego, CA 92101<br />
Rob Rundle, <strong>Project</strong> Manager<br />
Steve Sachs, Senior Planner<br />
Greg Smith, Intern<br />
United States Department of the Navy (DON)<br />
Southwest Division Naval Facilities Engineering Command<br />
1220 Pacific Highway<br />
San Diego, CA 92132<br />
Dan Muslin, Senior Environmental Planner<br />
Mitch Perdue, Biologist<br />
The prime contractor responsible for preparation of this <strong>EIR</strong>/<strong>EA</strong> is:<br />
K<strong>EA</strong> Environmental, Inc. (K<strong>EA</strong>)<br />
1420 Kettner Boulevard, Suite 620<br />
San Diego, California 92101<br />
The subcontractors responsible for preparation of this <strong>EIR</strong>/<strong>EA</strong> are:<br />
Moffatt & Nichol Engineers<br />
250 W. Wardlow Road<br />
P.O. Box 7707<br />
Long <strong>Beach</strong>, CA 90807<br />
<strong>Regional</strong> <strong>Beach</strong> <strong>Sand</strong> <strong>Project</strong> <strong>EIR</strong>/<strong>EA</strong> Page 8-1<br />
99-69\SANDAG <strong>EIR</strong><strong>EA</strong> 5 to 10.wpd 7/17/00
8.0 List of Preparers and Contributors<br />
MEC Analytical<br />
2433 Impala Drive<br />
Carlsbad, CA 92008<br />
GeoArch<br />
P.O. Box 86068<br />
San Diego, CA 92138<br />
The following professional staff are the principal contributors from K<strong>EA</strong> and subcontractors:<br />
Name and Expertise Applied to <strong>EIR</strong>/<strong>EA</strong><br />
Professional Discipline and Expertise<br />
Tom LarkinEnvironmental Analysis; 25 years of experience<br />
Principal-in-Charge<br />
Julie McCall (K<strong>EA</strong>)<br />
<strong>Project</strong> Manager<br />
Environmental Analysis; 14 years of experience<br />
Teri Fenner, MA (K<strong>EA</strong>)<br />
Assistant <strong>Project</strong> Manager<br />
Agency Coordination<br />
Environmental Analysis; 14 years of experience<br />
Shawn Shamlou, MA (K<strong>EA</strong>)<br />
CEQA and NEPA Analysis<br />
Environmental Analysis; 5 years of experience<br />
Chris Webb, MA (Moffatt & Nichol)<br />
Coastal Engineering and Permitting<br />
<strong>Project</strong> Engineer, 10 years of experience<br />
Alan Alcorn, PE (Moffatt & Nichol)<br />
Quality Control, Permitting<br />
Engineering, 20 years of experience<br />
Seamus Innes (Moffatt & Nichol)<br />
Coastal Modeling<br />
Coastal modeling, 4 years of experience<br />
Page 8-2<br />
<strong>Regional</strong> <strong>Beach</strong> <strong>Sand</strong> <strong>Project</strong> <strong>EIR</strong>/<strong>EA</strong><br />
99-69\SANDAG <strong>EIR</strong><strong>EA</strong> 5 to 10.wpd 7/17/00
8.0 List of Preparers and Contributors<br />
Susan Ming, PE (Moffatt & Nichol)<br />
Coastal Engineering<br />
Numerical modeling, 8 years of experience<br />
Karen Green (MEC)<br />
Marine Resources, Permitting<br />
Marine Biology, 20 years of experience<br />
Douglas Deiner, Ph.D. (MEC)<br />
Marine Resources<br />
Marine Biology, 24 years of experience<br />
Jim Kurtz (K<strong>EA</strong>)<br />
Traffic, Air Quality, Noise<br />
Environmental Engineering; 30 years of experience<br />
Mike Downs, Ph.D. (K<strong>EA</strong>)<br />
Socioeconomics<br />
Anthropology; 18 years of experience<br />
Rebecca Apple, M.A. (K<strong>EA</strong>)<br />
Cultural Resources<br />
Anthropology; 17 years of experience<br />
Roy Pettus (GeoArch)<br />
Underwater Archaeological Resources<br />
Marine Archaeology; 20 years of experience<br />
John Hildebrand, Ph.D. (GeoArch)<br />
Underwater Archaeological Resources<br />
Marine Geophysicist, 20 years of experience<br />
Angela Johnson (K<strong>EA</strong>)<br />
Graphic Design and GIS<br />
Graphics Coordinator; 7 years of experience<br />
Dan Brady (K<strong>EA</strong>)<br />
Graphics<br />
Graphic Designer; 5 years of experience<br />
Eric Coughlin (K<strong>EA</strong>)<br />
GIS<br />
GIS Specialist; 3 years of experience<br />
<strong>Regional</strong> <strong>Beach</strong> <strong>Sand</strong> <strong>Project</strong> <strong>EIR</strong>/<strong>EA</strong> Page 8-3<br />
99-69\SANDAG <strong>EIR</strong><strong>EA</strong> 5 to 10.wpd 7/17/00
8.0 List of Preparers and Contributors<br />
Debbie Surrell (K<strong>EA</strong>)<br />
Word Processing<br />
Word Processor; 10 years of experience<br />
Marisa Fabrigas (K<strong>EA</strong>)<br />
Word Processing<br />
Word Processor; 16 years of experience<br />
Page 8-4<br />
<strong>Regional</strong> <strong>Beach</strong> <strong>Sand</strong> <strong>Project</strong> <strong>EIR</strong>/<strong>EA</strong><br />
99-69\SANDAG <strong>EIR</strong><strong>EA</strong> 5 to 10.wpd 7/17/00
9.0 References and Persons Contacted<br />
CHAPTER 9.0<br />
REFERENCES AND PERSONS CONTACTED<br />
9.1 REFERENCES<br />
Allen, M.J., S.L. Moore, K.C. Schiff, S.B. Weisberg, D.R. Diener, J.K. Stull, A. Groce, J. Mubarak, C.L.<br />
Tang, and R. Gartman<br />
1998 Demersal Fishes and Megabenthic Invertebrates. SCCWRP.<br />
Bedford, Dennis<br />
1999 CDFG Marine Region, personal communication with Shawn Shamlou, K<strong>EA</strong><br />
Environmental. July 28.<br />
Bergen, M., S.B. Weisberg, D. Cadien, A. Dalkey, D. Montagne, R.W. Smith, J.K. Stull, and R.G.<br />
Velarde<br />
1998 Assessment of Benthic Infauna on the Mainland Shelf of Southern California.<br />
SCCWRP.<br />
California Air Resources Board (CARB)<br />
2000 Internet Site , provides data relative to federal and state air quality<br />
standards, monitored data, and forecast regional emissions.<br />
California Coastal Commission<br />
1995 Coastal Development Permit from SDG&E for dredging at Agua Hedionda Lagoon.<br />
August 30.<br />
California Department of Fish and Game<br />
1993 Final Supplemental Environmental Document Ocean Sport Fishing Regulations,<br />
Spiny Lobster. State of California, the Resources Agency.<br />
California Department of Parks and Recreation<br />
1984 San Diego Coastal State Park System General Plan. Volume 3: South Carlsbad State<br />
<strong>Beach</strong>. July.<br />
<strong>Regional</strong> <strong>Beach</strong> <strong>Sand</strong> <strong>Project</strong> <strong>EIR</strong>/<strong>EA</strong> Page 9-1<br />
99-69\sect-09.wpd 7/19/00
9.0 References and Persons Contacted<br />
1997 Travel Release Information<br />
1999 Home page. May 20, State <strong>Beach</strong> visitation data. <br />
California Division of Mines and Geology<br />
R<br />
n.d. Special Report 153 R<br />
City of Carlsbad<br />
1994 General Plan. Adopted September 6.<br />
1996 Local Coastal Program. Certified by the California Coastal Commission on Octobe<br />
r 9.<br />
City of Del Mar<br />
1976 Community Plan. March.<br />
1993 Local Coastal Program Land Use Plan. Certified by the California Coastal Commission<br />
March 18.<br />
n.d. Municipal Code Chapter 9.20, Noise Regulations.<br />
City of Encinitas<br />
1989 General Plan. March 29.<br />
City of Imperial <strong>Beach</strong><br />
1990 Municipal Code Section 9.32.020H, Prohibited Noises.<br />
1994 General Plan and Coastal Plan. October.<br />
City of Oceanside<br />
1989 Land Use Element. Originally adopted July 7, 1986.<br />
1992 Grading Ordinance, Section 515.<br />
Page 9-2<br />
<strong>Regional</strong> <strong>Beach</strong> <strong>Sand</strong> <strong>Project</strong> <strong>EIR</strong>/<strong>EA</strong><br />
99-69\sect-09.wpd 7/19/00
9.0 References and Persons Contacted<br />
1999a Final Environmental Impact Report for the Proposed Oceanside Harbor Precise<br />
Plan Amendment. February 5.<br />
1999b Buena Vista Lagoon Weir Replacement <strong>Project</strong> Negative Declaration. April.<br />
City of San Diego<br />
1969 The Ocean Edge of San Diego.<br />
1974 Mission <strong>Beach</strong> Precise Plan and Local Coastal Program Addendum. April.<br />
1984 Municipal Code Section 59.5.0404, Construction Noise. January 3.<br />
1998 Mission <strong>Beach</strong> Boardwalk Widening <strong>Project</strong> Final Environmental Impact Report.<br />
May.<br />
City of Solana <strong>Beach</strong><br />
1992 Municipal Code, Section 7.34, Noise Abatement and Control, Adopted as Ordinance<br />
No. 147. February 18.<br />
1988 Solana <strong>Beach</strong> General Plan Noise Element. November 14.<br />
Coastal Environments<br />
1998 Bibliography of pertinent research on existing conditions and monitoring studies in the<br />
vicinity of Aqua Hedionda Lagoon. Prepared for the California Coastal Commission,<br />
SDG&E, and the City of Carlsbad.<br />
County of San Diego<br />
1980 San Diego County General Plan Noise Element. December 17.<br />
County of San Diego, Air Pollution Control District<br />
1998 Rules and Regulations. December.<br />
1999 1994-1998 Summary of San Diego Air Basin Monitored Pollutant Data. August.<br />
<strong>Regional</strong> <strong>Beach</strong> <strong>Sand</strong> <strong>Project</strong> <strong>EIR</strong>/<strong>EA</strong> Page 9-3<br />
99-69\sect-09.wpd 7/19/00
9.0 References and Persons Contacted<br />
Department of the Navy<br />
1995 Final Environmental Impact Statement for the Development of Facilities in San<br />
Diego/Coronado to Support the Homeporting on One NIMITZ Class Aircraft<br />
Carrier. Southwest Division Naval Facilities Engineering Command. November.<br />
1997a Environmental Assessment for <strong>Beach</strong> Replenishment at South Oceanside and<br />
Cardiff/Solana <strong>Beach</strong>, California. Southwest Division Naval Facilities Engineering<br />
Command. April.<br />
1997b Environmental Assessment for <strong>Beach</strong> Replenishment at North Carlsbad, South<br />
Carlsbad, Encinitas, and Torrey Pines. Southwest Division Naval Facilities Engineering<br />
Command. May.<br />
1997c Coastal Monitoring Plan P-706 and San Diego Bay Channel Dredge <strong>Project</strong>, Naval<br />
Air Station North Island San Diego. Prepared by Southwest Division Naval Facilities<br />
Engineering Command. August.<br />
1999 Final Environmental Impact Statement for Developing Home Port Facilities for<br />
Three NIMITZ-Class Aircraft Carriers in Support of the U.S. Pacific Fleet. July.<br />
Frederic R. Harris, Inc. (FRH)<br />
1997 <strong>Beach</strong> <strong>Sand</strong> Transport and Sedimentation Report, Phase I and II. Prepared for<br />
Southwest Division Naval Facilities Engineering Command.<br />
Glantz, Dale<br />
1999 KELCO, personal communication with Mary Ann Irwin, MEC. June.<br />
Guth, John<br />
1999 Annotated maps identifying surfgrass, scattered rocks, and reefs, South Oceanside to<br />
Torrey Pines. Annotations by John Guth, President, California Lobster and Trap<br />
Fishermen's Association. August 20.<br />
Page 9-4<br />
<strong>Regional</strong> <strong>Beach</strong> <strong>Sand</strong> <strong>Project</strong> <strong>EIR</strong>/<strong>EA</strong><br />
99-69\sect-09.wpd 7/19/00
9.0 References and Persons Contacted<br />
Hales, L.Z.<br />
1978 Coastal Processes Study of the Oceanside, California Littoral Cell, Final Report.<br />
U.S. <strong>Army</strong> Corps of Engineers, Waterways Experiment Station, Misc. Paper H-78-8,<br />
Vicksburg, MS.<br />
1979 Mission Bay, California, Littoral Compartment Study, Final Report. U.S. <strong>Army</strong> Corps<br />
of Engineers, Waterways Experiment Station, Misc. Paper H-78-8, Vicksburg, MS.<br />
Hays, Loren<br />
2000 Biologist, United States Fish and Wildlife Service, personal communication with Paul<br />
Amberg, K<strong>EA</strong> Environmental. February 3.<br />
Hoffman, Bob<br />
2000 Biologist, National Marine Fisheries Services, personal communication with Teri Fenner,<br />
K<strong>EA</strong> Environmental. February 1.<br />
Inman, D.L. and S.A. Jenkins<br />
1983 Oceanographic Report for Oceanside <strong>Beach</strong> Facilities. Prepared for the City of<br />
Oceanside, CA.<br />
King, Philip, Ph.D.<br />
1999 The Fiscal Impact of <strong>Beach</strong>es in California. Prepared for the California Department<br />
of Boating and Waterways. September.<br />
Marine Advisors<br />
1961 A Statistical Survey of Ocean Wave Characteristics in Southern California Waters.<br />
Prepared for the U.S. <strong>Army</strong> Corps of Engineers, Los Angeles District.<br />
MEC Analytical Systems, Inc.<br />
R<br />
1997 Least Tern and Water Turbidity Monitoring Seal <strong>Beach</strong> Pier to Warner Avenue. R<br />
Prepared for U.S. <strong>Army</strong> Corps of Engineers. November.<br />
R<br />
<strong>Regional</strong> <strong>Beach</strong> <strong>Sand</strong> <strong>Project</strong> <strong>EIR</strong>/<strong>EA</strong> Page 9-5<br />
99-69\sect-09.wpd 7/19/00
9.0 References and Persons Contacted<br />
Mitchell, Darryl<br />
1999 Planner for City of Solana <strong>Beach</strong>, personal communication with Shawn Shamlou, K<strong>EA</strong><br />
Environmental.<br />
Moffatt & Nichol Engineers<br />
1999 Memo regarding economic analysis of sand retention structures from Chris Webb to Steve<br />
Sachs, SANDAG. February 25.<br />
2000a Shoreline Morphology Study, San Diego <strong>Regional</strong> <strong>Beach</strong> <strong>Sand</strong> <strong>Project</strong>. Prepared for<br />
K<strong>EA</strong> Environmental. January 14.<br />
2000b Memo regarding North Carlsbad Empirical Data from Chris Webb, Moffatt & Nichol, to<br />
Steve Sachs, SANDAG. March 2.<br />
2000c Memo regarding overfill factor, from Chris Webb, Moffatt & Nichol, to Steve Sachs,<br />
SANDAG. March 2.<br />
2000d Personal communication between Chris Webb, Moffatt & Nichol, and Teri Fenner, K<strong>EA</strong><br />
Environmental, Inc. March 3.<br />
National Marine Fisheries Service (NMFS)<br />
1991 Results of Southern California Sportfish Economic Survey. August.<br />
2000 Letter from Rodney McInnis, Acting <strong>Regional</strong> Administrator to J.C. Ruzicska, U.S. Navy<br />
Environmental Program Manager, Re: NMFS Finding that U.S. Navy Southwest Division<br />
Existing Environmental Review Procedures For Federal <strong>Project</strong>s Meet EFH Consultation<br />
Requirements. April.<br />
Pacific Fishery Management Council<br />
1998a Essential Fish Habitat West Coast Groundfish, modified from the Final EIS for<br />
Amendment 11 to the Pacific Groundfish Fishery Management Plan. October.<br />
Page 9-6<br />
<strong>Regional</strong> <strong>Beach</strong> <strong>Sand</strong> <strong>Project</strong> <strong>EIR</strong>/<strong>EA</strong><br />
99-69\sect-09.wpd 7/19/00
9.0 References and Persons Contacted<br />
1998b Essential Fish Habitat Coastal Pelagic Species, modified from the Coastal Pelagics<br />
Species Fishery Management Plan, Amendment 8 to the Northern Anchovy Fishery<br />
Management Plan. December.<br />
Pettus, Roy E.<br />
1995 Marine Cultural Resources Data Assessment for the Conceptual Design of the<br />
Proposed South Bay Ocean Outfall, San Diego, California. Engineering-Science, Inc.,<br />
San Diego, CA.<br />
Pryde, Philip<br />
1992 San Diego: An Introduction to the Region. Kendall/Hunt Publishing Company.<br />
San Diego Association of Governments (SANDAG)<br />
1993 Shoreline Preservation Strategy for the San Diego Region and Appendix 1. July.<br />
1998 <strong>Regional</strong> <strong>Beach</strong> Monitoring Program, Fall Survey. Prepared by Coastal Frontiers<br />
Corporation, Chatsworth, CA.<br />
1999 Facsimile from Greg Smith, SANDAG, to K<strong>EA</strong> Environmental. August 6.<br />
2000 Public Materials from Shoreline Erosion Committee Meeting. January 6.<br />
San Diego Unified Port District<br />
1998 San Diego Bay Market Fishing Fleet. Prepared by SDUPD Land Use Planning<br />
Department, 27 pp. October.<br />
SCCWRP<br />
1992 SCCWRP Reference Study. Southern California Coastal Water Research <strong>Project</strong> Annual<br />
Report, 1990-1991, 1991-1992.<br />
Schiff, K. and R. Gossett<br />
1998 The 1994 Southern California Bight Pilot <strong>Project</strong>: Sediment Chemistry. SCCWRP.<br />
<strong>Regional</strong> <strong>Beach</strong> <strong>Sand</strong> <strong>Project</strong> <strong>EIR</strong>/<strong>EA</strong> Page 9-7<br />
99-69\sect-09.wpd 7/19/00
9.0 References and Persons Contacted<br />
Sea Surveyor, Inc.<br />
1999 Final San Diego <strong>Regional</strong> <strong>Beach</strong> <strong>Sand</strong> <strong>Project</strong> Offshore <strong>Sand</strong> Investigations.<br />
Prepared for San Diego Association of Governments. April.<br />
Semple, Bob<br />
1999 Solana <strong>Beach</strong> City Manager, personal communication with Shawn Shamlou, K<strong>EA</strong><br />
Environmental.<br />
Sherman, Douglas J., Burton Jones, Eugene Farrell, Jinkang Wang, and Zhihong Zheng<br />
1998 The Fate of Fine Sediments in a Suspension Plume: Ponto <strong>Beach</strong>, California. A<br />
Report of Findings prepared for the California Department of Boating and Waterways.<br />
Department of Geography, University of Southern California.<br />
South Coast Air Quality Management District (SCAQMD)<br />
1993 CEQA Air Quality Handbook. April. Revised November.<br />
State Water Resources Control Board (SWRCB)<br />
1997 California Ocean Plan. Water Quality Control Plan, Ocean Waters of California. July 23.<br />
U.S. <strong>Army</strong> Corps of Engineers (USACOE)<br />
1984 Shore Protection Manual, Volumes I and II. Coastal Engineering Research Center.<br />
1991 Coast of California Storm and Tidal Waves Study (CCSTWS). Final State of the<br />
Coast Report, San Diego Region.<br />
1993 Final Report, <strong>Beach</strong> Nourishment Sources Along the Carlsbad/Oceanside Coast, San<br />
Diego County, California. November<br />
U.S. Environmental Protection Agency<br />
n.d. Compilation of Air Pollution Emission Factors, AP-42. Now available at<br />
http://wwww.epa.gov/ttnchie1/<br />
Page 9-8<br />
<strong>Regional</strong> <strong>Beach</strong> <strong>Sand</strong> <strong>Project</strong> <strong>EIR</strong>/<strong>EA</strong><br />
99-69\sect-09.wpd 7/19/00
9.0 References and Persons Contacted<br />
Wells, Mike<br />
1999 Department of Parks and Recreation Resource Ecologist, personal communication with<br />
Shawn Shamlou, Environmental Analyst, K<strong>EA</strong> Environmental. July 30.<br />
2000 Department of Parks and Recreation Resource Ecologist, personal communication with<br />
James Kurtz, Environmental Engineer, K<strong>EA</strong> Environmental. January 11.<br />
9.2 PERSONS CONTACTED<br />
California Coastal Commission<br />
Sherilyn Sarb, District Manager<br />
Gary Cannon, Coastal Planner<br />
Leslie Ewing, Planner<br />
California Department of Fish and Game<br />
Dennis Bedford, Fisheries Manager<br />
California Department of Parks and Recreation<br />
Denny Stoufer, Lifeguards<br />
Mike Wells, Resource Ecologist<br />
Ed Navarro, Superintendent of Parks<br />
California Lobster & Trap Fishermen’s Association<br />
John Guth<br />
August Felando<br />
California State Lands Commission<br />
Jane Smith, Public Land Management Specialist<br />
Kirk Walker<br />
City of Carlsbad<br />
Stave Jantz, Engineer<br />
Eric Munoz, Planner<br />
<strong>Regional</strong> <strong>Beach</strong> <strong>Sand</strong> <strong>Project</strong> <strong>EIR</strong>/<strong>EA</strong> Page 9-9<br />
99-69\sect-09.wpd 7/19/00
9.0 References and Persons Contacted<br />
City of Del Mar<br />
Monica Tuchscher, Planner<br />
City of Encinitas<br />
Kathy Stone, Planner<br />
Phil Cotton, Community Services<br />
Garrett Williams, Engineering Department<br />
Tom Buckner<br />
City of Imperial <strong>Beach</strong><br />
Melanie Kush, Planner<br />
City of Oceanside<br />
Ray Duncan, Lifeguard Manager<br />
Jerry Hittleman, Planner<br />
City of San Diego<br />
Allison Rapp, Planner<br />
Larry Kuzminski, Engineer<br />
Terri Williams, Parks and Recreation Department<br />
Linda Lechusa, Parks and Recreation Department<br />
Frank Hofner, Noise Administrator<br />
City of Solana <strong>Beach</strong><br />
Bob Semple, City Manager<br />
Steve Apple, Planning Director<br />
Darryl Mitchell, Planner<br />
Lobster Fishermen<br />
Bruce Campbell<br />
Tom Ptak<br />
Rocky Corden<br />
Robert Phillips<br />
David Couch<br />
Page 9-10<br />
<strong>Regional</strong> <strong>Beach</strong> <strong>Sand</strong> <strong>Project</strong> <strong>EIR</strong>/<strong>EA</strong><br />
99-69\sect-09.wpd 7/19/00
9.0 References and Persons Contacted<br />
Martin Kastlemger<br />
Andres Saraspe<br />
Port of San Diego<br />
Larry Erye, Engineering Department<br />
Bill Chopyk, Manager of Planning Services<br />
San Elijo Lagoon Foundation<br />
Doug Gibson, Executive Director<br />
Sea Urchin Harvesters’ Association, California<br />
Peter Halmay<br />
Sport Diver/Fisherman<br />
Lee Olsen<br />
Urchin Producers Marketing Association<br />
Mitch Hobron<br />
U.S. <strong>Army</strong> Corps of Engineers<br />
Russ Kaiser, Senior <strong>Project</strong> Manager<br />
<strong>Regional</strong> <strong>Beach</strong> <strong>Sand</strong> <strong>Project</strong> <strong>EIR</strong>/<strong>EA</strong> Page 9-11<br />
99-69\sect-09.wpd 7/19/00
10.0 <strong>EIR</strong>/<strong>EA</strong> Distribution List<br />
CHAPTER 10.0<br />
<strong>EIR</strong>/<strong>EA</strong> DISTRIBUTION LIST<br />
A copy of the Draft <strong>EIR</strong>/Review <strong>EA</strong> has been provided to the following:<br />
Federal Agencies<br />
National Marine Fisheries Service<br />
U.S. <strong>Army</strong> Corps of Engineers, LA District, Regulatory Branch<br />
U.S. Environmental Protection Agency, Region 9<br />
U.S. Fish and Wildlife Service<br />
State Agencies<br />
California Air Resources Board<br />
California Coastal Commission<br />
California Department of Boating and Waterways<br />
California Department of Fish and Game<br />
California Department of Parks and Recreation<br />
California State Coastal Conservancy<br />
California State Lands Commission<br />
State of California, Clearinghouse<br />
<strong>Regional</strong> Agencies/Special Purpose Agencies<br />
Air Pollution Control District<br />
<strong>Regional</strong> Water Quality Control Board<br />
Local Jurisdictions<br />
City of Carlsbad<br />
City of Coronado<br />
City of Del Mar<br />
<strong>Regional</strong> <strong>Beach</strong> <strong>Sand</strong> <strong>Project</strong> <strong>EIR</strong>/<strong>EA</strong> Page 10-1<br />
99-69\SANDAG <strong>EIR</strong><strong>EA</strong> 5 to 10.wpd 7/17/00
10.0 <strong>EIR</strong>/<strong>EA</strong> Distribution List<br />
City of Encinitas<br />
City of Imperial <strong>Beach</strong><br />
City of Oceanside<br />
City of San Diego<br />
City of Solana <strong>Beach</strong><br />
County of San Diego<br />
County of Orange<br />
San Diego Unified Port District<br />
Libraries<br />
Carlsbad City Library<br />
City of San Diego Public Library, Central/Government Documents<br />
Coronado Public Library<br />
County of San Diego, Library Coordinator<br />
County of San Diego Library, Headquarters<br />
County of San Diego, Serra Cooperative Library System<br />
Del Mar Library<br />
Encinitas Library<br />
Imperial <strong>Beach</strong> Library<br />
La Jolla Branch Public Library<br />
Oceanside Public Library<br />
Pacific <strong>Beach</strong> Branch Public Library<br />
Solana <strong>Beach</strong> Library<br />
University of San Diego Copley Library<br />
Other Interested Parties<br />
Audubon Society<br />
Agua Hedionda Lagoon Foundation<br />
NRG Cabrillo Power<br />
California Lobster and Trap Fisherman Association<br />
California Shore and <strong>Beach</strong> Preservation Association<br />
Environmental Health Coalition<br />
Page 10-2<br />
<strong>Regional</strong> <strong>Beach</strong> <strong>Sand</strong> <strong>Project</strong> <strong>EIR</strong>/<strong>EA</strong><br />
99-69\SANDAG <strong>EIR</strong><strong>EA</strong> 5 to 10.wpd 7/17/00
10.0 <strong>EIR</strong>/<strong>EA</strong> Distribution List<br />
Mr. Gilbert Nares<br />
San Diego Gas and Electric/Enova<br />
San Diego Union-Tribune<br />
San Dieguito <strong>Regional</strong> Open Space Park<br />
Scripps Institute of Oceanography<br />
Sea Urchin Harvesters’ Association<br />
Sierra Club<br />
Surfrider Foundation<br />
University of San Diego, Legal Clinic<br />
Urchin Producers Marketing Association<br />
Mr. Tim Vasquez<br />
<strong>Regional</strong> <strong>Beach</strong> <strong>Sand</strong> <strong>Project</strong> <strong>EIR</strong>/<strong>EA</strong> Page 10-3<br />
99-69\SANDAG <strong>EIR</strong><strong>EA</strong> 5 to 10.wpd 7/17/00