Using Beyond 20/20: A Brief Guide
Using Beyond 20/20: A Brief Guide
Using Beyond 20/20: A Brief Guide

You also want an ePaper? Increase the reach of your titles
YUMPU automatically turns print PDFs into web optimized ePapers that Google loves.
<strong>Using</strong> <strong>Beyond</strong> <strong>20</strong>/<strong>20</strong>: A <strong>Brief</strong> <strong>Guide</strong><br />
Statistics Canada uses <strong>Beyond</strong> <strong>20</strong>/<strong>20</strong> software for several database products (e.g., IDLS - Internet Data<br />
Library System). The software permits the manipulation of variables (known as dimensions in <strong>Beyond</strong><br />
<strong>20</strong>/<strong>20</strong>) to create your own spreadsheet of data. The software can be downloaded free of charge and is<br />
currently available on all on-campus computers. If you require the software, follow this link to download<br />
the <strong>Beyond</strong> <strong>20</strong>/<strong>20</strong> Professional Browser: http://estat.statcan.ca/Estat/English/beyond<strong>20</strong>.shtml<br />
Definitions & Concepts of <strong>Beyond</strong> <strong>20</strong>/<strong>20</strong><br />
• TABLE: A combination of multi-dimensional data and text.<br />
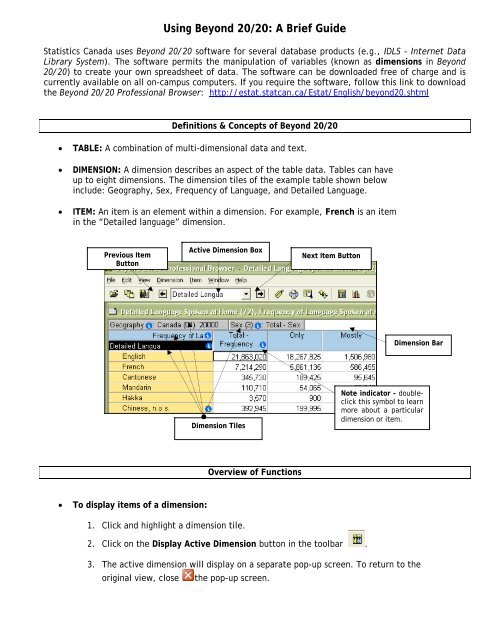
• DIMENSION: A dimension describes an aspect of the table data. Tables can have<br />
up to eight dimensions. The dimension tiles of the example table shown below<br />
include: Geography, Sex, Frequency of Language, and Detailed Language.<br />
• ITEM: An item is an element within a dimension. For example, French is an item<br />
in the “Detailed language” dimension.<br />
Previous Item<br />
Button<br />
Active Dimension Box<br />
Next Item Button<br />
Dimension Bar<br />
Dimension Tiles<br />
Note indicator - doubleclick<br />
this symbol to learn<br />
more about a particular<br />
dimension or item.<br />
Overview of Functions<br />
• To display items of a dimension:<br />
1. Click and highlight a dimension tile.<br />
2. Click on the Display Active Dimension button in the toolbar .<br />
3. The active dimension will display on a separate pop-up screen. To return to the<br />
original view, close the pop-up screen.
• To search for items within a dimension: Highlight the dimension tile, and then click the<br />
Next Item button to scroll through the items. Alternatively, if you know exactly what item<br />
you are looking for (e.g., looking for the item “Nova Scotia” or the postal code B3 within<br />
the Geography dimension), follow the directions below:<br />
1. Click and highlight a dimension tile.<br />
2. Click on the Search button in the toolbar .<br />
3. The Search Box will appear - notice the Field, Type of Selection, or Date Range<br />
and Text to Find search options.<br />
4. Enter your search data or text (e.g., Nova Scotia) as shown below.<br />
If you select Code or<br />
English Desc, you must<br />
use the Text to Find<br />
search.<br />
If you select Data, you<br />
must indicate a date<br />
range.<br />
5. To return to the original table view, click Dimension (on the toolbar), then click<br />
Reset.<br />
• To sort items in a dimension: Use this function to reorder items within a dimension.<br />
1. Click and highlight the dimension tile.<br />
2. Click on the Sort Dimension button .<br />
3. If you want to sort the dimension based on data value, click the “Data” field and<br />
then select either “Increasing” or “Decreasing”. If you want to sort by “Code” or<br />
“English desc.”, select either increasing (numeric or alphabetic) or decreasing<br />
(numeric or alphabetic).<br />
4. To return to the original table view, click Dimension (on the toolbar), then click<br />
Reset.
Customizing your Tables<br />
• Switching Dimensions: Use this function to change the table view by dragging and<br />
dropping dimensions.<br />
1. Click and drag the selected dimension tile.<br />
2. Drop it on top of the dimension tile you want to switch.<br />
3. To return to the original table view, click View (on the toolbar), and select Reset.<br />
Note: Only dimensions can be dragged and dropped - rows and columns cannot be moved with<br />
this feature.<br />
• Showing & Hiding Items: This function is used to either show or hide particular items in a<br />
table. Select items in a dimension you wish to hide or show by first clicking on them.<br />
1. If you wish to select more than one item at a time, hold the control key [Ctrl] and<br />
click on each item.<br />
2. Go up to the Item in the top toolbar.<br />
3. Click Show from the drop down menu.<br />
4. To do the reverse, click on Hide.<br />
5. To return to the original table view, click on View (on the toolbar) and select<br />
Reset.<br />
• Nesting Dimensions: Nesting displays one dimension tile within another. This function<br />
allows you to display more than one dimension along the columns and rows of your table<br />
at the same time. For example, in the following table, you want to move the Sex<br />
dimension over to the left column along with the Age Groups dimension.<br />
1. Click and drag the selected dimension (e.g., Sex).<br />
2. Position it over the column border until the border is highlighted (dark blue/black<br />
colour).<br />
3. Drop when the border is highlighted.<br />
BEFORE
AFTER<br />
Source: Statistics Canada. <strong>20</strong>06. Census of Canada, <strong>20</strong>06. Table 97-555-XCB<strong>20</strong>060<strong>20</strong>: Mother<br />
Tongue (8), Age Groups (17A) and Sex (3) for the Population of Canada, Provinces, Territories and<br />
Forward Sortation Areas, <strong>20</strong>06 Census - 100% Data, [machine readable data file]. Retrieved May<br />
<strong>20</strong>, <strong>20</strong>09 from http://janus.ssc.uwo.ca/idls/. <strong>Beyond</strong> <strong>20</strong>/<strong>20</strong>.<br />
Exporting Data<br />
• Exporting Data: Click on File (on the toolbar), then click Save As. You will be given the<br />
option to save in several formats. It is recommended that you download the file in Excel<br />
format (.xls).<br />
• If the worksheet you wish to export is too large, the download will not occur. You may<br />
need to break the file down into smaller components (by province, by single gender, by<br />
single units of age).<br />
Patrick Power Library, May <strong>20</strong>09