TSI - Solar Influences Data Center
TSI - Solar Influences Data Center
TSI - Solar Influences Data Center

You also want an ePaper? Increase the reach of your titles
YUMPU automatically turns print PDFs into web optimized ePapers that Google loves.
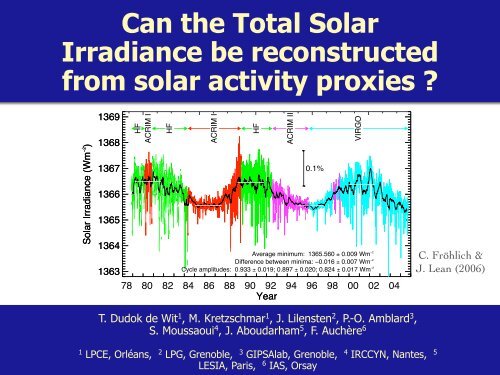
Can the Total <strong>Solar</strong><br />
Irradiance be reconstructed<br />
from solar activity proxies ?<br />
<strong>Solar</strong> Irradiance (Wm !2 )<br />
1369<br />
1368<br />
1367<br />
1366<br />
1365<br />
1364<br />
1363<br />
SOLAR IRRADIANCE VARIABILITY 9<br />
Days (Epoch Jan 0, 1980)<br />
0 2000 4000 6000 8000<br />
HF<br />
ACRIM I<br />
HF<br />
ACRIM I<br />
78 80 82 84 86 88 90 92 94 96 98 00 02 04<br />
Year<br />
1<br />
been improved. LPCE, Finally, Orléans, the difference 2 LPG, Grenoble, between 3 GIPSAlab, the minima Grenoble, has also 4 IRCCYN, not changed. Nantes, The 5 dates<br />
LESIA, Paris, 6 IAS, Orsay<br />
HF<br />
ACRIM II<br />
0.1%<br />
VIRGO<br />
Average minimum: 1365.560 ± 0.009 Wm !2<br />
Difference between minima: !0.016 ± 0.007 Wm !2<br />
Cycle amplitudes: 0.933 ± 0.019; 0.897 ± 0.020; 0.824 ± 0.017 Wm !2<br />
C. Fröhlich &<br />
J. Lean (2006)<br />
Figure 9. Shown<br />
T.<br />
isDudok the final<br />
de Wit<br />
version 1 , M. Kretzschmar<br />
of the PMOD 1 , J.<br />
composite.<br />
Lilensten 2 , P.-O.<br />
Compared<br />
Amblardto 3 ,<br />
the earlier<br />
versions the maximum ofS. cycle Moussaoui 21 is 4 , atJ. about Aboudarham the level 5 , F. as Auchère before, 6 but has less noise,<br />
especially in the early part. This may indicate that the early HF corrections have indeed<br />
of the maxima are 26/03/1979 – 25/12/1981, 28/04/1989 – 21/02/1992 and 19/01/2000 –
Why reconstruct the <strong>TSI</strong> ?<br />
The Sun and the Earth’s Climate<br />
Many attempts have been<br />
made to reconstruct pre-1978<br />
values of Total <strong>Solar</strong> Irradiance<br />
(<strong>TSI</strong>) from proxy data<br />
J. Haigh (2007)<br />
Figure 22: Reconstructions by various authors of total solar irradiance over the<br />
From Judith Lean, based on data from Wang et al. (2005); Lean (2000); Foster (2<br />
ESSW4, Brussels, Nov. 2007<br />
5 <strong>Solar</strong> spectral irradiance<br />
2
Why reconstruct the <strong>TSI</strong> ?<br />
The Sun and the Earth’s Climate<br />
Many attempts have been<br />
made to reconstruct pre-1978<br />
values of Total <strong>Solar</strong> Irradiance<br />
(<strong>TSI</strong>) from proxy data<br />
Such reconstruction are needed to<br />
Figure 22: Reconstructions by various authors of total solar irradiance over the<br />
From Judith Lean, based on data from Wang et al. (2005); Lean (2000); Foster (2<br />
assess solar effects on past climate changes<br />
understand what 5causes <strong>Solar</strong>the spectral weak variability irradiance of the <strong>TSI</strong><br />
J. Haigh (2007)<br />
ESSW4, Brussels, Nov. 2007<br />
2
How to reconstruct the <strong>TSI</strong><br />
Most reconstructions of the <strong>TSI</strong> use solar activity<br />
indices: sunspot number, MgII index, ...<br />
short-time reconstructions (days) have been quite<br />
successful so far...<br />
...but the (presumably important) role of the solar<br />
magnetic field is hard to include<br />
ESSW4, Brussels, Nov. 2007<br />
3
ESSW4, Brussels, Nov. 2007 J. Lean, Physics Today, 2005<br />
4
There is a problem...<br />
before determining HOW to reconstruct the <strong>TSI</strong> from proxies<br />
we need to<br />
determine IF this reconstruction can be done at all<br />
and<br />
and WHICH proxies are the best model inputs<br />
ESSW4, Brussels, Nov. 2007<br />
5
APPROPRIATIONS<br />
BUDGET<br />
ENERGY/COMMERCE<br />
VETERANS’ AFFAIRS<br />
INTELLIGENCE<br />
ARMED SERVICES<br />
HOUSE ADMINISTRATION<br />
OFFICIAL CONDUCT<br />
RULES<br />
AGRICULTURE<br />
TRANSPORTATION<br />
HOMELAND SECURITY<br />
GOVERNMENT REFORM<br />
WAYS AND MEANS<br />
RESOURCES<br />
SMALL BUSINESS<br />
EDUCATION<br />
INTERNATIONAL RELATIONS<br />
SCIENCE<br />
JUDICIARY<br />
FINANCIAL SERVICES<br />
Community structure in the 108 th U.S. house of representatives<br />
each dot represents a subcommittee<br />
(M. Porter et al., arxiv.org/physics/0602033)<br />
6
Networks : studying interactions<br />
Networks are important because structure affects function<br />
Examples<br />
spread of disease in a population<br />
robustness and stability of power grids<br />
earthquake dynamics<br />
...<br />
Networks can be studied within the frame of statistical physics<br />
(percolation, critical exponents, phase transitions, ...)<br />
ESSW4, Brussels, Nov. 2007<br />
7
Networks : studying interactions<br />
Networks are important because structure affects function<br />
Examples<br />
spread of disease in a population<br />
robustness and stability of power grids<br />
earthquake dynamics<br />
...<br />
Networks can be studied within the frame of statistical physics<br />
(percolation, critical exponents, phase transitions, ...)<br />
Here we compare the <strong>TSI</strong> against 12 solar proxies, using<br />
daily measurements from 26 Nov 1978 till 30 Sep 2007<br />
ESSW4, Brussels, Nov. 2007<br />
7
The data<br />
The 12 proxies for solar activity are:<br />
1. ISN : international sunspot number (from SIDC)<br />
2. f10.7 : solar radio flux at 10.7 cm (Penticton Obs.)<br />
3. MgII index : core to wing ratio of Mg II line (R. Viereck, NOAA)<br />
—> upper photosphere and chromosphere<br />
4. CaK index : Ca K II equivalent width (Kitt Peak Obs.)<br />
—> plages and faculae<br />
5. HeI index : equivalent width of He I line (Kitt peak Obs.)<br />
—> plages and faculae<br />
6. Lya index : composite Lyman-α irradiance (T. Woods, LASP)<br />
—> upper photosphere up to corona<br />
ESSW4, Brussels, Nov. 2007<br />
8
The data<br />
7. MPSI : magnetic plage strength index (Mt. Wilson Obs.)<br />
—> contribution from regions with 10 < |B| < 100 G<br />
8. MWSI : Mount Wilson sunspot index (Mt. Wilson Obs.)<br />
—> contribution from regions with |B| > 100 G<br />
9. DSA : daily sunspot area (Greenwich Obs.)<br />
10. Mean magnetic field of the Sun (Wilcox Obs.)<br />
11. OFI : optical flare index (Ataç and Özgüç)<br />
—> intensity x duration of flares<br />
12. Coronal index (Rybansky) —> total energy emitted by<br />
the solar corona in the FeXIV line at 530.3 nm<br />
and<br />
<strong>TSI</strong> : composite total solar irradiance (PMOD composite)<br />
ESSW4, Brussels, Nov. 2007<br />
9
The method<br />
Each proxy captures a different aspect of the solar activity<br />
Connections between proxies should reveal which<br />
mechanisms affect the <strong>TSI</strong> most<br />
We compute the mutual information I(x, y) between<br />
each pair of proxies = amount of information that proxy x<br />
reveals about proxy y<br />
I(x, y) = H(x) − H(x|y)<br />
∫<br />
H(x) = − p(x) log p(x) dx<br />
is the entropy<br />
p(x)<br />
is the probability density<br />
ESSW4, Brussels, Nov. 2007<br />
10
The data<br />
200 ISN<br />
0<br />
300<br />
200<br />
100<br />
f10.7<br />
5<br />
MPSI<br />
0<br />
4<br />
2<br />
0<br />
MWSI<br />
200 MNFLD<br />
0<br />
5000 DSA<br />
0<br />
100<br />
50<br />
OFI<br />
0<br />
20<br />
10<br />
FeXIV<br />
0.29 0<br />
0.28<br />
MgII<br />
0.27<br />
0.105<br />
0.095<br />
0.1<br />
CaK<br />
0.085<br />
0.09<br />
50 60 70 80 90<br />
HeI<br />
6<br />
5<br />
4<br />
Lya<br />
1368<br />
1366<br />
1364<br />
1362<br />
1975 1980 1985 1990 1995 2000 2005 2010<br />
ESSW4, Brussels, Nov. 2007<br />
<strong>TSI</strong><br />
11
Excerpt<br />
100 150 200 250<br />
50<br />
300<br />
200<br />
100<br />
3<br />
2<br />
1<br />
ESSW4, Brussels, Nov. 2007<br />
ISN<br />
f10.7<br />
MPSI<br />
1 MWSI<br />
0<br />
100 MNFLD<br />
0<br />
6000<br />
4000<br />
2000<br />
DSA<br />
50 OFI<br />
0<br />
20<br />
15<br />
10<br />
FeXIV<br />
0.285<br />
0.275<br />
0.28<br />
0.27<br />
MgII<br />
0.1 CaK<br />
0.09<br />
80<br />
70<br />
HeI<br />
60<br />
6<br />
5<br />
4<br />
Lya<br />
1368<br />
1366<br />
1364<br />
1988 1989 1990<br />
<strong>TSI</strong><br />
12
Different scales<br />
The analysis is done separately for<br />
short scale fluctuations<br />
< 80 days<br />
effect of solar rotation,<br />
center-to-limb effects, ...<br />
long scale fluctuations<br />
> 80 days<br />
effect of solar magnetic<br />
cycle + trend<br />
ESSW4, Brussels, Nov. 2007<br />
13
Connections for short time scales<br />
line thickness<br />
reflects level of<br />
mutual information<br />
MNFLD<br />
FeXIV<br />
HeI<br />
MPSI<br />
<strong>TSI</strong><br />
MWSI<br />
f10.7<br />
MgII<br />
Lya<br />
DSA<br />
ISN<br />
CaK<br />
ESSW4, Brussels, Nov. 2007<br />
OFI<br />
14
Connections for short time scales<br />
line thickness<br />
reflects level of<br />
mutual information<br />
MNFLD<br />
FeXIV<br />
Plages,<br />
faculae, ...<br />
HeI<br />
MPSI<br />
<strong>TSI</strong><br />
MWSI<br />
f10.7<br />
MgII<br />
Lya<br />
DSA<br />
ISN<br />
CaK<br />
ESSW4, Brussels, Nov. 2007<br />
OFI<br />
Active regions<br />
14
Connections for long time scales<br />
OFI<br />
DSA<br />
MWSI<br />
ISN<br />
CaK<br />
f10.7<br />
MPSI<br />
FeXIV<br />
Lya<br />
MNFLD<br />
HeI<br />
MgII<br />
ESSW4, Brussels, Nov. 2007<br />
<strong>TSI</strong><br />
15
Connections for long time scales<br />
OFI<br />
DSA<br />
MWSI<br />
Active regions<br />
ISN<br />
CaK<br />
f10.7<br />
MPSI<br />
FeXIV<br />
Lya<br />
MNFLD<br />
Plages,<br />
faculae, ...<br />
HeI<br />
MgII<br />
ESSW4, Brussels, Nov. 2007<br />
<strong>TSI</strong><br />
15
Conclusions (1/3)<br />
Which mechanisms contribute to the variability of the <strong>TSI</strong> ?<br />
for short time scales : regions with intense magnetic fields<br />
because they describe the cooling effect of sunspots<br />
for long time scales : ”irradiance” proxies which describe<br />
faculae and plages<br />
ESSW4, Brussels, Nov. 2007<br />
16
Conclusions (1/3)<br />
Which mechanisms contribute to the variability of the <strong>TSI</strong> ?<br />
for short time scales : regions with intense magnetic fields<br />
because they describe the cooling effect of sunspots<br />
for long time scales : ”irradiance” proxies which describe<br />
faculae and plages<br />
➔ the variability is dominated by the photosphere and the<br />
chromosphere<br />
➔ flares do contribute to the variability (poster by M. Kretzschmar)<br />
ESSW4, Brussels, Nov. 2007<br />
16
Conclusions (2/3)<br />
Can the <strong>TSI</strong> be reconstructed from a linear or a nonlinear<br />
combination of solar proxies ?<br />
MNFLD<br />
FeXIV<br />
HeI<br />
MPSI<br />
<strong>TSI</strong><br />
MWSI<br />
f10.7<br />
MgII<br />
Lya<br />
DSA<br />
ISN<br />
CaK<br />
ESSW4, Brussels, Nov. 2007<br />
OFI<br />
17
Conclusions (2/3)<br />
Can the <strong>TSI</strong> be reconstructed from a linear or a nonlinear<br />
combination of solar proxies ?<br />
Very unlikely.<br />
FeXIV<br />
➔ archives are important for<br />
developing new proxies from<br />
historic data (photospheric<br />
sunspot index, facular<br />
index, ...)<br />
MNFLD<br />
MPSI<br />
HeI<br />
<strong>TSI</strong><br />
MWSI<br />
f10.7<br />
MgII<br />
Lya<br />
DSA<br />
ISN<br />
CaK<br />
ESSW4, Brussels, Nov. 2007<br />
OFI<br />
17
Conclusions (3/3)<br />
From what solar proxies can the <strong>TSI</strong> then be reconstructed ?<br />
MNFLD<br />
FeXIV<br />
HeI<br />
MPSI<br />
<strong>TSI</strong><br />
MWSI<br />
f10.7<br />
MgII<br />
Lya<br />
DSA<br />
ISN<br />
CaK<br />
ESSW4, Brussels, Nov. 2007<br />
OFI<br />
18
Conclusions (3/3)<br />
From what solar proxies can the <strong>TSI</strong> then be reconstructed ?<br />
The direction to go is a measurement of the spatial<br />
distribution of the (weak) solar magnetic field<br />
➔ include causality: in this<br />
coupled system, what causes<br />
what ?<br />
MNFLD<br />
MPSI<br />
FeXIV<br />
HeI<br />
<strong>TSI</strong><br />
MWSI<br />
f10.7<br />
MgII<br />
Lya<br />
DSA<br />
ISN<br />
CaK<br />
ESSW4, Brussels, Nov. 2007<br />
OFI<br />
18
Network structure of<br />
RP<br />
COST724 team<br />
WS<br />
BZ<br />
DL<br />
AT<br />
AV<br />
AW<br />
PWHL<br />
FZ<br />
MC<br />
BS<br />
CC<br />
MM<br />
JW<br />
ABIS<br />
JL<br />
PGMK TD YT FS<br />
AC<br />
ML<br />
DH<br />
RVFJ<br />
CH<br />
GC<br />
EA<br />
RH<br />
KK<br />
LD<br />
EF<br />
MS<br />
HR<br />
EC<br />
19
ESSW4, Brussels, Nov. 2007 20
<strong>Data</strong> : lowpass<br />
150<br />
100<br />
50<br />
200<br />
150<br />
100<br />
4<br />
2<br />
1.5<br />
0.5 1<br />
60<br />
40<br />
20<br />
3000<br />
2000<br />
1000<br />
10<br />
15<br />
20<br />
5<br />
15<br />
10<br />
5<br />
0.28<br />
0.275<br />
0.27<br />
0.265<br />
0.1<br />
0.095<br />
0.09<br />
80<br />
60<br />
6<br />
5<br />
4<br />
1366.5<br />
1366<br />
1365.5<br />
1975 1980 1985 1990 1995 2000 2005 2010<br />
ESSW4, Brussels, Nov. 2007<br />
ISN<br />
f10.7<br />
MPSI<br />
MWSI<br />
MNFLD<br />
DSA<br />
OFI<br />
FeXIV<br />
MgII<br />
CaK<br />
HeI<br />
Lya<br />
<strong>TSI</strong><br />
21