John Bollinger on consolidations - Sonic.net
John Bollinger on consolidations - Sonic.net
John Bollinger on consolidations - Sonic.net

You also want an ePaper? Increase the reach of your titles
YUMPU automatically turns print PDFs into web optimized ePapers that Google loves.
CT: Where do you suggest traders c<strong>on</strong>diti<strong>on</strong>ed to trade in<br />
l<strong>on</strong>g-term trends get started in terms of operating in rangetype<br />
markets?<br />
JB: The tools that work the best are relative tools — those<br />
that let you get a grip <strong>on</strong> what’s happening in relati<strong>on</strong> to<br />
immediately prior history.<br />
Of course, different traders will have different ideas<br />
about what “immediately prior” means. For some it will<br />
mean what’s happened this morning, for others it will mean<br />
the past 20 days or the past six m<strong>on</strong>ths or year. But the<br />
advantage of relative tools is that you can adapt them to<br />
your purposes.<br />
<str<strong>on</strong>g>Bollinger</str<strong>on</strong>g> Bands, for instance, provide a definiti<strong>on</strong><br />
whether prices are high or low <strong>on</strong> a relative basis (see<br />
“Indicator reference”). At the upper band, prices are high,<br />
and at the lower band, prices are low. If price tags the upper<br />
band, you know prices are high, so you can c<strong>on</strong>sult another<br />
tool to determine whether you believe that “highness” is<br />
sustainable or whether it’s a potential reversal to be sold.<br />
One of the problems I’ve seen is that people treat<br />
<str<strong>on</strong>g>Bollinger</str<strong>on</strong>g> Bands in the simplest way possible. They automatically<br />
think a tag of the upper band is a sell and a tag of<br />
the lower band is a buy. Nothing could be further from the<br />
truth. Some tags of the upper and lower bands are sells and<br />
buys, respectively, but not all tags are acti<strong>on</strong> points. Price<br />
can, and does, walk up the upper band or walk down the<br />
lower band, and often when this happens you get some of<br />
the most profitable trades.<br />
With rare excepti<strong>on</strong>s, it’s not enough to use <str<strong>on</strong>g>Bollinger</str<strong>on</strong>g><br />
Bands al<strong>on</strong>e. You have to combine them with something<br />
else that tells you about sustainability. For me, that something<br />
else is volume indicators.<br />
CT: Just indicators? Do you ever look at raw volume numbers?<br />
JB: Both can work. Some people are able to look at volume,<br />
relate it to the price bars and intuitively understand the<br />
supply-demand relati<strong>on</strong>ship. Other people need to parse<br />
volume into an indicator to clarify the picture.<br />
Older traders who grew up keeping charts by hand<br />
would probably be more comfortable with raw volume<br />
numbers. Traders who grew up with technology that could<br />
easily calculate and plot complex indicators will likely be<br />
happier with volume indicators. [It helps to] use a volume<br />
“clip” — normalized volume, or at least a moving average<br />
of volume so you have some idea of whether volume is high<br />
or low <strong>on</strong> a relative basis.<br />
CT: Can’t volume be misleading, though? High volume can<br />
accompany reversal points or support trends, but it seems<br />
as if many volume-watching traders c<strong>on</strong>veniently overlook<br />
the frequent occasi<strong>on</strong>s when volume gives “classic” signals<br />
and price does the opposite of what it’s supposed to. And<br />
you can also find plenty of turning points where volume<br />
c<strong>on</strong>tinued <strong>on</strong> p. 38<br />
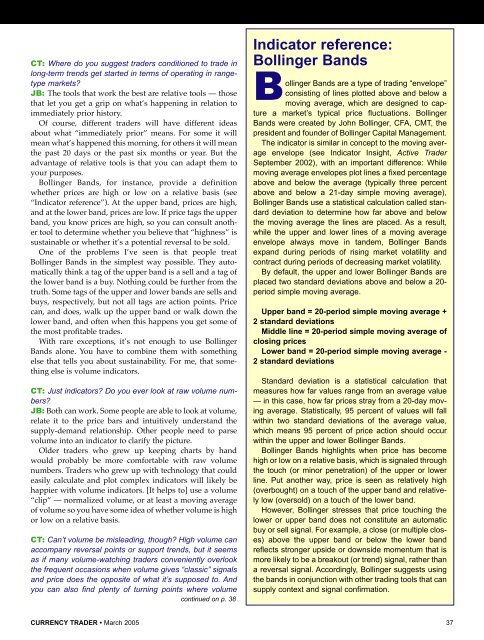
Indicator reference:<br />
<str<strong>on</strong>g>Bollinger</str<strong>on</strong>g> Bands<br />
<str<strong>on</strong>g>Bollinger</str<strong>on</strong>g> Bands are a type of trading “envelope”<br />
c<strong>on</strong>sisting of lines plotted above and below a<br />
moving average, which are designed to capture<br />
a market’s typical price fluctuati<strong>on</strong>s. <str<strong>on</strong>g>Bollinger</str<strong>on</strong>g><br />
Bands were created by <str<strong>on</strong>g>John</str<strong>on</strong>g> <str<strong>on</strong>g>Bollinger</str<strong>on</strong>g>, CFA, CMT, the<br />
president and founder of <str<strong>on</strong>g>Bollinger</str<strong>on</strong>g> Capital Management.<br />
The indicator is similar in c<strong>on</strong>cept to the moving average<br />
envelope (see Indicator Insight, Active Trader<br />
September 2002), with an important difference: While<br />
moving average envelopes plot lines a fixed percentage<br />
above and below the average (typically three percent<br />
above and below a 21-day simple moving average),<br />
<str<strong>on</strong>g>Bollinger</str<strong>on</strong>g> Bands use a statistical calculati<strong>on</strong> called standard<br />
deviati<strong>on</strong> to determine how far above and below<br />
the moving average the lines are placed. As a result,<br />
while the upper and lower lines of a moving average<br />
envelope always move in tandem, <str<strong>on</strong>g>Bollinger</str<strong>on</strong>g> Bands<br />
expand during periods of rising market volatility and<br />
c<strong>on</strong>tract during periods of decreasing market volatility.<br />
By default, the upper and lower <str<strong>on</strong>g>Bollinger</str<strong>on</strong>g> Bands are<br />
placed two standard deviati<strong>on</strong>s above and below a 20-<br />
period simple moving average.<br />
Upper band = 20-period simple moving average +<br />
2 standard deviati<strong>on</strong>s<br />
Middle line = 20-period simple moving average of<br />
closing prices<br />
Lower band = 20-period simple moving average -<br />
2 standard deviati<strong>on</strong>s<br />
Standard deviati<strong>on</strong> is a statistical calculati<strong>on</strong> that<br />
measures how far values range from an average value<br />
— in this case, how far prices stray from a 20-day moving<br />
average. Statistically, 95 percent of values will fall<br />
within two standard deviati<strong>on</strong>s of the average value,<br />
which means 95 percent of price acti<strong>on</strong> should occur<br />
within the upper and lower <str<strong>on</strong>g>Bollinger</str<strong>on</strong>g> Bands.<br />
<str<strong>on</strong>g>Bollinger</str<strong>on</strong>g> Bands highlights when price has become<br />
high or low <strong>on</strong> a relative basis, which is signaled through<br />
the touch (or minor pe<strong>net</strong>rati<strong>on</strong>) of the upper or lower<br />
line. Put another way, price is seen as relatively high<br />
(overbought) <strong>on</strong> a touch of the upper band and relatively<br />
low (oversold) <strong>on</strong> a touch of the lower band.<br />
However, <str<strong>on</strong>g>Bollinger</str<strong>on</strong>g> stresses that price touching the<br />
lower or upper band does not c<strong>on</strong>stitute an automatic<br />
buy or sell signal. For example, a close (or multiple closes)<br />
above the upper band or below the lower band<br />
reflects str<strong>on</strong>ger upside or downside momentum that is<br />
more likely to be a breakout (or trend) signal, rather than<br />
a reversal signal. Accordingly, <str<strong>on</strong>g>Bollinger</str<strong>on</strong>g> suggests using<br />
the bands in c<strong>on</strong>juncti<strong>on</strong> with other trading tools that can<br />
supply c<strong>on</strong>text and signal c<strong>on</strong>firmati<strong>on</strong>.<br />
CURRENCY TRADER • March 2005 37