John Bollinger on consolidations - Sonic.net
John Bollinger on consolidations - Sonic.net
John Bollinger on consolidations - Sonic.net

Create successful ePaper yourself
Turn your PDF publications into a flip-book with our unique Google optimized e-Paper software.
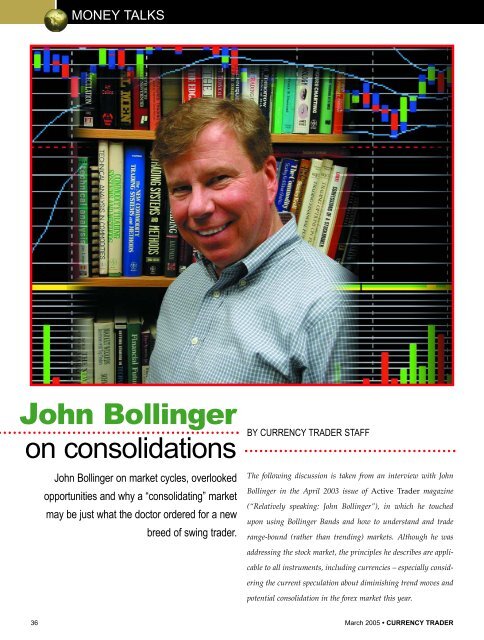
MONEY TALKS<br />
<str<strong>on</strong>g>John</str<strong>on</strong>g> <str<strong>on</strong>g>Bollinger</str<strong>on</strong>g><br />
<strong>on</strong> c<strong>on</strong>solidati<strong>on</strong>s<br />
<str<strong>on</strong>g>John</str<strong>on</strong>g> <str<strong>on</strong>g>Bollinger</str<strong>on</strong>g> <strong>on</strong> market cycles, overlooked<br />
opportunities and why a “c<strong>on</strong>solidating” market<br />
may be just what the doctor ordered for a new<br />
breed of swing trader.<br />
BY CURRENCY TRADER STAFF<br />
The following discussi<strong>on</strong> is taken from an interview with <str<strong>on</strong>g>John</str<strong>on</strong>g><br />
<str<strong>on</strong>g>Bollinger</str<strong>on</strong>g> in the April 2003 issue of Active Trader magazine<br />
(“Relatively speaking: <str<strong>on</strong>g>John</str<strong>on</strong>g> <str<strong>on</strong>g>Bollinger</str<strong>on</strong>g>”), in which he touched<br />
up<strong>on</strong> using <str<strong>on</strong>g>Bollinger</str<strong>on</strong>g> Bands and how to understand and trade<br />
range-bound (rather than trending) markets. Although he was<br />
addressing the stock market, the principles he describes are applicable<br />
to all instruments, including currencies – especially c<strong>on</strong>sidering<br />
the current speculati<strong>on</strong> about diminishing trend moves and<br />
potential c<strong>on</strong>solidati<strong>on</strong> in the forex market this year.<br />
36 March 2005 • CURRENCY TRADER
CT: Where do you suggest traders c<strong>on</strong>diti<strong>on</strong>ed to trade in<br />
l<strong>on</strong>g-term trends get started in terms of operating in rangetype<br />
markets?<br />
JB: The tools that work the best are relative tools — those<br />
that let you get a grip <strong>on</strong> what’s happening in relati<strong>on</strong> to<br />
immediately prior history.<br />
Of course, different traders will have different ideas<br />
about what “immediately prior” means. For some it will<br />
mean what’s happened this morning, for others it will mean<br />
the past 20 days or the past six m<strong>on</strong>ths or year. But the<br />
advantage of relative tools is that you can adapt them to<br />
your purposes.<br />
<str<strong>on</strong>g>Bollinger</str<strong>on</strong>g> Bands, for instance, provide a definiti<strong>on</strong><br />
whether prices are high or low <strong>on</strong> a relative basis (see<br />
“Indicator reference”). At the upper band, prices are high,<br />
and at the lower band, prices are low. If price tags the upper<br />
band, you know prices are high, so you can c<strong>on</strong>sult another<br />
tool to determine whether you believe that “highness” is<br />
sustainable or whether it’s a potential reversal to be sold.<br />
One of the problems I’ve seen is that people treat<br />
<str<strong>on</strong>g>Bollinger</str<strong>on</strong>g> Bands in the simplest way possible. They automatically<br />
think a tag of the upper band is a sell and a tag of<br />
the lower band is a buy. Nothing could be further from the<br />
truth. Some tags of the upper and lower bands are sells and<br />
buys, respectively, but not all tags are acti<strong>on</strong> points. Price<br />
can, and does, walk up the upper band or walk down the<br />
lower band, and often when this happens you get some of<br />
the most profitable trades.<br />
With rare excepti<strong>on</strong>s, it’s not enough to use <str<strong>on</strong>g>Bollinger</str<strong>on</strong>g><br />
Bands al<strong>on</strong>e. You have to combine them with something<br />
else that tells you about sustainability. For me, that something<br />
else is volume indicators.<br />
CT: Just indicators? Do you ever look at raw volume numbers?<br />
JB: Both can work. Some people are able to look at volume,<br />
relate it to the price bars and intuitively understand the<br />
supply-demand relati<strong>on</strong>ship. Other people need to parse<br />
volume into an indicator to clarify the picture.<br />
Older traders who grew up keeping charts by hand<br />
would probably be more comfortable with raw volume<br />
numbers. Traders who grew up with technology that could<br />
easily calculate and plot complex indicators will likely be<br />
happier with volume indicators. [It helps to] use a volume<br />
“clip” — normalized volume, or at least a moving average<br />
of volume so you have some idea of whether volume is high<br />
or low <strong>on</strong> a relative basis.<br />
CT: Can’t volume be misleading, though? High volume can<br />
accompany reversal points or support trends, but it seems<br />
as if many volume-watching traders c<strong>on</strong>veniently overlook<br />
the frequent occasi<strong>on</strong>s when volume gives “classic” signals<br />
and price does the opposite of what it’s supposed to. And<br />
you can also find plenty of turning points where volume<br />
c<strong>on</strong>tinued <strong>on</strong> p. 38<br />
Indicator reference:<br />
<str<strong>on</strong>g>Bollinger</str<strong>on</strong>g> Bands<br />
<str<strong>on</strong>g>Bollinger</str<strong>on</strong>g> Bands are a type of trading “envelope”<br />
c<strong>on</strong>sisting of lines plotted above and below a<br />
moving average, which are designed to capture<br />
a market’s typical price fluctuati<strong>on</strong>s. <str<strong>on</strong>g>Bollinger</str<strong>on</strong>g><br />
Bands were created by <str<strong>on</strong>g>John</str<strong>on</strong>g> <str<strong>on</strong>g>Bollinger</str<strong>on</strong>g>, CFA, CMT, the<br />
president and founder of <str<strong>on</strong>g>Bollinger</str<strong>on</strong>g> Capital Management.<br />
The indicator is similar in c<strong>on</strong>cept to the moving average<br />
envelope (see Indicator Insight, Active Trader<br />
September 2002), with an important difference: While<br />
moving average envelopes plot lines a fixed percentage<br />
above and below the average (typically three percent<br />
above and below a 21-day simple moving average),<br />
<str<strong>on</strong>g>Bollinger</str<strong>on</strong>g> Bands use a statistical calculati<strong>on</strong> called standard<br />
deviati<strong>on</strong> to determine how far above and below<br />
the moving average the lines are placed. As a result,<br />
while the upper and lower lines of a moving average<br />
envelope always move in tandem, <str<strong>on</strong>g>Bollinger</str<strong>on</strong>g> Bands<br />
expand during periods of rising market volatility and<br />
c<strong>on</strong>tract during periods of decreasing market volatility.<br />
By default, the upper and lower <str<strong>on</strong>g>Bollinger</str<strong>on</strong>g> Bands are<br />
placed two standard deviati<strong>on</strong>s above and below a 20-<br />
period simple moving average.<br />
Upper band = 20-period simple moving average +<br />
2 standard deviati<strong>on</strong>s<br />
Middle line = 20-period simple moving average of<br />
closing prices<br />
Lower band = 20-period simple moving average -<br />
2 standard deviati<strong>on</strong>s<br />
Standard deviati<strong>on</strong> is a statistical calculati<strong>on</strong> that<br />
measures how far values range from an average value<br />
— in this case, how far prices stray from a 20-day moving<br />
average. Statistically, 95 percent of values will fall<br />
within two standard deviati<strong>on</strong>s of the average value,<br />
which means 95 percent of price acti<strong>on</strong> should occur<br />
within the upper and lower <str<strong>on</strong>g>Bollinger</str<strong>on</strong>g> Bands.<br />
<str<strong>on</strong>g>Bollinger</str<strong>on</strong>g> Bands highlights when price has become<br />
high or low <strong>on</strong> a relative basis, which is signaled through<br />
the touch (or minor pe<strong>net</strong>rati<strong>on</strong>) of the upper or lower<br />
line. Put another way, price is seen as relatively high<br />
(overbought) <strong>on</strong> a touch of the upper band and relatively<br />
low (oversold) <strong>on</strong> a touch of the lower band.<br />
However, <str<strong>on</strong>g>Bollinger</str<strong>on</strong>g> stresses that price touching the<br />
lower or upper band does not c<strong>on</strong>stitute an automatic<br />
buy or sell signal. For example, a close (or multiple closes)<br />
above the upper band or below the lower band<br />
reflects str<strong>on</strong>ger upside or downside momentum that is<br />
more likely to be a breakout (or trend) signal, rather than<br />
a reversal signal. Accordingly, <str<strong>on</strong>g>Bollinger</str<strong>on</strong>g> suggests using<br />
the bands in c<strong>on</strong>juncti<strong>on</strong> with other trading tools that can<br />
supply c<strong>on</strong>text and signal c<strong>on</strong>firmati<strong>on</strong>.<br />
CURRENCY TRADER • March 2005 37
MONEY TALKS c<strong>on</strong>tinued<br />
wasn’t unusual <strong>on</strong>e way or the other.<br />
JB: Well, first of all, I’m working with the relative definiti<strong>on</strong><br />
of high and low price levels, so that lets me know when<br />
to c<strong>on</strong>sult volume.<br />
For example, if price has just tagged the upper band, I<br />
know this is a point to see if volume is adding anything to<br />
the picture. I d<strong>on</strong>’t scan volume c<strong>on</strong>tinuously, trying to<br />
make an <strong>on</strong>going stream of decisi<strong>on</strong>s based <strong>on</strong> the relati<strong>on</strong>ship<br />
between it and price. I <strong>on</strong>ly look at critical junctures.<br />
What I’ve found, in this regard, is that it pays to wait. In<br />
other words, after I get a buy or sell signal, I wait for price<br />
FIGURE 1 — BOLLINGER BANDS: USD/JPY<br />
Notice the many touches and minor pe<strong>net</strong>rati<strong>on</strong>s of the lower band during the<br />
October-November downtrend; price never approaches the upper band during<br />
this period an <strong>on</strong>ly pe<strong>net</strong>rates the moving average (middle line) <strong>on</strong>ce. The<br />
December-January trading range is characterized by much more even swings<br />
between the two bands. Finally, notice the c<strong>on</strong>tracti<strong>on</strong> of the bands during the<br />
low-volatility September c<strong>on</strong>solidati<strong>on</strong> vs. the expansi<strong>on</strong> of the bands as volatility<br />
increases in October.<br />
U.S. dollar/Japanese yen (USD/JPY), daily<br />
Sept. Oct. Nov. Dec. 2005 Feb.<br />
Source: TradeStati<strong>on</strong><br />
acti<strong>on</strong> to c<strong>on</strong>firm that signal. If price tags the upper band<br />
and a volume indicator — say, 20-day <strong>on</strong> balance volume<br />
(OBV) — is in negative territory, you can treat that as a<br />
warning or alert because the combinati<strong>on</strong> suggests this is a<br />
potentially unsustainable situati<strong>on</strong>. Then, if there’s evidence<br />
of a decline, you can act, because you know a proper<br />
setup was in place.<br />
The other thing you have going for you in this kind of<br />
trade situati<strong>on</strong> is knowing whether there’s a good riskreward<br />
relati<strong>on</strong>ship. If price tags the upper band and turns<br />
down, you can place a stop just above the entry point,<br />
knowing if price goes back up and violates the stop, your<br />
setup is broken. And that stop will be fairly close by, so the<br />
amount you’re risking is relatively small, whereas the<br />
immediate target for the move is for price to get back to the<br />
lower band, which is much farther away.<br />
CT: What kind of risk-reward numbers do you operate with?<br />
JB: Here’s <strong>on</strong>e way to look at it: There are <strong>on</strong>ly two ways<br />
to improve your trading performance. First, you can<br />
increase your number of winning trades vs. losing trades. If<br />
you’re batting around .500, you can try to add different timing<br />
informati<strong>on</strong> and indicators, and so <strong>on</strong>, and maybe get<br />
your batting average up to around .600 or .650. I think<br />
you’re doing pretty well if you have 65<br />
percent winners.<br />
112<br />
111<br />
110<br />
109<br />
108<br />
107<br />
106<br />
105<br />
104<br />
103<br />
Sec<strong>on</strong>d, you can increase the size of<br />
your winners vs. the size of your losers.<br />
Say your winners are twice the<br />
size of your losers — that’s pretty<br />
good. If you get up to three times the<br />
size, I think you’ll find the mathematics<br />
work very much in your favor. If<br />
you have 60 to 65 percent winning<br />
trades and your winners are two to<br />
three times the size of your losers,<br />
you’ll find you’re making m<strong>on</strong>ey pretty<br />
quickly.<br />
By using this relative trading<br />
approach, you can address both those<br />
risk-reward dimensi<strong>on</strong>s. You address<br />
the size of the winners vs. losers by<br />
having entry points with logical [stop]<br />
points nearby that let you know your<br />
trade was wr<strong>on</strong>g. You address the<br />
number of winners by finding the<br />
right volume indicators to assess the<br />
type of trade and the vehicles you’re<br />
using.<br />
102<br />
CT: What about a trend comp<strong>on</strong>ent<br />
that’s independent from what you’re<br />
discussing now — independent in that<br />
it would probably be <strong>on</strong> a l<strong>on</strong>ger time<br />
frame?<br />
JB: I think the idea of biasing your trading in the directi<strong>on</strong><br />
of the greatest probability of success is very important. In a<br />
sideways market, you’ll get fairly important intermediateterm<br />
buy signals near the bottom of the range and sell signals<br />
near the top. Those should absolutely dictate the directi<strong>on</strong><br />
of your trading. Clearly, if you can bias your trading in<br />
favor of the intermediate swing directi<strong>on</strong> of the market,<br />
you’ll go a l<strong>on</strong>g way toward improving the two key comp<strong>on</strong>ents<br />
of success.<br />
In terms of time frame, if you’re using <str<strong>on</strong>g>Bollinger</str<strong>on</strong>g> Bands,<br />
for example, rather than trying to adjust the time frame by<br />
changing the periods and width of the bands — 20 and 2<br />
seem to work very well for most applicati<strong>on</strong>s and are cer-<br />
38 March 2005 • CURRENCY TRADER
FIGURE 2 — BOLLINGER BANDS: INTRADAY PERSPECTIVE<br />
tainly a good place to start — try using<br />
a different bar length. If you’re using<br />
daily bars and you want a shorter-term<br />
view, you might switch to hourly bars.<br />
If you want a l<strong>on</strong>ger-term view, try<br />
switching to weekly bars. That’s a<br />
good way to get an idea of what’s happening<br />
in different time frames.<br />
This 180-minute chart actually shares many characteristics with the daily chart<br />
in Figure 1, including the transiti<strong>on</strong> from a trend period (which is preceded by a<br />
notable c<strong>on</strong>tracti<strong>on</strong> in the bands) to a trading range.<br />
Euro/U.S. dollar (EUR/USD), 180-minute<br />
.<br />
1.36<br />
1.35<br />
CT: Working <strong>on</strong> the assumpti<strong>on</strong> that a<br />
market may be in a c<strong>on</strong>solidati<strong>on</strong> envir<strong>on</strong>ment<br />
for an extended period, what<br />
time frame would you begin your<br />
analysis <strong>on</strong>?<br />
JB: It depends <strong>on</strong> what you’re trying<br />
to do. If you’re trying to get a handle<br />
<strong>on</strong> the market’s intermediate-term<br />
activity as background informati<strong>on</strong>, I<br />
think you can estimate the swings will<br />
be three to six m<strong>on</strong>ths at a minimum<br />
and six m<strong>on</strong>ths to a year maximum —<br />
that’s a typical pattern that’s occurred Source: TradeStati<strong>on</strong><br />
in the past. Weekly bars seem to be the<br />
appropriate way to visualize that informati<strong>on</strong>.<br />
When you get down to the shorter-term — actually executing<br />
trades in individual stocks or indices — I recommend<br />
daily bars. That’s my bias. I’ve looked at charts for<br />
years and I’m comfortable in that time frame. For even<br />
shorter-term trades, hourly bars are quite useful.<br />
There’s obviously that subset of traders who are going to<br />
trade within much tighter parameters — people who are<br />
using five-minute bars and tick charts. But the c<strong>on</strong>cepts<br />
really remain the same, regardless of the time frame: knowing<br />
what’s happening <strong>on</strong> the l<strong>on</strong>ger-term time frame so you<br />
can correctly bias your operati<strong>on</strong>s in the shorter time frame.<br />
If you get a nice entry signal for a l<strong>on</strong>g trade and the market<br />
is in an upswing, you probably want to take that a little<br />
more seriously than you would a nice entry signal for a<br />
short. The principles we’re talking about are fractal in<br />
nature — they exhibit the same kinds of patterns and characteristics<br />
at different levels of magnificati<strong>on</strong>, whether it’s<br />
10 minutes and hourly, hourly and daily or daily and weekly.<br />
The same types of setups and trading patterns are evident.<br />
CT: It’s surprising how many people d<strong>on</strong>’t buy into that,<br />
because it seems pretty apparent if you just look at charts<br />
for a while.<br />
JB: I remember there was a fellow by the name of Sam<br />
Kachigan who designed a trading system called the Lennox<br />
system. One of the basic elements of the system was that<br />
trades had to be c<strong>on</strong>firmed in three time frames. There was<br />
the l<strong>on</strong>g-term setup, then you looked for a similar setup <strong>on</strong><br />
the intermediate time frame and, finally, the same thing <strong>on</strong><br />
the shorter time frame, which is where you executed the<br />
12/29 12/30 1/2 1/4 1/6 1/9 1/11 1/13 1/14 1/18 1/19 1/21 1/25 1/26 1/28<br />
trade. It’s the same old idea — having all the parts and<br />
pieces pulling in the same directi<strong>on</strong>.<br />
Related reading<br />
“<str<strong>on</strong>g>John</str<strong>on</strong>g> <str<strong>on</strong>g>Bollinger</str<strong>on</strong>g>: Focus <strong>on</strong> the markets”<br />
(Active Trader, January-February 2001).<br />
<str<strong>on</strong>g>John</str<strong>on</strong>g> <str<strong>on</strong>g>Bollinger</str<strong>on</strong>g> talks about developing <str<strong>on</strong>g>Bollinger</str<strong>on</strong>g> Bands<br />
and what his career has taught him about markets<br />
and traders.<br />
“Relatively speaking: <str<strong>on</strong>g>John</str<strong>on</strong>g> <str<strong>on</strong>g>Bollinger</str<strong>on</strong>g>”<br />
(Active Trader, April 2003).<br />
In this interview, <str<strong>on</strong>g>Bollinger</str<strong>on</strong>g> discusses market cycles,<br />
trading c<strong>on</strong>solidati<strong>on</strong>s rather than trends, and other<br />
topics.<br />
“Volume indicators revisited” by <str<strong>on</strong>g>John</str<strong>on</strong>g> <str<strong>on</strong>g>Bollinger</str<strong>on</strong>g><br />
(Active Trader, March 2002).<br />
<str<strong>on</strong>g>John</str<strong>on</strong>g> <str<strong>on</strong>g>Bollinger</str<strong>on</strong>g> reviews the origins of volume indicators<br />
and explains how traders can benefit from<br />
understanding these tools.<br />
“Indicator Insight: <str<strong>on</strong>g>Bollinger</str<strong>on</strong>g> Bands”<br />
(Active Trader, July 2003).<br />
A primer for understanding and using <str<strong>on</strong>g>Bollinger</str<strong>on</strong>g> Bands.<br />
You can purchase and download past Active Trader<br />
articles at www.activetradermag.com/purchase_articles.htm<br />
1.34<br />
1.33<br />
1.32<br />
1.31<br />
1.30<br />
CURRENCY TRADER • March 2005 39