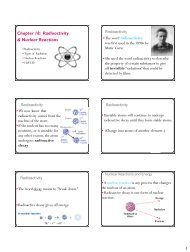
Acid & Base pH Lab
Acid & Base pH Lab
Acid & Base pH Lab

You also want an ePaper? Increase the reach of your titles
YUMPU automatically turns print PDFs into web optimized ePapers that Google loves.
<strong>Acid</strong> & <strong>Base</strong> <strong>pH</strong> <strong>Lab</strong><br />
Name(s) _______________________________________<br />
Date ___________________________ Period _________<br />
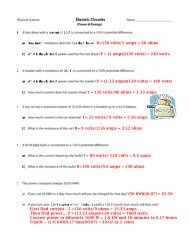
Which household solutions are acids and which are bases?<br />
Measuring <strong>pH</strong> indicates whether a solution is an acid or a base. A <strong>pH</strong> less than 7 indicates an acid and<br />
the lower the <strong>pH</strong>, the stronger the concentration of the acid. A <strong>pH</strong> more than 7 indicates a base and the<br />
higher the <strong>pH</strong>, the stronger the concentration of the base. If a solution's <strong>pH</strong> is 7, it is neutral which means<br />
it is neither an acid nor a base.<br />
Try the experiment below and discover the <strong>pH</strong> of solutions of many common household<br />
items.<br />
Collect these materials:<br />
12 containers each containing an unknown solution<br />
6 strips of <strong>pH</strong> indicator paper (tear each strip in half for a total of 12 pieces)<br />
<strong>pH</strong> color scale (share amongst the class)<br />
<strong>Lab</strong> sheet with data table (on back or next sheet)<br />
Be sure to wear your goggles at all times!<br />
DO NOT TASTE ANY OF THE SOLUTIONS!<br />
DO NOT Smell any of the solutions!<br />
Procedure: Determine whether a solution is an acid or a base and rank the relative strength<br />
of the solutions according to <strong>pH</strong>?<br />
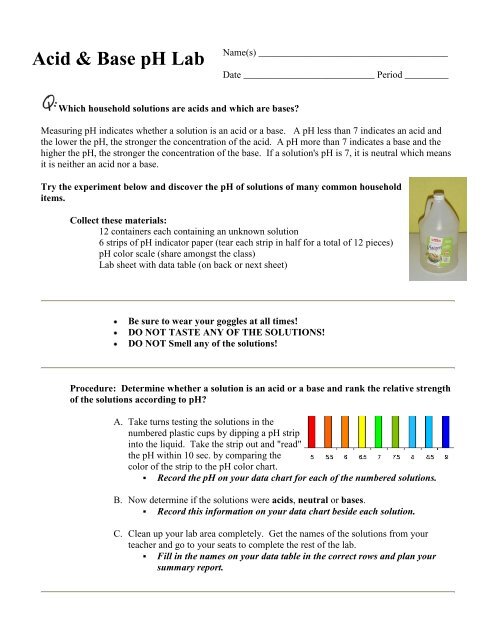
A. Take turns testing the solutions in the<br />
numbered plastic cups by dipping a <strong>pH</strong> strip<br />
into the liquid. Take the strip out and "read"<br />
the <strong>pH</strong> within 10 sec. by comparing the<br />
color of the strip to the <strong>pH</strong> color chart.<br />
• Record the <strong>pH</strong> on your data chart for each of the numbered solutions.<br />
B. Now determine if the solutions were acids, neutral or bases.<br />
• Record this information on your data chart beside each solution.<br />
C. Clean up your lab area completely. Get the names of the solutions from your<br />
teacher and go to your seats to complete the rest of the lab.<br />
• Fill in the names on your data table in the correct rows and plan your<br />
summary report.
<strong>Acid</strong> & <strong>Base</strong> <strong>pH</strong> <strong>Lab</strong><br />
Name(s) _______________________________________<br />
Date ___________________________ Period _________<br />
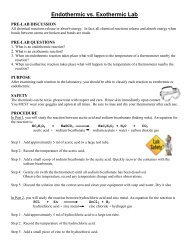
Data Table:<br />
Solution # <strong>pH</strong> # from test <strong>Acid</strong> or <strong>Base</strong>? Solution Name (from teacher after lab)<br />
#1<br />
#2<br />
#3<br />
#4<br />
#5<br />
#6<br />
#7<br />
#8<br />
#9<br />
#10<br />
#11 (Your Choice from home.)<br />
#12 (Your Choice from home.)<br />
Summary Report: Create a continuum (similar to a time line) on adding machine paper with the<br />
solution substances listed along it in order of their <strong>pH</strong>. Show the <strong>pH</strong> and label the continuum to<br />
show where acids, bases, and neutral occur along with descriptive phrases. Your continuum<br />
should include pictures or drawings of each substance with a label. You continuum will be graded<br />
on accuracy, neatness, and creativity.