
You also want an ePaper? Increase the reach of your titles
YUMPU automatically turns print PDFs into web optimized ePapers that Google loves.
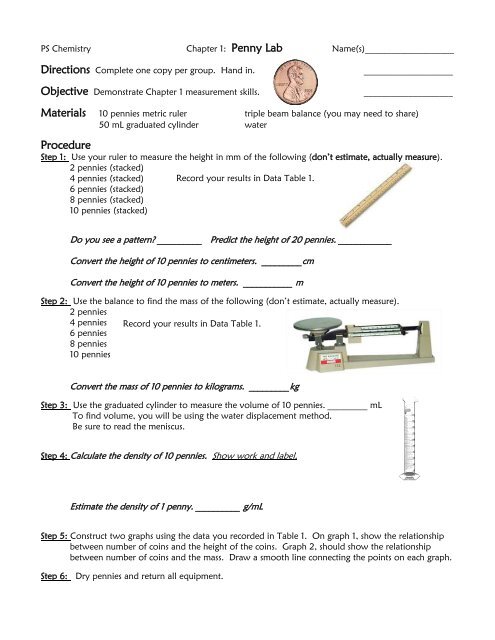
PS Chemistry Chapter 1: <strong>Penny</strong> <strong>Lab</strong> Name(s)____________________<br />
Directions Complete one copy per group. Hand in.<br />
Objective Demonstrate Chapter 1 measurement skills.<br />
____________________<br />
____________________<br />
Materials 10 pennies metric ruler triple beam balance (you may need to share)<br />
50 mL graduated cylinder water<br />
Procedure<br />
Step 1: Use your ruler to measure the height in mm of the following (don’t estimate, actually measure).<br />
2 pennies (stacked)<br />
4 pennies (stacked) Record your results in Data Table 1.<br />
6 pennies (stacked)<br />
8 pennies (stacked)<br />
10 pennies (stacked)<br />
Do you see a pattern? __________ Predict the height of 20 pennies. ____________<br />
Convert the height of 10 pennies to centimeters. _________cm<br />
Convert the height of 10 pennies to meters. ___________ m<br />
Step 2: Use the balance to find the mass of the following (don’t estimate, actually measure).<br />
2 pennies<br />
4 pennies Record your results in Data Table 1.<br />
6 pennies<br />
8 pennies<br />
10 pennies<br />
Convert the mass of 10 pennies to kilograms. _________kg<br />
Step 3: Use the graduated cylinder to measure the volume of 10 pennies. _________ mL<br />
To find volume, you will be using the water displacement method.<br />
Be sure to read the meniscus.<br />
Step 4: Calculate the density of 10 pennies. Show work and label.<br />
Estimate the density of 1 penny. __________ g/mL<br />
Step 5: Construct two graphs using the data you recorded in Table 1. On graph 1, show the relationship<br />
between number of coins and the height of the coins. Graph 2, should show the relationship<br />
between number of coins and the mass. Draw a smooth line connecting the points on each graph.<br />
Step 6: Dry pennies and return all equipment.
Data Table 1<br />
Number of<br />
Pennies<br />
2<br />
4<br />
6<br />
8<br />
10<br />
Height<br />
(mm)<br />
Mass<br />
(grams)<br />
Graph 1 Title: ______________<br />
Graph 2 Title: ______________<br />
Questions and Conclusions<br />
1. Using your data collected in the lab, estimate the height and mass of a roll of pennies.<br />
(A roll is 50 pennies.)<br />
2. Describe the appearance of the line in each graph.<br />
3. Does your data show a difference in the mass of different coins? Explain.<br />
4. Does your data show a difference in height of different coins? Explain.<br />
5. What is the meniscus? Why is important to read the meniscus?<br />
6. How might the data from this investigation have real importance for a bank teller?