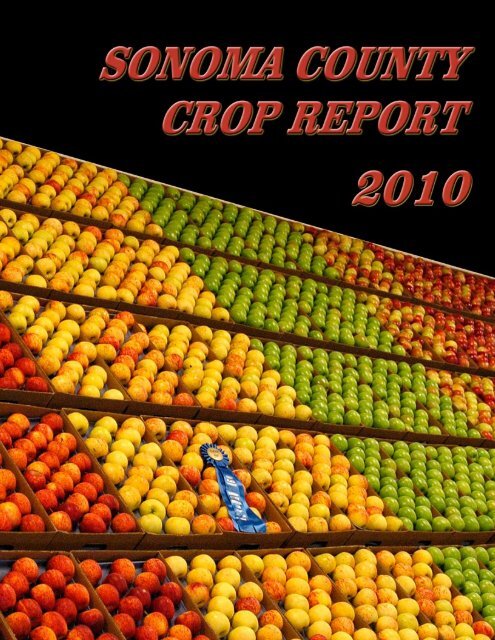
Sonoma County Crop Report 2010
Sonoma County Crop Report 2010
Sonoma County Crop Report 2010

Create successful ePaper yourself
Turn your PDF publications into a flip-book with our unique Google optimized e-Paper software.
This Year’s <strong>Crop</strong> <strong>Report</strong> is Dedicated to<br />
Shirley Lee Walker<br />
1930 - <strong>2010</strong><br />
On Tuesday, November 16, <strong>2010</strong>, <strong>Sonoma</strong> <strong>County</strong> lost a pillar of our agricultural community. Shirley Walker was the<br />
matriarch of the Walker Apple family in Graton and spent her adult life growing, selling and promoting apples and<br />
the apple industry in <strong>Sonoma</strong> <strong>County</strong>. Shirley Lee Walker was born in Sebastopol and attended Analy high school.<br />
After graduating from high school she attended the Santa Rosa Junior College where she received an Associates<br />
degree in Business. Shirley married Lee Walker in 1953 after which they took residence at the family’s farm on Upp<br />
Road where they lived and raised a family. A town girl since birth, Shirley embraced the country lifestyle and devoted<br />
her life to the apple business. Shirley had deep roots in <strong>Sonoma</strong> <strong>County</strong>. Her mother’s family members were some<br />
of the first to plant apple orchards in Rincon Valley in 1852 and her father’s family settled in Healdsburg in 1850.<br />
Shirley was very active in the community and gave extensive amounts of free time to philanthropic endeavors.<br />
When she wasn’t on the farm, she spent her time doing work for her Philanthropic Educational Organization. This<br />
organization is devoted to the education and advancement of women through scholarships, grants, awards, and<br />
networking in an effort to help women achieve their highest aspirations. In addition to this organization Shirley<br />
played a key role in “The Apple Corps”, a group of apple farmers’ wives and friends who promoted the local<br />
apple industry. The Apple Corps built community ties through their marketing, publicity, and fund-raising efforts.<br />
Promotions included a cookbook comprised entirely of apple recipes. They would get together and make apple pies<br />
and breads, which they gave to produce buyers at all of the chain stores and local markets. Though Shirley was<br />
devoted to her community her real devotion was to her family. Her three children gave her immense pride and she<br />
would do anything to help them succeed. Her presence in the community and her work ethic are an inspiration to<br />
us all and she will be reverently missed by the apple industry and the agricultural community in <strong>Sonoma</strong> <strong>County</strong>.
OFFICE OF THE AGRICULTURAL COMMISSIONER<br />
Agricultural Commissioner 133 Aviation Blvdevard, Suite 110<br />
Sealer of Weights and Measures Santa Rosa, CA 95403-1077<br />
www.sonoma-county.org/agcomm (707) 565-2371 Fax (707) 565-3850<br />
Karen Ross, Secretary May 2011<br />
California Department of Food and Agriculture<br />
and<br />
The Honorable Board of Supervisors of <strong>Sonoma</strong> <strong>County</strong>:<br />
Efren Carrillo – Fifth District, Chairman<br />
Valerie Brown – First District<br />
David Rabbitt – Second District<br />
Shirlee Zane – Third District, Vice Chair<br />
Mike McGuire – Fourth District<br />
It is my privilege to present the <strong>2010</strong> <strong>Sonoma</strong> <strong>County</strong> <strong>Crop</strong> <strong>Report</strong> as prepared pursuant to Section<br />
2279 of the California Food and Agricultural Code. The reported value for <strong>2010</strong> was $593,821,700,<br />
which is a decrease of 8.6% from the 2009 value of $649,517,900. This report reflects the gross<br />
production values; not the net income or costs of production and marketing.<br />
The decrease in gross value for <strong>2010</strong> is attributed primarily to a 15% decrease in fruit and nut crop<br />
production value, of which wine grape production value fell by almost $70 million. Winegrape prices<br />
were down slightly from 2009 and many growers experienced some crop loss due to extremely hot<br />
weather late in the season combined with an unusually cool spring and summer. The apiary industry<br />
showed a decrease of 11.5% from 2009 due primarily to cool spring weather and fewer hives in<br />
production. Livestock and poultry saw a 10% increase with a value of approximately $57 million.<br />
Livestock and poultry products, such as eggs and milk, rebounded slightly from $91 million in 2009, to<br />
$98.6 million in <strong>2010</strong>. This is due to increases in the unit price for market and manufacturing milk. It<br />
was a good year for apple production as growers experienced better yields per acre representing a<br />
nearly 13% increase in the value of these crops. Vegetable production values increased very slightly by<br />
1.8% while nursery products decreased by almost 3% due to a slower economy.<br />
This year’s report focuses on our county’s apple industry, an indelible and nostalgic reminder of our<br />
county’s agricultural identity and heritage. We would like to celebrate our apple producers who continue<br />
to farm and market a diverse array of varieties with exceptional flavor. Our county’s food producers and<br />
consumers have expressed a very strong commitment to preserving the <strong>Sonoma</strong> <strong>County</strong> apple industry<br />
and ensuring its long term sustainability. One facet of this commitment is an increase in the<br />
infrastructure necessary to improve the production and sale of local food, and there is nothing more<br />
local than our apples.<br />
While this <strong>Crop</strong> <strong>Report</strong> features our apple industry, I would like to extend our gratitude and appreciation<br />
for all of our agricultural practitioners whose participation makes the production of this report possible.<br />
<strong>Sonoma</strong> <strong>County</strong> is a beautiful place and we are blessed to live in a community where people value the<br />
local bounty of this agrarian landscape; a place where people value and work towards the concept of<br />
sustainability. A special thanks goes out to the outstanding staff of the Agricultural Commissioner’s<br />
Office, particularly Andrew Smith, Dagny Thomas and Cree Morgan, for their efforts in the development<br />
of this report.<br />
Respectfully submitted,<br />
Lisa Correia<br />
Chief Deputy Agricultural Commissioner
Table of Contents<br />
Shirley Lee Walker Dedication...........................................................Inside Front Cover<br />
Letter To The Board of Supervisors ................................................................................1<br />
Apple Heritage in <strong>Sonoma</strong> <strong>County</strong> ..................................................................................3<br />
Million Dollar <strong>Crop</strong>s and Nursery Production..........................................................4<br />
Fruit and Nut Summary and World Winegrape Acreage ...........................................5<br />
Winegrape Production (Reds)............................................................................................6<br />
Winegrape Production (Whites)......................................................................................7<br />
Apple Production, Apiary Products, and Vegetables .................................................8<br />
Livestock and Poultry Summary......................................................................................9<br />
Field <strong>Crop</strong>s ...........................................................................................................................10<br />
Recapitulation ...................................................................................................................11<br />
Sustainable Agriculture <strong>Report</strong>...................................................................................12<br />
Vineyard and Orchard Site Development....................................................................13<br />
Commodity Exports...........................................................................................................14<br />
Timber Harvest, Equestrian Inventory, and Commercial Fish Landings .............15<br />
Agriculture Division Summary.......................................................................................16<br />
Weights and Measures Division Summary....................................................................17<br />
Winning Ag Day Essay.........................................................................................................18<br />
Department Staff................................................................................................................19<br />
2<br />
Cover photo: Warren A. Smith
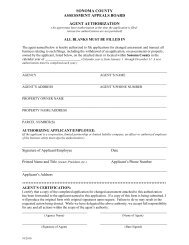
Apple Heritage - <strong>Sonoma</strong> <strong>County</strong><br />
“...groundbreaking contributions to the nation’s flavor landscape.” — Luther Burbank<br />
Over the course of our county’s history many agricultural crops have come and gone from our landscape,<br />
usually disappearing in response to changes in consumer preference, market pressure, and lower production<br />
costs elsewhere. One crop has been here since early times and still remains as an indelible and nostalgic<br />
reminder of our county’s agricultural identity and heritage; the apple. At one time apple orchards blanketed<br />
the county, encompassing more than 13,000 acres. Today apple orchards in <strong>Sonoma</strong> <strong>County</strong> occupy less<br />
than 3,000 acres. This decline is due primarily to outside market competition. Though the going is tough,<br />
the future of our beloved apple industry is ripe with opportunity for sustaining the industry, which we have<br />
celebrated through tradition for over 100 years.<br />
Luther Burbank was right in thinking that this is the chosen spot, at least as far as nature is concerned. However, water is a critical<br />
resource and this has been a primary hurdle in our apple industry’s ability to remain competitive relative to other apple-growing<br />
regions in the United States and abroad. <strong>Sonoma</strong> <strong>County</strong> apple orchards thrived in the early 1900s as immigrants moved to the<br />
county to start farms and raise families. At that time it was possible to earn a good living and raise a family on just 10 acres of<br />
apples. There was no shortage of markets as well. San Francisco was a booming city and apples left our county by the boat load<br />
via the Petaluma River.<br />
Historically <strong>Sonoma</strong> <strong>County</strong> had an advantage over other apple growing regions due to our earlier season. Our county’s apples<br />
were always the first on the market and as such garnered the best prices. Additionally, we had a tremendous infrastructure of<br />
packing sheds, dryers, and canneries with access to the large markets of the burgeoning San Francisco Bay Area. At one time<br />
Sebastopol had 25 warehouses packing fresh apples along the railroad tracks. Gravensteins are the most famous apples grown<br />
here in <strong>Sonoma</strong> <strong>County</strong> and are at the heart of our apple growing heritage. These apples were always the first to ripen and left<br />
<strong>Sonoma</strong> <strong>County</strong> on trains bound for the East Coast. They were also the primary source of apple sauce and dried apples used to<br />
feed US troops during World War II.<br />
Irrigation water in agriculture translates into higher yields and better prices as can be exemplified by the irrigated orchard systems<br />
in the central valley of California and the apple growing regions of Washington State where yields reach and exceed 30-40 tons<br />
per acre. By comparison, dry farmed apple orchards here in <strong>Sonoma</strong> <strong>County</strong> struggle to reach yields of 20 tons per acre with<br />
the average being closer to 12 tons per acre. Irrigation water increases profit margins by reducing the cost of production. These<br />
irrigated apple growing regions produce semi-dwarf trees, sometimes trellised, which are easier to prune, thin, and harvest. These<br />
orchards are planted to very high densities with 900-1200 trees per acre and provide a rapid return on investment by coming into<br />
full production much earlier. The culture of these orchard systems allows for the production of new varieties with better uniformity<br />
in color and size. Depending on the variety grown one can expect returns to be in the range of $500-$1,000 per ton of fruit. Here<br />
in <strong>Sonoma</strong> <strong>County</strong>, most of our apples are sold for processing and growers receive $60-$250 per ton. While our apple industry<br />
may not be able to compete with irrigated apple growing regions when it comes to price, we produce a superior product when it<br />
comes to flavor, diversity, locality, as well as a smaller ecological footprint in the production and transportation to markets here in<br />
<strong>Sonoma</strong> <strong>County</strong>.<br />
The Gravenstein apple has given <strong>Sonoma</strong> <strong>County</strong> world recognition, which we celebrate year after year. Its heritage is our heritage<br />
when it comes to apple production. Its sweet, tart flavor and crisp, juicy texture lend itself to a fresh eater, a sauce apple, a juicer<br />
and it has long been used in pies when freshly harvested. The Slow Food Foundation selected the Gravenstein apple as a heritage<br />
variety for its outstanding quality and taste in addition to its relative rarity of production. <strong>Sonoma</strong> <strong>County</strong> also produces a plethora<br />
of antique varieties that are available at local fruit stands and farms throughout the county during summer and fall. The dry<br />
farming and deficit irrigation production practices that helped build our apple industry in the early 1900s through the 60s created<br />
apples with more intense and distinct flavors. Just as the concept of appellations is applied to the production of wine grapes, this<br />
concept is also applicable to the production of other fruits. The climate and soils of <strong>Sonoma</strong> <strong>County</strong> are excellent for producing<br />
apples. Our foggy mornings give us great air moisture and our cool summer days allow for some natural russeting which builds<br />
flavors in these “real” apples, setting them apart from the stored, controlled atmosphere, perfect looking imported fruit we have<br />
become accustomed to throughout the Winter and Spring months of the year. Agri-tourism has most recently focused on the wine<br />
industry yet historically it was all about the apples. U-pick operations on farms, packing shed visits, farm tours and apple festivals<br />
were common destinations for visitors to the county. Though these types of tours have been essentially replaced by wine tours,<br />
this is a very obvious next step in securing the future of our apple industry. There is incredible potential here in this county for<br />
the pairing of wine tours with apple packer and farm tours. Our county’s food producers and consumers have expressed a very<br />
strong commitment to preserving the <strong>Sonoma</strong> <strong>County</strong> food system and ensuring its sustainability into the foreseeable future. One<br />
facet of this commitment is an increase in the infrastructure necessary to improve the production and sale of local food, and there<br />
is nothing more local than our apples.<br />
3
Million Dollar <strong>Crop</strong>s and Nursery Production<br />
Million Dollar <strong>Crop</strong>s<br />
1 Winegrapes ~ All 390,448,300<br />
2 Market Milk 77,679,100<br />
3 Miscellaneous Poultry 43,293,300<br />
4 Misc. Livestock and Poultry Products 20,799,800<br />
5 Cattle and Calves 11,649,200<br />
6 Nursery ~ Ornamentals 10,853,100<br />
7 Vegetables 8,212,200<br />
8 Misc. Nursery Products 4,856,400<br />
9 Nursery ~ Bedding Plants 4,184,000<br />
10 Apples ~Late Varieties 4,169,300<br />
11 Nursery ~ Cut Flowers 2,792,100<br />
12 Sheep and Lambs 2,518,300<br />
13 Apples ~ Gravenstein 1,692,300<br />
14 Oat Silage 1,517,200<br />
15 Oat Hay 1,025,000<br />
Nursery Production<br />
Product Year Quantity Unit Total<br />
Ornamentals<br />
<strong>2010</strong> 1,198,169 plant $ 10,853,100<br />
2009 1,220,147 plant $ 10,214,900<br />
Bedding Plants<br />
<strong>2010</strong> 263,005 flat $ 4,184,000<br />
2009 258,693 flat $ 4,697,000<br />
Christmas Trees<br />
<strong>2010</strong> 6,919 each $ 297,700<br />
2009 7,953 each $ 334,500<br />
Cut Flowers<br />
<strong>2010</strong> $ 2,792,100<br />
2009 $ 2,360,000<br />
Miscellaneous <strong>2010</strong> $ 4,856,400<br />
(a)<br />
Products<br />
2009 $ 6,037,800<br />
TOTAL VALUE<br />
<strong>2010</strong><br />
$ 22,983,300<br />
2009<br />
$ 23,644,200<br />
(a) includes grapevines, deciduous fruit and nut trees, liners, bulbs, forest seedlings, house plants, orchids, herbaceous<br />
perennials, dry flowers, turf, and wreaths<br />
4
Fruit and Nut Summary and World Winegrape Acreage<br />
Fruit and Nut Summary<br />
Bearing Tons/ Total<br />
<strong>Crop</strong> Year Acres Acre Tons $/Ton Dollar Value Total<br />
Apples (all) <strong>2010</strong> 2,616 10.04 26,254 $ 223 $ 5,861,600<br />
2009 2,862 8.19 23,436 $ 218 $ 5,117,800<br />
Fresh <strong>2010</strong> $ 1,243,400<br />
2009 $ 1,162,700<br />
Processed (a) <strong>2010</strong> $ 4,618,300<br />
2009 $ 3,955,100<br />
Grapes (wine) <strong>2010</strong> 56,522 3.39 191,876 $2,034 $ 390,448,300<br />
2009 56,306 3.78 212,675 $2,167 $ 460,771,200<br />
Olives <strong>2010</strong> 465 $ 176,100<br />
2009 388 $ 161,200<br />
Miscellaneous (b) <strong>2010</strong> $ 542,700<br />
2009 $ 519,700<br />
TOTAL VALUE <strong>2010</strong> $ 397,028,700<br />
2009 $ 466,569,900<br />
(a) includes canned, juice, cider, and vinegar<br />
(b) includes bush-berries, kiwi, black walnuts, plums, all pears, strawberries, figs, chestnuts, prunes, etc.<br />
* Revised from 2009<br />
World WineGrape Acreage<br />
Country<br />
Total Acreage % Change<br />
2006 2008<br />
SPAIN 2,900,000 2,750,000 -5.17%<br />
FRANCE 2,179,000 2,017,000 -7.43%<br />
ITALY 2,063,000 1,989,000 -3.59%<br />
TURKEY 1,410,000 1,450,000 2.84%<br />
*<br />
*<br />
<strong>2010</strong><br />
Fruit and Nut<br />
Acreage Summary<br />
<strong>Crop</strong><br />
Bearing<br />
Non-<br />
Bearing Total<br />
Apples 2,616 0 2,616<br />
Grapes (wine) 56,522 3,137 59,659<br />
Olives 465 102 567<br />
Pears 55 0 55<br />
Plums (incl. Prunes) 39 0 39<br />
Walnuts 79 0 79<br />
Miscellaneous 710 0 710<br />
TOTAL ACREAGE 60,486 3,239 63,725<br />
CHINA 1,211,000 1,360,000 12.30%<br />
UNITED STATES 934,000 939,000 0.54%<br />
IRAN 745,000 870,000 16.78%<br />
ARGENTINA 543,000 565,000 4.05%<br />
PORTUGAL 608,000 543,000 -10.69%<br />
ROMANIA 580,000 482,000 -16.90%<br />
CHILE 479,000 480,000 0.21%<br />
AUSTRALIA 400,000 427,000 6.75%<br />
MOLDOVA 368,000 354,000 -3.80%<br />
SOUTH AFRICA 331,000 297,000 -10.27%<br />
UZBEKISTAN 255,000 292,000 14.51%<br />
ALL OTHER COUNTRIES 4,577,000 4,609,000 0.70%<br />
TOTAL ACREAGE 19,583,000 19,424,000 -0.81%<br />
Source: www.wineinstitute.org<br />
5
Winegrape Production<br />
Acreage<br />
Production<br />
Red Varieties Year Bearing Non-Bearing Total Tons $/Ton Total Value<br />
Cabernet Franc<br />
<strong>2010</strong> 653.9 14.3 668.2 1,436.3 $ 2,166.55 3,111,900<br />
2009 657.9 48.8 706.7 1,935.6 $ 2,358.82 $ 4,565,800<br />
Cabernet Sauvignon<br />
<strong>2010</strong> 11,549.0 468.3 12,017.3 37,933.3 $ 2,083.96 $ 79,051,500<br />
2009 11,658.5 730.5 12,389.0 41,140.6 $ 2,280.67 $ 93,828,200<br />
Carignane<br />
<strong>2010</strong> 180.3 1.0 181.3 270.4 $ 1,949.11 $ 527,100<br />
2009 182.0 2.8 184.8 464.2 $ 1,919.43 $ 891,000<br />
Malbec<br />
<strong>2010</strong> 310.4 69.1 379.5 770.5 $ 2,430.83 $ 1,873,000<br />
2009 281.8 82.1 363.9 877.9 $ 2,491.49 $ 2,187,300<br />
Merlot<br />
<strong>2010</strong> 5,248.0 55.6 5,303.6 17,440.9 $ 1,297.08 $ 22,622,300<br />
2009 5,736.9 109.1 5,846.0 16,506.5 $ 1,507.00 $ 24,875,300<br />
Meunier<br />
<strong>2010</strong> 108.5 15.0 123.5 406.5 $ 2,928.56 $ 1,190,500<br />
2009 109.0 15.0 124.0 398.5 $ 3,056.21 $ 1,217,900<br />
Petite Sirah<br />
<strong>2010</strong> 522.6 37.7 560.3 2,085.9 $ 2,377.94 $ 4,960,200<br />
2009 503.9 85.9 589.8 2,300.6 $ 2,480.13 $ 5,705,800<br />
Petite Verdot<br />
<strong>2010</strong> 202.9 9.2 212.1 695.5 $ 2,476.49 $ 1,722,400<br />
2009 189.0 34.8 223.8 918.9 $ 2,778.24 $ 2,553,000<br />
Pinot Noir<br />
<strong>2010</strong> 11,456.0 675.5 12,131.5 29,791.3 $ 2,825.12 $ 84,164,000<br />
2009 10,746.2 1,988.5 12,734.7 31,961.2 $ 3,043.08 $ 97,260,500<br />
Sangiovese<br />
<strong>2010</strong> 259.7 48.4 308.1 983.6 $ 2,244.09 $ 2,207,300<br />
2009 298.6 11.1 309.7 1,210.6 $ 2,231.17 $ 2,701,100<br />
Syrah-Shiraz<br />
<strong>2010</strong> 1,791.6 51.7 1,843.3 4,587.6 $ 2,030.22 $ 9,313,900<br />
2009 1,816.6 168.5 1,985.1 5,563.3 $ 2,314.65 $ 12,877,100<br />
Zinfandel<br />
<strong>2010</strong> 5,055.0 112.5 5,167.5 10,864.4 $ 2,260.27 $ 24,556,500<br />
2009 5,229.7 171.5 5,401.2 15,637.4 $ 2,462.39 $ 38,505,400<br />
Other Reds<br />
TOTAL REDS<br />
(a) weighted average<br />
<strong>2010</strong> 466.6 48.0 514.6 1,214.8 $ 9,416,500<br />
2009 527.2 187.6 714.8 1,839.7 $ 6,180,000<br />
<strong>2010</strong> 37,804.4 1,606.3 39,410.7 108,481.0 (a) $ 2,255.85 (a) $ 244,717,100<br />
2009 37,937.2 3,636.2 41,573.4 120,717.0 (a) $ 2,430.05 (a) $ 293,348,400<br />
total tons by variety 2000-<strong>2010</strong><br />
70,000<br />
60,000<br />
50,000<br />
40,000<br />
30,000<br />
20,000<br />
10,000<br />
0<br />
6
Winegrape Production<br />
Acreage<br />
Production<br />
White Varieties Year Bearing Non-Bearing Total Tons $/Ton Total Value<br />
Chardonnay<br />
French Colombard<br />
Gewürztraminer<br />
Muscat Blanc<br />
Pinot Blanc<br />
Pinot Gris<br />
Sauvignon Blanc<br />
Semillon<br />
Viognier<br />
White Riesling<br />
Other Whites<br />
TOTAL WHITES<br />
TOTAL WINE<br />
GRAPES<br />
(a) weighted average<br />
<strong>2010</strong> 15,060.0 1,263.0 16,323.0 66,157.4 $ 1,845.52 $ 122,094,900<br />
2009 14,659.8 2,414.9 17,074.7 73,100.6 $ 1,978.18 $ 144,606,200<br />
<strong>2010</strong> 35.6 0.0 35.6 125.1 $ 523.06 $ 65,500<br />
2009 44.6 0.0 44.6 246.0 $ 524.44 $ 129,100<br />
<strong>2010</strong> 138.1 5.1 143.2 274.6 $ 1,712.28 $ 470,200<br />
2009 122.0 26.2 148.2 385.6 $ 1,655.21 $ 638,300<br />
<strong>2010</strong> 18.0 12.4 30.4 67.1 $ 1,941.23 $ 130,000<br />
2009 19.4 0.0 19.4 66.7 $ 2,025.48 $ 135,100<br />
<strong>2010</strong> 46.4 0.0 46.4 237.6 $ 1,767.14 $ 419,900<br />
2009 68.6 0.0 68.6 258.3 $ 1,741.17 $ 449,800<br />
<strong>2010</strong> 445.5 22.5 468.0 1,715.8 $ 1,695.78 $ 2,909,700<br />
2009 453.6 80.5 534.1 1,921.8 $ 1,761.45 $ 3,385,200<br />
<strong>2010</strong> 2,341.0 183.2 2,524.2 13,103.3 $ 1,317.40 $ 17,262,300<br />
2009 2,248.6 333.9 2,582.5 13,841.2 $ 1,470.89 $ 20,358,900<br />
<strong>2010</strong> 133.4 0.0 133.4 440.6 $ 2,575.91 $ 1,135,000<br />
2009 143.6 6.4 150.0 430.6 $ 2,357.61 $ 1,015,200<br />
<strong>2010</strong> 231.5 2.6 234.1 623.4 $ 2,313.36 $ 1,442,200<br />
2009 261.9 31.2 293.1 720.1 $ 2,324.89 $ 1,674,200<br />
<strong>2010</strong> 29.9 2.9 32.8 148.3 $ 2,425.53 $ 359,800<br />
2009 30.0 0.0 30.0 238.6 $ 2,288.54 $ 546,100<br />
<strong>2010</strong> 238.4 39.4 277.8 606.8 $ 4,799,400<br />
2009 316.8 71.8 388.6 748.1 $ 2,062,800<br />
<strong>2010</strong> 18,717.8 1,531.1 20,428.8 83,500.0 (a) $ 1,811.72 (a) $ 151,278,800<br />
2009 18,368.8 2,964.9 21,333.7 91,957.6 (a) $ 1,903.06 (a) $ 175,000,900<br />
<strong>2010</strong> 56,522.2 3,137.3 59,659.5 191,981.0 $ 2,033.79 $ 390,448,300<br />
2009 56,306.0 6,601.1 62,907.2 212,674.6 $ 2,186.61 $ 460,771,200<br />
* Revised from 2009 price per ton by variety 2000-<strong>2010</strong><br />
$3,200<br />
$3,000<br />
*<br />
$2,800<br />
$2,600<br />
$2,400<br />
$2,200<br />
$2,000<br />
$1,800<br />
$1,600<br />
$1,400<br />
$1,200<br />
7
Apple Production, Apiary Products, and Vegetables<br />
Apple Production<br />
Bearing Tons/ Total<br />
<strong>Crop</strong> Year Acres Acre Tons $/Ton Dollar Value Total<br />
Gravenstein<br />
Fresh<br />
Processed (a)<br />
Late Apples<br />
TOTAL<br />
Fresh<br />
Processed (a)<br />
(a) includes canned, juice, cider, and vinegar<br />
<strong>2010</strong> 763 7.11 5,428 $ 312 $ 1,692,300<br />
2009 833 4.46 3,717 $ 358 $ 1,329,800<br />
<strong>2010</strong> 355 $1,667 $ 592,608<br />
2009 353 $1,602 $ 565,600<br />
<strong>2010</strong> 5,073 $ 217 $ 1,099,690<br />
2009 3,364 $ 227 $ 764,100<br />
<strong>2010</strong> 1,853 11.35 20,826 $ 200 $ 4,169,300<br />
2009 2,029 9.72 19,720 $ 192 $ 3,788,000<br />
<strong>2010</strong> 368 $1,769 $ 650,755<br />
2009 318 $1,880 $ 597,100<br />
<strong>2010</strong> 20,458 $ 172 $ 3,518,521<br />
2009 19,402 $ 164 $ 3,190,900<br />
<strong>2010</strong> 2,616 10.04 26,254 $ 223 $ 5,861,600<br />
2009 2,862 8.19 23,437 $ 218 $ 5,117,800<br />
Apiary Products<br />
<strong>2010</strong> $334,500<br />
TOTAL VALUE*<br />
2009 $378,100<br />
*includes honey, wax and pollination<br />
8<br />
<strong>Crop</strong><br />
Vegetables<br />
Year<br />
Harvested<br />
Acreage Dollar Value<br />
Miscellaneous <strong>2010</strong> 710 $ 8,212,200<br />
Vegetables (a) 2009 701 $ 8,066,600<br />
(a) includes melons, mushrooms, potatoes, pumpkins, sprouts,<br />
squash, tomatoes, lettuces, etc.
Livestock and Poultry Summary<br />
Number Live<br />
Item Year of Head Weight Unit $/Unit Total<br />
Cattle/Calves<br />
Sheep/Lambs<br />
Hogs<br />
Miscellaneous<br />
Poultry (a)<br />
TOTAL VALUE<br />
Livestock and Poultry<br />
<strong>2010</strong> 29,714 154,110 cwt. $ 75.59 $ 11,649,200<br />
2009 27,163 143,370 cwt. $ 64.80 $ 9,290,400<br />
<strong>2010</strong> 23,508 26,312 cwt. $ 95.71 $ 2,518,300<br />
2009 20,971 23,472 cwt. $ 78.89 $ 1,851,700<br />
<strong>2010</strong> 1,040 2,483 cwt. $ 54.24 $ 134,700<br />
2009 1,156 2,761 cwt. $ 42.30 $ 116,800<br />
<strong>2010</strong> $ 43,293,300<br />
2009 $ 41,034,600<br />
<strong>2010</strong> $ 57,595,500<br />
2009 $ 52,293,500<br />
(a) includes chicks, ducks, turkey poults, fryers, roasters, turkeys, etc.<br />
Livestock and Poultry Products<br />
Item Year Production Unit $/Unit Total<br />
Milk, Market<br />
<strong>2010</strong> 4, 932,001 cwt. $ 15.75 $ 77,679,100<br />
2009 5,199,404 cwt. $ 12.41 $ 64,524,700<br />
Milk, Manufacturing<br />
<strong>2010</strong> 6,458 cwt. $ 13.78 $ 89,000<br />
2009 7,906 cwt. $ 12.14 $ 96,000<br />
Wool<br />
<strong>2010</strong> 80,147 lb. $ 0.56 $ 44,900<br />
2009 76,330 lb. $ 0.53 $ 40,500<br />
Miscellaneous <strong>2010</strong> $ 20,799,800<br />
Products (a)<br />
2009 $ 26,398,700<br />
TOTAL VALUE<br />
<strong>2010</strong> $ 98,612,800<br />
2009 $ 91,059,900<br />
(a) includes market duck eggs, turkey hatching eggs, chicken eggs for consumption, egg by-products, and goat milk<br />
Inventory<br />
Item<br />
Number<br />
Cattle and Calves (all) *<br />
66,935<br />
Milk Cows and heifers (2 years and over) 29,923<br />
Beef Cows and heifers (2 years and over) 8,935<br />
Sheep and Lambs (all) 17,939<br />
Hogs 1,040<br />
Laying Hens and Pullets 1,832,145<br />
Goats 1,797<br />
*Number of head as of January 1, <strong>2010</strong> - furnished by California Agricultural Statistics Service<br />
9
Field <strong>Crop</strong>s<br />
Ton/ Total<br />
<strong>Crop</strong> Year Acres Acre Tons Unit Per Unit Total<br />
Hay, Oat<br />
Hay, Volunteer<br />
Green Chop<br />
Oats, Grain<br />
Silage, Corn<br />
Silage, Oat<br />
Straw<br />
Miscellaneous<br />
Pasture,<br />
Irrigated<br />
Rangeland<br />
TOTAL VALUE<br />
(a)<br />
(a)<br />
(a)<br />
(b)<br />
(c)<br />
(c)<br />
<strong>2010</strong> 5,247 2.2 11,538 ton $ 88.84 $ 1,025,000<br />
2009 4,090 2.2 8,912 ton $ 125.85 $ 1,153,400<br />
<strong>2010</strong> 1,543 5.0 7,715 ton $ 17.90 $ 138,100<br />
2009 1,190 1.1 1,353 ton $ 70.11 $ 107,100<br />
<strong>2010</strong> 2,053 11.0 22,620 ton $ 19.11 $ 432,200<br />
2009 1,223 9.0 10,986 ton $ 18.20 $ 192,200<br />
<strong>2010</strong> 874 1.4 1,212 ton $ 177.56 $ 215,200<br />
2009 442 1.1 477 ton $ 356.80 $ 128,100<br />
<strong>2010</strong> 195 29.7 5,787 ton $ 28.63 $ 165,700<br />
2009 250 28.4 7,095 ton $ 24.50 $ 203,700<br />
<strong>2010</strong> 6,164 10.7 65,765 ton $ 23.07 $ 1,517,200<br />
2009 5,219 10.2 53,008 ton $ 20.81 $ 1,209,800<br />
<strong>2010</strong> $ 48,100<br />
2009 $ 34,500<br />
<strong>2010</strong> $ 766,500<br />
2009 $ 365,900<br />
<strong>2010</strong> 6,858 acre $ 100.00 $ 685,800<br />
2009 6,927 acre $ 100.00 $ 692,800<br />
<strong>2010</strong> 338,401 acre $ 12.00 $ 4,060,900<br />
2009 341,819 acre $ 10.00 $ 3,418,200<br />
<strong>2010</strong> $ 9,054,700<br />
2009 $ 7,505,700<br />
(a) much of the green chop and silage is not sold, but used on the farm - value is determined by its feed equivalent<br />
(b) includes alfalfa, barley, safflower, wheat, rye, vetch, Sudan, etc.<br />
(c) potential grazing value - estimated from Assessor's rolls<br />
12<br />
FIELD CROP VALUES 1990 - <strong>2010</strong><br />
10<br />
Millions of Dollars<br />
8<br />
6<br />
4<br />
2<br />
0<br />
10
Recapitulation<br />
2009 <strong>2010</strong> % Change<br />
Apiary Products $ 378,100 $ 334,500 -11.5%<br />
Field <strong>Crop</strong>s $ 7,505,700 $ 9,054,700 20.6%<br />
Vegetable <strong>Crop</strong>s $ 8,066,600 $ 8,212,200 1.8%<br />
Nursery Products $ 23,644,200 $ 22,983,300 -2.8%<br />
Livestock and Poultry $ 52,293,500 $ 57,595,500 10.1%<br />
Livestock and Poultry<br />
Products $ 91,059,900 $ 98,612,800 8.3%<br />
Fruit and Nut <strong>Crop</strong>s $ 466,569,900 * $ 397,028,700 -15.0%<br />
TOTAL VALUE $ 649,517,900 * $ 593,821,700 -8.6%<br />
* Revised from 2009<br />
<strong>Sonoma</strong> <strong>County</strong> Agriculture <strong>2010</strong><br />
(percentage of total production value)<br />
Vegetable <strong>Crop</strong>s (1.4%)<br />
Field <strong>Crop</strong>s (1.6%)<br />
Nursery Products (3.9%)<br />
Fruit and Nut <strong>Crop</strong>s (66.8%)<br />
Livestock and Poultry (9.7%)<br />
Livestock and Poultry Products<br />
(16.6%)<br />
11
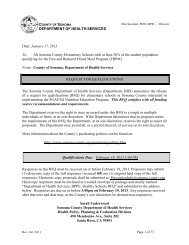
Sustainable Agriculture <strong>Report</strong><br />
Commodity<br />
<strong>2010</strong> Organic Farming Statistics<br />
Registrants Sites Acres<br />
Eggs 8 N/A N/A<br />
Fruits/Nuts 83 477 2,326<br />
Grain/Forage 30 107 2,493<br />
Meat 5 18 N/A<br />
Milk 24 92 N/A<br />
Nurseries 34 48 10<br />
Pasture/Rangeland 20 50 10,461<br />
Vegetables 57 80 266<br />
Winegrapes 30 71 776<br />
Handlers 25 N/A N/A<br />
Total Individual Registrants 188 693 16,332<br />
Noxious Weed Eradication<br />
Biologists identified two sources of invasive and aggressive weeds in <strong>Sonoma</strong> <strong>County</strong>. These two weeds are A-rated Rush Skeletonweed<br />
(Chondirlla juncea), and Iberian Starthistle (Centaurea iberica). Over the course of the year, several visits were made to five different sites<br />
to perform mechanical removal and chemical treatment in order to halt the growth and prevent the spread of these problematic and very<br />
adaptive weed species.<br />
Pest Detection Trapping<br />
There were 6,244 traps placed for the detection of exotic insect pests including Mediterranean, Oriental, Olive, and Melon Fruit Flies,<br />
Gypsy Moth, Japanese Beetle, Khapra Beetle, European Grapevine Moth (EGVM) and Light Brown Apple Moth (LBAM). Traps were<br />
serviced 72,538 times. There were 150 traps placed in nurseries for the Glassy-winged Sharpshooter (GWSS), which were serviced<br />
1,872 times. In addition, 475 traps were placed in urban areas for GWSS, which were serviced 5,006 times. EGVM and LBAM were<br />
both detected through trapping in <strong>2010</strong>, which included 59 confirmed finds of EGVM in <strong>Sonoma</strong> <strong>County</strong>.<br />
Pest Exclusion<br />
A total of 2,227 premise visits occurred in <strong>2010</strong>, and during these visits we inspected 33,328 shipments of plant material. Inspections<br />
occurred at the express carriers, nurseries, the post office, feed mills, as well as vineyards and other farms. Forty-five rejections of plant<br />
material were made, which is an increase of 12.5% compared with 2009 rejections. Rejected plant material was either destroyed or<br />
reconditioned and released. To prevent the spread of GWSS into <strong>Sonoma</strong> <strong>County</strong>, department personnel inspected 1,705 shipments of<br />
nursery material arriving from infested counties in California. There were no shipments of plant material rejected for the prescence of<br />
viable GWSS egg masses in <strong>Sonoma</strong> <strong>County</strong> in <strong>2010</strong>. There were no GWSS adults intercepted in <strong>2010</strong>. To assist our industry, we issued<br />
115 federal phytosanitary documents for international shipments and 861 state phytosanitary documents for shipments to other states.<br />
European Grapevine Moth<br />
Lobesia botrana<br />
California Red Scale<br />
Aonidiella aurantii<br />
Exotic Pest Species Intercepted IN <strong>2010</strong><br />
Light Brown Apple Moth<br />
Epiphyas postvittana<br />
Quack Grass<br />
Elytrigia repens<br />
Grass Cyst Nematode<br />
Heterodera mani<br />
Oblong Spurge<br />
Euphorbia oblongata<br />
Diaspidid scale<br />
Pseudaulacaspis Brimblecombei<br />
Purple Loosestrife<br />
Lythrum Salicaria<br />
Wooly Distaff Thistle<br />
Carthamnus lanatus<br />
12
Vineyard and Orchard Site development<br />
The <strong>Sonoma</strong> <strong>County</strong> Board of Supervisors adopted a comprehensive Grading, Drainage, and Vineyard and Orchard Site<br />
Development Ordinance in December of 2008, which integrated the Vineyard Erosion and Sediment Control Ordinance<br />
(VESCO) that was adopted in 2000. The purpose of the ordinance is to help prevent soil erosion, and protect water quality<br />
and other natural resources. In addition to vineyards, the new ordinance requires an erosion and sediment control plan be<br />
approved prior to planting or replanting orchards as well. The figures in the table below include projects for both vineyards<br />
and orchards.<br />
In collaboration with other agencies, organizations and individuals, our agriculture division developed a “Best Management<br />
Practices for Agricultural Erosion and Sediment Control”. This handbook provides guidelines necessary to control water<br />
quality impacts from accelerated soil erosion due to agricultural activities in <strong>Sonoma</strong> <strong>County</strong>. The handbook describes and<br />
shows basic practices effective at reducing erosion and sedimentation, and how to implement these practices.<br />
PROJECTS SUBMITTED*<br />
New Replants TOTAL<br />
Level I Level II Acreage Project Level I Level II Acreage Project Projects<br />
Year Projects Acreage Projects Acreage Total Total Projects Acreage Projects Acreage Total Total<br />
2005 32 281 23 514 795 55 79 870 2 60 930 81 136<br />
2006 49 544 13 151 695 62 78 785 6 47 832 84 146<br />
2007 45 419 21 115 534 66 100 1,001 4 22 1,023 104 170<br />
2008 61 1,157 27 272 1,429 88 97 1,110 4 22 1,132 101 189<br />
2009 24 150 20 377 527 44 57 1,046 5 88 1,134 62 106<br />
<strong>2010</strong> 10 82 13 75 157 23 51 783 0 0 783 51 74<br />
* Chart displays the number of projects submitted, not necessarily completed, since 2005.<br />
In <strong>2010</strong>, there were a total of three orchard projects, for a total of 5.84 acres<br />
250<br />
Total Projects Per Year<br />
Total Projects Per Year<br />
200<br />
150<br />
NEW<br />
REPLANT<br />
100<br />
50<br />
0<br />
2000 2001 2002 2003 2004 2005 2006 2007 2008 2009 <strong>2010</strong><br />
13
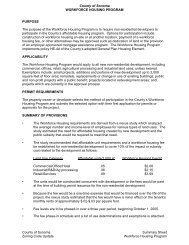
Commodity Exports<br />
Commodity Destinations<br />
Shipments<br />
No Shipments<br />
14<br />
Number of<br />
Certificates<br />
Canada 31<br />
Japan 17<br />
French Polynesia 12<br />
Spain 10<br />
Mexico 8<br />
Italy 7<br />
China 6<br />
France 4<br />
Chile 4<br />
Argentina 2<br />
Brazil 2<br />
Germany 2<br />
Ghana 2<br />
Taiwan 2<br />
Hungary 2<br />
Austria 1<br />
Belgium 1<br />
Singapore 1<br />
United Kingdom 1<br />
Destination<br />
Commodities Shipped<br />
Oak Pieces for Winemaking<br />
Bird Seed<br />
Corn<br />
Herbs/Spices<br />
Rose Plants<br />
Iris Rhizomes<br />
Vegetable Seed<br />
Ferns<br />
Grapevines<br />
Oak Wine Barrels<br />
Winegrapes<br />
In <strong>2010</strong>, the <strong>Sonoma</strong> <strong>County</strong> Agricultural Commissioner’s Office<br />
issued 115 Federal Phytosanitary Certificates for international<br />
shipments to 19 countries, and 861 State Phytosanitary Certificates<br />
for shipments within the United States. These certificates were issued<br />
by staff to assist the agricultural industry and allow certified plant<br />
materials to cross quarantine boundaries. Phytosanitary certificates<br />
document that materials to be shipped have been inspected and<br />
certified free from pests as required by the importing state/country.
Timber Harvest, Equestrian Inventory,<br />
and Commercial Fish Landings<br />
Timber Harvest *<br />
Year Production Unit Value (a)<br />
2009 1,228,000 board feet $ 512,219<br />
2008 11,835,000 board feet $ 6,806,279<br />
(a) value of the timber immediately before cutting<br />
*Most current data available<br />
Informational only. Source: http://www.boe.ca.gov/proptaxes/timbertax.htm<br />
<strong>Sonoma</strong> <strong>County</strong> Horse<br />
Operations - 2004*<br />
<strong>Sonoma</strong> <strong>County</strong><br />
Equestrian Inventory<br />
Horses Owned<br />
Year by Households<br />
1994 10,991<br />
1998 11,433<br />
2004 15,783<br />
Information only; most current data available. Sources: Economic Impact Studies for 1994,<br />
1998 and 2004 by <strong>Sonoma</strong> State University<br />
*Most current data available<br />
Commercial Fish Landings *<br />
Species Pounds Value<br />
Crab, Dungeness<br />
Salmon, Chinook<br />
Sole, all<br />
Rockfish, all<br />
Halibut, California<br />
Miscellaneous<br />
Sablefish<br />
Lingcod<br />
Tuna, Albacore<br />
Cabezon<br />
TOTAL<br />
2009 335,674 $ 945,289<br />
2008 1,044,861 $ 3,270,761<br />
2009 0 $ ---<br />
2008 0 $ ---<br />
2009 70,060 $ 60,801<br />
2008 193,151 $ 190,215<br />
2009 34,846 $ 54,723<br />
2008 38,388 $ 72,532<br />
2009 17,367 $ 67,435<br />
2008 1,310 $ 5,871<br />
2009 483,624 $ 324,771<br />
2008 78,134 $ 56,552<br />
2009 57,563 $ 128,321<br />
2008 10,849 $ 27,618<br />
2009 3,263 $ 4,578<br />
2008 6,316 $ 8,582<br />
2009 18,043 $ 18,489<br />
2008 2,100 $ 2,783<br />
2009 158 $ 936<br />
2008 54 $ 277<br />
2009 1,020,598 $ 1,605,343<br />
2008 1,375,163 $ 3,635,191<br />
*Most recent figures provided by California Department of Fish and Game.<br />
Source: http://www.dfg.ca.gov/marine/landings09.asp<br />
Informational only.<br />
15
Agriculture Division Summary<br />
In <strong>2010</strong> the Agriculture Division:<br />
• Implemented state and federal quarantine restrictions to combat the spread of the newly introduced and extremely destructive pest,<br />
the European Grapevine Moth (EGVM). Staff placed approximately 7,000 traps for early detection, issued nearly 900 quarantine<br />
compliance agreements, and provided outreach through meetings, mailings and web updates.<br />
• Worked collaboratively with growers and environmental resource agencies to develop the Frost Protection Ordinance, which requires<br />
vineyard and orchard frost water protection users in the Russian River Watershed to register with the Agricultural Commissioner’s<br />
Office. This annual registration will collect survey information on the nature of each frost system infrastructure and water diversions,<br />
the first phase of addressing the potential conflict of frost water use with salmonids.<br />
• Implemented an organic inspection program for all new uncertified organic operations aimed at determining compliance with the<br />
national and state organic rules.<br />
Did you know that in <strong>2010</strong> the Agriculture Division…<br />
• Inspected approximately 33,300 incoming shipments of plant material at nurseries and shipping terminals for exotic pests<br />
• Issued 202 Producer Certificates and 13 Farmers’ Market certificates<br />
• Registered 20 new organic producers<br />
• Inspected 5 million chicken eggs for defects (via representative sampling)<br />
• Issued 976 Phytosanitary certificates for the export of plant material out of <strong>Sonoma</strong> <strong>County</strong><br />
• Diverted more than 16,000 pounds of plastic containers from the landfill through the division’s two recycling events with<br />
approximately 113 growers participating<br />
• Inspected 32 shipments of household articles for the presence of Gypsy Moth, which includes thoroughly examining items such as<br />
BBQs, boats, cars, fire wood, recreational vehicles, patio furniture, and other articles originating from portions of the United States<br />
infested with Gypsy Moth (Lymantria dispar)<br />
• Investigated 35 suspected illnesses and complaints as part of the Pesticide Use Enforcement program<br />
• Issued 559 Operator Identification Numbers and Pesticide Use Permits<br />
• Surveyed more than 1,000 <strong>Sonoma</strong> <strong>County</strong> producers in preparation for the <strong>2010</strong> Agricultural <strong>Crop</strong> <strong>Report</strong><br />
16
Weights and Measures Division Summary<br />
The Division of Weights and Measures has been in existence in <strong>Sonoma</strong> <strong>County</strong> since 1916. It is a division within the Agricultural<br />
Commissioner’s Office and the Agricultural Commissioner also serves as the <strong>County</strong> Sealer. Weights and Measures works in partnership<br />
with the State Division of Measurement Standards to enforce Weights and Measures laws and regulations at the county level. Weights<br />
and Measures also enforces locally enacted county ordinances that fall under our jurisdiction.<br />
Traditionally, Weights and Measures Inspectors certify commercial weighing and measuring devices used in commerce. The term<br />
“commercial device” is defined by law as a device used to make a “… determination of the weight, measure, or count of any commodity<br />
or thing upon which determination of a charge for service is based.” <strong>Sonoma</strong> <strong>County</strong> consumers encounter commercial devices frequently<br />
in their daily lives. Scales are used to weigh produce at the local supermarket; fuel dispensers are used to meter and purchase fuel at the<br />
local gas station; and taxi meters measure the distance traveled for a ride across town.<br />
In 2006, the Weights and Measures Division began implementing the ‘Price Verification Program Ordinance’. This ordinance regulates<br />
local businesses that use a scanner system at the point of sale to register with their county Weights and Measures Division. These<br />
businesses must undergo routine price verification inspections. Point of sale scanner systems have greatly reduced the “waiting time”<br />
spent at the checkout register. At the same time, retailers have introduced more product sales, discounts, and conditions of sale (buy one<br />
get one for half price). This technology has increased the potential for pricing errors as hundreds of products go on-sale and come offsale<br />
on a daily and weekly basis. This ordinance protects consumers by assuring they are being charged the correct price for each item.<br />
Did you know that in <strong>2010</strong> the Weights and Measures Division...<br />
• Scanned over 19,601 items while performing 676 price verification inspections at local retailers<br />
• Inspected 3,834 fuel pumps at local gas stations<br />
• Inspected over 1,285 deli and supermarket scales used to weigh non-standards weight items<br />
• Responded to more than 120 consumer complaints ranging from incorrect charges at retail businesses to suspected contaminated<br />
fuel at local gas stations<br />
• Inspected over 116 taxi meters<br />
17
Winning Ag Day Essay<br />
Ag Days is a <strong>Sonoma</strong> <strong>County</strong> tradition. The <strong>Sonoma</strong> <strong>County</strong> Farm Bureau annually sponsors the two-day event, which is a<br />
celebration of <strong>Sonoma</strong> <strong>County</strong>’s Agricultural industry and the rich heritage that continues to define a way of life for <strong>Sonoma</strong><br />
<strong>County</strong> residents. Ag Days offer an opportunity for thousands of school children to learn more about farming and where<br />
their food comes from, allowing them to connect with the farms and ranches that blanket the county. An essay writing contest<br />
is one of many farm-themed contests held each year, which also include posters, murals, scarecrow-building, and farm<br />
photography. Following is the winning Ag Days Essay for 2011.<br />
Growing a Healthy Future<br />
By: Zoe Maddox, 5th Grade<br />
Pacific Christian Academy<br />
Growing a healthy future is what farmers do in <strong>Sonoma</strong> <strong>County</strong>. How? By growing<br />
healthful foods and keeping the environment clean and beautiful.<br />
Growing healthy crops and producing delicious, healthful foods is important. Healthy<br />
eating habits will help people have a healthy future. And who will help make sure we have<br />
healthful food? Farmers, of course. Farmers in <strong>Sonoma</strong> <strong>County</strong> love to grow and sell healthy<br />
foods!<br />
Farmers, whether they are organic or conventional, care for and about our environment.<br />
Some foods are organically grown with no pesticides or other chemicals. Other foods are<br />
grown using chemical sprays to keep pests away and fight disease. Why? Being “earth<br />
friendly” is a key to a healthy future.<br />
And who are helping us grow a healthy future? Our wonderful and helpful farmers of<br />
<strong>Sonoma</strong> <strong>County</strong>! Thanks!<br />
18
Department Staff<br />
VISION<br />
To ensure a thriving agricultural industry, a healthy community, economy and environment, for the people of <strong>Sonoma</strong> <strong>County</strong><br />
MISSION<br />
Deliver services that effectively promote and protect agriculture, the economy, community, environment,<br />
and health and safety of our citizens through education and the enforcement of laws and regulations, resulting in:<br />
• Sustainable Agriculture<br />
• Equity in the Marketplace<br />
AGRICULTURAL COMMISSIONER/SEALER OF WEIGHTS and MEASURES<br />
Agriculture Division Staff<br />
CHIEF DEPUTY AGRICULTURAL COMMISSIONER<br />
Lisa Correia<br />
AGRICULTURE AND VINEYARD CONSERVATION COORDINATOR<br />
Gail Davis ~ John Rainwater<br />
ADMINISTRATIVE ANALYST<br />
Natalie Brunamonte<br />
DEPARTMENT ANALYST<br />
Esther Martinez<br />
Weights and Measures Division Staff<br />
CHIEF DEPUTY SEALER<br />
Fernando Vasquez<br />
SENIOR STANDARDS SPECIALIST<br />
Michael Barrett<br />
STANDARDS SPECIALISTS<br />
Thomas LeClerc ~ Katy McCoy ~ Michael Milligan<br />
Greg Peters ~ Jeffrey Yparraguirre<br />
DEPUTY AGRICULTURAL COMMISSIONER<br />
Joseph Gray ~ Sue Ostrom ~ Alexis Ramey<br />
SENIOR AGRICULTURAL BIOLOGIST<br />
Dan Curtin ~ Priscilla Lane ~Paul Turano ~ Marilyn Vernon<br />
AGRICULTURAL BIOLOGIST<br />
Pete Albers ~ Gary Bjork ~ Gayle Carter ~ David Jagdeo<br />
AlexMcVicker ~ Cree J. Morgan ~ Jessica Scroggins ~ Andrew Smith<br />
WILDLIFE SPECIALIST<br />
Jeff Furlong<br />
ADMINISTRATIVE SUPPORT STAFF<br />
Mary Halasz ~ Naomi Lozinto ~ Carrie Muller<br />
Nina Reeser ~ Sue Taylor-Fellbaum ~ Dagny Thomas ~ Jenese Turnage<br />
SENIOR AGRICULTURAL PROGRAM ASSISTANT<br />
Maggie Furlong<br />
AGRICULTURAL PROGRAM ASSISTANTS<br />
Laura Barnthouse ~ Frank Bastoni ~ Kevin Brady ~ David Burtis<br />
Kris Catching ~ Kim Covington ~ Benny Friestadt ~ Andrew Griffin<br />
Jesus Hernandez ~ Travis Howard ~ Tina Hughes ~ Anne-Elise Krug<br />
John O’Keeffe ~ Prahlada Papper ~ Capella Parrish ~ Brian Ratlidge<br />
Laurie Richards ~ David Stuart ~ Jody Vent ~ Brittney Yolo<br />
19
NOTES