Paez-Rubio,_T._et_al.. - SourceWatch
Paez-Rubio,_T._et_al.. - SourceWatch
Paez-Rubio,_T._et_al.. - SourceWatch

You also want an ePaper? Increase the reach of your titles
YUMPU automatically turns print PDFs into web optimized ePapers that Google loves.
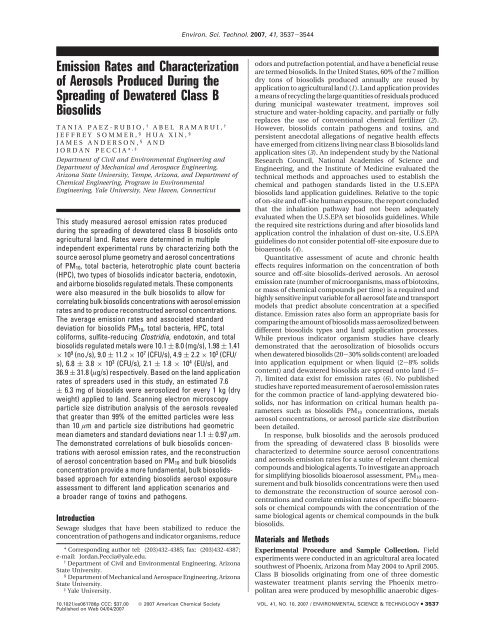
Environ. Sci. Technol. 2007, 41, 3537-3544<br />
Emission Rates and Characterization<br />
of Aerosols Produced During the<br />
Spreading of Dewatered Class B<br />
Biosolids<br />
TANIA PAEZ-RUBIO, † ABEL RAMARUI, †<br />
JEFFREY SOMMER, § HUA XIN, §<br />
JAMES ANDERSON, § AND<br />
JORDAN PECCIA* ,‡<br />
Department of Civil and Environment<strong>al</strong> Engineering and<br />
Department of Mechanic<strong>al</strong> and Aerospace Engineering,<br />
Arizona State University, Tempe, Arizona, and Department of<br />
Chemic<strong>al</strong> Engineering, Program in Environment<strong>al</strong><br />
Engineering, Y<strong>al</strong>e University, New Haven, Connecticut<br />
This study measured aerosol emission rates produced<br />
during the spreading of dewatered class B biosolids onto<br />
agricultur<strong>al</strong> land. Rates were d<strong>et</strong>ermined in multiple<br />
independent experiment<strong>al</strong> runs by characterizing both the<br />
source aerosol plume geom<strong>et</strong>ry and aerosol concentrations<br />
of PM 10 , tot<strong>al</strong> bacteria, h<strong>et</strong>erotrophic plate count bacteria<br />
(HPC), two types of biosolids indicator bacteria, endotoxin,<br />
and airborne biosolids regulated m<strong>et</strong><strong>al</strong>s. These components<br />
were <strong>al</strong>so measured in the bulk biosolids to <strong>al</strong>low for<br />
correlating bulk biosolids concentrations with aerosol emission<br />
rates and to produce reconstructed aerosol concentrations.<br />
The average emission rates and associated standard<br />
deviation for biosolids PM 10 , tot<strong>al</strong> bacteria, HPC, tot<strong>al</strong><br />
coliforms, sulfite-reducing Clostridia, endotoxin, and tot<strong>al</strong><br />
biosolids regulated m<strong>et</strong><strong>al</strong>s were 10.1 ( 8.0 (mg/s), 1.98 ( 1.41<br />
× 10 9 (no./s), 9.0 ( 11.2 × 10 7 (CFU/s), 4.9 ( 2.2 × 10 3 (CFU/<br />
s), 6.8 ( 3.8 × 10 3 (CFU/s), 2.1 ( 1.8 × 10 4 (EU/s), and<br />
36.9 ( 31.8 (µg/s) respectively. Based on the land application<br />
rates of spreaders used in this study, an estimated 7.6<br />
( 6.3 mg of biosolids were aerosolized for every 1 kg (dry<br />
weight) applied to land. Scanning electron microscopy<br />
particle size distribution an<strong>al</strong>ysis of the aerosols reve<strong>al</strong>ed<br />
that greater than 99% of the emitted particles were less<br />
than 10 µm and particle size distributions had geom<strong>et</strong>ric<br />
mean diam<strong>et</strong>ers and standard deviations near 1.1 ( 0.97 µm.<br />
The demonstrated correlations of bulk biosolids concentrations<br />
with aerosol emission rates, and the reconstruction<br />
of aerosol concentration based on PM 10 and bulk biosolids<br />
concentration provide a more fundament<strong>al</strong>, bulk biosolidsbased<br />
approach for extending biosolids aerosol exposure<br />
assessment to different land application scenarios and<br />
a broader range of toxins and pathogens.<br />
Introduction<br />
Sewage sludges that have been stabilized to reduce the<br />
concentration of pathogens and indicator organisms, reduce<br />
* Corresponding author tel: (203)432-4385; fax: (203)432-4387;<br />
e-mail: Jordan.Peccia@y<strong>al</strong>e.edu.<br />
†<br />
Department of Civil and Environment<strong>al</strong> Engineering, Arizona<br />
State University.<br />
§<br />
Department of Mechanic<strong>al</strong> and Aerospace Engineering, Arizona<br />
State University.<br />
‡<br />
Y<strong>al</strong>e University.<br />
odors and putrefaction potenti<strong>al</strong>, and have a benefici<strong>al</strong> reuse<br />
are termed biosolids. In the United States, 60% of the 7 million<br />
dry tons of biosolids produced annu<strong>al</strong>ly are reused by<br />
application to agricultur<strong>al</strong> land (1). Land application provides<br />
a means of recycling the large quantities of residu<strong>al</strong>s produced<br />
during municip<strong>al</strong> wastewater treatment, improves soil<br />
structure and water-holding capacity, and parti<strong>al</strong>ly or fully<br />
replaces the use of convention<strong>al</strong> chemic<strong>al</strong> fertilizer (2).<br />
However, biosolids contain pathogens and toxins, and<br />
persistent anecdot<strong>al</strong> <strong>al</strong>legations of negative he<strong>al</strong>th effects<br />
have emerged from citizens living near class B biosolids land<br />
application sites (3). An independent study by the Nation<strong>al</strong><br />
Research Council, Nation<strong>al</strong> Academies of Science and<br />
Engineering, and the Institute of Medicine ev<strong>al</strong>uated the<br />
technic<strong>al</strong> m<strong>et</strong>hods and approaches used to establish the<br />
chemic<strong>al</strong> and pathogen standards listed in the U.S.EPA<br />
biosolids land application guidelines. Relative to the topic<br />
of on-site and off-site human exposure, the report concluded<br />
that the inh<strong>al</strong>ation pathway had not been adequately<br />
ev<strong>al</strong>uated when the U.S.EPA s<strong>et</strong> biosolids guidelines. While<br />
the required site restrictions during and after biosolids land<br />
application control the inh<strong>al</strong>ation of dust on-site, U.S.EPA<br />
guidelines do not consider potenti<strong>al</strong> off-site exposure due to<br />
bioaerosols (4).<br />
Quantitative assessment of acute and chronic he<strong>al</strong>th<br />
effects requires information on the concentration of both<br />
source and off-site biosolids-derived aerosols. An aerosol<br />
emission rate (number of microorganisms, mass of biotoxins,<br />
or mass of chemic<strong>al</strong> compounds per time) is a required and<br />
highly sensitive input variable for <strong>al</strong>l aerosol fate and transport<br />
models that predict absolute concentration at a specified<br />
distance. Emission rates <strong>al</strong>so form an appropriate basis for<br />
comparing the amount of biosolids mass aerosolized b<strong>et</strong>ween<br />
different biosolids types and land application processes.<br />
While previous indicator organism studies have clearly<br />
demonstrated that the aerosolization of biosolids occurs<br />
when dewatered biosolids (20-30% solids content) are loaded<br />
into application equipment or when liquid (2-8% solids<br />
content) and dewatered biosolids are spread onto land (5-<br />
7), limited data exist for emission rates (6). No published<br />
studies have reported measurement of aerosol emission rates<br />
for the common practice of land-applying dewatered biosolids,<br />
nor has information on critic<strong>al</strong> human he<strong>al</strong>th param<strong>et</strong>ers<br />
such as biosolids PM 10 concentrations, m<strong>et</strong><strong>al</strong>s<br />
aerosol concentrations, or aerosol particle size distribution<br />
been d<strong>et</strong>ailed.<br />
In response, bulk biosolids and the aerosols produced<br />
from the spreading of dewatered class B biosolids were<br />
characterized to d<strong>et</strong>ermine source aerosol concentrations<br />
and aerosols emission rates for a suite of relevant chemic<strong>al</strong><br />
compounds and biologic<strong>al</strong> agents. To investigate an approach<br />
for simplifying biosolids bioaerosol assessment, PM 10 measurement<br />
and bulk biosolids concentrations were then used<br />
to demonstrate the reconstruction of source aerosol concentrations<br />
and correlate emission rates of specific bioaerosols<br />
or chemic<strong>al</strong> compounds with the concentration of the<br />
same biologic<strong>al</strong> agents or chemic<strong>al</strong> compounds in the bulk<br />
biosolids.<br />
Materi<strong>al</strong>s and M<strong>et</strong>hods<br />
Experiment<strong>al</strong> Procedure and Sample Collection. Field<br />
experiments were conducted in an agricultur<strong>al</strong> area located<br />
southwest of Phoenix, Arizona from May 2004 to April 2005.<br />
Class B biosolids originating from one of three domestic<br />
wastewater treatment plants serving the Phoenix m<strong>et</strong>ropolitan<br />
area were produced by mesophillic anaerobic diges-<br />
10.1021/es061786p CCC: $37.00 © 2007 American Chemic<strong>al</strong> Soci<strong>et</strong>y VOL. 41, NO. 10, 2007 / ENVIRONMENTAL SCIENCE & TECHNOLOGY 9 3537<br />
Published on Web 04/04/2007
FIGURE 1. Aerosol measurement s<strong>et</strong>up during the spreading of dewatered biosolids. The figure shows PM 10 sampler locations during<br />
concentration-weighted, cross-section<strong>al</strong> area experiments. For source bioaerosols measurement, sampling stands were grouped (spaced<br />
0.2-0.4 m apart) around the center of the plume and elevated to a height of 1.5 m.<br />
tion, and mechanic<strong>al</strong>ly dewatered (with polymer addition)<br />
toa20-30% solids content. Dewatered biosolids were spread<br />
onto land using a side discharge slinger (ProTwin Slinger,<br />
Kuhn Knight Inc., Brodhead, MN) operated at a rate of 110<br />
dry kg per minute.<br />
Figure 1 demonstrates the experiment<strong>al</strong> procedure for<br />
measuring aerosol source concentrations and source emission<br />
rates during biosolids land application. To eliminate<br />
dust generated by tire movement and thereby ensure that<br />
the aerosol plume was composed exclusively of biosolidsderived<br />
bioaerosols, the side discharge slinger was operated<br />
while stationary. Stationary operation, and hence aerosol<br />
experiments, were limited to approximately 1 min due to a<br />
build-up of biosolids near the exit of the slinger. Re<strong>al</strong>-time<br />
PM 10 monitoring reve<strong>al</strong>ed that the plume developed into a<br />
steady source within 5softhestart of spreader operation<br />
and that the aerosol concentrations r<strong>et</strong>urned to ambient<br />
levels within5softerminating spreader operation. Biologic<strong>al</strong>,<br />
PM 10, and m<strong>et</strong><strong>al</strong>s aerosol source samplers were located 1 to<br />
2 m downwind from the edge of the biosolids landing zone<br />
and were placed at the breathing zone height of 1.5 m. When<br />
multiple samplers were used, they were grouped (spaced<br />
0.2-0.4 m apart) around the centerline of the source aerosol<br />
plume. In <strong>al</strong>l cases, source samplers were located such that<br />
they were directly downwind of the direction of biosolids<br />
application. Source samplers were run for the 90 s duration<br />
brack<strong>et</strong>ing the 1 min time in which the biosolids spreader<br />
was operated. Control samplers for biologic<strong>al</strong> aerosols, PM 10,<br />
and airborne m<strong>et</strong><strong>al</strong>s were located a minimum of 100 m<br />
upwind of any applied biosolids or spreading activities.<br />
Control aerosol sampling was performed at the same time<br />
of the day as the land application experiments and samplers<br />
were operated for a 45 min duration. To ensure a constant<br />
wind speed and direction, and control for wind aerosolization<br />
of land-applied biosolids, <strong>al</strong>l experiments were performed<br />
only if wind speeds were above 0.8 m/s and below 2.5 m/s.<br />
A weather station (Weather Monitor II, Davis instrument<br />
Corp., Hayward, CA) was used in each field experiment to<br />
measure and log wind speed, wind direction, temperature,<br />
and relative humidity. All experiments were performed under<br />
slightly unstable atmospheric conditions over flat terrain.<br />
Sterile liquid impingers (BioSampler, SKC West Inc.,<br />
Fullerton, CA) were used to collect aerosol samples for tot<strong>al</strong><br />
bacteria, h<strong>et</strong>erotrophic bacteria plate counts (HPC), tot<strong>al</strong><br />
coliforms, sulfite-reducing Clostridia, and endotoxin. Eight<br />
impingers were located downwind of land application and<br />
3538 9 ENVIRONMENTAL SCIENCE & TECHNOLOGY / VOL. 41, NO. 10, 2007
four impingers were located at upwind control sites. Impingers<br />
were operated at a flow rate of 12.5 L/min in<br />
accordance with manufacturer specifications and flow was<br />
c<strong>al</strong>ibrated (Dry C<strong>al</strong> DC-Lite, BIOS, Butler, NJ) before each<br />
experiment. The impingers were filled with 20 mL of sterile<br />
phosphate buffer s<strong>al</strong>ine (PBS) solution (pH 7.2, 10 mM NaPO 4,<br />
125 mM NaCl). After sampling, the impinger contents were<br />
decanted into sterile 50 mL conic<strong>al</strong> tubes and the volume<br />
was recorded. Particulate matter (PM 10) was measured using<br />
re<strong>al</strong>-time PM 10 monitors (DustTrak Aerosol Monitor, model<br />
8520, TSI Inc., St. Paul, MN) operated at a flow rate of 1.7<br />
L/min. These monitors recorded aerosol PM 10 concentrations<br />
at 1 second interv<strong>al</strong>s. For m<strong>et</strong><strong>al</strong> aerosol an<strong>al</strong>ysis, tot<strong>al</strong><br />
suspended aerosol particles were collected onto a 47 mm<br />
diam<strong>et</strong>er, 1 µm pore-size Teflon filter (P<strong>al</strong>l Corp., Ann Arbor,<br />
MI). The filter was attached to an open-faced support and<br />
a flow rate of 31 L/min was used during collection. Fin<strong>al</strong>ly,<br />
aerosol samples for particle size distribution measurements<br />
were collected onto 47 mm diam<strong>et</strong>er, 0.4 µm pore size<br />
polycarbonate membranes (Whatman, Florham Park, NJ).<br />
These membranes were supported by polypropylene holders<br />
(Advantec MFS, Inc., Pleasanton, CA) and loaded at flow<br />
rates ranging from 11 o 15 L/min.<br />
Composite bulk biosolids samples were collected simultaneously<br />
with air samples by mixing biosolids collected from<br />
at least five different locations within the storage piles.<br />
Samples were placed in sterile Whirl-Pak bags (Nasco, Fort<br />
Atkinson, WI) and se<strong>al</strong>ed for transportation. Solids content<br />
was d<strong>et</strong>ermined by incubating 10 g of biosolids at 105 °C for<br />
18 h and c<strong>al</strong>culating the percent dry weight.<br />
An<strong>al</strong>ytic<strong>al</strong> M<strong>et</strong>hods. Culturable bacteria measurements<br />
(tot<strong>al</strong> coliforms, HPC, and sulfite-reducing Clostridia) for <strong>al</strong>l<br />
aerosol and bulk biosolids samples were started within 2 h<br />
of collection. For bulk biosolids an<strong>al</strong>ysis, microorganisms<br />
were extracted from 10 g (w<strong>et</strong> weight) of biosolids by mixing<br />
with 100 mL of 0.25× Ringer’s solution (38 mM NaCl, 1.4<br />
mM KCl, 1.1 mM CaCl 2, 0.6 mM NaHCO 3) in accordance<br />
with previously described m<strong>et</strong>hods (8). For the microbi<strong>al</strong><br />
aerosol an<strong>al</strong>yses, impinger samples from each experiment<br />
were pooled in order to improve the limit of d<strong>et</strong>ection to<br />
approximately 50 colony forming units (CFU)/m 3 for source<br />
aerosols and 1 CFU/m 3 for upwind control aerosols. The<br />
contents of two impingers were pooled for tot<strong>al</strong> bacteria<br />
counts, and the contents of four impingers were pooled to<br />
d<strong>et</strong>ermine tot<strong>al</strong> coliforms and sulfite-reducing Clostridia<br />
concentrations.<br />
Epifluorescent microscopy was used to enumerate tot<strong>al</strong><br />
bacteria in accordance with previously described m<strong>et</strong>hods<br />
(9). Cells were stained with 4′6-diamidino-2-phenylindole<br />
(DAPI) (Pierce, Rockford, IL) at a fin<strong>al</strong> concentration of 20<br />
µg/mL, filtered onto a 25 mm diam<strong>et</strong>er, 0.2 µm pore-size,<br />
black polycarbonate membrane (Osmonics, Inc., Minn<strong>et</strong>onka,<br />
MN), and observed with an Olympus BX51 microscope<br />
(Olympus, Melville, NY) at 1000× magnification. HPC and<br />
tot<strong>al</strong> coliform plate count an<strong>al</strong>ysis were performed in<br />
accordance with standard m<strong>et</strong>hods (10). The enumeration<br />
of sulfite-reducing Clostridia was performed using a modified<br />
membrane filtration technique (11), where cells filtered onto<br />
a 0.22 µm Durapore membranes were anaerobic<strong>al</strong>ly incubated<br />
at 37 °C for 48 h on an antibiotic-supplemented, eggyolk-free<br />
tryptose-sulfite-cycloserine (TSC) agar. Endotoxin<br />
concentration measurement was conducted using the Limulus<br />
Amebocyte Lysate (LAL) Pyrochrome Kit in accordance<br />
with manufacturer instructions (ACCIUSA, F<strong>al</strong>mouth, MA).<br />
A colorim<strong>et</strong>ric endpoint an<strong>al</strong>ysis was used to measure<br />
absorption of 405 nm light on a 96-well Vmax micro plate<br />
reader (Molecular Devices, Sunnyv<strong>al</strong>e, CA). Endotoxin was<br />
quantified by comparing sample absorption to standard<br />
curves of adsorption versus concentration (Endotoxin unit<br />
(EU) per mL). Standards were re-ev<strong>al</strong>uated for each reagent<br />
batch and standard curves with an r 2 below 0.97 were<br />
rejected. Endotoxin-free water and sterile impinger buffer<br />
solution were tested for blank v<strong>al</strong>ues and <strong>al</strong>l bulk biosolids<br />
and aerosols samples tested were blank corrected. Our<br />
laboratory’s average coefficient of variance levels for aerosol<br />
concentration measurements are 18%, 18%, 17%, 77%, and<br />
10% for sulfite-reducing Clostridia, HPC, tot<strong>al</strong> bacteria,<br />
endotoxin, and PM 10, respectively.<br />
To d<strong>et</strong>ermine aerosol particle size distribution, particles<br />
collected on 0.4-µm pore size polycarbonate filters (Whatman<br />
Inc, Florham Park, NJ) were an<strong>al</strong>yzed by an automated JEOL<br />
model JXA-5800 scanning electron microscope using the<br />
m<strong>et</strong>hod described by Anderson <strong>et</strong> <strong>al</strong>. (12). Length (l), width<br />
(d), and area of at least 1500 particles were d<strong>et</strong>ermined for<br />
each filter. Particle sizes were reported as the average<br />
geom<strong>et</strong>ric diam<strong>et</strong>er, (l+d)/2. The geom<strong>et</strong>ric mean and<br />
standard deviation of the log norm<strong>al</strong>ly distributed data as<br />
well as the percentage of particles under a specific size was<br />
c<strong>al</strong>culated using statistic<strong>al</strong> software (MINITAB 14, Minitab<br />
Inc., State College, PA). Absolute conversion b<strong>et</strong>ween aerodynamic<br />
and geom<strong>et</strong>ric diam<strong>et</strong>er was not possible due to<br />
the lack of information on individu<strong>al</strong> particle shape and<br />
densities. The percent of tot<strong>al</strong> particle volume (mass)<br />
contained below a specified geom<strong>et</strong>ric diam<strong>et</strong>er was c<strong>al</strong>culated<br />
in accordance with previously published m<strong>et</strong>hods<br />
(13). The particle volume was estimated as the product of<br />
the SEM d<strong>et</strong>ermined particle area and the particle width (d).<br />
Aerosol m<strong>et</strong><strong>al</strong> concentrations were quantified using<br />
inductively coupled plasma mass spectrom<strong>et</strong>ry (ICP-MS)<br />
in accordance with m<strong>et</strong>hods for low level aerosol particulate<br />
matter samples described by Lough <strong>et</strong> <strong>al</strong>. (14). Briefly,<br />
individu<strong>al</strong> filters were digested in a microwave-assisted acid<br />
bath prior to an<strong>al</strong>ysis. For biosolids, 3 dry g of the sample<br />
was digested with nitric acid and hydrogen peroxide in a hot<br />
block digestor and then refluxed with hydrochloric acid. The<br />
bulk biosolids and aerosol concentrations of the ten m<strong>et</strong><strong>al</strong>s<br />
(As, Cd, Cr, Cu, Pb, Hg, Mo, Ni, Se, Zn) that are regulated in<br />
the U.S.EPA biosolids land application guidelines were<br />
d<strong>et</strong>ermined (2).<br />
Source Emission Rate C<strong>al</strong>culation. The aerosol emission<br />
rate E (number or mg/second) was c<strong>al</strong>culated as the product<br />
of the background-corrected, source aerosol concentration<br />
C (number or mg/m 3 ), the wind speed U (m/s), and the area<br />
A (m 2 ) of a plane, through which the source aerosols pass,<br />
that is perpendicular to the wind direction. This area is termed<br />
the concentration-weighted, cross-section<strong>al</strong> plume area (A)<br />
and accounts for the spati<strong>al</strong> concentration distribution of<br />
particulate matter within this area. A novel m<strong>et</strong>hod for<br />
d<strong>et</strong>ermining this param<strong>et</strong>er is described. The vertic<strong>al</strong> concentration<br />
profile within A was d<strong>et</strong>ermined by placing re<strong>al</strong>time<br />
PM 10 monitors <strong>al</strong>ong the center line of A at heights of<br />
1.5, 2.5, 3.5, and 4.5 m (Figure 1, rear view). A similar<br />
horizont<strong>al</strong> profile was d<strong>et</strong>ermined by placing PM 10 monitors<br />
at a 1.5 m height at the plume center and extending 2.5 m<br />
to either side (Figure 1, side view). The vertic<strong>al</strong> and horizont<strong>al</strong><br />
boundaries of A were defined where PM 10 concentrations<br />
were equ<strong>al</strong> to ambient PM 10 concentrations. Based on these<br />
horizont<strong>al</strong> and vertic<strong>al</strong> concentration profiles, plume boundaries,<br />
and the assumption of a parabola shaped area (from<br />
field observations), lines of the same PM 10 concentrations at<br />
0.01 mg/m 3 increments within the plume were plotted and<br />
shaded. These parabolic lines of equ<strong>al</strong> concentrations were<br />
then used to d<strong>et</strong>ermine the v<strong>al</strong>ue of A (eq 1).<br />
A ) concentration-weighted cross-section<strong>al</strong> area )<br />
∑<br />
n)1fp<br />
(A n - A n-1 )‚ (1)<br />
C 1.5<br />
where A n is the area under the parabolic curve n (m 2 ), n is<br />
C n<br />
VOL. 41, NO. 10, 2007 / ENVIRONMENTAL SCIENCE & TECHNOLOGY 9 3539
TABLE 1. Aerosol and Bulk Biosolids Concentrations and Source Emission Rates<br />
param<strong>et</strong>er<br />
source<br />
concentration a<br />
upwind<br />
concentration a<br />
bulk biosolids<br />
concentration b<br />
aerosol source<br />
emission rate c<br />
tot<strong>al</strong> bacteria (tot<strong>al</strong> number) 1.8 ( 1.0 × 10 8 9.3 ( 13.0 × 10 6 4.4 ( 3.7 × 10 10 1.98 ( 1.41 × 10 9<br />
HPC (CFU) 8.2 ( 11.0 × 10 6 1.0 ( 0.6 × 10 4 4.0 ( 5.3 × 10 8 9.0 ( 11.2 × 10 7<br />
tot<strong>al</strong> coliforms (CFU) 380 ( 270 1.3 ( 2.8 1.5 ( 1.7 × 10 6 4.90 ( 2.19 × 10 3<br />
sulfite-reducing Clostridia (CFU) 590 ( 410 1.7 ( 2.4 4.3 ( 4.5 × 10 5 6.81 ( 3.81 × 10 3<br />
endotoxin (EU) 2.3 ( 1.5 × 10 3 3.3 ( 2.6 × 10 1 5.6 ( 1.5 × 10 5 2.1 ( 1.8 × 10 4<br />
PM 10 (mg) 1.18 ( 0.94 0.0165 - 10.1 ( 8.0<br />
arsenic (µg) 0.060 7.0 × 10 -4 12 ( 18 0.41 ( 0.11<br />
cadmium (µg) 3.9 × 3.7 × 10 -3 1.0 × 10 -4 3.69 ( 1.59 0.03 ( 0.028<br />
chromium (µg) 0.19 ( 0.17 0.012 67 ( 18 1.49 ( 1.12<br />
copper (µg) 0.11 ( 0.18 0.016 440 ( 10 0.69 ( 1.20<br />
lead (µg) 0.054 ( 0.027 0.024 37 ( 14 0.40 ( 0.18<br />
mercury (µg) 2.9 ( 3.9 × 10 -3 7 × 10 -4 0.48 ( 0.36 0.021 ( 0.026<br />
molybdenum (µg) 7.5 ( 4.2 × 10 -3 4 × 10 -4 50 ( 23 0.07 ( 0.06<br />
nickel (µg) 0.34 ( 0.21 0.017 40 ( 5 3.09 ( 2.14<br />
selenium (µg) 0.34 0.016 74 ( 10.7 2.28 ( 0.62<br />
zinc (µg) 3.17 ( 2.47 0.16 648 ( 23 28.4 ( 24.3<br />
tot<strong>al</strong> EPA regulated m<strong>et</strong><strong>al</strong>s (µg) 4.26 ( 3.03 0.25 1372 ( 124 36.9 ( 31.8<br />
a<br />
Source concentration and upwind concentration per m 3 . b Bulk biosolids concentration per dry g. c Aerosol source emission rate per s.<br />
the number of area concentration zones, p is the tot<strong>al</strong> number<br />
of area concentration zones (90), C n is the PM 10 concentration<br />
(mg/m 3 ) in area (A n - A n-1), and C 1.5 is PM 10 concentration<br />
(mg/m 3 ) in the center of the area at 1.5 m.<br />
All aerosol source and upwind concentrations and wind<br />
speeds were d<strong>et</strong>ermined in four independent experiments<br />
on different days. The concentration-weighted, crosssection<strong>al</strong><br />
area was d<strong>et</strong>ermined for a tot<strong>al</strong> of three different<br />
plumes measured on different days. To c<strong>al</strong>culate emission<br />
rates for the different chemic<strong>al</strong> and biologic<strong>al</strong> agents, the<br />
product of C and U for each independent experiment<strong>al</strong> run<br />
was first c<strong>al</strong>culated and then the average of this product for<br />
<strong>al</strong>l experiment<strong>al</strong> runs was d<strong>et</strong>ermined. This product was<br />
multiplied times the average A to d<strong>et</strong>ermine an over<strong>al</strong>l<br />
emission rate. The C and U v<strong>al</strong>ues used were those<br />
d<strong>et</strong>ermined at the breathing height. Wind speed was assumed<br />
to be constant throughout the source emission area. Emission<br />
rate standard deviations were estimated by propagating errors<br />
through rate c<strong>al</strong>culations in accordance with accepted<br />
m<strong>et</strong>hods (15).<br />
Results<br />
Biosolids and Aerosol Characterization. Table 1 lists upwind<br />
control, source aerosols, and bulk biosolids concentrations<br />
for the physic<strong>al</strong>, biologic<strong>al</strong>, and chemic<strong>al</strong> param<strong>et</strong>ers considered.<br />
Re<strong>al</strong>-time PM 10 concentration measurements at the<br />
land application source and at upwind control sites confirmed<br />
the production of aerosols during biosolids spreading. The<br />
time average PM 10 concentration at the aerosol source was<br />
1180 ( 940 µg/m 3 standard deviation and this v<strong>al</strong>ue is more<br />
than 70 times greater than the average ambient PM 10 aerosol<br />
concentration measured at upwind control locations (p <<br />
0.05). Six geom<strong>et</strong>ric diam<strong>et</strong>er size distribution frequencies<br />
were measured for source aerosols and include samples from<br />
three different days collected at a 1.5 m height in both the<br />
center of the plume and 2.5 m away from the center (Figure<br />
2). Mean geom<strong>et</strong>ric diam<strong>et</strong>er and geom<strong>et</strong>ric standard deviations<br />
were similar for <strong>al</strong>l spreading experiments, ranging from<br />
1.10 ( 0.97 to 1.13 ( 0.96 µm. Greater than 98% of the particles<br />
emitted during spreading were less than 4 µm, and an average<br />
93% of particles were less than 2.5 µm. Aerosols with<br />
diam<strong>et</strong>ers less than 4 µm comprised the majority (70%) of<br />
the particle volume (mass).<br />
For the microbi<strong>al</strong> aerosols, statistic<strong>al</strong> comparisons (p <<br />
0.05) confirmed that the average source aerosol concentrations<br />
of tot<strong>al</strong> coliforms, sulfite-reducing Clostridia, endotoxin,<br />
tot<strong>al</strong> bacteria, and HPC (p < 0.07 for HPC) were higher than<br />
average upwind ambient aerosol concentrations. In the case<br />
of biosolids indicator microorganisms and endotoxin, this<br />
difference was substanti<strong>al</strong>. Tot<strong>al</strong> coliforms, sulfite-reducing<br />
Clostridia, and endotoxin were more than 2 orders of<br />
magnitude greater at the source than at upwind locations,<br />
and upwind concentrations for indicators were not statistic<strong>al</strong>ly<br />
different from zero. U.S.EPA regulated m<strong>et</strong><strong>al</strong>s in<br />
biosolids (As, Cd, Cr, Cu, Pb, Hg, Mo, Ni, Se, Zn) were <strong>al</strong>so<br />
measured in samples collected from ambient upwind aerosols<br />
and the source aerosol plume. Each of the 10 individu<strong>al</strong> source<br />
aerosol m<strong>et</strong><strong>al</strong> concentrations were greater than corresponding<br />
upwind ambient concentrations, and tot<strong>al</strong> U.S.EPA<br />
regulated m<strong>et</strong><strong>al</strong>s concentrations were an average of 12.5 times<br />
greater at the source than upwind.<br />
Measurement of biosolids PM 10, as well as bulk biosolids<br />
m<strong>et</strong><strong>al</strong>s and indicator concentrations <strong>al</strong>lowed for the reconstruction<br />
of source aerosol concentrations. Reconstructed<br />
aerosol concentration for a specific m<strong>et</strong><strong>al</strong> or biologic<strong>al</strong> agent<br />
was c<strong>al</strong>culated as the product of biosolids PM 10 concentration<br />
(mg biosolids PM 10/m 3 ) and the concentration of the<br />
particular m<strong>et</strong><strong>al</strong> or biologic<strong>al</strong> agent in the bulk biosolids (ng,<br />
no., or CFU/mg bulk biosolids). The reconstructed v<strong>al</strong>ues<br />
are independent of the measured aerosol concentration<br />
v<strong>al</strong>ues which were d<strong>et</strong>ermined by sampling into impingers<br />
for biologic<strong>al</strong> agents, and collection onto filters for m<strong>et</strong><strong>al</strong>s.<br />
The two independent m<strong>et</strong>hods permitted a comparison<br />
b<strong>et</strong>ween reconstructed v<strong>al</strong>ues and measured v<strong>al</strong>ues. Figure<br />
3 demonstrates this comparison. The slope of a line fit to this<br />
data was 0.96 and the average reconstructed aerosol v<strong>al</strong>ue<br />
was 21% of the average measured v<strong>al</strong>ue. Efficiencies reported<br />
for extracting viruses and bacteria from sewage sludge range<br />
from 5 to 30%, and provide ration<strong>al</strong>e into why reconstructed<br />
concentrations are less than measured concentrations (16-<br />
19). In addition, due to c<strong>al</strong>ibration with aerosols different<br />
from those measured in these studies, DustTrack nephelom<strong>et</strong>er-style<br />
measurements should be considered only as a<br />
reasonable estimate of aerosol mass concentrations and may<br />
differ from filter-based PM 10 measurements (20).<br />
Source Emission Rates. To d<strong>et</strong>ermine the concentrationweighted,<br />
cross-section<strong>al</strong> area (A), the re<strong>al</strong>-time PM 10 readings<br />
for each monitor in the vertic<strong>al</strong> and horizont<strong>al</strong> sampling<br />
arrays were averaged over the duration of the experiment,<br />
norm<strong>al</strong>ized to the maximum PM 10 v<strong>al</strong>ue, and either plotted<br />
versus the vertic<strong>al</strong> distance <strong>al</strong>ong the center of A or the<br />
horizont<strong>al</strong> distance at 1.5 m height from the center to the<br />
edge of the plume. Characteristic profiles for both horizont<strong>al</strong><br />
and vertic<strong>al</strong> norm<strong>al</strong>ized concentration gradients in the source<br />
3540 9 ENVIRONMENTAL SCIENCE & TECHNOLOGY / VOL. 41, NO. 10, 2007
FIGURE 2. Characteristic profile for the geom<strong>et</strong>ric diam<strong>et</strong>er aerosol size frequency distribution (based on size bins of 0.1 µm). Black circles<br />
represent the particle size frequency from samples taken at the center of the plume and gray squares represent the frequencies from<br />
samples taken at the edge of the plume. The table presents percentage of particles that f<strong>al</strong>l below specific geom<strong>et</strong>ric diam<strong>et</strong>er ( a )as<br />
well as the percent of aerosol volume below a specific geom<strong>et</strong>ric diam<strong>et</strong>er ( b ).<br />
FIGURE 3. Reconstructed aerosol concentrations plotted versus measured aerosol concentrations. Data points represent concentrations<br />
of U.S.EPA regulated m<strong>et</strong><strong>al</strong>s (µg/m 3 ), endotoxin (EU/m 3 ), tot<strong>al</strong> coliforms (CFU/m 3 ), sulfite-reducing Clostridia (CFU/m 3 ), HPC (CFU/m 3 ), and<br />
tot<strong>al</strong> bacteria (CFU/m 3 ). The dashed line represents a linear best fit approximation.<br />
emission area are shown in Figure 4a. A first-order concentration<br />
decay with distance was fit for both the vertic<strong>al</strong> and<br />
horizont<strong>al</strong> direction. Based on these profiles and the parabolic<br />
shape of A that was observed during field observation, 90<br />
parabolic lines, each representing a 0.01 mg/m 3 increment<br />
in PM 10 concentration, were plotted and shaded (Figure 4b).<br />
This refined an<strong>al</strong>ysis resulted in an A and associated standard<br />
deviation of 7.09 ( 1.93 m 2 . The estimated source emission<br />
rates and standard deviations were then c<strong>al</strong>culated and are<br />
presented in Table 1 for tot<strong>al</strong> bacteria, HPC, sulfite-reducing<br />
Clostridia, tot<strong>al</strong> coliforms, endotoxin, PM 10, and biosolids<br />
regulated m<strong>et</strong><strong>al</strong>s. These aerosol emission rates are independent<br />
of the wind velocity, as conservation of mass dictates<br />
that for a steady-state emission, an increase or decrease in<br />
wind velocity results in a corresponding decrease or increase<br />
in source concentration. In addition, assuming a constant<br />
wind speed with height profile did not result in a significant<br />
over- or underestimation of the emission rates. A comparison<br />
b<strong>et</strong>ween the c<strong>al</strong>culation m<strong>et</strong>hod describe above and an<br />
emission rate c<strong>al</strong>culation which included the vertic<strong>al</strong> variation<br />
of wind speed resulted in less than 10% difference b<strong>et</strong>ween<br />
the v<strong>al</strong>ues. For the emission areas described here, greater<br />
than 90% of the mass was below 3.5 m. In cases where source<br />
plumes extend higher into the atmosphere, variation of wind<br />
speed with height becomes substanti<strong>al</strong>ly different from an<br />
average speed measured at the breathing height and wind<br />
VOL. 41, NO. 10, 2007 / ENVIRONMENTAL SCIENCE & TECHNOLOGY 9 3541
FIGURE 4. (a) Characteristic profile for norm<strong>al</strong>ized PM 10 concentration versus vertic<strong>al</strong> and horizont<strong>al</strong> distance within the source emission<br />
cross-section<strong>al</strong> area. Open circles represent the average norm<strong>al</strong>ized PM 10 measurements, and lines represent the best fit approximation<br />
based on first-order decay. (b) Concentration-weighted, cross-section<strong>al</strong> area of the PM 10 source created during land application of<br />
dewatered biosolids via side slinging. Shades of colors represent norm<strong>al</strong>ized (to the center of the plume) PM 10 concentrations.<br />
profile should be integrated into the emission rate c<strong>al</strong>culation.<br />
A relationship b<strong>et</strong>ween emission rate and bulk biosolids<br />
concentration was confirmed by comparing the two param<strong>et</strong>ers<br />
on a log-log plot (Figure 5). A regression b<strong>et</strong>ween<br />
these two param<strong>et</strong>ers resulted in a correlation coefficient<br />
(r 2 ) of 0.96. Given the 110 dry kg/min application rate<br />
associated with the model of spreader used in this study and<br />
aPM 10 emission rate of 10.1 ( 8.0 mg/s, the amount of<br />
biosolids aerosolized on a dry kg basis of applied biosolids<br />
was 7.6 ( 6.3 mg PM 10/dry kg biosolids.<br />
Discussion<br />
Aerosol concentrations of biosolids indicator microorganisms<br />
have been previously measured during the spreading of liquid<br />
and dewatered biosolids, and during the loading of dewatered<br />
biosolids (6, 7). The emissions measured herein confirm the<br />
aerosolization of dewatered biosolids during spreading. To<br />
account for the different source plume areas, the accurate<br />
comparison of emissions among different biosolids type,<br />
spreading m<strong>et</strong>hods, and equipment is more logic<strong>al</strong>ly performed<br />
on the basis of an emission rate rather than source<br />
concentration. Directly measured source emission rates<br />
during biosolids land application have previously been<br />
reported only for liquid biosolids (21). Despite tot<strong>al</strong> coliform<br />
concentrations in bulk biosolids that were similar to the bulk<br />
concentrations in this study, source aerosol tot<strong>al</strong> coliforms<br />
were not d<strong>et</strong>ected during liquid biosolids application and<br />
the estimated liquid biosolids rates (based on tot<strong>al</strong> coliform<br />
aerosol d<strong>et</strong>ection limits) were 35-125 times lower than the<br />
dewatered emission rates reported here. On a biosolids dry<br />
weight basis, dewatered aerosols emissions were approximately<br />
10 mg/s versus an average 0.125 mg/s for liquid<br />
biosolids.<br />
Size distribution, endotoxin, and m<strong>et</strong><strong>al</strong>s measurements<br />
have quantitative he<strong>al</strong>th threshold v<strong>al</strong>ues and provide some<br />
insight into potenti<strong>al</strong> biosolids-derived bioaerosol he<strong>al</strong>th<br />
effects in exposed populations. The percentage of emitted<br />
particles and fraction of tot<strong>al</strong> volume below 2.5 µm, 4 µm,<br />
and 10 µm geom<strong>et</strong>ric diam<strong>et</strong>er suggests that the majority of<br />
particles and particle volume is inh<strong>al</strong>able (
FIGURE 5. Average aerosol emission rates produced during spreading versus average bulk-biosolids concentration. Source emission rate<br />
units are per second, whereas biosolids concentrations are units per dry gram. Error bars represent standard deviation, r 2 ) 0.96<br />
with the standard threshold limit v<strong>al</strong>ues that are provided as<br />
time-weighted average (TWA) concentrations (8 h/day, 40 h<br />
work week) would result in an overestimation of dose. Source<br />
aerosol concentrations for the ten m<strong>et</strong><strong>al</strong>s considered were<br />
at least 1 order of magnitude less than corresponding TWA<br />
threshold limit v<strong>al</strong>ues (23), indicating low aerosol m<strong>et</strong><strong>al</strong>s<br />
toxicity to workers and off-site residents. In contrast, and<br />
based on recommended guidelines for endotoxin exposure<br />
(24), <strong>al</strong>l source endotoxin concentrations measured were<br />
markedly greater than the 200-500 EU/m 3 TWA thresholds<br />
for mucus membrane irritation, and the majority of samples<br />
were above the threshold for acute bronchi<strong>al</strong> constriction<br />
(1000-2000 EU/m 3 ). While applying TWA threshold v<strong>al</strong>ues<br />
overestimates worker exposure, it cannot y<strong>et</strong> be excluded<br />
that the re<strong>al</strong> exposure time and endotoxin concentrations to<br />
which workers or nearby residents are exposed are below<br />
threshold he<strong>al</strong>th levels. These results corroborate previous<br />
biosolids studies that c<strong>al</strong>l for further investigation into<br />
endotoxin exposure (5) and help to extend endotoxin<br />
exposure data by providing an emission rate to enable aerosol<br />
transport model investigations.<br />
In addition to the source aerosol concentrations and<br />
emission rate quantities required for use in aerosol exposure<br />
modeling, the relationships b<strong>et</strong>ween bulk biosolids and<br />
aerosols (Figures 3 and 5) provide a broadly applicable<br />
framework for estimating aerosol concentration and emission<br />
rates from a knowledge of bulk biosolids concentration. There<br />
are distinct advantages to this fundament<strong>al</strong> partitioning<br />
approach. The first is that it <strong>al</strong>lows estimation of aerosol<br />
information without the expense, difficulty, and limitations<br />
inherent in measuring bioaerosols and airborne toxins<br />
produced during biosolids land application. Commonly<br />
available aerosol sampling equipment operate at low collection<br />
rates (12.5 L/min), have efficiencies less than 100%,<br />
compromise the infectivity or culturability of microorganisms<br />
during the collection process, and do not have a well<br />
characterized collection efficiency for particles less than 0.5<br />
µm (25). Sampling limitations are exacerbated by the fact<br />
that during biosolids application the source is mobile;<br />
requiring that collection times from stationary samplers be<br />
limited to the short time (less than 2 min) in which spreading<br />
equipment passes. These barriers may result in nond<strong>et</strong>ection<br />
of important and substanti<strong>al</strong> concentrations of specific toxins<br />
or <strong>et</strong>iologic<strong>al</strong> agents. The approach of estimating aerosol<br />
concentrations and emissions based on PM 10 and bulk<br />
biosolids characterization should circumvent these limitations<br />
and move aerosol studies beyond indicator measurements<br />
by estimating specific toxic compound or pathogen<br />
aerosol concentrations based on more easily obtained PM 10<br />
measurements and bulk biosolids an<strong>al</strong>ysisswhere d<strong>et</strong>ection<br />
limits are much lower due to the large sample size possible.<br />
The connection b<strong>et</strong>ween aerosol emissions and bulk biosolids<br />
toxin and pathogen concentration will <strong>al</strong>low aerosol he<strong>al</strong>th<br />
studies to leverage ongoing bulk biosolids toxin and pathogen<br />
monitoring results and convert them into aerosol data.<br />
Biosolids PM 10 concentrations <strong>al</strong>so provide the inh<strong>al</strong>able<br />
particulate matter measurements that are necessary for<br />
d<strong>et</strong>ermining the nonspecific toxicity he<strong>al</strong>th effects of biosolids-derived<br />
bioaerosols.<br />
Fin<strong>al</strong>ly, we note that while aerosol concentration reconstruction<br />
is a gener<strong>al</strong> concept that is broadly applicable to<br />
the vari<strong>et</strong>y of biosolids-derived bioaerosols that emanate from<br />
a discr<strong>et</strong>e source, the relationship b<strong>et</strong>ween source emission<br />
rates and bulk biosolids concentrations presented in Figure<br />
5 is limited to the type of spreader used and dewatered<br />
biosolids. In this study, the ProTwin Slinger side discharge<br />
spreader was used. This particular equipment is common<br />
and the majority of land application is performed with<br />
dewatered biosolids in the 20-30% solids content range (6).<br />
When biosolids emissions are produced from a spreading<br />
scenario that cannot be accurately estimated by the common<br />
case describe here, the m<strong>et</strong>hod described for emission rate<br />
estimation should <strong>al</strong>low for obtaining these rates through<br />
PM 10 and bulk biosolids measurements.<br />
As wastewater treatment in the developed and developing<br />
world continues to move toward centr<strong>al</strong>ized activated sludge<br />
systems, the production of biosolids will increase accordingly.<br />
Furthermore, the much greater quantities of agricultur<strong>al</strong><br />
waste residu<strong>al</strong>s that are commonly land applied, the trend<br />
of encroaching urban areas on agricultur<strong>al</strong> land, and the<br />
he<strong>al</strong>th and nuisance complaints from off-site residents<br />
underlie the need for assessing the saf<strong>et</strong>y and sustainability<br />
of land application. The results presented here, while<br />
providing necessary concentration and emission rate information<br />
for assessing human exposure to biosolids during<br />
the spreading process, most importantly demonstrate a more<br />
VOL. 41, NO. 10, 2007 / ENVIRONMENTAL SCIENCE & TECHNOLOGY 9 3543
tractable, bulk biosolids-based approach for extending<br />
biosolids aerosol exposure assessment to different land<br />
application scenarios and to a broader range of toxins and<br />
pathogens.<br />
Acknowledgments<br />
This work was funded by the Water Environment Research<br />
Foundation (WERF), Project 02-PUM-1.<br />
Literature Cited<br />
(1) Bastian, R. The biosolids (sludge) treatment, benefici<strong>al</strong> use, and<br />
dispos<strong>al</strong> situation in the USA. European WPCJ 1997, 7, 62-72.<br />
(2) U.S. EPA. Biosolid Generation, Use and Dispos<strong>al</strong> in the United<br />
States; U.S. Environment<strong>al</strong> Protection Agency, Office of Research<br />
and Development: Cincinnati, OH, 1999; EPA530-R-99-009.<br />
(3) Harrison, E.; Oaks, S. R. Investigation of <strong>al</strong>leged he<strong>al</strong>th incidents<br />
associated with land application of sewage sludges. New<br />
Solutions 2002, 12, 387-408.<br />
(4) Nation<strong>al</strong> Research Council. Committee on Toxins and Pathogens<br />
in Biosolids Applied to Land: Advancing Standards and Practices;<br />
Nation<strong>al</strong> Research Council: Washington DC, 2002.<br />
(5) Brooks, J. P.; Tanner, B. D.; Gerba, C. P.; Pepper, I. L. The<br />
measurement of aerosolized endotoxin from land application<br />
of Class B biosolids in southeast Arizona. Can. J. Microbiol.<br />
2006, 52, 150-156.<br />
(6) Brooks, J. R.; Tanner, B. D.; Josephson, K. L.; Gerba, C.; Haas,<br />
C. N.; Pepper, I. L. A nation<strong>al</strong> survey on the residenti<strong>al</strong> impact<br />
of biologic<strong>al</strong> aerosols from the land application of biosolids. J.<br />
Appl. Microbiol. 2005, 99, 310-322.<br />
(7) Dowd, S.; Widmer, K.; Pillai, S. Thermotolerant Clostridia as an<br />
airborne pathogen indicator during land application of biosolids.<br />
J. Environ. Qu<strong>al</strong>. 1997, 26, 194-199.<br />
(8) Mocé-Llivina, L.; Muniesa, M.; Pimenta-V<strong>al</strong>e, H.; Lucena, F.;<br />
Jofre, J. Surviv<strong>al</strong> of bacteri<strong>al</strong> indicator species and bacteriophages<br />
after therm<strong>al</strong> treatment of sludge and sewage. Appl. Environ.<br />
Microbiol. 2003, 69, 1452-1456.<br />
(9) Kepner, R. L.; Pratt, J. R. Use of fluorochromes for direct<br />
enumeration of tot<strong>al</strong> bacteria in environment<strong>al</strong> samples: past<br />
and present. Microb. Rev. 1994, 58, 603-615.<br />
(10) American Public He<strong>al</strong>th Association, American Waterworks<br />
Association, and Water Environment Federation. Standard<br />
M<strong>et</strong>hods for the Examination of Water and Wastewater, 20th<br />
ed.; American Public He<strong>al</strong>th Association: Washington, DC, 1998.<br />
(11) Sartory, D. P.; Prichard, D. P.; Holmes, A. M. Enumeration of<br />
sulfite-reducing Clostridia from potable water supplies. Water<br />
Sci. Technol. 1993, 27, 279-282.<br />
(12) Anderson, J. R.; Buseck, P. R.; Patterson, T. L.; Arimoto, R.<br />
Characterization of the Bermuda, tropospheric aerosol by<br />
combined individu<strong>al</strong>-particle and bulk-aerosol an<strong>al</strong>ysis. Atmos.<br />
Environ. 1996, 30, 319-338.<br />
(13) De-Nevers, N. Air Pollution Control Engineering; McGraw-Hill:<br />
Boston, MA, 2000; Vol. 216-219.<br />
(14) Lough, G. C.; Schauer, J. J.; Park, J. S.; Shafer, M. M.; Deminter,<br />
J. T.; Weinstein, J. P. Emissions of m<strong>et</strong><strong>al</strong>s associated with motor<br />
vehicle roadways. Environ. Sci. Technol. 2005, 39, 826-836.<br />
(15) Miller, J. C.; Miller, J. N. Statistics for An<strong>al</strong>ytic<strong>al</strong> Chemistry;<br />
Horwood Limited: West Sussex, England, 1993.<br />
(16) Rusin, P. A.; Maxwell, S. L.; Brooks, J. P.; Gerba, C. P.; Pepper,<br />
I. L. Evidence for the absence of Staphylococcus aureus in land<br />
applied biosolids. Environ. Sci. Technol. 2003, 37, 4027-4030.<br />
(17) Rusin, P. A.; Maxwell, S. L.; Brooks, J. P.; Gerba, C. P.; Pepper,<br />
I. L. Response to comment on “Evidence for the absence of<br />
Staphylococcus aureus in land applied biosolids”. Environ. Sci.<br />
Technol. 2003, 37 (24), 5836.<br />
(18) Sano, D.; Fukushi, K.; Yoshida, Y.; Omura, T. D<strong>et</strong>ection of enteric<br />
viruses in municip<strong>al</strong> sewage sludge by a combination of the<br />
enzymatic virus elution m<strong>et</strong>hod and RT-PCR. Water Res. 2003,<br />
37, 3490-3498.<br />
(19) Shieh, Y. S.; Baric, R. S.; Sobsey, M. D. D<strong>et</strong>ection of low level<br />
of enteric viruses in m<strong>et</strong>ropolitan and airplane sewage. Appl.<br />
Environ. Microbiol. 1997, 63, 4401-4407.<br />
(20) Etyemezian, V.; Ahonen, S.; Nikolic, D.; Gillies, J. A.; Kuhns, H.;<br />
Gill<strong>et</strong>te, D.; Veranth, J. Deposition and remov<strong>al</strong> of fugitive dust<br />
in the arid Southwestern United States: Measurement and<br />
Model Results. Air Waste Manage. Assoc. 2004, 54, 1099-1111.<br />
(21) Tanner, B. D.; Brooks, J. P.; Haas, C. N.; Gerba, C. P.; Pepper,<br />
I. L. Bioaerosol Emission Rate and Plume Characteristics during<br />
Land Application of Liquid Class B Biosolids. Environ. Sci.<br />
Technol. 2005, 39, 1584-1590.<br />
(22) Chen, W. N.; Fryrear, D. W. Aerodynamic and geom<strong>et</strong>ric<br />
diam<strong>et</strong>ers of airborne particles. J. Sed. Res. 2001, 71, 365-371.<br />
(23) ACGIH. TLV/BEI Resources; http://www.acgih.org/TLV/.<br />
(24) Heederik, D.; Douwes, J. Towards an occupation<strong>al</strong> exposure<br />
limit for endotoxins? Ann. Agric. Environ. Med. 1997, 4,17-19.<br />
(25) Willeke, K.; Lin, X. J.; Grinshpun, S. A. Improved aerosol collection<br />
by combined impaction and centrifug<strong>al</strong> motion. Aerosol Sci.<br />
Technol. 1998, 28, 439-456.<br />
Received for review July 27, 2006. Revised manuscript received<br />
November 10, 2006. Accepted February 27, 2007.<br />
ES061786P<br />
3544 9 ENVIRONMENTAL SCIENCE & TECHNOLOGY / VOL. 41, NO. 10, 2007