Project Access Spokane - Spokane County Medical Society
Project Access Spokane - Spokane County Medical Society
Project Access Spokane - Spokane County Medical Society
You also want an ePaper? Increase the reach of your titles
YUMPU automatically turns print PDFs into web optimized ePapers that Google loves.
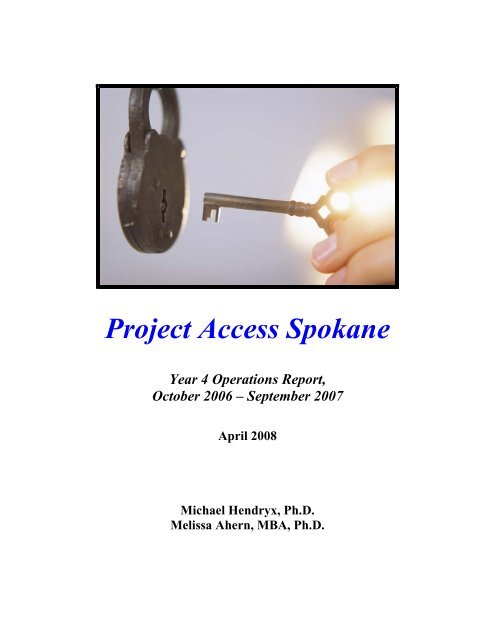
<strong>Project</strong> <strong>Access</strong> <strong>Spokane</strong><br />
Year 4 Operations Report,<br />
October 2006 – September 2007<br />
April 2008<br />
Michael Hendryx, Ph.D.<br />
Melissa Ahern, MBA, Ph.D.
Jeff O’Connor, MD<br />
2008 President<br />
<strong>Spokane</strong> <strong>County</strong> <strong>Medical</strong> <strong>Society</strong><br />
As the 2007 President of the <strong>Spokane</strong> <strong>County</strong> <strong>Medical</strong> <strong>Society</strong>, I am pleased to present the 3 rd<br />
annual <strong>Project</strong> <strong>Access</strong> operations report. Formed in 2003, <strong>Project</strong> <strong>Access</strong> <strong>Spokane</strong> is the only<br />
volunteer network of physicians, hospitals and healthcare providers offering the full range of<br />
healthcare services at no charge to low-income uninsured people in <strong>Spokane</strong> <strong>County</strong>. With over<br />
800 physician volunteers, <strong>Project</strong> <strong>Access</strong> patients receive complex medical care they may<br />
otherwise not be able to obtain.<br />
During this year, <strong>Project</strong> <strong>Access</strong> has made great strides in improving access to medical care for<br />
low-income, uninsured people in our <strong>County</strong>. Strong links with <strong>Spokane</strong>’s primary care<br />
community clinics have increased referrals for specialty and hospital care. Local governments<br />
have continued to generously donate funds to help patients receive prescription medications. As<br />
will be seen in this report, patients received complex medical care for conditions ranging from<br />
heart disease and cancer, to vision and orthopedic problems. Thousands of patients have now<br />
received the care they needed to better provide for their families, and to return to work.<br />
During this last year, community awareness of <strong>Project</strong> <strong>Access</strong> has grown significantly. <strong>Project</strong><br />
<strong>Access</strong> actively collaborates with healthcare providers and community agencies to ensure<br />
patients receive healthcare in a timely, efficient fashion. The <strong>Spokane</strong> Regional Chamber of<br />
Commerce, and the business community, has recognized the valuable community asset that<br />
<strong>Project</strong> <strong>Access</strong> has become. Measuring the Return on Community Investment, <strong>Project</strong> <strong>Access</strong><br />
has contributed nearly $11 of healthcare services for each dollar of funding. Total donated<br />
medical care provided this year equaled $3,365,811. Since seeing its first patient, over<br />
$13,269,617 in health care has been provided to low income uninsured residents of <strong>Spokane</strong><br />
<strong>County</strong>.<br />
The success of <strong>Project</strong> <strong>Access</strong> in improving medical care is evident. By improving healthcare<br />
and access, the whole community experiences positive benefits. With a healthier community,<br />
employers have a better workforce. People are more likely to get and keep jobs that provide<br />
medical benefits. Families experiencing expensive illnesses have a better likelihood of avoiding<br />
bankruptcy.<br />
While <strong>Project</strong> <strong>Access</strong> cannot replace the vital necessity for health insurance coverage for all<br />
people, it does help underserved people get the health care they need. As a physician, I refer<br />
patients to <strong>Project</strong> <strong>Access</strong>, and also donate my services to <strong>Project</strong> <strong>Access</strong> patients. As a member<br />
of our community, I am proud of my fellow physicians and other healthcare providers for<br />
stepping forward to help make <strong>Spokane</strong> a better place to live.<br />
2
Executive Summary<br />
<strong>Project</strong> <strong>Access</strong> is the only network of physicians and hospitals providing the full range of<br />
health care services to low income uninsured residents of <strong>Spokane</strong> <strong>County</strong>. The following report<br />
summarizes the contributions and performance of <strong>Project</strong> <strong>Access</strong> <strong>Spokane</strong> for the forth year of<br />
its operation, covering the period October 2006 through September 2007. This evaluation<br />
includes analytic summaries of the patient population served by <strong>Project</strong> <strong>Access</strong>, including<br />
demographic characteristics, diagnostic mix, dollar values of donated services, and service<br />
utilization patterns. Personal stories of <strong>Project</strong> <strong>Access</strong> patients are included to provide a sense of<br />
the powerful impact that the program has had on the lives of individuals. At the end of the report<br />
we offer recommendations and conclusions regarding the services provided.<br />
During the reporting period, <strong>Project</strong> <strong>Access</strong> provided 6,853 distinct service episodes to<br />
567 people. Service episodes included prescription fills, office visits, surgical interventions,<br />
radiology, pathology, and other services. Services were provided by both specialists and primary<br />
care doctors, and by inpatient and outpatient facilities and other providers. An estimate of the<br />
total value of donated services for the fourth year of operations was $4,759,366. The total costs<br />
of operating <strong>Project</strong> <strong>Access</strong> for the year were $435,695, only 9.8% of the value of donated<br />
services and indicating that <strong>Project</strong> <strong>Access</strong> operates efficiently. Cumulatively, for the first four<br />
years of <strong>Project</strong> <strong>Access</strong>, the estimated value of donated medical services comes to $13,269,617.<br />
Specialty physicians provide a large proportion of all services, with primary care doctors<br />
relatively underrepresented primarily because <strong>Spokane</strong> <strong>County</strong> has 11 low-income primary<br />
clinics such as CHAS, Native Health, People’s Clinic, and <strong>Spokane</strong> Falls Family Clinic that<br />
provide primary care. Patients are referred into <strong>Project</strong> <strong>Access</strong> from various sources throughout<br />
the <strong>Spokane</strong> community. Approximately 68 percent of patients are referred from Federally<br />
Qualified Health Centers (CHAS, Native Health, <strong>Spokane</strong> Falls Family Clinic). Additionally, 11<br />
percent are referred from low-cost Community Clinics (Christ Clinic, ECCO Clinic, People’s<br />
Clinic). The final 21 percent are referred by private physician offices or are self-referrals into<br />
<strong>Project</strong> <strong>Access</strong> by patients who have heard of the program.<br />
<strong>Project</strong> <strong>Access</strong> provides critical medical care and increases access for <strong>Spokane</strong>’s low<br />
income residents. Radiology, gastrointestinal, genitourinary, oncology, and cardiology services<br />
are among the most common types of specialty care. Pharmacy services constitute a large<br />
proportion of the service mix as well; most enrolled patients received one or more prescription<br />
medicines through <strong>Project</strong> <strong>Access</strong>. The most common types of diagnostic categories were<br />
“Symptoms, Signs and Ill Defined Conditions”, followed by significant numbers of<br />
Musculoskeletal, Genitourinary, and Neoplasm diagnoses.<br />
The most notable change in <strong>Project</strong> <strong>Access</strong> services compared to previous years was the<br />
decline in number of patients seen and in number of providers who gave documented services to<br />
<strong>Project</strong> <strong>Access</strong> patients. The total of 567 patients seen in Year 4 is less than any of the previous<br />
three years. Previous figures for number of patients seen were 706, 803 and 845 in Years 1<br />
through 3, respectively. This decline was observed despite a sizeable increase in the number of<br />
reported services provided and in the dollar value of donated services. The reasons for the<br />
decline in patient numbers are unclear but may reflect increased patient access through other<br />
3
means such as Medicaid or Basic Health, or declines in the supply of primary care physicians<br />
that serve as referral sources to <strong>Project</strong> <strong>Access</strong> services. DSHS staff, for example, are on site at<br />
Community Health Centers to screen patients for eligibility for these public programs.<br />
The conclusions of the report suggest that <strong>Project</strong> <strong>Access</strong> provides a unique and highly<br />
valuable service to the community, and that it’s future operation should be supported and<br />
expanded. Given the increase in the overall <strong>Spokane</strong> population of persons in poverty and<br />
persons without health insurance, the decline in number of patients seen by <strong>Project</strong> <strong>Access</strong> is of<br />
considerable concern because it occurs in the face of increasing need for medical care services<br />
for low income persons. The decline should be carefully investigated to determine if patients are<br />
finding adequate access to medical care through other means or if other factors are reducing<br />
necessary access.<br />
“Today I can touch my hands together and say<br />
‘It is good to have strong hands!’<br />
Thanks <strong>Project</strong> <strong>Access</strong>”<br />
-Pricilla,<br />
<strong>Project</strong> <strong>Access</strong> Patient<br />
4
Table of Contents<br />
Page<br />
Introductory Letter 2<br />
Executive Summary: the Impact of <strong>Project</strong> <strong>Access</strong> 3-4<br />
Table of Contents 5<br />
Methods 6<br />
Findings: 7-25<br />
Community Need 7-8<br />
<strong>Project</strong> <strong>Access</strong> Population Demographics 8-10<br />
Utilization of <strong>Project</strong> <strong>Access</strong> Services 10-17<br />
The Value of Professional Contributions 18-19<br />
Operational Expenses vs. Benefits 20<br />
Trends from Year 1 to Year 4 of Operations 21-25<br />
Conclusions and Recommendations 26-27<br />
Author Bios and Acknowledgements 28<br />
Sources 28<br />
Lists of Participating Organizations and Physicians 29-33<br />
5
Methods<br />
Methods of evaluation included analysis of data files provided to us by <strong>Project</strong> <strong>Access</strong>.<br />
These files contained data on patient demographics; diagnostic mix; service mix including<br />
hospitalization, outpatient, and pharmacy services; procedure codes; provider specialty; budget<br />
data; and narrative accounts of <strong>Project</strong> <strong>Access</strong> stories from patients. We provide descriptive<br />
summaries of these data as well as interpretative reports.<br />
The <strong>Spokane</strong> Physician Hospital Community Organization (SPHCO) donated medical<br />
claims management services; pharmacy benefit management systems; and medical utilization<br />
statistics to <strong>Project</strong> <strong>Access</strong>. Demographic data was provided through the Internet-based CARES<br />
system.<br />
‘<strong>Project</strong> <strong>Access</strong> was<br />
extremely helpful when I<br />
needed help. I’m ecstatic<br />
at the care I’ve been<br />
given. If it wasn’t for<br />
<strong>Project</strong> <strong>Access</strong>, my<br />
medical bills would have<br />
made me bankrupt or<br />
passing up quality care<br />
for my injury. My<br />
quality of life has not<br />
been compromised due<br />
to my ability to pay.’<br />
-D.B.<br />
6
Findings<br />
A. Community Need<br />
According to US census figures, 10.1% of <strong>Spokane</strong> <strong>County</strong> residents, and 13.9% of<br />
Eastern Washington residents, were without health insurance in 2004. 1 This regional percentage<br />
translates to 65,339 people. Estimates based on US census data show that 46% of the Eastern<br />
Washington population has annual income that is less than 200% of the Federal Poverty Level<br />
(FPL), $40,000 for a family of 4. 1<br />
Among <strong>Spokane</strong> county adults aged 18-64 rates are even higher: 14.5% of such adults<br />
were without health insurance in 2006. 2 This figure has increased steadily since 1998, when<br />
10.4% of <strong>Spokane</strong> <strong>County</strong> adults 18-64 were uninsured. Persons with lower incomes are at<br />
much greater risk to go without health insurance, as shown in Figure 1.<br />
Individuals without health insurance tend to delay care, and seek care in a variety of<br />
settings. To serve this population, <strong>Spokane</strong> <strong>County</strong> has a healthcare safety-net system that is<br />
comprised of two Federally Qualified Community Clinics, with a combined total of 6 clinic<br />
locations. Additionally, there are several community-based free and low-cost clinics. Hospitals<br />
in <strong>Spokane</strong> <strong>County</strong> provide millions of dollars annually in uncompensated care for the uninsured.<br />
<strong>Project</strong> <strong>Access</strong> actively collaborates with these providers to help ensure patients have access to<br />
total health care, from primary care to complex hospital and specialty care. Through its<br />
volunteer network of physicians, community hospitals and other providers, <strong>Project</strong> <strong>Access</strong><br />
supports the primary care community clinics by creating greater access to total health care.<br />
Patients receive the care they need in a comprehensive fashion, with a goal of earlier diagnosis<br />
and treatment, thereby reducing emergency department visits. Hospitals’ annual charity care<br />
costs are reduced when <strong>Project</strong> <strong>Access</strong> physicians provide care in outpatient settings.<br />
Health risk indicators for <strong>Spokane</strong> <strong>County</strong> include the following statistics. 3 Twenty-one<br />
percent of residents are smokers, including 10% among youth under age 18; 24% of the<br />
population are obese according to Body Mass Index (BMI) measures; and the incidence rate of<br />
cancer in <strong>Spokane</strong> is higher than rates for the state or the nation.<br />
<strong>Spokane</strong> <strong>County</strong> also has a higher poverty rate than the state or the nation. Nearly ½ of<br />
public school children are on federally subsidized food programs. In addition, <strong>Spokane</strong> <strong>County</strong><br />
has lower average annual wages compared to the nation, and yet a higher than average cost of<br />
living. People living in poverty in <strong>Spokane</strong> are more likely than other residents to be obese,<br />
smoke, and suffer from significant medical conditions including depression, arthritis, asthma,<br />
migraines, vision problems, and dental problems. These individuals frequently lack health care<br />
insurance. 38% of those between 100% and 200% of the FPL did not have continuous<br />
healthcare coverage during the last 3 years. 4 They also report they do not receive needed<br />
medical care, delay necessary medical care, and use emergency room services and inpatient<br />
hospital care to receive care. 4 7
To cite one figure, 44% of <strong>Spokane</strong> adults with incomes below poverty were unable to<br />
obtain needed health care in 2003. 4 Uninsurance has been cited as the most significant obstacle<br />
to health care access by <strong>Spokane</strong> community focus groups. 4 Furthermore, as shown in Figure 1,<br />
rates of uninsurance among persons in poverty are increasing. 2 <strong>Project</strong> <strong>Access</strong> is intended to<br />
respond to this critical problem.<br />
Figure 1. Increases in poverty and uninsurance in <strong>Spokane</strong> <strong>County</strong>.<br />
Uninsured Adults by Poverty Level <strong>Spokane</strong><br />
<strong>County</strong>, 1998-2006<br />
30<br />
25<br />
Percent<br />
20<br />
15<br />
10<br />
5<br />
0<br />
1998 2000 2002 2004 2006<br />
=200% FPL<br />
Source: WA State Population Survey 1998 to 2006, Office of Financial Management<br />
The greatest increase in the uninsured population is in the “working poor,” quantified as<br />
those people with incomes between 100% and 200% of Federal Poverty Level. Health care and<br />
insurance are often beyond the reach of this needy population. This group tends to fall through<br />
the cracks in the health care safety net in <strong>Spokane</strong> <strong>County</strong>. Reductions in Federal and State<br />
programs, and the rising cost of health insurance for small employers, have contributed to this<br />
problem. These people are often working, but do not qualify for employer health insurance or<br />
State health care programs such as Medicaid. 5<br />
B. <strong>Project</strong> <strong>Access</strong> Population Demographics<br />
This section of the report summarizes characteristics of the people who used <strong>Project</strong><br />
<strong>Access</strong> services. A total of 567 people were enrolled in <strong>Project</strong> <strong>Access</strong>. This is a decrease from<br />
prior years, including last year when over 800 people were enrolled. Table 1 summarizes nonmissing<br />
characteristics of persons enrolled in <strong>Project</strong> <strong>Access</strong>, compared to 2006 US Census<br />
estimates for <strong>Spokane</strong> <strong>County</strong> as a whole. Compared to the county population, the <strong>Project</strong><br />
<strong>Access</strong> population over-represents women, people of color, and low income people.<br />
8
Table 1. The number of people who used services, by age, gender, income and race/ethnicity.<br />
Demographic<br />
<strong>Project</strong> <strong>Access</strong><br />
Number<br />
<strong>Project</strong> <strong>Access</strong><br />
Percent<br />
Sex<br />
Male 224 39.5% 49.2%<br />
Female 343 60.5% 50.8%<br />
Age<br />
18-29 128 22.6% 24.4%<br />
30-49 244 43.0% 36.1%<br />
50-64 195 34.4% 24.3%<br />
65+ 8 1.4% 15.2%<br />
Household Income<br />
Figure 2. The diagnostic conditions treated within <strong>Project</strong> <strong>Access</strong>.<br />
Number of Patients by Diagnostic Group<br />
250<br />
200<br />
Number<br />
150<br />
100<br />
50<br />
0<br />
Symptoms, signs & ill-defined<br />
Musculoskeletal<br />
Genitourinary<br />
V Codes<br />
Neoplasms<br />
Digestive<br />
Circulatory<br />
Endochrine and metabolic<br />
Injury & poisoning<br />
Skin & subcutaneous<br />
Nervous system & sense organs<br />
Repiratory<br />
Blood & blood forming organs<br />
Infectious & parasitic<br />
Mental disorders<br />
C. Utilization of <strong>Project</strong> <strong>Access</strong> Services (inpatient, outpatient, pharmacy)<br />
Figure 3 shows the number of <strong>Project</strong> <strong>Access</strong> patients who received each service type;<br />
343 patients, for example, received prescription medicine services through <strong>Project</strong> <strong>Access</strong>. This<br />
is an under-count of total service episodes because there were instances where patients received<br />
services but the service provider did not provide <strong>Project</strong> <strong>Access</strong> with the contact data. As with<br />
diagnostic coding, providing contact data to <strong>Project</strong> <strong>Access</strong> adds to the time burden of providers<br />
without contributing to reimbursed dollars for the donated service. The figures below (as for<br />
those in Figure 2) reflect only those services reported to <strong>Project</strong> <strong>Access</strong>.<br />
The great majority of patients used outpatient services provided through practice offices<br />
or hospital ambulatory services. The most expensive service locations, inpatient hospital care<br />
and emergency rooms, were used by few patients: less than 13% used inpatient hospital care and<br />
less than 7% used emergency rooms. <strong>Project</strong> <strong>Access</strong> provides the bulk of its services through<br />
more cost-efficient venues, which is important given the traditional over-reliance on emergency<br />
rooms and the unnecessary hospitalizations that are often identified in the health services<br />
research literature for persons without health insurance.<br />
10
‘Being an almost 63 year old widow living on Social<br />
Security Survivor Benefits, medical insurance was<br />
not in my budget. Just two more years of being<br />
healthy was all I prayed for. Then it happened; I lost<br />
the eyesight in my right eye due to cataracts.<br />
Blindness was my only option for two years until<br />
Medicare kicked in. Then I was told about <strong>Project</strong><br />
<strong>Access</strong>. I ended up with the best eye surgeon in<br />
<strong>Spokane</strong> and was treated like a very special patient.<br />
My right eye now has 20/20 vision. I am wearing a<br />
contact in the left eye and will need cataract surgery<br />
up the road. I never dreamed that I would wish to be<br />
65 years old just for Medicare benefits. Great job<br />
<strong>Project</strong> <strong>Access</strong>!’<br />
-Barbra<br />
Figure 3. Number of <strong>Project</strong> <strong>Access</strong> patients who used various types of services.<br />
Number of Patients Who Received Each Service<br />
Type<br />
Number<br />
500<br />
450<br />
400<br />
350<br />
300<br />
250<br />
200<br />
150<br />
100<br />
50<br />
0<br />
466<br />
343<br />
193<br />
109 94 71<br />
39<br />
11<br />
Office<br />
Prescriptions<br />
Outpatient<br />
Hospital<br />
Other facility<br />
Independent<br />
Lab<br />
Inpatient<br />
Hospitalization<br />
Emergency<br />
Room<br />
Other<br />
11
There were 10,476 total service episodes across all types of service (Figure 4.)<br />
Outpatient office visits accounted for 31% of all service encounters, followed by prescription<br />
services (19%). The use of emergency room services and inpatient hospital services continues<br />
to constitute relatively small proportions of total <strong>Project</strong> <strong>Access</strong> services.<br />
Figure 4. Counts of services by service location.<br />
Number of Services Provided by Service Location<br />
N<br />
3,500<br />
3,000<br />
2,500<br />
2,000<br />
1,500<br />
1,000<br />
500<br />
0<br />
3,228<br />
1,949<br />
1,724<br />
1,451<br />
941<br />
743<br />
335<br />
105<br />
Office<br />
Prescriptions<br />
Outpatient<br />
Hospital<br />
Other facility<br />
Inpatient<br />
Hospitalization<br />
Independent<br />
Lab<br />
Emergency<br />
Room<br />
Other<br />
In previous years, prescriptions were the most common form of service, but prescription use has<br />
declined from earlier times, due to the continued use of an enhanced patient pharmacy benefit<br />
program, and the discontinuation of a special pharmacy benefit that had been in place in previous<br />
years. The discontinuation refers to an allocation that <strong>Project</strong> <strong>Access</strong> received at the end of 2005<br />
from the City of <strong>Spokane</strong> to provide Behavioral Health pharmaceuticals. The majority of the<br />
Behavioral Health prescriptions were filled between October and December 2005, resulting in a<br />
spike in filled prescriptions in December. These funds were expended by January 15, 2006.<br />
12
In early 2006, <strong>Project</strong> <strong>Access</strong> implemented a more sophisticated pharmacy benefit<br />
management program. The <strong>Project</strong> <strong>Access</strong> Pharmacy Committee convened to make adjustments<br />
to the formulary of medications available to patients. These adjustments included replacement of<br />
brand-name medications with their less expensive generic counterparts. When applicable, a<br />
pharmacist was consulted to suggest therapeutic equivalent medications and individualized drug<br />
treatment plans. The <strong>Spokane</strong> <strong>County</strong> <strong>Medical</strong> <strong>Society</strong> formed a Therapeutics Committee to<br />
better manage primary care referrals to ensure patients are receiving the right level of care.<br />
<strong>Project</strong> <strong>Access</strong> identified chronic patients who utilized a large amount of pharmaceuticals, and<br />
implemented case management to assist these patients in applying for pharmaceutical assistance<br />
programs. All of these efforts contributed to the decline in the number of patients with filled<br />
prescriptions across the course of the report year.<br />
Figure 5 summarizes counts of services by provider type. This figure does not include<br />
prescriptions. As in the previous year, the largest provider type was specialty care, accounting<br />
for 38% of all listed services. This percentage, however, is lower than last year when it stood at<br />
46% of all services. The other major categories are services that are hospital-based, ambulatory<br />
surgical centers (which did not appear as a separate category in last year’s report) and “other”<br />
provider types (such as allied health professional services). Hospital-based services include<br />
inpatient, outpatient and emergency room services; most of these are outpatient services. Few<br />
services, 113 or 1.3%, were provided by primary care outpatient providers. This reflects the<br />
greater availability of low-cost primary care in <strong>Spokane</strong> through clinics such as CHAS, whereas<br />
there are few formal low-cost alternative programs for specialty care outside <strong>Project</strong> <strong>Access</strong>.<br />
Figure 5. Counts of services by type of provider<br />
Number of Services Provided by Type of Provider<br />
3,500<br />
3,000<br />
2,500<br />
2,000<br />
1,500<br />
1,000<br />
500<br />
0<br />
3,200<br />
113<br />
778<br />
2,072<br />
1,355<br />
1008<br />
Specialist<br />
Primary Care<br />
Facility<br />
Hospital<br />
Ambulatory surgical center<br />
Other<br />
13
Figure 6 shows the percent of services<br />
provided according to CPT<br />
classification codes. The four most<br />
common types of procedure codes were<br />
Medicine, Pathology and Lab,<br />
Anesthesia, and Radiology. Figures 7<br />
and 8 break down the radiology and<br />
surgery codes, respectively, into<br />
subgroups. The breakdown of<br />
radiology codes demonstrates that<br />
diagnostic radiology is not limited to x-<br />
ray technology but includes the most<br />
sophisticated procedures involving<br />
computer assisted tomography,<br />
magnetic resonance imaging and other<br />
state of the art procedures. The most<br />
common surgical procedure was<br />
cardiovascular, followed by digestive<br />
and genitourinary procedures.<br />
‘I now feel like living! For the past two<br />
and a half years I have endured<br />
tremendous pain, depression, fatigue and<br />
a sense of loss. Thanks to <strong>Project</strong> <strong>Access</strong> I<br />
was able to get surgery that saved my life.<br />
There was no way I could afford the<br />
surgery. Today my eleven year old<br />
daughter does not have to look into my<br />
eyes a d wonder if I would be o.k. She<br />
has her mom back! I told her of the<br />
HEART of the physician who treated me<br />
and she wants to give to others the way he<br />
gave to her mom.’<br />
-P.B.<br />
Figure 6. CPT Procedure Codes by Type.<br />
CPT Codes by Type<br />
%<br />
25<br />
20<br />
15<br />
10<br />
12.4 13.2<br />
11.3<br />
19.3<br />
21<br />
22.8<br />
5<br />
0<br />
Surgery<br />
Radiology<br />
Eval & Management<br />
Anesthesia<br />
Pathology & Lab<br />
Medicine<br />
14
Figure 7. Breakdown of Radiology CPT Codes.<br />
Number of Radiology CPT Codes by Type<br />
300<br />
250<br />
217<br />
243<br />
274<br />
N<br />
200<br />
150<br />
100<br />
131<br />
113<br />
50<br />
0<br />
CAT, PET,<br />
MRI<br />
Other<br />
diagnostic<br />
radiology<br />
Diagnostic<br />
ultrasound<br />
Radiation<br />
Oncology<br />
Nuclear<br />
Medicine<br />
Figure 8. Breakdown of Surgical CPT Codes.<br />
Number of Surgical CPT Codes<br />
N<br />
400<br />
350<br />
300<br />
250<br />
200<br />
150<br />
100<br />
50<br />
0<br />
337<br />
212<br />
147<br />
82 80<br />
14<br />
38 21<br />
Skin<br />
Musculoskeletal<br />
Respiratory<br />
Cardiovascular<br />
Digestive<br />
Genito-urinary<br />
Nervous<br />
Ocular & Auditory<br />
15
We next examined CPT codes according to type of provider, summarized in Table 2.<br />
Specialists provided a range of service types, most commonly evaluation and management,<br />
followed by radiology. Non-hospital facility services were predominantly for pathology and lab<br />
for medicine. These facilities include provider offices coded to the facility and not a particular<br />
provider, as well as urgent care centers, labs, and other places. Hospital services were<br />
predominantly for anesthesia (and other hospital services of course); and services by other<br />
providers (e.g., nurse practitioners, physician assistants) were primarily for medicine CPT codes.<br />
Evaluation and management CPT codes are commonly used for initial physician visits, whereas<br />
medicine CPT codes are commonly used for medical procedures such as immunizations and<br />
diagnostic examinations.<br />
Table 2. Number of Procedure Types by Provider<br />
Specialist<br />
Primary<br />
Care<br />
Facility<br />
Hospital<br />
or<br />
hospitalist<br />
Other<br />
Evaluation and<br />
633 29 668 312 22<br />
Management<br />
Anesthesia 157 2 574 851 66<br />
Surgery 478 10 822 285 16<br />
Radiology 618 16 661 419 28<br />
Pathology and Lab 593 40 1,510 516 8<br />
Medicine 480 11 1,254 509 823<br />
The final analysis for this section of the report on utilization concerns the service<br />
breakdown by specialty area. Figure 9 summarizes the number of non-missing, non-pharmacy<br />
services provided by specialty type. Physical therapy was the most frequently used service type,<br />
followed by laboratory, radiology, and oncology. The “Others” category included many<br />
remaining service specialty types, including ENT (n=74), ophthalmology (n=52), podiatry<br />
(n=56), emergency medicine (n=62), and many other categories in smaller numbers.<br />
‘In 2001, I found a lump in my right breast and was told it was cancer.<br />
I had a lumpectomy that year, and haven’t had issues since. A few<br />
months ago, I felt another lump under my breast. At my exam they<br />
found uterine polyps in addition to my breast lump. All I could think<br />
was ‘here we go again.’ The business where I work doesn’t provide<br />
insurance and I was scared. That’s when my son found <strong>Project</strong><br />
<strong>Access</strong>. Thankfully, I’m still a breast cancer survivor. I’m currently<br />
on a six week regime of hormones. If those don’t help, I will need to<br />
have surgery for my uterine polyps. I’m so grateful for <strong>Project</strong><br />
<strong>Access</strong>. You guys have done nothing but help me. Thank you so<br />
very much for all your time and dedication to your program, and for<br />
the patients you help on a daily basis.’<br />
-Donna<br />
16
Figure 9. Use of various service specialties.<br />
Service Count by Provider Specialty<br />
1000<br />
900<br />
800<br />
700<br />
600<br />
500<br />
400<br />
300<br />
200<br />
100<br />
0<br />
Physical therapy<br />
872<br />
742 721<br />
453 488<br />
401<br />
257 206 178 172 147 137 135 101 91 90<br />
Laboratory<br />
Cardiology<br />
Pathology<br />
Obstetrics/Gynecology<br />
Anesthesia<br />
Radiology<br />
Oncology<br />
Orthopedics<br />
Hospital or Hospitalist<br />
Surgery<br />
Gastroenterology<br />
Urology<br />
Family Practice<br />
Dermatology<br />
Others<br />
‘I was told I needed to have my gallbladder<br />
removed ASAP! I had no insurance and didn’t<br />
know what I was going to do. My doctor told<br />
me about <strong>Project</strong> <strong>Access</strong>. I qualified for the<br />
program and had my surgery. Come to find<br />
out I had hundreds of gallstones and my<br />
gallbladder was not even functioning. It would<br />
have eventually burst! If it wasn’t for <strong>Project</strong><br />
<strong>Access</strong> and the wonderful doctor that<br />
performed my surgery, I don’t know what I<br />
would have done. <strong>Project</strong> <strong>Access</strong> is a great<br />
program for people without insurance such as<br />
myself. They treated me with the greatest<br />
respect, even though I’m low income. I was<br />
treated no differently than someone who has<br />
insurance. They actually saved my life!’<br />
-Brenda<br />
17
D. The Value of Professional Contributions<br />
We created an estimate of the dollar value of donated professional contributions to<br />
<strong>Project</strong> <strong>Access</strong>. The preliminary sum of donated services, including pharmacy, was $3,521,359.<br />
This equates to an average donated medical service of $6,387 per patient. Table 3 and Figure 10<br />
summarize these dollar values, first by disease category and then by service location. For<br />
disease category, the largest value of services was provided for the treatment of neoplasms,<br />
accounting for $960,483 of donated care; Table 4 does not include Pharmacy because pharmacy<br />
claims data were not linked to the diagnostic utilization data.<br />
As shown in Figure 10, inpatient hospital care was the site of the greatest dollar<br />
contributions to <strong>Project</strong> <strong>Access</strong>, followed by outpatient hospital-based services and then office<br />
based services.<br />
Table 3. Dollars value of services by diagnostic group (excludes Pharmacy.)<br />
Diagnosis<br />
Donated<br />
Service<br />
Amounts in<br />
Dollars<br />
Neoplasms $960,483<br />
Musculoskeletal 242,179<br />
Circulatory 345,853<br />
Genitourinary 370,818<br />
Digestive 394,089<br />
Symptoms, signs and ill-defined 285,407<br />
Endocrine, metabolic and immune 40,849<br />
Respiratory 56,824<br />
Nervous system and sense organs 50,504<br />
Infectious and parasitic 15,063<br />
Blood and blood forming organs 13,421<br />
Mental Disorders 3,133<br />
Skin and subcutaneous 14,573<br />
Injury and poisoning 338,071<br />
V-codes 347,984<br />
18
Figure 10. Dollar value of services by service location.<br />
Value of Donated Services<br />
$1,200,000<br />
$1,000,000<br />
$800,000<br />
$600,000<br />
$400,000<br />
$200,000<br />
$0<br />
$42,108<br />
Prescriptions<br />
$805,891<br />
$683,214<br />
Office<br />
Outpatient<br />
Hospital<br />
$34,383<br />
Independent<br />
Lab<br />
$1,105,247<br />
Inpatient<br />
Hospitalization<br />
$773,201<br />
Other facility<br />
$66,395 $11,492<br />
Emergency<br />
Room<br />
Other<br />
However, the total observed value of donated services for the year, $3,521,359, is an<br />
underestimate because some services provided by physicians or others were never submitted to<br />
<strong>Project</strong> <strong>Access</strong>. The work involved in submitting the encounter would add to the work demand<br />
of the donated encounter without adding to reimbursed dollars to the provider. This<br />
phenomenon of underreporting was also noted in the previous <strong>Project</strong> <strong>Access</strong> reports. 8,9,10 Based<br />
on estimates from previous reports that only about 74% of services are reported we can impute a<br />
value for non-reported services; this raises the total value of donated services to $4,437,633.<br />
Combining donated services across the first four years of <strong>Project</strong> <strong>Access</strong> results in a value<br />
of donated services equaling $13,269,617.<br />
In year 1 of operations, inpatient hospital services (the most expensive form of care)<br />
accounted for 56% of all donated service dollars; 8 in year 2 this figure dropped to 39% 9 , and<br />
declined further in year 3 to 20% 10. In the current year, however, this figure has increased to<br />
31% of donated service value. This could reflect: 1) a reversal in trends such that inpatient care<br />
is now used more often because of the serious nature of patient illness, 2) greater cost increases<br />
for inpatient relative to outpatient care, and/or 3) more complete reporting of inpatient hospital<br />
services.<br />
19
E. Operational Expenses vs. Benefits<br />
As indicated in the previous section, the estimated value of donated services to the<br />
community provided by <strong>Project</strong> <strong>Access</strong> equaled $4,437,633. Total expenses to run <strong>Project</strong><br />
<strong>Access</strong> included personnel costs totaling $342,021 and administration and operational costs<br />
totaling $93,674, for a grand total of $435,695. This grand total for operational expenses<br />
represents only 9.8% of the value of donated services, indicating that <strong>Project</strong> <strong>Access</strong> is an<br />
efficient mechanism by which to coordinate and provide health care services to low income<br />
people without other access to care.<br />
Revenue to operate <strong>Project</strong> <strong>Access</strong> totaled $397,758. Most donations to <strong>Project</strong> <strong>Access</strong><br />
occur at the beginning and end of the tax year. By the end of FY 2007 <strong>Project</strong> <strong>Access</strong> had a<br />
positive net margin. Sources of revenue included grants, local healthcare organizations,<br />
community businesses, and other miscellaneous sources.<br />
Figure 11 summarizes the percent of revenue from the various sources. Healthcare<br />
organizations provided 32% of the operating budget for <strong>Project</strong> <strong>Access</strong>. When one considers<br />
that health care providers and organizations also donated services valued at over $1.71 million,<br />
the generosity of the <strong>Spokane</strong> health care community in supporting <strong>Project</strong> <strong>Access</strong> becomes even<br />
more pronounced.<br />
Figure 11. Percentage of <strong>Project</strong> <strong>Access</strong> revenue from the various sources.<br />
Sources of Revenue for <strong>Project</strong> <strong>Access</strong><br />
8%<br />
2%<br />
11%<br />
32%<br />
Healthcare<br />
Organizations<br />
Public and Private<br />
Grants<br />
Community Businesses<br />
47%<br />
Interest and Misc.<br />
Wasington State CHCC<br />
Grant<br />
20
F. Trends from Year 1 to Year 4 of Operations<br />
The number of <strong>Project</strong> <strong>Access</strong> patients increased from Year 1 to Year 3 of operations, but<br />
as shown in Figure 12, Year 4 showed a decline in number of patients seen. However, the total<br />
number of services provided and the total estimated dollar value of donated services increased in<br />
Year 4 compared to previous years. Whether this reflects changes in reporting practices or<br />
increased volume of service provision per patient is unclear.<br />
Figure 12. Number of patients seen and services provided, years 1 through 4.<br />
\<br />
Patients and Services over Time<br />
900<br />
12,000<br />
800<br />
700<br />
10,000<br />
Patients<br />
600<br />
500<br />
400<br />
300<br />
8,000<br />
6,000<br />
4,000<br />
Services<br />
Patients<br />
Services<br />
200<br />
100<br />
2,000<br />
0<br />
0<br />
Year 1 Year 2 Year 3 Year 4<br />
Figure 13 shows the counts of services provided in Years 1 through 4 by provider type.<br />
Primary care services have declined, hospital-based services have increased, and the addition of<br />
the ambulatory surgical center category contributes to the increase in total service volume.<br />
As shown below in Figure 14, changes over time reflect increased use of outpatient-based<br />
hospital services in the third year, but a decline in services in this setting in the fourth year. The<br />
use in inpatient hospitalization services, however, increased in year 4 relative to year 3.<br />
21
Figure 13. Trends in service use by provider type, years 1 through 3.<br />
Number of Services by Provider Type, Years 1-4<br />
4,000<br />
3,500<br />
3,000<br />
2,500<br />
2,000<br />
1,500<br />
1,000<br />
500<br />
0<br />
Year 1<br />
Year 2<br />
Year 3<br />
Year 4<br />
Specialist<br />
Primary<br />
Care<br />
Hospital<br />
Facility<br />
Other<br />
Ambulatory<br />
surgical<br />
center*<br />
* Ambulatory surgical centers not reported as a separate category in prior years.<br />
Figure 14. Services in inpatient and outpatient hospital-based settings, Year 2 through Year 4.<br />
Number of Services in Inpatient and Outpatient<br />
Hospital Settings<br />
2500<br />
2265<br />
2000<br />
1724<br />
N<br />
1500<br />
1000<br />
500<br />
933<br />
571<br />
567<br />
941<br />
Inpatient<br />
Outpatient<br />
0<br />
Year 2 Year 3 Year 4<br />
22
Figure 15 shows the utilization levels of procedure types over the four years of <strong>Project</strong> <strong>Access</strong><br />
operations. Compared to previous years the biggest change is the increase in reported anesthesia<br />
services. There was an increase in pathology and lab services and relative declines in the other<br />
categories.<br />
Figure 15. Percent of procedure types, years 1 through 4.<br />
Procedure Types for Year 1 - 4<br />
%<br />
30<br />
25<br />
20<br />
15<br />
10<br />
5<br />
0<br />
Eval & Management<br />
Anesthesia<br />
Surgery<br />
Radiology<br />
Pathology & Lab<br />
Medicine<br />
‘After finishing a two year stint with Americorps, I was very low on finances. I<br />
contacted <strong>Project</strong> <strong>Access</strong> to find out about the program. Since then I utilized the<br />
program to receive monthly medications and a doctors visit. All of my experiences<br />
have been outstanding. <strong>Project</strong> <strong>Access</strong> has been consistently professional,<br />
knowledgeable, friendly and helpful. <strong>Project</strong> <strong>Access</strong> provided me much needed<br />
services during these difficult times. I am recently employed again and I’m on my way<br />
toward financial stability. During the last several months I discovered how vital <strong>Project</strong><br />
<strong>Access</strong> is to not only myself, but to our entire community. My deepest thanks to your<br />
fine organization.’<br />
-Barbara<br />
23
Figure 16 shows the diagnostic mix of patients over the four years of <strong>Project</strong> <strong>Access</strong>.<br />
Year 4 saw relative increases in digestive disorders and neoplasms, and a decline in<br />
genitourinary diagnoses, among other fluctuations.<br />
Figure 16. Percent of diagnostic categories, years 1 through 4.<br />
Percent of Diagnoses by Year<br />
Mental disorders<br />
Congenital & perinatal<br />
Blood and blood forming organs<br />
Infectious & parasitic<br />
Respiratory<br />
Skin & subcutaneous<br />
Injury & poisoning<br />
Endocrine, metabolic & immune<br />
Digestive<br />
Nervous system & sense organs<br />
Neoplasms<br />
Circulatory<br />
V-codes<br />
Musculoskeletal<br />
Genitourinary<br />
Symptoms, signs & ill-defined<br />
Year 1 Year 2<br />
Year 3 Year 4<br />
0 5 10 15 20 25<br />
%<br />
24
Finally, Figure 17 shows the number of providers who contributed services to <strong>Project</strong><br />
<strong>Access</strong> in each of its first four years. This figure includes only providers who provided at least<br />
one documented service, and may under-represent providers to the extent that some provided<br />
service without sending documentation to <strong>Project</strong> <strong>Access</strong>. The number of providers increased in<br />
each of the first three years but declined in year 4. Reasons for the decline cannot be identified<br />
with certainty, but may include reductions in the number of <strong>Project</strong> <strong>Access</strong> referrals that<br />
specialty physicians will accept due to economic pressures (e.g., rising health care costs relative<br />
to reimbursements, or changes in physician ownership or practice size. 11 ) Other possibilities<br />
include closer review of referrals before scheduling appointments, or the downstream result of<br />
fewer referrals to <strong>Project</strong> <strong>Access</strong> from primary care sources. Fewer primary care referrals may in<br />
turn be the result of better patient access to services such as Medicaid or Basic Health, or the<br />
result of the decreased supply of primary care physicians serving low income populations in<br />
CHAS and the <strong>Spokane</strong> Falls Family Clinic. 12 There may also be reductions in the number of<br />
specialty physicians in some selected areas.<br />
Figure 17. Number of participating providers, years 1 through 3.<br />
Providers<br />
N<br />
900<br />
800<br />
700<br />
600<br />
500<br />
400<br />
300<br />
200<br />
100<br />
0<br />
800<br />
700<br />
634<br />
446<br />
Year 1 Year 2 Year 3 Year 4<br />
25
Conclusions for Year 4 of operations include:<br />
Conclusions and Recommendations<br />
• <strong>Project</strong> <strong>Access</strong> provides a unique and critical service that would otherwise be unavailable<br />
to uninsured, low income people.<br />
• Specialists are used much more heavily than primary care providers. This is a<br />
consequence of the fact that <strong>Spokane</strong> contains other options for low income persons to<br />
receive primary care, but few other formal programs for specialty care. Many <strong>Project</strong><br />
<strong>Access</strong> patients are in fact referred from low income primary care clinics such as CHAS.<br />
• Medicine, followed by Pathology and Laboratory services, are the most frequently used<br />
specialty areas.<br />
• Radiology services are used for a variety of purposes including diagnosis and advanced<br />
treatment.<br />
• Cardiovascular surgery is the most common type of surgical procedure.<br />
• Pharmacy encounters make up 19% of all service encounters and constitute an important<br />
part of the <strong>Project</strong> <strong>Access</strong> network.<br />
• Outpatient office contacts are the most common type of encounter and mostly occur for<br />
specialty care<br />
• Use of inpatient hospital services had declined in previous years but now appears to<br />
constitute a larger proportion of total services than before. Whether this reflects a true<br />
increase or an increase in reporting practices is unclear.<br />
• The number of patients treated and the number of providers participating in <strong>Project</strong><br />
<strong>Access</strong> increased from Year 1 through Year 3 of operations, but declined in Year 4. The<br />
number of reported services, however, continued to increase in Year 4.<br />
• The total estimated dollar value of <strong>Project</strong> <strong>Access</strong> services for the first four years of<br />
operations combined is $13,269,617.<br />
• The costs of running <strong>Project</strong> <strong>Access</strong> came to only 9.8% of the value of donated services,<br />
indicating that <strong>Project</strong> <strong>Access</strong> is an efficient mechanism by which to coordinate and<br />
provide health services to those in greatest need.<br />
• Stories from patients reveal cases where life-saving treatment was provided through<br />
<strong>Project</strong> <strong>Access</strong> that would otherwise have not been available.<br />
• <strong>Project</strong> <strong>Access</strong> is a strong service organization doing important work that should be<br />
supported and expanded.<br />
Recommendations for future <strong>Project</strong> <strong>Access</strong> operations include:<br />
• Investigate why the total number of patients seen and the number of providers who<br />
donated services declined in Year 4 after previous years of growth. Is this the result of<br />
improved access to care through other public programs, or impaired access to care for<br />
persons who have no alternatives? To what extent is the reduction the result of tighter<br />
26
• Determine whether the increase in the dollar value of donated services and the number<br />
of services provided is a real increase or represents a change in reporting practices. This<br />
is especially important given that the increase in services appears to result at least in part<br />
from an increase in inpatient hospital care.<br />
• Strengthen ties to and utilization of primary care, especially referrals from private<br />
primary care providers.<br />
• Investigate whether a more equitable distribution of services across specialty care areas<br />
may be possible or appropriate.<br />
• Investigate the impacts of <strong>Project</strong> <strong>Access</strong> on the healthcare system, especially decreased<br />
emergency room visits by enrollees, and decreased level of illness acuity upon<br />
enrollment through improved primary and specialty care.<br />
• Engage in fund raising efforts with local healthcare organizations and business,<br />
government agencies, and private foundations to expand and sustain program support.<br />
• Increase community awareness of the availability and benefits of <strong>Project</strong> <strong>Access</strong>.<br />
‘By the time I really needed medical attention, we were pulling more from savings<br />
than my social security was depositing. This sprig, after a month of severe<br />
bronchitis, a friend insisted I go to the clinic for help. They referred me to <strong>Project</strong><br />
<strong>Access</strong>. In the course of two months, <strong>Spokane</strong>’s caring and gracious medical<br />
community provided many services. The cost of these procedures was about one<br />
fifth of our annual income. I simply would not have undergone the procedures<br />
without <strong>Project</strong> <strong>Access</strong>. I am extremely grateful for the opportunity to be the<br />
recipient of such care. When I tell others about what <strong>Project</strong> <strong>Access</strong> has done for me,<br />
I often get tears in my eyes. At every appointment I was treated with respect,<br />
dignity and the utmost professionalism.’<br />
-C.K.<br />
27
Author Bios and Acknowledgements<br />
Michael Hendryx, Ph.D. is Research Director of the Institute for Health Policy Research<br />
at West Virginia University School of Medicine, and former Associate Professor at Washington<br />
State University. Melissa Ahern, MBA, Ph.D. is a tenured Associate Professor in<br />
Pharmacotherapy, Washington State University <strong>Spokane</strong>. Together they have a combined 47<br />
years of post-graduate experience in health services research and in working with community<br />
and state level health care organizations on applied research and evaluation.<br />
Data regarding patient demographics and provider claims were compiled, verified, and<br />
summarized by Erin McCandless. The <strong>Spokane</strong> PHCO generously provided claims data. John<br />
Driscoll, <strong>Project</strong> <strong>Access</strong> Executive Director, reviewed drafts of this report and offered many<br />
useful comments and suggestions.<br />
Sources<br />
1. Uninsured in Eastern Washington. <strong>Spokane</strong> Regional Health District, March 2005.<br />
2. Galster, C.L. and Riffe, A.S. Characteristics and Trends of the Adult Uninsured in<br />
<strong>Spokane</strong> <strong>County</strong>. July 2007. <strong>Spokane</strong> Regional Health District, Community Health<br />
Assessment Center.<br />
3. <strong>Spokane</strong> Counts. An updated summary of selected public health indicators technical<br />
document. <strong>Spokane</strong> Regional Health District 2005.<br />
4. An Assessment of the Health Care System. Indicators Monitoring Health Care<br />
<strong>Access</strong>, 2005 Update. <strong>Spokane</strong> Regional Health District 2005.<br />
5. Facing <strong>Spokane</strong> Poverty. <strong>Spokane</strong> Regional Health District 2002.<br />
6. Jones, D.P. Community Indicators Initiative Report, <strong>Spokane</strong>. July, 2005. Institute<br />
for Public Policy and Economic Analysis, Eastern Washington University.<br />
7. <strong>Spokane</strong> <strong>County</strong> Demographics. <strong>Spokane</strong> Regional Health District. Available at<br />
http://www.srhd.org/downloads/info_pubs/SCDemographics.pdf. <strong>Access</strong>ed 12-08-<br />
06.<br />
8. Bunting, D. <strong>Project</strong> <strong>Access</strong> <strong>Spokane</strong>: Year One Program Assessment and Operations<br />
Analysis, October 2003 to September 2004. Institute for Public Policy and Economic<br />
Analysis, Eastern Washington University.<br />
9. Hendryx, M. & Ahern, M. <strong>Project</strong> <strong>Access</strong> <strong>Spokane</strong>. Year 2 Operations Report,<br />
October 2004 – September 2005. Washington State University <strong>Spokane</strong>.<br />
10. Hendryx, M. & Ahern, M. <strong>Project</strong> <strong>Access</strong> <strong>Spokane</strong>. Year 3 Operations Report,<br />
October 2005 – September 2006. Washington State University <strong>Spokane</strong>.<br />
11. Cunningham, P.J. & Hadley, J. Effects of changes in income and practice<br />
circumstances on physicians’ decisions to treat charity and Medicaid patients. The<br />
Milbank Quarterly, 2008, 86, 91-123.<br />
12. Driscoll, J. Growing access issues. The Message: a Monthly Newsletter of the<br />
<strong>Spokane</strong> <strong>Medical</strong> <strong>Society</strong>, April 2008.<br />
28
MUNICIPALITIES, ORGANIZATIONS, FOUNDATIONS, GROUPS, AND<br />
INDIVIDUALS PROVIDING FINANCIAL OR IN-KIND SUPPORT<br />
TO PROJECT ACCCESS<br />
(NOT YET UPDATED)<br />
American West Bank<br />
Physicians Insurance<br />
Aventis Pharmaceuticals<br />
Premera Blue Cross<br />
Avista Foundation<br />
Providence Health and Services (Holy<br />
Bank of America<br />
City of Airway Heights<br />
City of Cheney<br />
Family, Sacred Heart, and Deer Park<br />
Hospitals)<br />
Robert Wood Johnson Foundation<br />
City of Deer Park<br />
Sacred Heart <strong>Medical</strong> Center Print Shop<br />
City of Liberty Lake<br />
<strong>Spokane</strong> Alliance<br />
City of <strong>Medical</strong> Lake<br />
<strong>Spokane</strong> Association of Health Care<br />
City of <strong>Spokane</strong><br />
Underwriters<br />
City of <strong>Spokane</strong> Valley<br />
<strong>Spokane</strong> <strong>County</strong><br />
Community Health Plan of Washington<br />
<strong>Spokane</strong> <strong>County</strong> Department of Health<br />
Downtown Kiwanis<br />
<strong>Spokane</strong> <strong>County</strong> <strong>Medical</strong> Library<br />
Dynamic Bracing<br />
<strong>Spokane</strong> <strong>County</strong> <strong>Medical</strong> <strong>Society</strong><br />
Empire Health Services (Deaconess and<br />
Foundation<br />
Valley Hospitals) <strong>Spokane</strong> Downtown Rotary Club #21<br />
Family Home Care Corporation<br />
<strong>Spokane</strong> Regional Chamber of Commerce<br />
Frederick Stearns Foundation<br />
Sterling Savings Bank<br />
Foundation Northwest<br />
Susan G. Koman Foundation<br />
Group Health Community Foundation<br />
Telect<br />
Health Improvement Partnership<br />
Thompson’s Custom Orthotics & Prosthetics<br />
Intercollegiate College of Nursing<br />
Town of Millwood<br />
Itronix Corporation<br />
United Way of <strong>Spokane</strong><br />
LeMaster & Daniels, PLLC<br />
Washington Health Foundation<br />
Martin Investment Group<br />
Washington Trust Bank<br />
Mike and Muffy Murphy Fund<br />
Wheeler Charitable Trust<br />
Molina Health Care of Washington<br />
Women Helping Women Fund<br />
Norco<br />
Yakima Valley Farm Workers Clinic<br />
Pierce Trust<br />
29
ORGANIZATIONS DONATING MEDICAL SERVICES TO PROJECT ACCESS<br />
Deaconess <strong>Medical</strong> Center<br />
Deer Park Hospital<br />
Family Home Care<br />
Holy Family Hospital<br />
Incyte Pathology<br />
Inland Imaging, LLC<br />
Pathology Associates <strong>Medical</strong> Laboratories<br />
(PAML)<br />
Sacred Heart <strong>Medical</strong> Center<br />
<strong>Spokane</strong> Radiology Consultants, LLC<br />
St. Luke’s Rehabilitation Institute<br />
Valley Hospital & <strong>Medical</strong> Center<br />
COMMUNITY CLINICS AND ORGANIZATIONS REFERRING TO<br />
PROJECT ACCESS PROVIDER NETWORK<br />
Anna Ogden Hall<br />
Breast and Cervical Health Program<br />
Cancer Care Northwest<br />
Cancer Patient Care<br />
Community Health Association of <strong>Spokane</strong><br />
Christ Clinic<br />
Deaconess <strong>Medical</strong> Center<br />
Deer Park Hospital<br />
Department of Social and Health Services<br />
East Central Community Organization<br />
Clinic<br />
Family Home Care<br />
Family Medicine <strong>Spokane</strong><br />
Health For All<br />
Holy Family Hospital<br />
Hope Partners<br />
House of Charity<br />
Internal Medicine <strong>Spokane</strong><br />
NATIVE Health<br />
People’s Clinic<br />
Planned Parenthood<br />
Rockwood Clinic<br />
Sacred Heart <strong>Medical</strong> Center<br />
<strong>Spokane</strong> Falls Family Clinic<br />
<strong>Spokane</strong> Mental Health<br />
<strong>Spokane</strong> Regional Health District<br />
St. Luke’s Rehabilitation Institute<br />
Union Gospel Mission<br />
Valley Hospital and <strong>Medical</strong> Center<br />
VNA Home Health Care Services<br />
30
INDIVIDUALS DONATING MEDICAL SERVICES TO PROJECT ACCESS<br />
Joseph Abate, MD<br />
Veronique Alcaraz, MD<br />
Susan Alexander, MD<br />
Daniela Alexianu, MD<br />
Mihai Alexianu, MD<br />
Merry Alto, MD<br />
Michael Amstutz, PT<br />
Karl Anders, MD<br />
C. Chris Anderson, MD<br />
Cristian Andronic, MD<br />
Roxana Andronic, MD<br />
Robert Arnett, MD<br />
Amy Backer, MD<br />
Chad Bailey, MSN<br />
Walter Balek, MD<br />
Sol Barnett, MD<br />
Shawn Barrong, MD<br />
Craig Barrow, MD<br />
Mark Bassett, MD<br />
Thomas Bassler, MD<br />
Lauren Bathurst, DC<br />
Braden Batkoff, MD<br />
Timothy Bax, MD<br />
Robert Bazzano, PA<br />
Patrick Beaulaurier, MD<br />
Diane Beernick, ARNP<br />
Gary Bell, MD<br />
Charles Benage, MD<br />
William Bender, MD<br />
William Bennett, MD<br />
Monica Blykowski-May, MD<br />
James Bingham, MD<br />
Timothy Bishop, MD<br />
Zdenek Bocek, MD<br />
Christopher Bogarosh, MD<br />
Kevin Bond, DC<br />
Andrew Boulet, MD<br />
Eric Bowton, MD<br />
William Bradley, MD<br />
Robert Bray, MD<br />
Heather Brennan, MD<br />
Jeff Bresnahan, MD<br />
Andrew Bright, MD<br />
R Steven Brisbois, MD<br />
Charles Brondos, MD<br />
Michael Brophy, MD<br />
Brian Budenholzer, MD<br />
Jeffrey Bunn, MD<br />
John Cambareri, MD<br />
Daniel Cammack, MD<br />
Christel Carlson, MD<br />
Scott Carlson, MD<br />
Stephen Carlson, MD<br />
H. Ken Cathcart, DO<br />
Stuart Cavalieri, MD<br />
Arvin Chaudhry, MD<br />
Joseph Charyk, MD<br />
Janice Christensen, MD<br />
Robert Clark, MD<br />
Ronald Cocchiarella, MD<br />
James Colquhoun, MD<br />
Kyle Colvin, MD<br />
Nelson Roger Cooke, MD<br />
Thomas Cotter, MD<br />
Gregory Cover, MD<br />
Svetlana Cox, MD<br />
Douglas Creel, MD<br />
Don Cubberley, MD<br />
Michael Cunningham, MD<br />
Phillip Curtis Jr, MD<br />
Bruce Cutter, MD<br />
Joseph Cvancara, MD<br />
Stephen Darling, MD<br />
John Steven Davis, MD<br />
Joseph Davis, MD<br />
Steven Davis, PA<br />
Philip Delich, MD<br />
John Demakas, MD<br />
Michael Detar, MD<br />
Daniel D‘Hulst, MD<br />
Mark Didier, MD<br />
Daniel Dionne, MD<br />
Michael Dixson, MD<br />
Ronald Douglas, DPM<br />
James Doyle, MD<br />
William Dubiel, MD<br />
Paul Thompson Dunn, MD<br />
Michael Eaton, MD<br />
John Everett, MD<br />
Robert Fairbanks, MD<br />
Thomas Fairchild, MD<br />
Robert Fairfax, MD<br />
William Faloon, MD<br />
Terese Fandel, MD<br />
Robert Farner, MD<br />
Michael Fay, MD<br />
Stuart Fealk, MD<br />
Peter Fern, MD<br />
Michael Ferries, MD<br />
Roger Fincher, MD<br />
Joseph Duncan Fitterer, MD<br />
Lisa Flagg, NAC<br />
Tod Fleming, PA<br />
Susan Friesen, MD<br />
Bryan Fuhs, MD<br />
Carol Gahl, PA<br />
Timothy Gardner, MD<br />
Edward L Garman, MD<br />
Roger Garvin, MD<br />
Robin Gavelin, MD<br />
James Gerding, MD<br />
Robert Gersh, MD<br />
Michael Gillum, MD<br />
Florence Gin, MD<br />
James Goff, MD<br />
Michael Golden, MD<br />
John Gollhofer, MD<br />
Steven Goodell, MD<br />
Francis Goodman, MD<br />
Debra Gore, MD<br />
Marvin Gottschall, MD<br />
George Grable, MD<br />
Janice Graham, MD<br />
31
David Greeley, MD<br />
Todd Green, MD<br />
Jay Groepper, MD<br />
Elizabeth Grosen, MD<br />
David Gruber, MD<br />
Joseph Gunselman, DO<br />
Carol Guthrie, MD<br />
Margaret Haddon, MD<br />
John Hahn, MD<br />
Lloyd Halpern, MD<br />
Thomas Halvorson, MD<br />
Robert Handy, MD<br />
John Hatcher, MD<br />
Meredith Heick, MD<br />
Michael Henneberry, MD<br />
Richard Herdener, MD<br />
Rodney Hestdalen, MD<br />
John Heusner, MD<br />
Alisa Hideg, MD<br />
Howard Hirsch, MD<br />
Jeffrey Hirschauer, MD<br />
Glen Hiss, MD<br />
Brent Hjermstad, MD<br />
David Hoak, MD<br />
Scott Hoefer, MD<br />
Darren Hollenbaugh, MD<br />
C Frederick Hollon, MD<br />
Edwin Holmes III, MD<br />
Gunnar Holmquist, MD<br />
Steven Hong, MD<br />
Bruce Hopkins, MD<br />
Peter Horn, MD<br />
Michael Hostetler, MD<br />
Philip Huber, MD<br />
Karen Ireland, MD<br />
Cathy Iron, MD<br />
Jeffrey Jamison, DO<br />
Marek Janout, MD<br />
Maria Janout, MD<br />
Alan Johnson, MD<br />
D’arcy Johnson, MD<br />
Eric Johnson, MD<br />
Jerry Johnson, PT<br />
Stephen Johnson, MD<br />
Samuel Joseph, DO<br />
Geoffrey Julian, MD<br />
Keith Kadel, MD<br />
Roy Kanter, MD<br />
Guy Katz, MD<br />
Hakan Kaya, MD<br />
Glenn Kellogg, MD<br />
Robert Kerr, MD<br />
Tycho Kersten, MD<br />
Michael Kestell, MD<br />
William Keyes, MD<br />
Michael Kirsch, MD<br />
John Kivle, OD<br />
Lori Knapton, MD<br />
Michael Kody, MD<br />
Lynn Kohlmeier, MD<br />
Michael Kwasman, MD<br />
Raymond Kwik, MD<br />
Daniel Larson, MD<br />
Andre LaSalle, MD<br />
Thomas Laselle, MD<br />
Mary Lawlor, MD<br />
Eric Leavitt, MD<br />
Jerry Leclaire, MD<br />
Pierre Leimgruber, MD<br />
Michael Lemberger, MD<br />
Timothy Lessmeier, MD<br />
Dale Lewis, MD<br />
Kevin Lewis, MD<br />
Terri Lewis, MD<br />
Henry Lin, MD<br />
Paul Lin, MD<br />
John Long, DO<br />
Dieter Lubbe, MD<br />
Gregory Luna, MD<br />
Kirk Lund, MD<br />
David Maccini, MD<br />
Mark MacFarlane, MD<br />
R Dean Martz, MD<br />
Kelley Mathia, MD<br />
Paula Mays, PT<br />
John McCarthy, MD<br />
Susan McFadden, ARNP<br />
John McKinnon, PT<br />
Shane McNevin, MD<br />
Paige McReynolds, PT<br />
Kevin McVey, MD<br />
Timothy Meyer, MD<br />
David Mikkelsen, MD<br />
Andrew Miller ARNP<br />
Gregory Miller, MD<br />
Patrick Miller, MD<br />
Mitchell Minana, MD<br />
Stephanie Moline, MD<br />
George Momany, MD<br />
Christopher Montague, MD<br />
Margaret Montana, MD<br />
Kaiulani Morimoto, MD<br />
Dan Mornin, MD<br />
Elizabeth Mornin, MD<br />
Gerhard Muelheims, MD<br />
Jan Mueller, MD<br />
Mark Mueller, MD<br />
David Munoz, MD<br />
Brian Murphy, MD<br />
Daniel Murray, MD<br />
Stephen Murray, MD<br />
Paul Myers, MD<br />
John Naylor, MD<br />
Gary Newkirk, MD<br />
Joni Nichols, MD<br />
C. Nixon-Klewenim, PT<br />
Anne Oakley, MD<br />
Russell Oakley, MD<br />
Jeffrey O’Connor, MD<br />
Michael Oefelein, MD<br />
Jovan Ojdrovic, MD<br />
Eric Orme, MD<br />
Terri Oskin, MD<br />
Wade Otte, MD<br />
Frank Otto, MD<br />
Robert Parker, PT<br />
Linda Partoll, MD<br />
Maryam Parviz, MD<br />
Stephen Penaskovic, MD<br />
James Perry, MD<br />
Geraldine Peterdy, MD<br />
Elizabeth Peterson, MD<br />
John Peterson, MD<br />
Harold Preiksaitis, MD<br />
Michael Puruckherr, MD<br />
Rodney Raabe, MD<br />
John Rademacher, MD<br />
Nicholas Ranson, MD<br />
Brad Ratcliff, MD<br />
Robin Ratcliff, MD<br />
Debra Ravasia, MD<br />
Matthew Rawlins, MD<br />
D Scott Redman, MD<br />
Kathleen Reilly, MD<br />
Edward Reisman, MD<br />
Jay Reynolds, MD<br />
Thomas Richardson, MD<br />
Wayne Riches, MD<br />
Russell Rider, MD<br />
Robert Riggs, MD<br />
Michael Ring, MD<br />
Timothy Ritchey, MD<br />
Kirsten Robinson, MD<br />
32
David Rogers, MD<br />
John Romano, MD<br />
Paul Rosenbaum, PT<br />
Stacie Sanders, MD<br />
Trent Sanders, MD<br />
Anthony Santiago, MD<br />
William Sayres, MD<br />
Thomas Schaff, MD<br />
Mark Schemmel, MD<br />
Cheryl Schieffer, PT<br />
Mariah Schimpf, MD<br />
Peter Schlegel, MD<br />
William Schulte, MD<br />
Amaryllis Scott, MD<br />
David Scott, MD<br />
Cameron Seibold, MD<br />
Samuel Selinger, MD<br />
Brian Seppi, MD<br />
Anthony Sestero, MD<br />
Robert Sestero, MD<br />
Fredric Shepaard, MD<br />
John Shuster, MD<br />
Michael Sikora, MD<br />
Daniel Simonson, MD<br />
Erik Skoog, MD<br />
Michael Skrei, MD<br />
Dennis Small, MD<br />
Barbara Smit, MD<br />
Nanette Smith, MD<br />
Melissa Sousley, MD<br />
David Stagaman, MD<br />
Howard Stang, MD<br />
Craig Stephens, PT<br />
William Stifter, MD<br />
William Stovall, MD<br />
Kenneth Symington, MD<br />
Gordon Teel, MD<br />
MD<br />
Mark Terry, MD<br />
Susan Tewel, MD<br />
Susan Thompson, MD<br />
David Thorne, MD<br />
Sandra Tidwell, MSN<br />
Richard Treloar, MD<br />
Rodney Trytko, MD<br />
Steven Uhron, MD<br />
Russell VanderWilde, MD<br />
David Vanos, MD<br />
Wayne Venters, MD<br />
Alex Verhoogen, MD<br />
Robert Wales, MD<br />
Janet Walker, MD<br />
Staci Ward, MD<br />
Alexandra Wardzala, MD<br />
David Watling, MD<br />
Lyle Wendling, MD<br />
Jane Whetzel, PA-C<br />
Jeffery White, MD<br />
Curtis Wickre, MD<br />
Robert Wigert, MD<br />
James Wilhelm, MD<br />
Jeffrey Williams, MD<br />
Michael Williams, MD<br />
Jeffrey Wills, PT<br />
Jay Wittenkeller, MD<br />
Karen Wohlen, MD<br />
Robert Wood, PA<br />
John Wurst, MD<br />
Douglas Wysham, MD<br />
Brian Zeranski, MD<br />
Mancong Zhang, MD<br />
Xavier Zielinski, MD<br />
Joan Zimmer, ARNP<br />
Christopher Zylak, MD<br />
33


