Substrate Bumping for Micro BGA - Speedline Technologies
Substrate Bumping for Micro BGA - Speedline Technologies
Substrate Bumping for Micro BGA - Speedline Technologies

Create successful ePaper yourself
Turn your PDF publications into a flip-book with our unique Google optimized e-Paper software.
Table 2: Factors and level <strong>for</strong> print DOE<br />
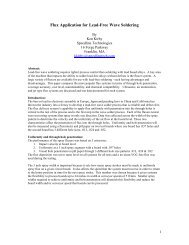
Results and Discussion:<br />
The standard order design table <strong>for</strong> the printing<br />
experiment is shown in figure 2. A “repeat” noise<br />
strategy was adopted <strong>for</strong> this experiment to address<br />
run-to-run variations. The board was designed to<br />
understand the effect of various pad size, web size<br />
and pad location. Figure 5 shows the sampling<br />
strategy <strong>for</strong> the study presented here. To make the<br />
discussion simple, results from two locations are<br />
presented here. Figures 6 & 7 shows the main effect<br />
plot and pareto chart <strong>for</strong> no-clean paste <strong>for</strong> location 4<br />
(pad size 200µ) and location 12 (pad size 125µ)<br />
respectively.<br />
To minimize noise, the experiment was fully<br />
randomized with 4 repeats (4 boards per run order).<br />
The noise was further controlled by printing all 4<br />
boards with one print stroke only; front to rear<br />
squeegee direction.<br />
There were several challenges encountered during the<br />
experimental stage: the biggest one being the<br />
limitation of KY 300 to inspect deposit size below<br />
100 microns. There<strong>for</strong>e, data from pads under 100<br />
microns were excluded from the analysis process.<br />
Gage R&R<br />
To ensure minimum experimental variability a Gage<br />
R&R study was conducted on the KY300 SPI by<br />
inspecting one printed board 20 times. Results from<br />
the gage study are shown in table 3. Both volume and<br />
height repeatability are well within the acceptable<br />
range. Based on this result, the gage was considered<br />
to be adequate.<br />
Table 3. Gage R&R from KY300<br />
Volume Repeatability = 15.198 % (3 Sigma)<br />
Height Repeatability = 4.843 um (3 Sigma)<br />
Pad #of<br />
Pad<br />
Size<br />
X<br />
Size<br />
Y<br />
Solder<br />
shape<br />
Vol<br />
GRR<br />
Ht<br />
GRR<br />
0 1875 0.198 0.198 1 8.929 1.827<br />
1 525 0.178 0.178 1 6.052 1.278<br />
Figure 5. DOE sampling strategy<br />
Mean TE<br />
50.29683<br />
70<br />
65<br />
60<br />
50<br />
45<br />
40<br />
35<br />
-1<br />
-0.5<br />
0<br />
0.5<br />
0<br />
Print Speed<br />
1<br />
Term<br />
Print Pressure<br />
Print Speed*Separation Speed<br />
Print Speed*Print Pressure<br />
Separation Speed<br />
Print Speed*Print Pressure*Separation Speed<br />
Print Pressure*Separation Speed<br />
Print Speed<br />
-1<br />
-0.5<br />
Estimate<br />
-7.594489<br />
-5.036974<br />
-4.416037<br />
3.258721<br />
2.457414<br />
-2.103566<br />
0.946250<br />
0<br />
0.5<br />
0<br />
Print<br />
Pressure<br />
1<br />
-1<br />
-0.5<br />
0<br />
0.5<br />
0<br />
Separation<br />
Speed<br />
Figure 6. Result <strong>for</strong> no-clean paste, location 4.<br />
Mean TE<br />
37.16677<br />
50<br />
45<br />
40<br />
35<br />
30<br />
25<br />
20<br />
-1<br />
-0.5<br />
0<br />
0.5<br />
0<br />
Print Speed<br />
1<br />
Term<br />
Print Speed*Print Pressure*Separation Speed<br />
Print Speed<br />
Print Speed*Print Pressure<br />
Separation Speed<br />
Print Speed*Separation Speed<br />
Print Pressure*Separation Speed<br />
Print Pressure<br />
Main effect plot<br />
Main effect plot<br />
-1<br />
-0.5<br />
Estimate<br />
5.421119<br />
-3.995863<br />
-2.484561<br />
1.749264<br />
0.634162<br />
-0.612079<br />
0.050882<br />
0<br />
0.5<br />
0<br />
Print<br />
Pressure<br />
1<br />
Pareto chart<br />
-1<br />
-0.5<br />
Pareto chart<br />
0<br />
0.5<br />
0<br />
Separation<br />
Speed<br />
Figure 7. Result <strong>for</strong> no-clean paste, location 12.<br />
1<br />
1