Yr End Results 31-8-95 - Final - Singapore Press Holdings
Yr End Results 31-8-95 - Final - Singapore Press Holdings
Yr End Results 31-8-95 - Final - Singapore Press Holdings
You also want an ePaper? Increase the reach of your titles
YUMPU automatically turns print PDFs into web optimized ePapers that Google loves.
1(a)<br />
SINGAPORE PRESS HOLDINGS LIMITED<br />
Reg. No. 198402868E<br />
(Incorporated in <strong>Singapore</strong>)<br />
ANNOUNCEMENT<br />
AUDITED RESULTS FOR THE YEAR - AUGUST <strong>31</strong>, 2006<br />
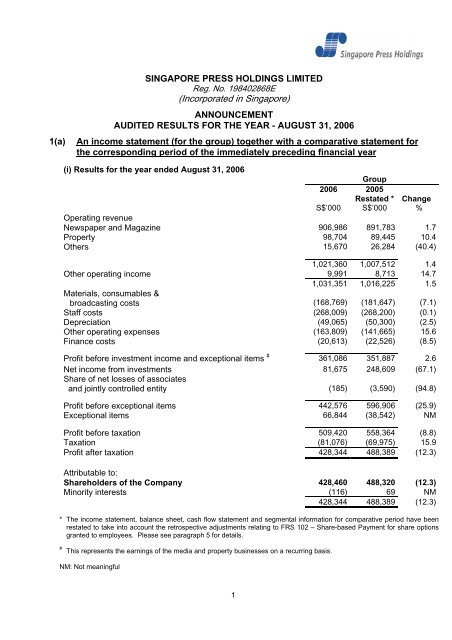
An income statement (for the group) together with a comparative statement for<br />
the corresponding period of the immediately preceding financial year<br />
(i) <strong>Results</strong> for the year ended August <strong>31</strong>, 2006<br />
Group<br />
2006 2005<br />
Restated * Change<br />
S$’000 S$’000 %<br />
Operating revenue<br />
Newspaper and Magazine 906,986 891,783 1.7<br />
Property 98,704 89,445 10.4<br />
Others 15,670 26,284 (40.4)<br />
1,021,360 1,007,512 1.4<br />
Other operating income 9,991 8,713 14.7<br />
1,0<strong>31</strong>,351 1,016,225 1.5<br />
Materials, consumables &<br />
broadcasting costs (168,769) (181,647) (7.1)<br />
Staff costs (268,009) (268,200) (0.1)<br />
Depreciation (49,065) (50,300) (2.5)<br />
Other operating expenses (163,809) (141,665) 15.6<br />
Finance costs (20,613) (22,526) (8.5)<br />
Profit before investment income and exceptional items # 361,086 351,887 2.6<br />
Net income from investments 81,675 248,609 (67.1)<br />
Share of net losses of associates<br />
and jointly controlled entity (185) (3,590) (94.8)<br />
Profit before exceptional items 442,576 596,906 (25.9)<br />
Exceptional items 66,844 (38,542) NM<br />
Profit before taxation 509,420 558,364 (8.8)<br />
Taxation (81,076) (69,975) 15.9<br />
Profit after taxation 428,344 488,389 (12.3)<br />
Attributable to:<br />
Shareholders of the Company 428,460 488,320 (12.3)<br />
Minority interests (116) 69 NM<br />
428,344 488,389 (12.3)<br />
* The income statement, balance sheet, cash flow statement and segmental information for comparative period have been<br />
restated to take into account the retrospective adjustments relating to FRS 102 – Share-based Payment for share options<br />
granted to employees. Please see paragraph 5 for details.<br />
# This represents the earnings of the media and property businesses on a recurring basis.<br />
NM: Not meaningful<br />
1
(ii)<br />
Notes:<br />
Profit before taxation is arrived at after accounting for:<br />
Group<br />
2006 2005<br />
Restated * Change<br />
S$’000 S$’000 %<br />
Share-based payment expenses (7,371) (6,374) 15.6<br />
Net foreign exchange loss from operations (1,978) (2,2<strong>31</strong>) (11.3)<br />
(Allowance)/Write-back of allowance for bad &<br />
doubtful debts and bad debts written off<br />
(net of bad debts recovery) (1,270) 3,530 NM<br />
Allowance for stocks obsolescence (net of<br />
write-back of allowance) (218) (<strong>31</strong>1) (29.9)<br />
Profit on sale of internally-managed<br />
investments 20,132 175,869** (88.6)<br />
Profit on sale of externally-managed<br />
investments - # 23,334 (100.0)<br />
Fair value (loss)/gain of<br />
- Internally-managed assets at fair value<br />
through profit and loss (138) - NM<br />
- Externally-managed assets at fair value<br />
through profit and loss 10,010 # - NM<br />
- Derivative instruments 4,588 - NM<br />
** Included net gain of S$128.5 million on disposal of a substantial portion of Group’s interest in StarHub<br />
Limited.<br />
#<br />
With the adoption of FRS 39, these investments are now re-measured at fair value and the loss on remeasurement<br />
is taken to the income statement.<br />
2
1(b)(i) A balance sheet (for the issuer and group), together with a comparative<br />
statement as at the end of the immediately preceding financial year<br />
Balance Sheets As At<br />
Group<br />
Company<br />
Aug <strong>31</strong>, Aug <strong>31</strong>, Aug <strong>31</strong>, Aug <strong>31</strong>,<br />
2006 2005 2006 2005<br />
Restated<br />
Restated<br />
S$'000 S$'000 S$'000 S$'000<br />
CAPITAL EMPLOYED<br />
Share capital 432,807^ <strong>31</strong>8,082 432,807^ <strong>31</strong>8,082<br />
Share premium -^ 89,206 -^ 89,206<br />
Treasury shares (12,018) - (12,018) -<br />
Reserves 332,424 15,678 51,012 13,451<br />
Retained profit 1,293,182 1,198,237 653,656 768,530<br />
Shareholders’ interests 2,046,3<strong>95</strong> 1,621,203 1,125,457 1,189,269<br />
Minority interests 2,342 2,271 - -<br />
Total equity 2,048,737 1,623,474 1,125,457 1,189,269<br />
EMPLOYMENT OF CAPITAL<br />
Non-current assets<br />
Property, plant and equipment 501,891 530,358 299,578 <strong>31</strong>8,543<br />
Investment property 1,130,890 1,059,000 - -<br />
Interests in subsidiaries - - 386,812 386,812<br />
Interests in associates 69,729 28,075 - 29,160 29,160<br />
Long-term investments 403,466 121,005 39,273 3,362<br />
Derivative financial instruments 9,855 - - -<br />
Intangible assets 11,554 11,029 - -<br />
Amount owing by subsidiaries - - 771,291 804,379<br />
Amount owing by associates 6,051 6,029 6,020 6,012<br />
Amount owing by jointly controlled entity - 33 - -<br />
Other non-current assets 5,177 4,691 5,029 4,616<br />
2,138,613 1,760,220 1,537,163 1,552,884<br />
Current assets<br />
Stocks 34,579 30,870 33,935 30,591<br />
Trade debtors 100,342 92,660 85,687 80,361<br />
Other debtors and prepayments 11,093 21,528 4,221 7,014<br />
Short-term investments 671,196 653,590 - -<br />
Derivative financial instruments 2,339 - - -<br />
Cash held as fixed deposits 55,297 45,373 16,047 25,360<br />
Cash and bank balances 26,090 24,819 15,545 16,424<br />
900,936 868,840 155,435 159,750<br />
Total assets 3,039,549 2,629,060 1,692,598 1,712,634<br />
Current liabilities<br />
Trade creditors 82,756 74,443 42,891 43,053<br />
Other creditors and accrued liabilities 119,633 125,067 99,222 103,297<br />
Borrowings 667 - - -<br />
Current taxation 104,932 88,298 69,292 55,544<br />
307,988 287,808 211,405 201,894<br />
Non-current liabilities<br />
Deferred taxation 72,046 67,777 52,454 55,8<strong>95</strong><br />
Borrowings 610,778 650,000 - -<br />
Amount owing to subsidiaries - - 303,282 265,576<br />
Amount owing to an associate - 1 - -<br />
682,824 717,778 355,736 321,471<br />
Total liabilities 990,812 1,005,586 567,141 523,365<br />
Net assets 2,048,737 1,623,474 1,125,457 1,189,269<br />
^<br />
Following the amendments to the Companies Act (“The Companies (Amendment) Act 2005”) on 30 January 2006, any amounts standing to the credit of<br />
the Company’s share premium account and capital redemption reserve account shall become part of the Company’s share capital. Accordingly, the share<br />
premium account and capital redemption reserve account have been combined into the share capital account.<br />
3
1(b)(ii)Aggregate amount of group’s borrowings and debt securities<br />
Group Borrowings<br />
Amount repayable in one year<br />
As at August <strong>31</strong>, 2006 As at August <strong>31</strong>, 2005<br />
Secured<br />
S$’000<br />
Unsecured<br />
S$’000<br />
Secured<br />
S$’000<br />
Unsecured<br />
S$’000<br />
667 - - -<br />
Amount repayable after one year<br />
As at August <strong>31</strong>, 2006 As at August <strong>31</strong>, 2005<br />
Secured<br />
S$’000<br />
Unsecured<br />
S$’000<br />
Secured<br />
S$’000<br />
Unsecured<br />
S$’000<br />
610,778 - 650,000 -<br />
Details of collateral<br />
The secured bank loan facilities as at August <strong>31</strong>, 2006 comprised the following:<br />
(a)<br />
Term loan facilities of S$650 million (August <strong>31</strong>, 2005: S$650 million)<br />
undertaken by a subsidiary, Times Properties Private Limited (“Times<br />
Properties”), which commenced on July 11, 2005, with a tenure of one year.<br />
During the financial year, Times Properties had repaid S$40 million prior to the<br />
maturity of the term loan on July 11, 2006.<br />
The term loan undertaken by Times Properties was refinanced by another<br />
subsidiary, Orchard 290 Ltd upon maturity on July 11, 2006. The new term<br />
loan, which commenced on July 11, 2006, has a tenure of five years and was<br />
classified accordingly as a non-current liability. No partial repayment was made<br />
for the new term loan during the financial year.<br />
The term loan is secured by way of a legal mortgage on the Group’s investment<br />
property, a debenture over the assets of Orchard 290 Ltd, an assignment of<br />
rental proceeds from the investment property and the insurances on the<br />
investment property.<br />
(b) Term loan facilities of S$2 million undertaken by another subsidiary, SPH<br />
MediaBoxOffice Pte Ltd (“SPHMBO”), which commenced on September 20,<br />
2005, with a tenure of three years and a fixed repayment schedule. The term<br />
loan, drawn down on October <strong>31</strong>, 2005, is secured by way of fixed charge on<br />
certain assets (“Secured Assets”) of SPHMBO, an assignment of all rights and<br />
benefits arising from all advertising/leasing contracts in relation to the Secured<br />
Assets and insurances on the Secured Assets.<br />
SPHMBO had repaid S$555,000 up to August <strong>31</strong>, 2006.<br />
4
1(c)<br />
A cash flow statement (for the group), together with a comparative statement for the<br />
corresponding period of the immediately preceding financial year<br />
Consolidated Cash Flow Statement for the Year ended August <strong>31</strong><br />
2006 2005<br />
S$'000 S$'000<br />
Cash Flows from Operating Activities<br />
Profit before taxation 509,420 558,364<br />
Adjustments for :<br />
Amortisation of intangible assets 575 552<br />
Depreciation 49,065 50,300<br />
Development expenditure written off 387 -<br />
Profit on disposal of property, plant and equipment (429) (86)<br />
Finance costs 20,613 22,526<br />
Net income from investments (81,675) (248,609)<br />
Share of net losses of associates and<br />
jointly controlled entity 185 3,590<br />
Exceptional items (66,844) 38,542<br />
Gain on disposal of subsidiary - (2)<br />
Share-based payment expenses 7,371 6,374<br />
Other non-cash items (165) -<br />
Operating cash flow before working capital changes 438,503 4<strong>31</strong>,551<br />
Changes in working capital :<br />
Stocks (3,709) (6,092)<br />
Prepaid content rights - (2,209)<br />
Debtors 5,018 (10,559)<br />
Creditors (3,204) (26,689)<br />
436,608 386,002<br />
Income tax paid (72,539) (67,884)<br />
Dividends paid (363,186) (381,270)<br />
Dividends paid (net) by a subsidiary to a minority shareholder (30) -<br />
853 (63,152)<br />
(Increase)/decrease in other assets (486) 360<br />
Exchange translation difference (221) 250<br />
Net cash from/(used in) operating activities 146 (62,542)<br />
5
Consolidated Cash Flow Statement for the Year ended August <strong>31</strong> (cont’d)<br />
2006 2005<br />
S$'000 S$'000<br />
Cash Flows from Investing Activities<br />
Purchase of property, plant and equipment (18,273) (15,677)<br />
Proceeds on disposal of property, plant and equipment 698 12,280<br />
Additions to investment property (1,743) (13,148)<br />
Acquisition of intangible assets – magazine title (1,100) -<br />
Acquisition of business by a subsidiary (net of cash acquired) (387) -<br />
Acquisition of interests in subsidiaries (net of cash acquired) 97 (23,748)<br />
Acquisition of interests in associates/jointly controlled entity (42,696) (33,342)<br />
Net proceeds from divestment of interests<br />
in subsidiaries and an associate - 5,837<br />
Amounts owing by associates (23) (47)<br />
Amounts owing by a jointly controlled entity (93) (33)<br />
Loan to an associate - (6,000)<br />
Loan to a minority shareholder (1,369) -<br />
Purchase of long-term investments (5,064) (2,870)<br />
Proceeds on disposal/redemption of long-term investments 16,055 198,325<br />
Purchase of short-term investments (433,170) (264,303)<br />
Proceeds on disposal of short-term investments 354,810 182,907<br />
Net decrease/(increase) in funds under management 133,183 (69,922)<br />
Investment income 81,675 252,163<br />
82,600 222,422<br />
Add/(Less): Items not involving movement of funds<br />
Changes in fair value of financial instruments (4,450) -<br />
Impairment of internally-managed investments 4,220 -<br />
Profit on sale of internally-managed investments (20,132) (175,869)<br />
Exchange translation loss 1,090 -<br />
Allowance for diminution in value of<br />
internally-managed investments - 1,557<br />
Accretion of discount on bonds - (2)<br />
Amortisation of premium on bonds - 89<br />
Effective interest on bonds (623) -<br />
Net cash from investing activities 62,705 48,197<br />
Cash Flows from Financing Activities<br />
Proceeds from bank loans 2,000 22,500<br />
Repayment of bank loans (40,555) (136,500)<br />
Finance costs (20,613) (22,526)<br />
Proceeds on issue of shares by the Company 19,530 28,442<br />
Share buy-back (12,018) -<br />
Net cash used in financing activities (51,656) (108,084)<br />
Net increase/(decrease) in cash and cash equivalents 11,1<strong>95</strong> (122,429)<br />
Cash and cash equivalents at beginning of year 70,192 192,621<br />
Cash and cash equivalents at end of year 81,387 70,192<br />
6
1(d)(i)<br />
A statement (for the issuer and group) showing either (i) all changes in equity or (ii) changes in equity other than those arising from<br />
capitalisation issues and distributions to shareholders, together with a comparative statement for the corresponding period of the<br />
immediately preceding financial year<br />
Statements of Changes in Total Equity for the Year ended August <strong>31</strong><br />
(a) Group<br />
______________________________ _<br />
Capital Share-based Fair Exchange<br />
Share Share Redemption Treasury Capital Compensation Hedging Value Translation Retained Minority Total<br />
Capital^ Premium^ Reserve^ Shares Reserve Reserve Reserve Reserve Reserve Profit Interests Equity<br />
S$’000 S$’000 S$’000 S$’000 S$’000 S$’000 S$’000 S$’000 S$’000 S$’000 S$’000 S$’000<br />
Balance as at<br />
September 1, 2005 <strong>31</strong>8,082 89,206 4,509 - 2,005 - - - 222 1,207,179 2,271 1,623,474<br />
Effect of adopting FRS 102 - - - - - 8,942 - - - (8,942) - -<br />
__________ _________ _______ ________ _______ ________ ________ __________ _____ ____________ _______ ____________<br />
As restated <strong>31</strong>8,082 89,206 4,509 - 2,005 8,942 - - 222 1,198,237 2,271 1,623,474<br />
Effect of adopting FRS 39 - - - - - - (4,305) 309,345 - 29,662 - 334,702<br />
__________ _________ _______ ________ _______ ________ ________ __________ _____ ____________ _______ ____________<br />
<strong>31</strong>8,082 89,206 4,509 - 2,005 8,942 (4,305) 309,345 222 1,227,899 2,271 1,<strong>95</strong>8,176<br />
Net fair value changes on<br />
available-for-sale financial assets - - - - - - - (1,210) - - - (1,210)<br />
Net fair value changes on<br />
cash flow hedges - - - - - - 11,845 - - - - 11,845<br />
Exchange translation difference - - - - - - - - (302) - - (302)<br />
Net gains/(losses) recognised<br />
directly in equity - - - - - - 11,845 (1,210) (302) - - 10,333<br />
Profit for the financial year - - - - - - - - - 428,460 (116) 428,344<br />
__________ _________ _______ ________ _______ ________ ________ __________ _____ ____________ _______ ____________<br />
Total recognised gains/(losses) - - - - - - 11,845 (1,210) (302) 428,460 (116) 438,677<br />
Share-based payment expenses - - - - - 7,371 - - - - - 7,371<br />
Issue of shares from September 1,<br />
2005 to January 30, 2006 529 9,769 - - - (539) - - - - - 9,759<br />
Issue of shares from January <strong>31</strong>,<br />
2006 to August <strong>31</strong>, 2006 10,712 - - - - (941) - - - - - 9,771<br />
Transfer to/(from) 103,484 (98,975) (4,509) - - - - - - - - -<br />
Dividends - - - - - - - - - (363,186) (30) (363,216)<br />
Lapse of share options - - - - - (9) - - - 9 - -<br />
Share buyback - held as<br />
treasury shares - - - (12,018) - - - - - - - (12,018)<br />
Purchase of additional equity<br />
interests in subsidiaries - - - - - - - - - - (165) (165)<br />
Acquisition of subsidiaries - - - - - - - - - - 382 382<br />
__________ _________ _______ ________ _______ ________ ________ __________ _____ ____________ _______ ____________<br />
Balance as at August <strong>31</strong>, 2006 432,807 - - (12,018) 2,005 14,824 7,540 308,135 (80) 1,293,182 2,342 2,048,737<br />
__________ _________ _______ ________ _______ ________ ________ __________ _____ ____________ _______ ____________<br />
^ Following the amendments to the Companies Act (“The Companies (Amendment) Act 2005”) on 30 January 2006, any amounts standing to the credit of the Company’s share premium account and capital redemption<br />
reserve account shall become part of the Company’s share capital. Accordingly, the share premium account and capital redemption reserve account have been combined into the share capital account.<br />
7
Statements of Changes in Total Equity for the Year ended August <strong>31</strong> (cont’d)<br />
(a)<br />
Group<br />
______________________<br />
Capital Share-based Exchange<br />
Share Share Redemption Capital Compensation Translation Retained Minority Total<br />
Capital Premium Reserve Reserve Reserve Reserve Profit Interests Equity<br />
S$’000 S$’000 S$’000 S$’000 S’$000 S’$000 S’$000 S$’000 S$’000<br />
Balance as at September 1, 2004 <strong>31</strong>6,527 62,<strong>31</strong>9 4,509 2,005 - 4 1,093,755 518 1,479,637<br />
Effects of adopting FRS 102 - - - - 2,568 - (2,568) - -<br />
__________ _________ ________ ________ _________ ___________ ______________ __________ ______________<br />
As restated <strong>31</strong>6,527 62,<strong>31</strong>9 4,509 2,005 2,568 4 1,091,187 518 1,479,637<br />
Exchange translation difference - - - - - 218 - - 218<br />
Gain recognised directly in equity - - - - - 218 - - 218<br />
Profit for the financial year - - - - - - 488,320 69 488,389<br />
__________ _________ ________ ________ _________ ___________ ______________ __________ ______________<br />
Total recognised gains - - - - - 218 488,320 69 488,607<br />
Share-based payment expenses - - - - 6,374 - - - 6,374<br />
Issue of shares 1,555 - - - - - - - 1,555<br />
Premium on issue of shares - 26,887 - - - - - - 26,887<br />
Dividends - - - - - - (381,270) - (381,270)<br />
Acquisition of subsidiaries - - - - - - - 1,684 1,684<br />
__________ _________ ________ ________ _________ ___________ ______________ ____________ ______________<br />
Balance as at August <strong>31</strong>, 2005 <strong>31</strong>8,082 89,206 4,509 2,005 8,942 222 1,198,237 2,271 1,623,474<br />
__________ _________ ________ ________ _________ ___________ ______________ ____________ ______________<br />
8
Statements of Changes in Total Equity for the Year ended August <strong>31</strong> (cont’d)<br />
(b)<br />
Company<br />
_________<br />
Capital Share-based Fair<br />
Share Share Redemption Treasury Compensation Value Retained Total<br />
Capital^ Premium^ Reserve^ Shares Reserve Reserve Profit Equity<br />
S$’000 S$’000 S$’000 S$’000 S$’000 S$’000 S$’000 S$’000<br />
Balance as at September 1, 2005 <strong>31</strong>8,082 89,206 4,509 - - - 777,472 1,189,269<br />
Effect of adopting FRS 102 - - - - 8,942 - (8,942) -<br />
_________ ________ ________ _________ _________ _________ ___________ ___________<br />
As restated <strong>31</strong>8,082 89,206 4,509 - 8,942 - 768,530 1,189,269<br />
Effect of adopting FRS 39 - - - - - 29,138 99 29,237<br />
_________ ________ ________ _________ _________ _________ ___________ ___________<br />
<strong>31</strong>8,082 89,206 4,509 - 8,942 29,138 768,629 1,218,506<br />
____<br />
Net fair value changes on availablefor-sale<br />
financial assets - - - - - 7,050 - 7,050<br />
Gain recognised directly in equity - - - - - 7,050 - 7,050<br />
Profit for the financial year - - - - - - 248,204 248,204<br />
_________ ________ ________ _________ _________ _________ ___________ ___________<br />
Total recognised gains - - - - - 7,050 248,204 255,254<br />
Share-based payment expenses - - - - 7,371 - - 7,371<br />
Issue of shares from September 1,<br />
2005 to January 30, 2006 529 9,769 - - (539) - - 9,759<br />
Issue of shares from January <strong>31</strong>,<br />
2006 to August <strong>31</strong>, 2006 10,712 - - - (941) - - 9,771<br />
Transfer to/(from) 103,484 (98,975) (4,509) - - - - -<br />
Dividends - - - - - - (363,186) (363,186)<br />
Lapse of share options - - - - (9) - 9 -<br />
Share buy-back – held as treasury<br />
shares - - - (12,018) - - - (12,018)<br />
_________ ________ ________ _________ _________ _________ ___________ ___________<br />
Balance as at August <strong>31</strong>, 2006 432,807 - - (12,018) 14,824 36,188 653,656 1,125,457<br />
_________ ________ ________ _________ _________ _________ ___________ ___________<br />
^<br />
Following the amendments to the Companies Act (“The Companies (Amendment) Act 2005”) on 30 January 2006, any amounts standing to the credit of the Company’s share<br />
premium account and capital redemption reserve account shall become part of the Company’s share capital. Accordingly, the share premium account and capital redemption<br />
reserve account have been combined into the share capital account.<br />
9
Statements of Changes in Total Equity for the Year ended August <strong>31</strong> (cont’d)<br />
(b)<br />
Company<br />
_________<br />
Capital Share-based<br />
Share Share Redemption Compensation Retained Total<br />
Capital Premium Reserve Reserve Profit Equity<br />
S$’000 S$’000 S$’000 S$’000 S$’000 S$’000<br />
Balance as at September 1, 2004 <strong>31</strong>6,527 62,<strong>31</strong>9 4,509 - 883,559 1,266,914<br />
Effects of adopting FRS 102 - - - 2,568 (2,568) -<br />
_________ ________ ________ _________ ___________ ___________<br />
As restated <strong>31</strong>6,527 62,<strong>31</strong>9 4,509 2,568 880,991 1,266,914<br />
Profit for the financial year - - - - 268,809 268,809<br />
Share-based payment expenses - - - 6,374 - 6,374<br />
Issue of shares 1,555 - - - - 1,555<br />
Premium on issue of shares - 26,887 - - - 26,887<br />
Dividends - - - - (381,270) (381,270)<br />
_________ ________ ________ _________ ___________ ___________<br />
Balance as at August <strong>31</strong>, 2005 <strong>31</strong>8,082 89,206 4,509 8,942 768,530 1,189,269<br />
_________<br />
________ ________ _________ ___________ ___________<br />
10
1(d)(ii) Details of any changes in the company’s share capital arising from rights<br />
issue, bonus issue, share buy-backs, exercise of share options or warrants,<br />
conversion of other issues of equity securities, issue of shares for cash or as<br />
consideration for acquisition or for any other purpose since the end of the<br />
previous period reported on. State also the number of shares that may be<br />
issued on conversion of all the outstanding convertibles as at the end of the<br />
current financial period reported and as at the end of the corresponding<br />
period of the immediately preceding financial year<br />
Share Capital And Share Options<br />
(a)<br />
(b)<br />
Between June 1, 2006 and August <strong>31</strong>, 2006, pursuant to the <strong>Singapore</strong> <strong>Press</strong><br />
<strong>Holdings</strong> Group (1999) Share Option Scheme (the “1999 Scheme”), the Company<br />
issued 214,425 ordinary shares upon the exercise of options.<br />
As a result of the 214,425 ordinary shares issued pursuant to the 1999 Scheme, the<br />
Company issued 2,165 management shares in accordance with the Newspaper and<br />
Printing <strong>Press</strong>es Act, Cap. 206 between June 1, 2006 and August <strong>31</strong>, 2006.<br />
(c) There was no grant of share options to subscribe for ordinary shares under the 1999<br />
Scheme during the current final quarter.<br />
(d)<br />
Under the 1999 Scheme, options to subscribe for 71,132,300 ordinary shares<br />
remain outstanding as at August <strong>31</strong>, 2006 compared to 60,914,450 ordinary shares<br />
as at August <strong>31</strong>, 2005.<br />
(e) As at August <strong>31</strong>, 2006, the share capital of the Company comprised 1,576,525,021<br />
ordinary shares, 16,148,408 management shares and 3,001,000 treasury shares<br />
(May <strong>31</strong>, 2006: 1,577,521,596 ordinary shares, 16,146,243 management shares<br />
and 1,790,000 treasury shares).<br />
Share Buy Back<br />
Under the Share Buy Back Mandate (first approved by the Shareholders on July 16,<br />
1999 and last renewed at the Annual General Meeting on December 2, 2005), the<br />
Company bought back 1,211,000 ordinary shares during the current final quarter.<br />
These shares are held as treasury shares. The amount paid, including brokerage<br />
fees, totalled S$4.7 million and was deducted against shareholders’ equity.<br />
2. Whether the figures have been audited, or reviewed and in accordance with<br />
which auditing standard or practice<br />
Audit<br />
The figures for the year have been audited by our auditors. The auditors’ report on<br />
the financial statements of the Group was not subject to any qualification.<br />
11
3. Where the figures have been audited or reviewed, the auditors’ report<br />
(including any qualifications or emphasis of matter)<br />
Auditors’ Report<br />
We have audited the balance sheet of <strong>Singapore</strong> <strong>Press</strong> <strong>Holdings</strong> Limited and the<br />
consolidated financial statements of the Group for the financial year ended August<br />
<strong>31</strong>, 2006. These financial statements are the responsibility of the Company’s<br />
directors. Our responsibility is to express an opinion on these financial statements<br />
based on our audit.<br />
We conducted our audit in accordance with <strong>Singapore</strong> Standards on Auditing.<br />
Those Standards require that we plan and perform our audit to obtain reasonable<br />
assurance whether the financial statements are free of material misstatement. An<br />
audit includes examining, on a test basis, evidence supporting the amounts and<br />
disclosures in the financial statements. An audit also includes assessing the<br />
accounting principles used and significant estimates made by the directors, as well<br />
as evaluating the overall financial statement presentation. We believe that our audit<br />
provides a reasonable basis for our opinion.<br />
In our opinion,<br />
(a) the accompanying balance sheet of the Company and the consolidated financial<br />
statements of the Group are properly drawn up in accordance with the<br />
provisions of the <strong>Singapore</strong> Companies Act, Cap 50 (“the Act”) and <strong>Singapore</strong><br />
Financial Reporting Standards so as to give a true and fair view of the state of<br />
affairs of the Company and of the Group as at August <strong>31</strong>, 2006 and the results,<br />
changes in equity and cash flows of the Group for the financial year ended on<br />
that date; and<br />
(b) the accounting and other records required by the Act to be kept by the Company<br />
and by those subsidiaries incorporated in <strong>Singapore</strong> of which we are the<br />
auditors have been properly kept in accordance with the provisions of the Act.<br />
12
4. Whether the same accounting policies and methods of computation as in the<br />
issuer’s most recently audited annual financial statements have been applied<br />
Accounting Policies<br />
The financial statements have been prepared in compliance with the same<br />
accounting policies and methods of computation adopted in the audited financial<br />
statements of last financial year, except where new/revised accounting standards<br />
became effective from this financial year.<br />
Apart from FRS 39 – Financial Instruments: Recognition and Measurement and FRS<br />
102 – Share-based Payments, the adoption of the new and revised FRS does not<br />
have any significant financial impact on the Group. The financial effects of adopting<br />
FRS 39 and 102 are summarised in paragraph 5 below.<br />
5. If there are any changes in the accounting policies and methods of<br />
computation, including any required by an accounting standard, what has<br />
changed, as well as the reasons for, and effect of, the change<br />
FRS 39<br />
Prior to the adoption of FRS 39, long-term investments in equity securities are<br />
stated at cost less diminution in value. Long-term investments in bonds are stated<br />
at cost, adjusted for amortisation of premium and accretion of discount and<br />
diminution in value. Short-term investments are stated at the lower of cost and<br />
realisable value on an individual basis. The fair values of the forward foreign<br />
exchange contracts and interest rate swaps were not recognised in the financial<br />
statements.<br />
With the adoption of FRS 39, long-term and short-term investments are now<br />
measured at fair values with gains or losses recognised either in the income<br />
statement or the reserves. The fair values of the forward foreign exchange contracts<br />
are now recognised in the income statement while those of the interest rate swaps<br />
designated and qualify as cash flow hedges are recognised in the reserves. In<br />
accordance with the requirements under the standard, the comparative figures for<br />
the financial year ended August <strong>31</strong>, 2005 are not restated. Instead, the effect of<br />
adopting FRS 39 has been adjusted one-off to the opening reserves as at<br />
September 1, 2005.<br />
13
The transitional impact on the Group’s opening reserves and balance sheet items on<br />
adopting FRS 39 on September 1, 2005 is illustrated in the table below:<br />
S$ million<br />
Increase/(decrease) in:<br />
Retained profit 29.7<br />
Fair value reserve 309.3<br />
Hedging reserve (4.3)<br />
334.7<br />
Long-term investments 286.0<br />
Short-term investments 68.7<br />
Derivative financial instruments (current assets) 0.6<br />
Less:<br />
Derivative financial instruments (current liabilities) 7.2<br />
Deferred taxation 13.4<br />
334.7<br />
FRS 102<br />
Under FRS 102, share options to employees are measured at fair value at the date<br />
of grant and recognised as expense over the vesting period. The standard applies to<br />
share options granted to employees after November 22, 2002 and not vested by<br />
January 1, 2005. Prior to the adoption of FRS 102, the granting of share options to<br />
employees did not result in any expense to the income statement.<br />
The application of FRS 102 is retrospective and accordingly, the comparative<br />
financial statements are restated and the financial impact on the Group is as follows:<br />
(Decreased)/increased by<br />
S$’000<br />
FY 2006<br />
Profit for the year (7,371)<br />
Retained profit as at September 1, 2005 (8,942)<br />
Shared-based compensation reserve as at September 1, 2005 8,942<br />
FY 2005<br />
Profit for the year (6,374)<br />
Retained profit as at September 1, 2004 (2,568)<br />
Shared-based compensation reserve as at September 1, 2004 2,568<br />
2006 2005<br />
Decrease in basic EPS after exceptional items (S$) 0.005 0.004<br />
Decrease in diluted EPS after exceptional items (S$) 0.005 0.004<br />
14
6. Earnings per share of the group for the current period reported on and the<br />
corresponding period of the immediately preceding financial year, after<br />
deducting any provision for preference dividends<br />
Earnings Per Share for the Year ended August <strong>31</strong><br />
Group<br />
2006 2005<br />
Restated<br />
(a) Based on the weighted average<br />
number of shares on issue (S$)<br />
- before exceptional items<br />
- after exceptional items<br />
0.23 0.33<br />
0.27 0.<strong>31</strong><br />
(b) On fully diluted basis (S$)<br />
- before exceptional items<br />
- after exceptional items<br />
0.23 0.33<br />
0.27 0.<strong>31</strong><br />
7. Net asset value (for the issuer and group) per share based on issued share<br />
capital of the issuer at the end of the (a) current period reported on and (b)<br />
immediately preceding financial year<br />
Net Asset Value Per Share As At<br />
Group<br />
Company<br />
Aug <strong>31</strong>,<br />
2006<br />
Aug <strong>31</strong>,<br />
2005<br />
Aug <strong>31</strong>,<br />
2006<br />
Aug <strong>31</strong>,<br />
2005<br />
Restated<br />
Restated<br />
Net asset value per share<br />
based on issued share<br />
capital at the end of year<br />
(S$)<br />
1.28 1.02 0.71 0.75<br />
15
8. A review of the performance of the group, to the extent necessary for a<br />
reasonable understanding of the group’s business. It must include a<br />
discussion of any significant factors that affected the turnover, costs, and<br />
earnings of the group for the current financial period reported on, including<br />
(where applicable) seasonal or cyclical factors; and any material factors that<br />
affected the cash flow, working capital, assets or liabilities of the group during<br />
the current financial period reported on<br />
Business Segments/ Review of <strong>Results</strong><br />
Business Segments<br />
The Group is organised into three major operating segments, namely Newspaper<br />
and Magazine, Treasury and Investment and Property. The Newspaper and<br />
Magazine segment is involved in the publishing, printing and distributing of<br />
newspapers and magazines. The Treasury and Investment segment manages the<br />
investment activities of the Group. The Property segment holds and manages<br />
properties owned by the Group. Other operations under the Group, which are<br />
currently not significant to be reported separately, are included under “Others”.<br />
These comprise our businesses and investments in Internet, outdoor advertising,<br />
radio broadcasting and TV broadcasting.<br />
Review of <strong>Results</strong><br />
8.1 Group operating revenue grew 1.4% against last year to S$1,021.4 million.<br />
Excluding the revenue generated by SPH MediaWorks and Streats prior to their<br />
cessation on January 1, 2005, Group operating revenue would have increased by<br />
S$40.1 million or 4.1% year-on-year.<br />
Revenue for the Newspaper and Magazine segment rose by 1.7%, mainly driven by<br />
the 1.8% increase in print advertisement revenue to S$676.3 million and 2.0%<br />
growth in circulation revenue (after absorption of S$10.1 million in GST) to S$208.9<br />
million. Property segment posted 10.4% increase in revenue over last year to<br />
S$98.7 million amidst improving sentiments in the property market. The Group’s<br />
operating revenue from other segments registered a 40.4% decline, due to the loss<br />
of revenue contribution from the defunct TV broadcasting arm cushioned by higher<br />
Internet revenue and contribution from the outdoor advertising arm.<br />
higher consumption<br />
8.2 Materials, consumables and broadcasting costs were lower by S$12.9 million<br />
(7.1%). The decrease is mainly attributable to cost savings from the cessation of TV<br />
broadcasting operations last year, partially offset by 9.2% increase in newsprint<br />
costs arising from higher newsprint prices and consumption.<br />
Staff costs were down by S$0.2 million to S$268.0 million mainly due to savings<br />
arising from the cessation of TV broadcasting operations offset by annual salary<br />
increment and increase in headcount to support the launch of new editorial products<br />
and ventures into outdoor advertising and other media businesses.<br />
Other operating expenses were up S$22.1 million comprising mainly higher<br />
operating costs associated with the ventures into outdoor advertising and other<br />
media businesses, higher premises cost incurred by The Paragon in line with<br />
increased level of activities, and staff outplacement benefits paid. Last year also<br />
16
included a credit of S$4.9 million of costs capitalised to broadcasting inventory,<br />
which did not recur this year.<br />
8.3 Consequently, profit before investment income and exceptional items at S$361.1<br />
million was 2.6% higher than last year.<br />
8.4 Group investment income at S$81.7 million was S$166.9 million lower than last<br />
year. Excluding the one-time gain of S$128.5 million from the disposal of the<br />
Group’s substantial stake in StarHub Limited and S$12.8 million income arising from<br />
a capital reduction exercise undertaken by an investee company last year, the<br />
balance variance was mainly attributable to lower contribution from externallymanaged<br />
investments and lower profit on sale of internally-managed investments<br />
partially offset by higher dividend income received.<br />
8.5 The Group’s share of losses of associates and jointly controlled entity comprised<br />
mainly losses from MediaCorp TV <strong>Holdings</strong> (S$2.1 million) and Traffic Corner<br />
Publishing (S$1.2 million) offset by profits from MediaCorp <strong>Press</strong> Ltd (S$2.8 million)<br />
and TOM Outdoor Media Group Ltd (S$0.5 million).<br />
8.6 The exceptional gain of S$66.8 million mainly arose from the write-back of<br />
impairment losses for The Paragon (S$70.5 million) in view of its strong sustained<br />
valuation. This was partially offset by impairment charges pertaining to the Group’s<br />
investment in the outdoor advertising and magazine businesses.<br />
The exceptional loss of S$38.5 million last year comprised mainly charges<br />
associated with the media merger (S$25.9 million) and impairment of goodwill that<br />
arose from the acquisition of new magazine business (S$12.9 million).<br />
8.7 Taxation charge of S$81.1 million was arrived at after accounting for tax on the<br />
taxable income at the corporate tax rate of 20%. During the year, adjustments were<br />
made for prior year’s overprovision in taxation of S$2.3 million. Last year’s taxation<br />
charge took into account group relief of S$17.2 million from utilisation of SPH<br />
MediaWorks Ltd’s tax losses and capital allowances.<br />
9. Where a forecast, or a prospect statement, has been previously disclosed to<br />
shareholders, any variance between it and the actual results<br />
No forecast was made previously.<br />
17
10. A commentary at the date of announcement of the significant trends and<br />
competitive conditions of the industry in which the group operates and any<br />
known factors or events that may affect the group in the next reporting period<br />
and the next 12 months<br />
10.1 The macroeconomic outlook for <strong>Singapore</strong> is expected to remain positive with<br />
external demand providing bulk of the impetus. However, domestic demand growth,<br />
which has more direct impact on the Group’s print advertisement revenue, may be<br />
more measured. Against this backdrop, the Group’s print advertisement revenue is<br />
expected to remain stable in the near term. Despite a declining trend in global<br />
newspaper circulation sales, the Group continues to sustain its level of circulation<br />
sales.<br />
10.2 Newsprint prices are expected to rise at a moderating pace due to continued<br />
imbalances in demand and supply. The Group has and will continue to put in place<br />
cost saving measures to manage a sustained level of margin for its core newspaper<br />
business.<br />
10.3 The Paragon is likely to continue returning healthy rental yields amidst the positive<br />
sentiments in the property market. Riding on the wave of sustained recovery in the<br />
high-end property market, the Group recently announced its plan to develop an<br />
exclusive freehold condominium along Thomson Road, which is expected to be<br />
launched in 2007.<br />
10.4 Excluding non-recurring gains, the Group’s investment income is expected to vary<br />
with the performance of the local and global financial markets.<br />
10.5 Overall, the Directors expect the recurring earnings for the current financial year to<br />
be satisfactory.<br />
11. Dividends<br />
18
(a) Current Financial Period Reported On<br />
Any dividend recommended for the current financial period reported on? Yes<br />
Name of Dividend <strong>Final</strong> Dividend Special Dividend<br />
Dividend Type Cash Cash<br />
Dividend Rate 8 cents per share 9 cents per share<br />
Tax rate Tax exempt (One-tier) Tax exempt (One-tier)<br />
(b) Corresponding Period of the Immediately Preceding Financial Year<br />
Any dividend declared for the corresponding period of the immediately preceding<br />
financial year? Yes<br />
Name of Dividend <strong>Final</strong> Dividend Special Dividend<br />
Dividend Type Cash Cash<br />
Dividend Rate 10 cents per share (less<br />
tax)<br />
7.8 cents per share<br />
net<br />
Par Value of shares 20 cents 20 cents<br />
Tax rate 20% See Note 1 below<br />
Note:<br />
1. Comprised of:<br />
(i) 8.3425 cents per share (less tax at 20%) or 6.674 cents per share net of<br />
tax; and<br />
(ii) 1.126 cents per share (one-tier tax)<br />
(c) Date payable<br />
The date the dividend is payable: December 22, 2006.<br />
(d) Books closure date<br />
The Share Transfer Books and Register of Members of the Company will be closed<br />
on December 13, 2006 for preparation of dividend warrants. Duly stamped and<br />
completed transfers received by our Share Transfer Office, Barbinder & Co Pte Ltd,<br />
8 Cross Street, #11-00, PWC Building, <strong>Singapore</strong> 048424, up to 5 p.m. on<br />
December 12, 2006 will be registered to determine shareholders' entitlements to the<br />
final and special dividends. In respect of shares in securities accounts with The<br />
Central Depository (Pte) Limited (“CDP”), the said final and special dividends will be<br />
paid by the Company to CDP which will distribute the dividends to holders of the<br />
securities accounts.<br />
12. If no dividend has been declared/recommended, a statement to that effect<br />
Not applicable.<br />
19
13. Segmental revenue and results for business or geographical segments (of the<br />
group) in the form presented in the issuer’s most recently audited annual<br />
financial statements, with comparative information for the immediately<br />
preceding year<br />
Group Segmental Information<br />
2006<br />
Newspaper Treasury<br />
and<br />
and<br />
Magazine Investment Property Others Eliminations Consolidated<br />
S$’000 S$’000 S$’000 S$’000 S$’000 S$’000<br />
Operating revenue<br />
External sales 906,986 - 98,704 15,670 - 1,021,360<br />
Inter-segmental sales 1,296 - 2,021 394 (3,711) -<br />
__________ _________ ________ _________ _________ ____________<br />
Total operating revenue 908,282 - 100,725 16,064 (3,711) 1,021,360<br />
__________ _________ ________ _________ _________ ____________<br />
Result<br />
Segment result <strong>31</strong>6,003 80,892 71,102 (5,689) - 462,308<br />
Finance costs (1) - (20,535) (77) - (20,613)<br />
Finance income 411 - 651 4 - 1,066<br />
Share of profit less losses<br />
of associates/jointly<br />
controlled entity 1,584 - - (1,769) - (185)<br />
Exceptional items (2,276) - 70,534 (1,414) - 66,844<br />
__________ _________ _________ _________ _________ ____________<br />
Profit/(loss) before taxation <strong>31</strong>5,721 80,892 121,752 (8,945) - 509,420<br />
Taxation (81,076)<br />
____________<br />
Profit after taxation 428,344<br />
Minority interests 116<br />
____________<br />
Profit attributable to 428,460<br />
shareholders<br />
____________<br />
Other Information<br />
Segment assets 661,474 1,105,479 1,186,222 16,645 - 2,969,820<br />
Interests in associates 23,860 - - 45,869 - 69,729<br />
____________<br />
Consolidated total assets 3,039,549<br />
____________<br />
Segment liabilities 162,138 6,764 640,588 4,344 - 813,834<br />
Current taxation 104,932<br />
Deferred taxation 72,046<br />
____________<br />
Consolidated total liabilities 990,812<br />
____________<br />
Capital expenditure 16,939 - 2,127 <strong>95</strong>0 - 20,016<br />
Depreciation 47,368 - 458 1,239 - 49,065<br />
Amortisation 575 - - - - 575<br />
Impairment losses<br />
- Goodwill on acquisition<br />
of interests in subsidiaries - - - 355 - 355<br />
- Interests in associates 1,200 - - - - 1,200<br />
- Interests in jointly-controlled<br />
entity 1,128 - - - - 1,128<br />
20
Group Segmental Information<br />
2005<br />
Restated<br />
Newspaper Treasury<br />
and<br />
and<br />
Magazine Investment Property Others Eliminations Consolidated<br />
S$’000 S$’000 S$’000 S$’000 S$’000 S$’000<br />
Operating revenue<br />
External sales 891,783 - 89,445 26,284 - 1,007,512<br />
Inter-segmental sales 1,985 - 2,141 <strong>95</strong> (4,221) -<br />
__________ _________ ________ _________ _________ ____________<br />
Total operating revenue 893,768 - 91,586 26,379 (4,221) 1,007,512<br />
__________ _________ ________ _________ _________ ____________<br />
Result<br />
Segment result 322,488 248,024 66,874 (14,843) - 622,543<br />
Finance costs (51) - (22,035) (440) - (22,526)<br />
Finance income 169 - <strong>31</strong>0 -* - 479<br />
Share of profit less losses<br />
of associates/jointly<br />
controlled entity 236 - - (3,826) - (3,590)<br />
Exceptional items (12,786) - - (25,756) - (38,542)<br />
__________ _________ _________ _________ _________ ____________<br />
Profit/(loss) before taxation <strong>31</strong>0,056 248,024 45,149 (44,865) - 558,364<br />
Taxation (69,975)<br />
____________<br />
Profit after taxation 488,389<br />
Minority interests (69)<br />
____________<br />
Profit attributable to 488,320<br />
shareholders<br />
____________<br />
Other Information<br />
Segment assets 678,<strong>95</strong>2 803,274 1,098,903 19,856 - 2,600,985<br />
Interests in associates 21,751 - - 6,324 - 28,075<br />
____________<br />
Consolidated total assets 2,629,060<br />
____________<br />
Segment liabilities 161,734 9,056 678,256 465 - 849,511<br />
Current taxation 88,298<br />
Deferred taxation 67,777<br />
____________<br />
Consolidated total liabilities 1,005,586<br />
____________<br />
Capital expenditure 15,093 - 13,245 487 - 28,825<br />
Depreciation 49,497 - 467 336 - 50,300<br />
Amortisation 552 - - - - 552<br />
Impairment losses:<br />
- Goodwill on acquisition<br />
of subsidiaries 10,421 - - - - 10,421<br />
- Goodwill on acquisition<br />
of an associate 2,519 - - - - 2,519<br />
- Interests in an associate 105 - - - - 105<br />
- Property, plant<br />
and equipment 688 - - - - 688<br />
* Less than $500<br />
21
Notes:<br />
(a) Geographical segments: The principal geographical area in which the Group operates<br />
is <strong>Singapore</strong>. The Group’s overseas operations comprise mainly publishing and<br />
distributing magazines, holding overseas investments and the provision of marketing,<br />
editorial, art and graphical services overseas.<br />
Capital<br />
Operating Revenue Total Assets Expenditure<br />
2006 2005 2006 2005 2006 2005<br />
S$’000 S$’000 S$’000 S$’000 S$’000 S$’000<br />
<strong>Singapore</strong> 1,006,486 993,896 2,980,892 2,613,322 19,775 28,029<br />
Other Countries 14,874 13,616 58,657 15,738 241 796<br />
___________ _____________ _____________ _____________ ___________ ___________<br />
1,021,360 1,007,512 3,039,549 2,629,060 20,016 28,825<br />
___________ _____________ _____________ _____________ ___________ ___________<br />
14. In the review of performance, the factors leading to any material changes in<br />
contributions to turnover and earnings by the business or geographical<br />
segments<br />
Refer to paragraph 8.<br />
15. Breakdown of Sales<br />
Group<br />
2006 2005 Change<br />
S$’000 S$’000 %<br />
(a) Operating revenue reported for first half<br />
year 501,130 500,296 0.2<br />
(b) Profit after tax before deducting minority<br />
interests reported for the first half year 183,001 <strong>31</strong>6,625 (42.2)<br />
(c) Operating revenue reported for second half<br />
year 520,230 507,216 2.6<br />
(d) Profit after tax before deducting minority<br />
interests reported for the second half<br />
year 245,343 171,764 42.8<br />
16. A breakdown of the total annual dividend (in dollar value) for the issuer’s<br />
latest full year and its previous full year as follows:-<br />
Total Net Annual Dividend<br />
2006 2005<br />
S$’000<br />
S$’000<br />
Ordinary 382,433 362,777<br />
Preference - -<br />
Total 382,433* 362,777<br />
The amount of S$382,433,000 (Last year: S$362,777,000) included S$3,875,000<br />
(Last year: S$3,671,000) for management shares.<br />
* This may be increased depending on the number of issued shares existing as at<br />
the books closure date on December 13, 2006.<br />
22
17. Reclassification<br />
The comparative figures of the amounts owing by/to associates and jointly controlled<br />
entity and loan to associate, which were previously included in interests in<br />
associates and jointly controlled entity, have been reclassified and shown separately<br />
in the balance sheet. In addition, the comparative figures for deposits received from<br />
customers, which were previously included in other creditors and accrued liabilities,<br />
have been reclassified to trade creditors. The reclassifications were made to<br />
conform to current year’s presentation. The comparative amounts reclassified out of<br />
interests in associates, interests in jointly controlled entity and other creditors and<br />
accrued liabilities are as follows:<br />
Group Company<br />
2005 2005<br />
S$’000 S$’000<br />
Interests in associates as reported on<br />
August <strong>31</strong>, 2005 34,103 35,172<br />
Reclassified to “Amount owing by associates” (6,029) (6,012)<br />
Reclassified to “Amount owing to associates” 1 -<br />
____________<br />
____________<br />
Adjusted balance 28,075 29,160<br />
____________<br />
____________<br />
Interests in jointly controlled entity as reported<br />
on August <strong>31</strong>, 2005 33 -<br />
Reclassified to “Amount owing by jointly<br />
controlled entity” (33) -<br />
____________<br />
____________<br />
Adjusted balance - -<br />
____________<br />
____________<br />
Other creditors and accrued liabilities as reported<br />
on August <strong>31</strong>, 2005 129,304 107,534<br />
Reclassified to “Trade creditors” (4,237) (4,237)<br />
____________<br />
____________<br />
Adjusted balance 125,067 103,297<br />
____________<br />
____________<br />
Trade creditors as reported<br />
on August <strong>31</strong>, 2005 70,206 38,816<br />
Reclassified from “Other creditors and<br />
accrued liabilities” 4,237 4,237<br />
____________<br />
____________<br />
Adjusted balance 74,443 43,053<br />
____________<br />
____________<br />
23
BY ORDER OF THE BOARD<br />
Ginney Lim May Ling<br />
Khor Siew Kim<br />
Company Secretaries<br />
<strong>Singapore</strong>,<br />
October 12, 2006<br />
24


