Closed Sales

Create successful ePaper yourself
Turn your PDF publications into a flip-book with our unique Google optimized e-Paper software.
<strong>Closed</strong> <strong>Sales</strong><br />
Monthly Market Detail - June 2014<br />
Single Family Homes<br />
Bay County Association of REALTORS®<br />
This report describes member activity for the association and is not confined to any specific geographic area.<br />
Summary Statistics<br />
June 2014<br />
June 2013<br />
Percent Change<br />
Year-over-Year<br />
<strong>Closed</strong> <strong>Sales</strong><br />
Paid in Cash<br />
240 210 14.3%<br />
63 46 37.0%<br />
New Pending <strong>Sales</strong><br />
293<br />
216 35.6%<br />
New Listings<br />
Median Sale Price<br />
371 283 31.1%<br />
$170,000 $169,000 0.6%<br />
Average Sale Price<br />
$243,749<br />
$201,981 20.7%<br />
Median Days on Market<br />
57 67 -14.9%<br />
Average Percent of Original List<br />
Price Received<br />
92.8%<br />
92.7%<br />
0.1%<br />
Pending Inventory<br />
Inventory (Active Listings)<br />
438<br />
1,580<br />
441 -0.7%<br />
1,374 15.0%<br />
Months Supply of Inventory 8.1<br />
7.7 4.3%<br />
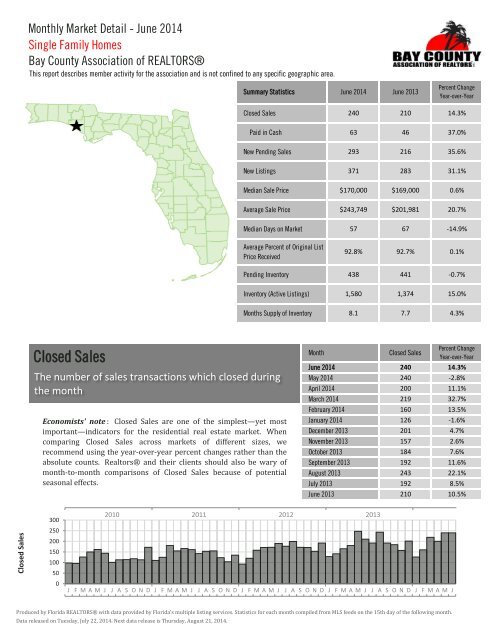
<strong>Closed</strong> <strong>Sales</strong><br />
The number of sales transactions which closed during<br />
the month<br />
Economists' note : <strong>Closed</strong> <strong>Sales</strong> are one of the simplest—yet most<br />
important—indicators for the residential real estate market. When<br />
comparing <strong>Closed</strong> <strong>Sales</strong> across markets of different sizes, we<br />
recommend using the year-over-year percent changes rather than the<br />
absolute counts. Realtors® and their clients should also be wary of<br />
month-to-month comparisons of <strong>Closed</strong> <strong>Sales</strong> because of potential<br />
seasonal effects.<br />
Month<br />
<strong>Closed</strong> <strong>Sales</strong><br />
Percent Change<br />
Year-over-Year<br />
June 2014<br />
240<br />
14.3%<br />
May 2014 240 -2.8%<br />
April 2014 200<br />
11.1%<br />
March 2014<br />
February 2014<br />
January 2014<br />
December 2013<br />
November 2013<br />
October 2013<br />
219<br />
160<br />
126<br />
201<br />
157<br />
184<br />
32.7%<br />
13.5%<br />
-1.6%<br />
4.7%<br />
2.6%<br />
7.6%<br />
September 2013 192<br />
11.6%<br />
August 2013<br />
July 2013<br />
243<br />
192<br />
22.1%<br />
8.5%<br />
June 2013 210<br />
10.5%<br />
300<br />
250<br />
200<br />
150<br />
100<br />
50<br />
0<br />
2010 2011 2012 2013<br />
J F M A M J J A S O N D J F M A M J J A S O N D J F M A M J J A S O N D J F M A M J J A S O N D J F M A M J<br />
Produced by Florida REALTORS® with data provided by Florida's multiple listing services. Statistics for each month compiled from MLS feeds on the 15th day of the following month.<br />
Data released on Tuesday, July 22, 2014. Next data release is Thursday, August 21, 2014.
Cash <strong>Sales</strong><br />
Pct. of <strong>Closed</strong><br />
<strong>Sales</strong> Paid in Cash<br />
Monthly Market Detail - June 2014<br />
Single Family Homes<br />
Bay County Association of REALTORS®<br />
This report describes member activity for the association and is not confined to any specific geographic area.<br />
Cash <strong>Sales</strong><br />
The number of <strong>Closed</strong> <strong>Sales</strong> during the month in which<br />
buyers exclusively paid in cash<br />
Economists' note : Cash <strong>Sales</strong> can be a useful indicator of the extent to<br />
which investors are participating in the market. Why? Investors are<br />
far more likely to have the funds to purchase a home available up front,<br />
whereas the typical homebuyer requires a mortgage or some other<br />
form of financing. There are, of course, many possible exceptions, so<br />
this statistic should be interpreted with care.<br />
Month<br />
Cash <strong>Sales</strong><br />
Percent Change<br />
Year-over-Year<br />
June 2014 63 37.0%<br />
May 2014 68 11.5%<br />
April 2014 55 10.0%<br />
March 2014 52 23.8%<br />
February 2014 34 -10.5%<br />
January 2014 32 6.7%<br />
December 2013 39 -2.5%<br />
November 2013 31 -18.4%<br />
October 2013 57 46.2%<br />
September 2013 40 48.1%<br />
August 2013 52 13.0%<br />
July 2013 38 -2.6%<br />
June 2013 46 17.9%<br />
80<br />
2010 2011 2012 2013<br />
60<br />
40<br />
20<br />
0<br />
J F M A M J J A S O N D J F M A M J J A S O N D J F M A M J J A S O N D J F M A M J J A S O N D J F M A M J<br />
Cash <strong>Sales</strong> as a Percentage of <strong>Closed</strong> <strong>Sales</strong><br />
The percentage of <strong>Closed</strong> <strong>Sales</strong> during the month<br />
which were Cash <strong>Sales</strong><br />
Economists' note : This statistic is simply another way of viewing<br />
Cash <strong>Sales</strong>. The remaining percentages of <strong>Closed</strong> <strong>Sales</strong> (i.e. those not<br />
paid fully in cash) each month involved some sort of financing, such as<br />
mortgages, owner/seller financing, assumed loans, etc.<br />
Month<br />
Percent of <strong>Closed</strong><br />
<strong>Sales</strong> Paid in Cash<br />
Percent Change<br />
Year-over-Year<br />
June 2014 26.3% 19.8%<br />
May 2014 28.3% 14.7%<br />
April 2014 27.5% -1.0%<br />
March 2014 23.7% -6.7%<br />
February 2014 21.3% -21.2%<br />
January 2014 25.4% 8.4%<br />
December 2013 19.4% -6.9%<br />
November 2013 19.7% -20.5%<br />
October 2013 31.0% 35.8%<br />
September 2013 20.8% 32.7%<br />
August 2013 21.4% -7.4%<br />
July 2013 19.8% -10.2%<br />
June 2013 21.9% 6.7%<br />
40%<br />
2010 2011 2012 2013<br />
30%<br />
20%<br />
10%<br />
0%<br />
J F M A M J J A S O N D J F M A M J J A S O N D J F M A M J J A S O N D J F M A M J J A S O N D J F M A M J<br />
Produced by Florida REALTORS® with data provided by Florida's multiple listing services. Statistics for each month compiled from MLS feeds on the 15th day of the following month.<br />
Data released on Tuesday, July 22, 2014. Next data release is Thursday, August 21, 2014.
Pending <strong>Sales</strong><br />
New Listings<br />
Monthly Market Detail - June 2014<br />
Single Family Homes<br />
Bay County Association of REALTORS®<br />
This report describes member activity for the association and is not confined to any specific geographic area.<br />
New Pending <strong>Sales</strong><br />
The number of property listings that went from<br />
"Active" to "Pending" status during the month<br />
Economists' note : Because of the typical length of time it takes for a<br />
sale to close, economists consider Pending <strong>Sales</strong> to be a decent<br />
indicator of potential future <strong>Closed</strong> <strong>Sales</strong>. It is important to bear in<br />
mind, however, that not all Pending <strong>Sales</strong> will be closed successfully.<br />
So, the effectiveness of Pending <strong>Sales</strong> as a future indicator of <strong>Closed</strong><br />
<strong>Sales</strong> is susceptible to changes in market conditions such as the<br />
availability of financing for homebuyers and the inventory of<br />
distressed properties for sale.<br />
Month<br />
June 2014<br />
May 2014<br />
April 2014<br />
March 2014<br />
250<br />
February 2014 230<br />
January 2014<br />
December 2013<br />
November 2013<br />
October 2013<br />
September 2013<br />
August 2013<br />
July 2013<br />
June 2013<br />
New Pending <strong>Sales</strong><br />
293<br />
265<br />
277<br />
252<br />
151<br />
167<br />
210<br />
182<br />
257<br />
226<br />
216<br />
Percent Change<br />
Year-over-Year<br />
35.6%<br />
-8.9%<br />
-5.1%<br />
-12.6%<br />
14.4%<br />
5.0%<br />
-31.4%<br />
-22.3%<br />
1.9%<br />
5.8%<br />
22.4%<br />
14.1%<br />
14.9%<br />
400<br />
2010 2011 2012 2013<br />
300<br />
200<br />
100<br />
0<br />
J F M A M J J A S O N D J F M A M J J A S O N D J F M A M J J A S O N D J F M A M J J A S O N D J F M A M J<br />
New Listings<br />
The number of properties put onto the market during<br />
the month<br />
Economists' note : In a recovering market, we expect that new listings<br />
will eventually rise as sellers raise their estimations of value. But this<br />
increase will take place only after the market has turned up, so New<br />
Listings are a lagging indicator of the health of the market. Also be<br />
aware of properties which have been withdrawn from the market and<br />
then relisted. These are not really New Listings.<br />
Month<br />
June 2014<br />
May 2014<br />
April 2014<br />
March 2014<br />
February 2014<br />
January 2014<br />
December 2013<br />
November 2013<br />
October 2013<br />
September 2013<br />
August 2013<br />
July 2013<br />
June 2013<br />
New Listings<br />
371<br />
366<br />
365<br />
365<br />
298<br />
320<br />
234<br />
226<br />
297<br />
320<br />
340<br />
319<br />
283<br />
Percent Change<br />
Year-over-Year<br />
31.1%<br />
28.9%<br />
9.6%<br />
5.2%<br />
13.3%<br />
9.2%<br />
24.5%<br />
5.1%<br />
14.7%<br />
31.1%<br />
16.8%<br />
22.2%<br />
2.5%<br />
400<br />
2010 2011 2012 2013<br />
300<br />
200<br />
100<br />
0<br />
J F M A M J J A S O N D J F M A M J J A S O N D J F M A M J J A S O N D J F M A M J J A S O N D J F M A M J<br />
Produced by Florida REALTORS® with data provided by Florida's multiple listing services. Statistics for each month compiled from MLS feeds on the 15th day of the following month.<br />
Data released on Tuesday, July 22, 2014. Next data release is Thursday, August 21, 2014.
Median Sale Price<br />
Average Sale<br />
Price<br />
Monthly Market Detail - June 2014<br />
Single Family Homes<br />
Bay County Association of REALTORS®<br />
This report describes member activity for the association and is not confined to any specific geographic area.<br />
Median Sale Price<br />
The median sale price reported for the month (i.e. 50%<br />
of sales were above and 50% of sales were below)<br />
Economists' note : Median Sale Price is our preferred summary<br />
statistic for price activity because, unlike Average Sale Price, Median<br />
Sale Price is not sensitive to high sale prices for small numbers of<br />
homes that may not be characteristic of the market area.<br />
Month<br />
Median Sale Price<br />
Percent Change<br />
Year-over-Year<br />
June 2014 $170,000 0.6%<br />
May 2014 $160,200 0.1%<br />
April 2014 $157,047 1.0%<br />
March 2014 $149,000 -12.9%<br />
February 2014 $163,500 5.5%<br />
January 2014 $169,000 13.4%<br />
December 2013 $171,350 15.1%<br />
November 2013 $162,500 3.2%<br />
October 2013 $160,000 9.6%<br />
September 2013 $176,250 -2.1%<br />
August 2013 $174,750 24.2%<br />
July 2013 $185,500 16.0%<br />
June 2013 $169,000 0.9%<br />
$190K<br />
2010 2011 2012 2013<br />
$170K<br />
$150K<br />
$130K<br />
$110K<br />
J F M A M J J A S O N D J F M A M J J A S O N D J F M A M J J A S O N D J F M A M J J A S O N D J F M A M J<br />
Average Sale Price<br />
The average sale price reported for the month (i.e.<br />
total sales in dollars divided by the number of sales)<br />
Economists' note : As noted above, we prefer Median Sale Price over<br />
Average Sale Price as a summary statistic for home prices. However,<br />
Average Sale Price does have its uses—particularly when it is analyzed<br />
alongside the Median Sale Price. For one, the relative difference<br />
between the two statistics can provide some insight into the market for<br />
higher-end homes in an area.<br />
Month<br />
Average Sale Price<br />
Percent Change<br />
Year-over-Year<br />
June 2014 $243,749 20.7%<br />
May 2014 $208,906 9.9%<br />
April 2014 $178,105 -7.5%<br />
March 2014 $178,376 -0.9%<br />
February 2014 $191,885 13.7%<br />
January 2014 $211,680 27.9%<br />
December 2013 $190,234 -2.5%<br />
November 2013 $183,844 3.4%<br />
October 2013 $185,006 2.9%<br />
September 2013 $195,338 -0.9%<br />
August 2013 $197,648 7.1%<br />
July 2013 $195,672 6.3%<br />
June 2013 $201,981 4.6%<br />
$260K<br />
$240K<br />
$220K<br />
$200K<br />
$180K<br />
$160K<br />
$140K<br />
2010 2011 2012 2013<br />
J F M A M J J A S O N D J F M A M J J A S O N D J F M A M J J A S O N D J F M A M J J A S O N D J F M A M J<br />
Produced by Florida REALTORS® with data provided by Florida's multiple listing services. Statistics for each month compiled from MLS feeds on the 15th day of the following month.<br />
Data released on Tuesday, July 22, 2014. Next data release is Thursday, August 21, 2014.
Median Days on<br />
Market<br />
Avg. Pct. of Orig.<br />
List Price<br />
Received<br />
Monthly Market Detail - June 2014<br />
Single Family Homes<br />
Bay County Association of REALTORS®<br />
This report describes member activity for the association and is not confined to any specific geographic area.<br />
Median Days on Market<br />
The median number of days that properties sold during<br />
the month were on the market<br />
Economists' note : Median Days on Market is the amount of time the<br />
"middle" property selling this month was on the market. That is, 50%<br />
of homes selling this month took less time to sell, and 50% of homes<br />
took more time to sell. We use the median rather than the average<br />
because the median is not particularly sensitive to sales of homes that<br />
took an unusually large amount of time to sell relative to the vast<br />
majority of homes in the market.<br />
Month<br />
Median Days on<br />
Market<br />
Percent Change<br />
Year-over-Year<br />
June 2014 57 -14.9%<br />
May 2014 58 -27.5%<br />
April 2014 76 -2.6%<br />
March 2014 86 -3.4%<br />
February 2014 89 -2.2%<br />
January 2014 82 -18.8%<br />
December 2013 78 -4.9%<br />
November 2013 62 -25.3%<br />
October 2013 62 -42.6%<br />
September 2013 75 -7.4%<br />
August 2013 70 -28.6%<br />
July 2013 79 -20.2%<br />
June 2013 67 -23.0%<br />
120<br />
100<br />
80<br />
60<br />
40<br />
20<br />
0<br />
2010 2011 2012 2013<br />
J F M A M J J A S O N D J F M A M J J A S O N D J F M A M J J A S O N D J F M A M J J A S O N D J F M A M J<br />
Average Percent of Original List Price Received<br />
The average of the sale price (as a percentage of the original list<br />
price) across all properties selling during the month<br />
Economists' note : The Average Percent of Original List Price Received<br />
is an indicator of market conditions, in that in a recovering market, the<br />
measure rises as buyers realize that the market may be moving away<br />
from them and they need to match the selling price (or better it) in<br />
order to get a contract on the house. This is usually the last measure to<br />
indicate a market that has shifted from down to up, and is another<br />
lagging indicator.<br />
Month<br />
Avg. Pct. of Orig. List<br />
Price Received<br />
Percent Change<br />
Year-over-Year<br />
June 2014 92.8% 0.1%<br />
May 2014 90.5% -0.2%<br />
April 2014 90.0% -1.1%<br />
March 2014 90.9% 0.7%<br />
February 2014 89.9% 1.5%<br />
January 2014 90.9% 1.5%<br />
December 2013 90.5% 2.0%<br />
November 2013 91.2% 1.4%<br />
October 2013 91.9% 3.0%<br />
September 2013 92.1% 2.3%<br />
August 2013 92.5% 5.2%<br />
July 2013 91.2% 2.8%<br />
June 2013 92.7% 2.3%<br />
95%<br />
2010 2011 2012 2013<br />
90%<br />
85%<br />
80%<br />
75%<br />
J F M A M J J A S O N D J F M A M J J A S O N D J F M A M J J A S O N D J F M A M J J A S O N D J F M A M J<br />
Produced by Florida REALTORS® with data provided by Florida's multiple listing services. Statistics for each month compiled from MLS feeds on the 15th day of the following month.<br />
Data released on Tuesday, July 22, 2014. Next data release is Thursday, August 21, 2014.
Inventory<br />
Months Supply of<br />
Inventory<br />
Monthly Market Detail - June 2014<br />
Single Family Homes<br />
Bay County Association of REALTORS®<br />
This report describes member activity for the association and is not confined to any specific geographic area.<br />
Inventory (Active Listings)<br />
The number of property listings active at the end of<br />
the month<br />
Economists' note : There are a number of ways to calculate Inventory,<br />
so these numbers may not match up to others you see in your market.<br />
We calculate Inventory by counting the number of active listings on the<br />
last day of the month, and hold this number to compare with the same<br />
month the following year.<br />
Month<br />
Inventory<br />
Percent Change<br />
Year-over-Year<br />
June 2014 1,580 15.0%<br />
May 2014 1,562 14.5%<br />
April 2014 1,556 9.7%<br />
March 2014 1,538 11.3%<br />
February 2014 1,496 11.6%<br />
January 2014 1,477 10.4%<br />
December 2013 1,525 11.3%<br />
November 2013 1,489 4.6%<br />
October 2013 1,498 -2.5%<br />
September 2013 1,497 -9.1%<br />
August 2013 1,415 -17.5%<br />
July 2013 1,413 -19.9%<br />
June 2013 1,374 -26.0%<br />
2,700<br />
2010 2011 2012 2013<br />
2,200<br />
1,700<br />
1,200<br />
J F M A M J J A S O N D J F M A M J J A S O N D J F M A M J J A S O N D J F M A M J J A S O N D J F M A M J<br />
Months Supply of Inventory<br />
An estimate of the number of months it will take to<br />
deplete the current Inventory given recent sales rates<br />
Economists' note : This is an indicator of the state of the market,<br />
whether it is a buyers' market or a sellers' market. The benchmark for<br />
a balanced market (favoring neither buyer nor seller) is 5.5 Months of<br />
Inventory. Higher numbers indicate a buyers' market, lower numbers<br />
a sellers' market.<br />
Month<br />
Months Supply<br />
Percent Change<br />
Year-over-Year<br />
June 2014 8.1 4.3%<br />
May 2014 8.1 4.2%<br />
April 2014 8.0 -4.0%<br />
March 2014 8.0 -2.2%<br />
February 2014 8.0 0.1%<br />
January 2014 7.9 -1.2%<br />
December 2013 8.2 -2.2%<br />
November 2013 8.0 -10.4%<br />
October 2013 8.1 -18.5%<br />
September 2013 8.1 -25.5%<br />
August 2013 7.7 -32.4%<br />
July 2013 7.9 -34.8%<br />
June 2013 7.7 -40.6%<br />
21.0<br />
2010 2011 2012 2013<br />
16.0<br />
11.0<br />
6.0<br />
J F M A M J J A S O N D J F M A M J J A S O N D J F M A M J J A S O N D J F M A M J J A S O N D J F M A M J<br />
Produced by Florida REALTORS® with data provided by Florida's multiple listing services. Statistics for each month compiled from MLS feeds on the 15th day of the following month.<br />
Data released on Tuesday, July 22, 2014. Next data release is Thursday, August 21, 2014.
<strong>Closed</strong> <strong>Sales</strong><br />
Median Days<br />
on Market<br />
Monthly Market Detail - June 2014<br />
Single Family Homes<br />
Bay County Association of REALTORS®<br />
This report describes member activity for the association and is not confined to any specific geographic area.<br />
<strong>Closed</strong> <strong>Sales</strong> by Sale Price<br />
The number of sales transactions which closed during<br />
the month<br />
Economists' note : <strong>Closed</strong> <strong>Sales</strong> are one of the simplest—yet most<br />
important—indicators for the residential real estate market. When<br />
comparing <strong>Closed</strong> <strong>Sales</strong> across markets of different sizes, we<br />
recommend using the year-over-year percent changes rather than the<br />
absolute counts. Realtors® and their clients should also be wary of<br />
month-to-month comparisons of <strong>Closed</strong> <strong>Sales</strong> because of potential<br />
seasonal effects.<br />
70<br />
60<br />
50<br />
40<br />
30<br />
20<br />
10<br />
0<br />
Less than<br />
$50,000<br />
June 2013 June 2014<br />
$50,000 -<br />
$99,999<br />
$100,000 -<br />
$149,999<br />
$150,000 -<br />
$199,999<br />
$200,000 -<br />
$249,999<br />
$250,000 -<br />
$299,999<br />
Sale Price<br />
<strong>Closed</strong> <strong>Sales</strong><br />
Percent Change<br />
Year-over-Year<br />
Less than $50,000 13 30.0%<br />
$50,000 - $99,999 38 15.2%<br />
$100,000 - $149,999 39 30.0%<br />
$150,000 - $199,999 56 -5.1%<br />
$200,000 - $249,999 25 -10.7%<br />
$250,000 - $299,999 25 31.6%<br />
$300,000 - $399,999 28 47.4%<br />
$400,000 - $599,999 8 33.3%<br />
$600,000 - $999,999 6 0.0%<br />
$1,000,000 or more 2 N/A<br />
$300,000 -<br />
$399,999<br />
$400,000 -<br />
$599,999<br />
$600,000 -<br />
$999,999<br />
$1,000,000 or<br />
more<br />
70<br />
60<br />
50<br />
40<br />
30<br />
20<br />
10<br />
0<br />
Median Days on Market by Sale Price<br />
The median number of days that properties sold during<br />
the month were on the market<br />
Economists' note: Median Days on Market is the amount of time the<br />
"middle" property selling this month was on the market. That is, 50%<br />
of homes selling this month took less time to sell, and 50% of homes<br />
took more time to sell. We use the median rather than the average<br />
because the median is not particularly sensitive to sales of homes that<br />
took an unusually large amount of time to sell relative to the vast<br />
majority of homes in the market.<br />
200<br />
150<br />
June 2013 June 2014<br />
Sale Price<br />
$50,000 - $99,999 35 -66.3%<br />
$100,000 - $149,999<br />
Median Days on<br />
Market<br />
Percent Change<br />
Year-over-Year<br />
Less than $50,000 89 -15.2%<br />
40 -16.7%<br />
$150,000 - $199,999 91 49.2%<br />
$200,000 - $249,999 51 -39.3%<br />
$250,000 - $299,999<br />
75 177.8%<br />
$300,000 - $399,999 24 -54.7%<br />
$400,000 - $599,999 84 -25.0%<br />
$600,000 - $999,999 113 -34.3%<br />
$1,000,000 or more 33 N/A<br />
200<br />
150<br />
100<br />
100<br />
50<br />
50<br />
0<br />
Less than<br />
$50,000<br />
$50,000 -<br />
$99,999<br />
$100,000 -<br />
$149,999<br />
$150,000 -<br />
$199,999<br />
$200,000 -<br />
$249,999<br />
$250,000 -<br />
$299,999<br />
$300,000 -<br />
$399,999<br />
$400,000 -<br />
$599,999<br />
$600,000 -<br />
$999,999<br />
$1,000,000 or<br />
more<br />
0<br />
Produced by Florida REALTORS® with data provided by Florida's multiple listing services. Statistics for each month compiled from MLS feeds on the 15th day of the following month.<br />
Data released on Tuesday, July 22, 2014. Next data release is Thursday, August 21, 2014.
New Listings<br />
Inventory<br />
Monthly Market Detail - June 2014<br />
Single Family Homes<br />
Bay County Association of REALTORS®<br />
This report describes member activity for the association and is not confined to any specific geographic area.<br />
New Listings by Initial Listing Price<br />
The number of properties put onto the market during<br />
the month<br />
Economists' note: In a recovering market, we expect that new listings<br />
will eventually rise as sellers raise their estimations of value. But this<br />
increase will take place only after the market has turned up, so New<br />
Listings are a lagging indicator of the health of the market. Also be<br />
aware of properties which have been withdrawn from the market and<br />
then relisted. These are not really New Listings.<br />
80<br />
70<br />
60<br />
50<br />
40<br />
30<br />
20<br />
10<br />
0<br />
Less than<br />
$50,000<br />
June 2013 June 2014<br />
$50,000 -<br />
$99,999<br />
$100,000 -<br />
$149,999<br />
$150,000 -<br />
$199,999<br />
$200,000 -<br />
$249,999<br />
$250,000 -<br />
$299,999<br />
Initial Listing Price<br />
New Listings<br />
Percent Change<br />
Year-over-Year<br />
Less than $50,000 16 33.3%<br />
$50,000 - $99,999 45 21.6%<br />
$100,000 - $149,999 60 30.4%<br />
$150,000 - $199,999 71 31.5%<br />
$200,000 - $249,999 49 19.5%<br />
$250,000 - $299,999 61 103.3%<br />
$300,000 - $399,999 34 21.4%<br />
$400,000 - $599,999 22 37.5%<br />
$600,000 - $999,999 6 -53.8%<br />
$1,000,000 or more 7 16.7%<br />
$300,000 -<br />
$399,999<br />
$400,000 -<br />
$599,999<br />
$600,000 -<br />
$999,999<br />
$1,000,000 or<br />
more<br />
80<br />
70<br />
60<br />
50<br />
40<br />
30<br />
20<br />
10<br />
0<br />
Inventory by Current Listing Price<br />
The number of property listings active at the end of<br />
the month<br />
Economists' note: There are a number of ways to calculate Inventory,<br />
so these numbers may not match up to others you see in your market.<br />
We calculate Inventory by counting the number of active listings on the<br />
last day of the month, and hold this number to compare with the same<br />
month the following year.<br />
300<br />
250<br />
200<br />
150<br />
100<br />
50<br />
0<br />
Less than<br />
$50,000<br />
June 2013 June 2014<br />
$50,000 -<br />
$99,999<br />
$100,000 -<br />
$149,999<br />
$150,000 -<br />
$199,999<br />
$200,000 -<br />
$249,999<br />
$250,000 -<br />
$299,999<br />
Current Listing Price<br />
Inventory<br />
Percent Change<br />
Year-over-Year<br />
Less than $50,000 61 32.6%<br />
$50,000 - $99,999 181 0.6%<br />
$100,000 - $149,999 223 8.3%<br />
$150,000 - $199,999 250 12.6%<br />
$200,000 - $249,999 196 12.6%<br />
$250,000 - $299,999 187 14.7%<br />
$300,000 - $399,999 189 14.5%<br />
$400,000 - $599,999 121 37.5%<br />
$600,000 - $999,999 94 16.0%<br />
$1,000,000 or more 78 59.2%<br />
$300,000 -<br />
$399,999<br />
$400,000 -<br />
$599,999<br />
$600,000 -<br />
$999,999<br />
$1,000,000 or<br />
more<br />
300<br />
250<br />
200<br />
150<br />
100<br />
50<br />
0<br />
Produced by Florida REALTORS® with data provided by Florida's multiple listing services. Statistics for each month compiled from MLS feeds on the 15th day of the following month.<br />
Data released on Tuesday, July 22, 2014. Next data release is Thursday, August 21, 2014.
<strong>Closed</strong> <strong>Sales</strong><br />
Median Sale Price<br />
Monthly Distressed Market - June 2014<br />
Single Family Homes<br />
Bay County Association of REALTORS®<br />
This report describes member activity for the association and is not confined to any specific geographic area.<br />
June 2014 June 2013<br />
Percent Change<br />
Year-over-Year<br />
Traditional<br />
<strong>Closed</strong> <strong>Sales</strong><br />
Median Sale Price<br />
191 152 25.7%<br />
$185,000 $178,700 3.5%<br />
Foreclosure/REO<br />
<strong>Closed</strong> <strong>Sales</strong><br />
Median Sale Price<br />
44 40 10.0%<br />
$88,500 $133,000 -33.5%<br />
Short Sale<br />
<strong>Closed</strong> <strong>Sales</strong><br />
Median Sale Price<br />
5 18 -72.2%<br />
$174,000 $166,000 4.8%<br />
100%<br />
90%<br />
80%<br />
70%<br />
60%<br />
50%<br />
40%<br />
30%<br />
20%<br />
10%<br />
0%<br />
$250,000<br />
2010 2011 2012 2013<br />
Traditional Foreclosure/REO Short Sale<br />
J F M A M J J A S O N D J F M A M J J A S O N D J F M A M J J A S O N D J F M A M J J A S O N D J F M A M J<br />
$200,000<br />
$150,000<br />
$100,000<br />
$50,000<br />
$0<br />
J F M A M J J A S O N D J F M A M J J A S O N D J F M A M J J A S O N D J F M A M J J A S O N D J F M A M J<br />
2010 2011 2012 2013<br />
Produced by Florida REALTORS® with data provided by Florida's multiple listing services. Statistics for each month compiled from MLS feeds on the 15th day of the following month.<br />
Data released on Tuesday, July 22, 2014. Next data release is Thursday, August 21, 2014.
<strong>Closed</strong> <strong>Sales</strong><br />
Monthly Market Detail - June 2014<br />
Townhouses and Condos<br />
Bay County Association of REALTORS®<br />
This report describes member activity for the association and is not confined to any specific geographic area.<br />
Summary Statistics<br />
June 2014<br />
June 2013<br />
Percent Change<br />
Year-over-Year<br />
<strong>Closed</strong> <strong>Sales</strong><br />
Paid in Cash<br />
114 134 -14.9%<br />
49 50 -2.0%<br />
New Pending <strong>Sales</strong><br />
147<br />
153 -3.9%<br />
New Listings<br />
Median Sale Price<br />
203 165 23.0%<br />
$181,000 $179,400 0.9%<br />
Average Sale Price<br />
$215,274<br />
$207,548 3.7%<br />
Median Days on Market<br />
65 70 -7.1%<br />
Average Percent of Original List<br />
Price Received<br />
93.4%<br />
92.0%<br />
1.5%<br />
Pending Inventory<br />
Inventory (Active Listings)<br />
176<br />
1,019<br />
201 -12.4%<br />
908 12.2%<br />
Months Supply of Inventory 8.0<br />
7.8 2.1%<br />
<strong>Closed</strong> <strong>Sales</strong><br />
The number of sales transactions which closed during<br />
the month<br />
Economists' note : <strong>Closed</strong> <strong>Sales</strong> are one of the simplest—yet most<br />
important—indicators for the residential real estate market. When<br />
comparing <strong>Closed</strong> <strong>Sales</strong> across markets of different sizes, we<br />
recommend using the year-over-year percent changes rather than the<br />
absolute counts. Realtors® and their clients should also be wary of<br />
month-to-month comparisons of <strong>Closed</strong> <strong>Sales</strong> because of potential<br />
seasonal effects.<br />
Month<br />
<strong>Closed</strong> <strong>Sales</strong><br />
Percent Change<br />
Year-over-Year<br />
June 2014<br />
114<br />
-14.9%<br />
May 2014 141 -2.8%<br />
April 2014 129<br />
-11.6%<br />
March 2014<br />
February 2014<br />
January 2014<br />
December 2013<br />
November 2013<br />
October 2013<br />
131<br />
116<br />
115<br />
117<br />
96<br />
155<br />
4.8%<br />
0.9%<br />
38.6%<br />
2.6%<br />
5.5%<br />
52.0%<br />
September 2013 146<br />
23.7%<br />
August 2013<br />
July 2013<br />
139<br />
136<br />
19.8%<br />
27.1%<br />
June 2013 134<br />
-0.7%<br />
200<br />
2010 2011 2012 2013<br />
150<br />
100<br />
50<br />
0<br />
J F M A M J J A S O N D J F M A M J J A S O N D J F M A M J J A S O N D J F M A M J J A S O N D J F M A M J<br />
Produced by Florida REALTORS® with data provided by Florida's multiple listing services. Statistics for each month compiled from MLS feeds on the 15th day of the following month.<br />
Data released on Tuesday, July 22, 2014. Next data release is Thursday, August 21, 2014.
Cash <strong>Sales</strong><br />
Pct. of <strong>Closed</strong><br />
<strong>Sales</strong> Paid in Cash<br />
Monthly Market Detail - June 2014<br />
Townhouses and Condos<br />
Bay County Association of REALTORS®<br />
This report describes member activity for the association and is not confined to any specific geographic area.<br />
Cash <strong>Sales</strong><br />
The number of <strong>Closed</strong> <strong>Sales</strong> during the month in which<br />
buyers exclusively paid in cash<br />
Economists' note : Cash <strong>Sales</strong> can be a useful indicator of the extent to<br />
which investors are participating in the market. Why? Investors are<br />
far more likely to have the funds to purchase a home available up front,<br />
whereas the typical homebuyer requires a mortgage or some other<br />
form of financing. There are, of course, many possible exceptions, so<br />
this statistic should be interpreted with care.<br />
Month<br />
Cash <strong>Sales</strong><br />
Percent Change<br />
Year-over-Year<br />
June 2014 49 -2.0%<br />
May 2014 53 1.9%<br />
April 2014 52 -11.9%<br />
March 2014 57 9.6%<br />
February 2014 48 -12.7%<br />
January 2014 37 23.3%<br />
December 2013 46 7.0%<br />
November 2013 36 24.1%<br />
October 2013 40 25.0%<br />
September 2013 60 46.3%<br />
August 2013 55 17.0%<br />
July 2013 59 34.1%<br />
June 2013 50 4.2%<br />
80<br />
2010 2011 2012 2013<br />
60<br />
40<br />
20<br />
0<br />
J F M A M J J A S O N D J F M A M J J A S O N D J F M A M J J A S O N D J F M A M J J A S O N D J F M A M J<br />
Cash <strong>Sales</strong> as a Percentage of <strong>Closed</strong> <strong>Sales</strong><br />
The percentage of <strong>Closed</strong> <strong>Sales</strong> during the month<br />
which were Cash <strong>Sales</strong><br />
Economists' note : This statistic is simply another way of viewing<br />
Cash <strong>Sales</strong>. The remaining percentages of <strong>Closed</strong> <strong>Sales</strong> (i.e. those not<br />
paid fully in cash) each month involved some sort of financing, such as<br />
mortgages, owner/seller financing, assumed loans, etc.<br />
Month<br />
Percent of <strong>Closed</strong><br />
<strong>Sales</strong> Paid in Cash<br />
Percent Change<br />
Year-over-Year<br />
June 2014 43.0% 15.2%<br />
May 2014 37.6% 4.8%<br />
April 2014 40.3% -0.2%<br />
March 2014 43.5% 4.6%<br />
February 2014 41.4% -13.5%<br />
January 2014 32.2% -11.0%<br />
December 2013 39.3% 4.2%<br />
November 2013 37.5% 17.7%<br />
October 2013 25.8% -17.7%<br />
September 2013 41.1% 18.3%<br />
August 2013 39.6% -2.3%<br />
July 2013 43.4% 5.5%<br />
June 2013 37.3% 4.9%<br />
60%<br />
50%<br />
40%<br />
30%<br />
20%<br />
10%<br />
0%<br />
2010 2011 2012 2013<br />
J F M A M J J A S O N D J F M A M J J A S O N D J F M A M J J A S O N D J F M A M J J A S O N D J F M A M J<br />
Produced by Florida REALTORS® with data provided by Florida's multiple listing services. Statistics for each month compiled from MLS feeds on the 15th day of the following month.<br />
Data released on Tuesday, July 22, 2014. Next data release is Thursday, August 21, 2014.
Pending <strong>Sales</strong><br />
New Listings<br />
Monthly Market Detail - June 2014<br />
Townhouses and Condos<br />
Bay County Association of REALTORS®<br />
This report describes member activity for the association and is not confined to any specific geographic area.<br />
New Pending <strong>Sales</strong><br />
The number of property listings that went from<br />
"Active" to "Pending" status during the month<br />
Economists' note : Because of the typical length of time it takes for a<br />
sale to close, economists consider Pending <strong>Sales</strong> to be a decent<br />
indicator of potential future <strong>Closed</strong> <strong>Sales</strong>. It is important to bear in<br />
mind, however, that not all Pending <strong>Sales</strong> will be closed successfully.<br />
So, the effectiveness of Pending <strong>Sales</strong> as a future indicator of <strong>Closed</strong><br />
<strong>Sales</strong> is susceptible to changes in market conditions such as the<br />
availability of financing for homebuyers and the inventory of<br />
distressed properties for sale.<br />
Month<br />
June 2014<br />
May 2014<br />
April 2014<br />
March 2014<br />
143<br />
February 2014 161<br />
January 2014<br />
December 2013<br />
November 2013<br />
October 2013<br />
September 2013<br />
August 2013<br />
July 2013<br />
June 2013<br />
New Pending <strong>Sales</strong><br />
147<br />
158<br />
123<br />
139<br />
108<br />
108<br />
143<br />
146<br />
157<br />
154<br />
153<br />
Percent Change<br />
Year-over-Year<br />
-3.9%<br />
-10.2%<br />
-29.7%<br />
-6.5%<br />
4.5%<br />
-10.3%<br />
-4.4%<br />
-12.2%<br />
7.5%<br />
39.0%<br />
27.6%<br />
29.4%<br />
16.8%<br />
200<br />
2010 2011 2012 2013<br />
150<br />
100<br />
50<br />
0<br />
J F M A M J J A S O N D J F M A M J J A S O N D J F M A M J J A S O N D J F M A M J J A S O N D J F M A M J<br />
New Listings<br />
The number of properties put onto the market during<br />
the month<br />
Economists' note : In a recovering market, we expect that new listings<br />
will eventually rise as sellers raise their estimations of value. But this<br />
increase will take place only after the market has turned up, so New<br />
Listings are a lagging indicator of the health of the market. Also be<br />
aware of properties which have been withdrawn from the market and<br />
then relisted. These are not really New Listings.<br />
Month<br />
June 2014<br />
May 2014<br />
April 2014<br />
March 2014<br />
February 2014<br />
January 2014<br />
December 2013<br />
November 2013<br />
October 2013<br />
September 2013<br />
August 2013<br />
July 2013<br />
June 2013<br />
New Listings<br />
203<br />
194<br />
206<br />
209<br />
163<br />
222<br />
134<br />
142<br />
184<br />
168<br />
194<br />
193<br />
165<br />
Percent Change<br />
Year-over-Year<br />
23.0%<br />
-3.0%<br />
8.4%<br />
18.1%<br />
-10.4%<br />
14.4%<br />
3.1%<br />
-4.7%<br />
17.9%<br />
27.3%<br />
-1.0%<br />
2.7%<br />
-12.7%<br />
250<br />
200<br />
150<br />
100<br />
50<br />
0<br />
2010 2011 2012 2013<br />
J F M A M J J A S O N D J F M A M J J A S O N D J F M A M J J A S O N D J F M A M J J A S O N D J F M A M J<br />
Produced by Florida REALTORS® with data provided by Florida's multiple listing services. Statistics for each month compiled from MLS feeds on the 15th day of the following month.<br />
Data released on Tuesday, July 22, 2014. Next data release is Thursday, August 21, 2014.
Median Sale Price<br />
Average Sale<br />
Price<br />
Monthly Market Detail - June 2014<br />
Townhouses and Condos<br />
Bay County Association of REALTORS®<br />
This report describes member activity for the association and is not confined to any specific geographic area.<br />
Median Sale Price<br />
The median sale price reported for the month (i.e. 50%<br />
of sales were above and 50% of sales were below)<br />
Economists' note : Median Sale Price is our preferred summary<br />
statistic for price activity because, unlike Average Sale Price, Median<br />
Sale Price is not sensitive to high sale prices for small numbers of<br />
homes that may not be characteristic of the market area.<br />
Month<br />
Median Sale Price<br />
Percent Change<br />
Year-over-Year<br />
June 2014 $181,000 0.9%<br />
May 2014 $165,000 -7.8%<br />
April 2014 $183,000 -1.1%<br />
March 2014 $179,900 5.5%<br />
February 2014 $169,950 -5.6%<br />
January 2014 $145,000 -11.6%<br />
December 2013 $200,000 3.9%<br />
November 2013 $174,500 9.7%<br />
October 2013 $216,750 36.8%<br />
September 2013 $169,850 4.8%<br />
August 2013 $155,000 -13.9%<br />
July 2013 $172,000 1.2%<br />
June 2013 $179,400 -8.2%<br />
$230K<br />
$210K<br />
$190K<br />
$170K<br />
$150K<br />
$130K<br />
2010 2011 2012 2013<br />
J F M A M J J A S O N D J F M A M J J A S O N D J F M A M J J A S O N D J F M A M J J A S O N D J F M A M J<br />
Average Sale Price<br />
The average sale price reported for the month (i.e.<br />
total sales in dollars divided by the number of sales)<br />
Economists' note : As noted above, we prefer Median Sale Price over<br />
Average Sale Price as a summary statistic for home prices. However,<br />
Average Sale Price does have its uses—particularly when it is analyzed<br />
alongside the Median Sale Price. For one, the relative difference<br />
between the two statistics can provide some insight into the market for<br />
higher-end homes in an area.<br />
Month<br />
Average Sale Price<br />
Percent Change<br />
Year-over-Year<br />
June 2014 $215,274 3.7%<br />
May 2014 $191,055 1.1%<br />
April 2014 $206,361 -0.5%<br />
March 2014 $199,715 3.4%<br />
February 2014 $193,252 4.0%<br />
January 2014 $174,493 -3.7%<br />
December 2013 $208,054 2.2%<br />
November 2013 $194,646 14.6%<br />
October 2013 $215,022 26.1%<br />
September 2013 $181,630 8.8%<br />
August 2013 $187,613 0.5%<br />
July 2013 $200,553 2.2%<br />
June 2013 $207,548 -18.5%<br />
$290K<br />
2010 2011 2012 2013<br />
$240K<br />
$190K<br />
$140K<br />
J F M A M J J A S O N D J F M A M J J A S O N D J F M A M J J A S O N D J F M A M J J A S O N D J F M A M J<br />
Produced by Florida REALTORS® with data provided by Florida's multiple listing services. Statistics for each month compiled from MLS feeds on the 15th day of the following month.<br />
Data released on Tuesday, July 22, 2014. Next data release is Thursday, August 21, 2014.
Median Days on<br />
Market<br />
Avg. Pct. of Orig.<br />
List Price<br />
Received<br />
Monthly Market Detail - June 2014<br />
Townhouses and Condos<br />
Bay County Association of REALTORS®<br />
This report describes member activity for the association and is not confined to any specific geographic area.<br />
Median Days on Market<br />
The median number of days that properties sold during<br />
the month were on the market<br />
Economists' note : Median Days on Market is the amount of time the<br />
"middle" property selling this month was on the market. That is, 50%<br />
of homes selling this month took less time to sell, and 50% of homes<br />
took more time to sell. We use the median rather than the average<br />
because the median is not particularly sensitive to sales of homes that<br />
took an unusually large amount of time to sell relative to the vast<br />
majority of homes in the market.<br />
Month<br />
Median Days on<br />
Market<br />
Percent Change<br />
Year-over-Year<br />
June 2014 65 -7.1%<br />
May 2014 57 -9.5%<br />
April 2014 86 26.5%<br />
March 2014 82 24.2%<br />
February 2014 77 5.5%<br />
January 2014 77 -16.3%<br />
December 2013 70 4.5%<br />
November 2013 59 -19.2%<br />
October 2013 61 -19.7%<br />
September 2013 60 -1.6%<br />
August 2013 82 -8.9%<br />
July 2013 70 -10.3%<br />
June 2013 70 -23.1%<br />
200<br />
2010 2011 2012 2013<br />
150<br />
100<br />
50<br />
0<br />
J F M A M J J A S O N D J F M A M J J A S O N D J F M A M J J A S O N D J F M A M J J A S O N D J F M A M J<br />
Average Percent of Original List Price Received<br />
The average of the sale price (as a percentage of the original list<br />
price) across all properties selling during the month<br />
Economists' note : The Average Percent of Original List Price Received<br />
is an indicator of market conditions, in that in a recovering market, the<br />
measure rises as buyers realize that the market may be moving away<br />
from them and they need to match the selling price (or better it) in<br />
order to get a contract on the house. This is usually the last measure to<br />
indicate a market that has shifted from down to up, and is another<br />
lagging indicator.<br />
Month<br />
Avg. Pct. of Orig. List<br />
Price Received<br />
Percent Change<br />
Year-over-Year<br />
June 2014 93.4% 1.5%<br />
May 2014 93.3% 1.9%<br />
April 2014 92.7% 1.3%<br />
March 2014 92.4% 0.4%<br />
February 2014 91.7% 0.0%<br />
January 2014 92.5% 0.9%<br />
December 2013 92.4% 0.2%<br />
November 2013 93.2% 3.2%<br />
October 2013 94.1% 4.1%<br />
September 2013 92.1% 2.3%<br />
August 2013 93.8% 2.6%<br />
July 2013 92.4% 0.4%<br />
June 2013 92.0% -0.1%<br />
100%<br />
95%<br />
90%<br />
85%<br />
80%<br />
75%<br />
2010 2011 2012 2013<br />
J F M A M J J A S O N D J F M A M J J A S O N D J F M A M J J A S O N D J F M A M J J A S O N D J F M A M J<br />
Produced by Florida REALTORS® with data provided by Florida's multiple listing services. Statistics for each month compiled from MLS feeds on the 15th day of the following month.<br />
Data released on Tuesday, July 22, 2014. Next data release is Thursday, August 21, 2014.
Inventory<br />
Months Supply of<br />
Inventory<br />
Monthly Market Detail - June 2014<br />
Townhouses and Condos<br />
Bay County Association of REALTORS®<br />
This report describes member activity for the association and is not confined to any specific geographic area.<br />
Inventory (Active Listings)<br />
The number of property listings active at the end of<br />
the month<br />
Economists' note : There are a number of ways to calculate Inventory,<br />
so these numbers may not match up to others you see in your market.<br />
We calculate Inventory by counting the number of active listings on the<br />
last day of the month, and hold this number to compare with the same<br />
month the following year.<br />
Month<br />
Inventory<br />
Percent Change<br />
Year-over-Year<br />
June 2014 1,019 12.2%<br />
May 2014 986 5.7%<br />
April 2014 980 5.6%<br />
March 2014 923 0.0%<br />
February 2014 879 -4.1%<br />
January 2014 918 1.3%<br />
December 2013 901 -7.2%<br />
November 2013 906 -4.7%<br />
October 2013 901 -9.5%<br />
September 2013 895 -13.9%<br />
August 2013 913 -15.1%<br />
July 2013 902 -15.9%<br />
June 2013 908 -17.2%<br />
2,200<br />
2010 2011 2012 2013<br />
1,700<br />
1,200<br />
700<br />
J F M A M J J A S O N D J F M A M J J A S O N D J F M A M J J A S O N D J F M A M J J A S O N D J F M A M J<br />
Months Supply of Inventory<br />
An estimate of the number of months it will take to<br />
deplete the current Inventory given recent sales rates<br />
Economists' note : This is an indicator of the state of the market,<br />
whether it is a buyers' market or a sellers' market. The benchmark for<br />
a balanced market (favoring neither buyer nor seller) is 5.5 Months of<br />
Inventory. Higher numbers indicate a buyers' market, lower numbers<br />
a sellers' market.<br />
Month<br />
Months Supply<br />
Percent Change<br />
Year-over-Year<br />
June 2014 8.0 2.1%<br />
May 2014 7.6 -5.1%<br />
April 2014 7.5 -7.0%<br />
March 2014 7.0 -15.2%<br />
February 2014 6.7 -18.9%<br />
January 2014 7.0 -15.8%<br />
December 2013 7.0 -20.9%<br />
November 2013 7.1 -20.2%<br />
October 2013 7.1 -24.4%<br />
September 2013 7.3 -25.5%<br />
August 2013 7.6 -25.9%<br />
July 2013 7.6 -26.5%<br />
June 2013 7.8 -27.4%<br />
25.0<br />
2010 2011 2012 2013<br />
20.0<br />
15.0<br />
10.0<br />
5.0<br />
J F M A M J J A S O N D J F M A M J J A S O N D J F M A M J J A S O N D J F M A M J J A S O N D J F M A M J<br />
Produced by Florida REALTORS® with data provided by Florida's multiple listing services. Statistics for each month compiled from MLS feeds on the 15th day of the following month.<br />
Data released on Tuesday, July 22, 2014. Next data release is Thursday, August 21, 2014.
<strong>Closed</strong> <strong>Sales</strong><br />
Median Days<br />
on Market<br />
Monthly Market Detail - June 2014<br />
Townhouses and Condos<br />
Bay County Association of REALTORS®<br />
This report describes member activity for the association and is not confined to any specific geographic area.<br />
<strong>Closed</strong> <strong>Sales</strong> by Sale Price<br />
The number of sales transactions which closed during<br />
the month<br />
Economists' note : <strong>Closed</strong> <strong>Sales</strong> are one of the simplest—yet most<br />
important—indicators for the residential real estate market. When<br />
comparing <strong>Closed</strong> <strong>Sales</strong> across markets of different sizes, we<br />
recommend using the year-over-year percent changes rather than the<br />
absolute counts. Realtors® and their clients should also be wary of<br />
month-to-month comparisons of <strong>Closed</strong> <strong>Sales</strong> because of potential<br />
seasonal effects.<br />
30<br />
25<br />
20<br />
15<br />
10<br />
5<br />
0<br />
Less than<br />
$50,000<br />
June 2013 June 2014<br />
$50,000 -<br />
$99,999<br />
$100,000 -<br />
$149,999<br />
$150,000 -<br />
$199,999<br />
$200,000 -<br />
$249,999<br />
$250,000 -<br />
$299,999<br />
Sale Price<br />
<strong>Closed</strong> <strong>Sales</strong><br />
Percent Change<br />
Year-over-Year<br />
Less than $50,000 2 0.0%<br />
$50,000 - $99,999 17 -19.0%<br />
$100,000 - $149,999 27 3.8%<br />
$150,000 - $199,999 16 -40.7%<br />
$200,000 - $249,999 11 -54.2%<br />
$250,000 - $299,999 18 38.5%<br />
$300,000 - $399,999 15 7.1%<br />
$400,000 - $599,999 7 75.0%<br />
$600,000 - $999,999 0 -100.0%<br />
$1,000,000 or more 1 0.0%<br />
$300,000 -<br />
$399,999<br />
$400,000 -<br />
$599,999<br />
$600,000 -<br />
$999,999<br />
$1,000,000 or<br />
more<br />
30<br />
25<br />
20<br />
15<br />
10<br />
5<br />
0<br />
Median Days on Market by Sale Price<br />
The median number of days that properties sold during<br />
the month were on the market<br />
Economists' note: Median Days on Market is the amount of time the<br />
"middle" property selling this month was on the market. That is, 50%<br />
of homes selling this month took less time to sell, and 50% of homes<br />
took more time to sell. We use the median rather than the average<br />
because the median is not particularly sensitive to sales of homes that<br />
took an unusually large amount of time to sell relative to the vast<br />
majority of homes in the market.<br />
700<br />
600<br />
500<br />
400<br />
300<br />
200<br />
100<br />
0<br />
Less than<br />
$50,000<br />
June 2013 June 2014<br />
$50,000 -<br />
$99,999<br />
$100,000 -<br />
$149,999<br />
$150,000 -<br />
$199,999<br />
$200,000 -<br />
$249,999<br />
$250,000 -<br />
$299,999<br />
Sale Price<br />
$50,000 - $99,999 111 8.8%<br />
$100,000 - $149,999<br />
Median Days on<br />
Market<br />
Percent Change<br />
Year-over-Year<br />
Less than $50,000 135 400.0%<br />
71 4.4%<br />
$150,000 - $199,999 60 -52.4%<br />
$200,000 - $249,999 81 44.6%<br />
$250,000 - $299,999<br />
64 255.6%<br />
$300,000 - $399,999 118 63.9%<br />
$400,000 - $599,999 24 -17.2%<br />
$600,000 - $999,999 (No <strong>Sales</strong>) N/A<br />
$1,000,000 or more 21 -96.5%<br />
$300,000 -<br />
$399,999<br />
$400,000 -<br />
$599,999<br />
$600,000 -<br />
$999,999<br />
$1,000,000 or<br />
more<br />
700<br />
600<br />
500<br />
400<br />
300<br />
200<br />
100<br />
0<br />
Produced by Florida REALTORS® with data provided by Florida's multiple listing services. Statistics for each month compiled from MLS feeds on the 15th day of the following month.<br />
Data released on Tuesday, July 22, 2014. Next data release is Thursday, August 21, 2014.
New Listings<br />
Inventory<br />
Monthly Market Detail - June 2014<br />
Townhouses and Condos<br />
Bay County Association of REALTORS®<br />
This report describes member activity for the association and is not confined to any specific geographic area.<br />
New Listings by Initial Listing Price<br />
The number of properties put onto the market during<br />
the month<br />
Economists' note: In a recovering market, we expect that new listings<br />
will eventually rise as sellers raise their estimations of value. But this<br />
increase will take place only after the market has turned up, so New<br />
Listings are a lagging indicator of the health of the market. Also be<br />
aware of properties which have been withdrawn from the market and<br />
then relisted. These are not really New Listings.<br />
45<br />
40<br />
35<br />
30<br />
25<br />
20<br />
15<br />
10<br />
5<br />
0<br />
Less than<br />
$50,000<br />
June 2013 June 2014<br />
$50,000 -<br />
$99,999<br />
$100,000 -<br />
$149,999<br />
$150,000 -<br />
$199,999<br />
$200,000 -<br />
$249,999<br />
$250,000 -<br />
$299,999<br />
Initial Listing Price<br />
New Listings<br />
Percent Change<br />
Year-over-Year<br />
Less than $50,000 5 66.7%<br />
$50,000 - $99,999 23 -4.2%<br />
$100,000 - $149,999 33 0.0%<br />
$150,000 - $199,999 40 42.9%<br />
$200,000 - $249,999 26 4.0%<br />
$250,000 - $299,999 23 -8.0%<br />
$300,000 - $399,999 30 66.7%<br />
$400,000 - $599,999 19 137.5%<br />
$600,000 - $999,999 3 200.0%<br />
$1,000,000 or more 1 N/A<br />
$300,000 -<br />
$399,999<br />
$400,000 -<br />
$599,999<br />
$600,000 -<br />
$999,999<br />
$1,000,000 or<br />
more<br />
45<br />
40<br />
35<br />
30<br />
25<br />
20<br />
15<br />
10<br />
5<br />
0<br />
Inventory by Current Listing Price<br />
The number of property listings active at the end of<br />
the month<br />
Economists' note: There are a number of ways to calculate Inventory,<br />
so these numbers may not match up to others you see in your market.<br />
We calculate Inventory by counting the number of active listings on the<br />
last day of the month, and hold this number to compare with the same<br />
month the following year.<br />
200<br />
150<br />
June 2013 June 2014<br />
Current Listing Price<br />
Inventory<br />
Percent Change<br />
Year-over-Year<br />
Less than $50,000 16 60.0%<br />
$50,000 - $99,999 102 -11.3%<br />
$100,000 - $149,999 158 6.0%<br />
$150,000 - $199,999 180 12.5%<br />
$200,000 - $249,999 129 18.3%<br />
$250,000 - $299,999 122 16.2%<br />
$300,000 - $399,999 189 37.0%<br />
$400,000 - $599,999 94 3.3%<br />
$600,000 - $999,999 26 -7.1%<br />
$1,000,000 or more 3 0.0%<br />
200<br />
150<br />
100<br />
100<br />
50<br />
50<br />
0<br />
Less than<br />
$50,000<br />
$50,000 -<br />
$99,999<br />
$100,000 -<br />
$149,999<br />
$150,000 -<br />
$199,999<br />
$200,000 -<br />
$249,999<br />
$250,000 -<br />
$299,999<br />
$300,000 -<br />
$399,999<br />
$400,000 -<br />
$599,999<br />
$600,000 -<br />
$999,999<br />
$1,000,000 or<br />
more<br />
0<br />
Produced by Florida REALTORS® with data provided by Florida's multiple listing services. Statistics for each month compiled from MLS feeds on the 15th day of the following month.<br />
Data released on Tuesday, July 22, 2014. Next data release is Thursday, August 21, 2014.
<strong>Closed</strong> <strong>Sales</strong><br />
Median Sale Price<br />
Monthly Distressed Market - June 2014<br />
Townhouses and Condos<br />
Bay County Association of REALTORS®<br />
This report describes member activity for the association and is not confined to any specific geographic area.<br />
June 2014 June 2013<br />
Percent Change<br />
Year-over-Year<br />
Traditional<br />
<strong>Closed</strong> <strong>Sales</strong><br />
Median Sale Price<br />
99 119 -16.8%<br />
$182,500 $185,000 -1.4%<br />
Foreclosure/REO<br />
<strong>Closed</strong> <strong>Sales</strong><br />
Median Sale Price<br />
13 10 30.0%<br />
$95,000 $98,000 -3.1%<br />
Short Sale<br />
<strong>Closed</strong> <strong>Sales</strong><br />
Median Sale Price<br />
2 5 -60.0%<br />
$181,000 $226,000 -19.9%<br />
100%<br />
90%<br />
80%<br />
70%<br />
60%<br />
50%<br />
40%<br />
30%<br />
20%<br />
10%<br />
0%<br />
$300,000<br />
2010 2011 2012 2013<br />
Traditional Foreclosure/REO Short Sale<br />
J F M A M J J A S O N D J F M A M J J A S O N D J F M A M J J A S O N D J F M A M J J A S O N D J F M A M J<br />
$250,000<br />
$200,000<br />
$150,000<br />
$100,000<br />
$50,000<br />
$0<br />
J F M A M J J A S O N D J F M A M J J A S O N D J F M A M J J A S O N D J F M A M J J A S O N D J F M A M J<br />
2010 2011 2012 2013<br />
Produced by Florida REALTORS® with data provided by Florida's multiple listing services. Statistics for each month compiled from MLS feeds on the 15th day of the following month.<br />
Data released on Tuesday, July 22, 2014. Next data release is Thursday, August 21, 2014.
<strong>Closed</strong> <strong>Sales</strong><br />
Monthly Market Detail - June 2014<br />
Manufactured Homes<br />
Bay County Association of REALTORS®<br />
This report describes member activity for the association and is not confined to any specific geographic area.<br />
Summary Statistics<br />
June 2014<br />
June 2013<br />
Percent Change<br />
Year-over-Year<br />
<strong>Closed</strong> <strong>Sales</strong><br />
Paid in Cash<br />
21 17 23.5%<br />
13 11 18.2%<br />
New Pending <strong>Sales</strong><br />
26<br />
27 -3.7%<br />
New Listings<br />
Median Sale Price<br />
29 31 -6.5%<br />
$60,000 $52,000 15.4%<br />
Average Sale Price<br />
$71,695<br />
$63,582 12.8%<br />
Median Days on Market<br />
88 83 6.0%<br />
Average Percent of Original List<br />
Price Received<br />
84.1%<br />
83.2%<br />
1.1%<br />
Pending Inventory<br />
Inventory (Active Listings)<br />
32<br />
202<br />
30 6.7%<br />
214 -5.6%<br />
Months Supply of Inventory 11.6<br />
14.6 -20.5%<br />
<strong>Closed</strong> <strong>Sales</strong><br />
The number of sales transactions which closed during<br />
the month<br />
Economists' note : <strong>Closed</strong> <strong>Sales</strong> are one of the simplest—yet most<br />
important—indicators for the residential real estate market. When<br />
comparing <strong>Closed</strong> <strong>Sales</strong> across markets of different sizes, we<br />
recommend using the year-over-year percent changes rather than the<br />
absolute counts. Realtors® and their clients should also be wary of<br />
month-to-month comparisons of <strong>Closed</strong> <strong>Sales</strong> because of potential<br />
seasonal effects.<br />
Month<br />
<strong>Closed</strong> <strong>Sales</strong><br />
Percent Change<br />
Year-over-Year<br />
June 2014<br />
21<br />
23.5%<br />
May 2014 29 26.1%<br />
April 2014 14<br />
40.0%<br />
March 2014<br />
February 2014<br />
January 2014<br />
December 2013<br />
November 2013<br />
October 2013<br />
21<br />
14<br />
11<br />
20<br />
16<br />
15<br />
200.0%<br />
16.7%<br />
-26.7%<br />
11.1%<br />
45.5%<br />
-16.7%<br />
September 2013 15<br />
7.1%<br />
August 2013<br />
July 2013<br />
12<br />
21<br />
-20.0%<br />
31.3%<br />
June 2013 17<br />
-22.7%<br />
40<br />
2010 2011 2012 2013<br />
30<br />
20<br />
10<br />
0<br />
J F M A M J J A S O N D J F M A M J J A S O N D J F M A M J J A S O N D J F M A M J J A S O N D J F M A M J<br />
Produced by Florida REALTORS® with data provided by Florida's multiple listing services. Statistics for each month compiled from MLS feeds on the 15th day of the following month.<br />
Data released on Tuesday, July 22, 2014. Next data release is Thursday, August 21, 2014.
Cash <strong>Sales</strong><br />
Pct. of <strong>Closed</strong><br />
<strong>Sales</strong> Paid in Cash<br />
Monthly Market Detail - June 2014<br />
Manufactured Homes<br />
Bay County Association of REALTORS®<br />
This report describes member activity for the association and is not confined to any specific geographic area.<br />
Cash <strong>Sales</strong><br />
The number of <strong>Closed</strong> <strong>Sales</strong> during the month in which<br />
buyers exclusively paid in cash<br />
Economists' note : Cash <strong>Sales</strong> can be a useful indicator of the extent to<br />
which investors are participating in the market. Why? Investors are<br />
far more likely to have the funds to purchase a home available up front,<br />
whereas the typical homebuyer requires a mortgage or some other<br />
form of financing. There are, of course, many possible exceptions, so<br />
this statistic should be interpreted with care.<br />
Month<br />
Cash <strong>Sales</strong><br />
Percent Change<br />
Year-over-Year<br />
June 2014 13 18.2%<br />
May 2014 16 45.5%<br />
April 2014 9 125.0%<br />
March 2014 11 450.0%<br />
February 2014 10 66.7%<br />
January 2014 3 -70.0%<br />
December 2013 11 57.1%<br />
November 2013 11 120.0%<br />
October 2013 8 -27.3%<br />
September 2013 8 -11.1%<br />
August 2013 5 -44.4%<br />
July 2013 12 9.1%<br />
June 2013 11 0.0%<br />
20<br />
2010 2011 2012 2013<br />
15<br />
10<br />
5<br />
0<br />
J F M A M J J A S O N D J F M A M J J A S O N D J F M A M J J A S O N D J F M A M J J A S O N D J F M A M J<br />
Cash <strong>Sales</strong> as a Percentage of <strong>Closed</strong> <strong>Sales</strong><br />
The percentage of <strong>Closed</strong> <strong>Sales</strong> during the month<br />
which were Cash <strong>Sales</strong><br />
Economists' note : This statistic is simply another way of viewing<br />
Cash <strong>Sales</strong>. The remaining percentages of <strong>Closed</strong> <strong>Sales</strong> (i.e. those not<br />
paid fully in cash) each month involved some sort of financing, such as<br />
mortgages, owner/seller financing, assumed loans, etc.<br />
Month<br />
Percent of <strong>Closed</strong><br />
<strong>Sales</strong> Paid in Cash<br />
Percent Change<br />
Year-over-Year<br />
June 2014 61.9% -4.3%<br />
May 2014 55.2% 15.4%<br />
April 2014 64.3% 60.7%<br />
March 2014 52.4% 83.3%<br />
February 2014 71.4% 42.9%<br />
January 2014 27.3% -59.1%<br />
December 2013 55.0% 41.4%<br />
November 2013 68.8% 51.3%<br />
October 2013 53.3% -12.7%<br />
September 2013 53.3% -17.0%<br />
August 2013 41.7% -30.6%<br />
July 2013 57.1% -16.9%<br />
June 2013 64.7% 29.4%<br />
80%<br />
2010 2011 2012 2013<br />
60%<br />
40%<br />
20%<br />
0%<br />
J F M A M J J A S O N D J F M A M J J A S O N D J F M A M J J A S O N D J F M A M J J A S O N D J F M A M J<br />
Produced by Florida REALTORS® with data provided by Florida's multiple listing services. Statistics for each month compiled from MLS feeds on the 15th day of the following month.<br />
Data released on Tuesday, July 22, 2014. Next data release is Thursday, August 21, 2014.
Pending <strong>Sales</strong><br />
New Listings<br />
Monthly Market Detail - June 2014<br />
Manufactured Homes<br />
Bay County Association of REALTORS®<br />
This report describes member activity for the association and is not confined to any specific geographic area.<br />
New Pending <strong>Sales</strong><br />
The number of property listings that went from<br />
"Active" to "Pending" status during the month<br />
Economists' note : Because of the typical length of time it takes for a<br />
sale to close, economists consider Pending <strong>Sales</strong> to be a decent<br />
indicator of potential future <strong>Closed</strong> <strong>Sales</strong>. It is important to bear in<br />
mind, however, that not all Pending <strong>Sales</strong> will be closed successfully.<br />
So, the effectiveness of Pending <strong>Sales</strong> as a future indicator of <strong>Closed</strong><br />
<strong>Sales</strong> is susceptible to changes in market conditions such as the<br />
availability of financing for homebuyers and the inventory of<br />
distressed properties for sale.<br />
Month<br />
June 2014<br />
May 2014<br />
April 2014<br />
March 2014<br />
18<br />
February 2014 22<br />
January 2014<br />
December 2013<br />
November 2013<br />
October 2013<br />
September 2013<br />
August 2013<br />
July 2013<br />
June 2013<br />
New Pending <strong>Sales</strong><br />
26<br />
29<br />
26<br />
22<br />
18<br />
16<br />
25<br />
17<br />
14<br />
17<br />
27<br />
Percent Change<br />
Year-over-Year<br />
-3.7%<br />
52.6%<br />
8.3%<br />
12.5%<br />
37.5%<br />
0.0%<br />
38.5%<br />
-5.9%<br />
56.3%<br />
-5.6%<br />
7.7%<br />
-5.6%<br />
42.1%<br />
40<br />
2010 2011 2012 2013<br />
30<br />
20<br />
10<br />
0<br />
J F M A M J J A S O N D J F M A M J J A S O N D J F M A M J J A S O N D J F M A M J J A S O N D J F M A M J<br />
New Listings<br />
The number of properties put onto the market during<br />
the month<br />
Economists' note : In a recovering market, we expect that new listings<br />
will eventually rise as sellers raise their estimations of value. But this<br />
increase will take place only after the market has turned up, so New<br />
Listings are a lagging indicator of the health of the market. Also be<br />
aware of properties which have been withdrawn from the market and<br />
then relisted. These are not really New Listings.<br />
Month<br />
June 2014<br />
May 2014<br />
April 2014<br />
March 2014<br />
February 2014<br />
January 2014<br />
December 2013<br />
November 2013<br />
October 2013<br />
September 2013<br />
August 2013<br />
July 2013<br />
June 2013<br />
New Listings<br />
29<br />
36<br />
32<br />
35<br />
38<br />
39<br />
32<br />
37<br />
34<br />
32<br />
35<br />
34<br />
31<br />
Percent Change<br />
Year-over-Year<br />
-6.5%<br />
16.1%<br />
-25.6%<br />
-16.7%<br />
31.0%<br />
14.7%<br />
52.4%<br />
19.4%<br />
-10.5%<br />
45.5%<br />
29.6%<br />
0.0%<br />
-16.2%<br />
60<br />
50<br />
40<br />
30<br />
20<br />
10<br />
0<br />
2010 2011 2012 2013<br />
J F M A M J J A S O N D J F M A M J J A S O N D J F M A M J J A S O N D J F M A M J J A S O N D J F M A M J<br />
Produced by Florida REALTORS® with data provided by Florida's multiple listing services. Statistics for each month compiled from MLS feeds on the 15th day of the following month.<br />
Data released on Tuesday, July 22, 2014. Next data release is Thursday, August 21, 2014.
Median Sale Price<br />
Average Sale<br />
Price<br />
Monthly Market Detail - June 2014<br />
Manufactured Homes<br />
Bay County Association of REALTORS®<br />
This report describes member activity for the association and is not confined to any specific geographic area.<br />
Median Sale Price<br />
The median sale price reported for the month (i.e. 50%<br />
of sales were above and 50% of sales were below)<br />
Economists' note : Median Sale Price is our preferred summary<br />
statistic for price activity because, unlike Average Sale Price, Median<br />
Sale Price is not sensitive to high sale prices for small numbers of<br />
homes that may not be characteristic of the market area.<br />
Month<br />
Median Sale Price<br />
Percent Change<br />
Year-over-Year<br />
June 2014 $60,000 15.4%<br />
May 2014 $50,000 -9.1%<br />
April 2014 $47,375 -20.5%<br />
March 2014 $42,500 41.7%<br />
February 2014 $36,650 -28.1%<br />
January 2014 $50,000 -5.7%<br />
December 2013 $43,051 0.8%<br />
November 2013 $47,750 -4.5%<br />
October 2013 $58,300 41.3%<br />
September 2013 $43,000 5.1%<br />
August 2013 $45,950 -16.4%<br />
July 2013 $54,900 40.8%<br />
June 2013 $52,000 26.8%<br />
$80K<br />
$70K<br />
$60K<br />
$50K<br />
$40K<br />
$30K<br />
$20K<br />
2010 2011 2012 2013<br />
J F M A M J J A S O N D J F M A M J J A S O N D J F M A M J J A S O N D J F M A M J J A S O N D J F M A M J<br />
Average Sale Price<br />
The average sale price reported for the month (i.e.<br />
total sales in dollars divided by the number of sales)<br />
Economists' note : As noted above, we prefer Median Sale Price over<br />
Average Sale Price as a summary statistic for home prices. However,<br />
Average Sale Price does have its uses—particularly when it is analyzed<br />
alongside the Median Sale Price. For one, the relative difference<br />
between the two statistics can provide some insight into the market for<br />
higher-end homes in an area.<br />
Month<br />
Average Sale Price<br />
Percent Change<br />
Year-over-Year<br />
June 2014 $71,695 12.8%<br />
May 2014 $53,750 -5.2%<br />
April 2014 $52,046 -20.3%<br />
March 2014 $57,986 4.6%<br />
February 2014 $54,964 15.4%<br />
January 2014 $43,227 -25.5%<br />
December 2013 $54,820 10.6%<br />
November 2013 $54,742 0.5%<br />
October 2013 $67,711 51.3%<br />
September 2013 $47,867 4.7%<br />
August 2013 $59,575 -21.8%<br />
July 2013 $65,829 60.9%<br />
June 2013 $63,582 16.2%<br />
$100K<br />
2010 2011 2012 2013<br />
$80K<br />
$60K<br />
$40K<br />
$20K<br />
J F M A M J J A S O N D J F M A M J J A S O N D J F M A M J J A S O N D J F M A M J J A S O N D J F M A M J<br />
Produced by Florida REALTORS® with data provided by Florida's multiple listing services. Statistics for each month compiled from MLS feeds on the 15th day of the following month.<br />
Data released on Tuesday, July 22, 2014. Next data release is Thursday, August 21, 2014.
Median Days on<br />
Market<br />
Avg. Pct. of Orig.<br />
List Price<br />
Received<br />
Monthly Market Detail - June 2014<br />
Manufactured Homes<br />
Bay County Association of REALTORS®<br />
This report describes member activity for the association and is not confined to any specific geographic area.<br />
Median Days on Market<br />
The median number of days that properties sold during<br />
the month were on the market<br />
Economists' note : Median Days on Market is the amount of time the<br />
"middle" property selling this month was on the market. That is, 50%<br />
of homes selling this month took less time to sell, and 50% of homes<br />
took more time to sell. We use the median rather than the average<br />
because the median is not particularly sensitive to sales of homes that<br />
took an unusually large amount of time to sell relative to the vast<br />
majority of homes in the market.<br />
Month<br />
Median Days on<br />
Market<br />
Percent Change<br />
Year-over-Year<br />
June 2014 88 6.0%<br />
May 2014 94 88.0%<br />
April 2014 95 18.8%<br />
March 2014 86 -34.8%<br />
February 2014 48 -27.3%<br />
January 2014 103 66.1%<br />
December 2013 108 22.7%<br />
November 2013 60 -54.2%<br />
October 2013 86 -4.4%<br />
September 2013 110 31.0%<br />
August 2013 135 51.7%<br />
July 2013 75 -21.9%<br />
June 2013 83 -7.8%<br />
300<br />
250<br />
200<br />
150<br />
100<br />
50<br />
0<br />
2010 2011 2012 2013<br />
J F M A M J J A S O N D J F M A M J J A S O N D J F M A M J J A S O N D J F M A M J J A S O N D J F M A M J<br />
Average Percent of Original List Price Received<br />
The average of the sale price (as a percentage of the original list<br />
price) across all properties selling during the month<br />
Economists' note : The Average Percent of Original List Price Received<br />
is an indicator of market conditions, in that in a recovering market, the<br />
measure rises as buyers realize that the market may be moving away<br />
from them and they need to match the selling price (or better it) in<br />
order to get a contract on the house. This is usually the last measure to<br />
indicate a market that has shifted from down to up, and is another<br />
lagging indicator.<br />
Month<br />
Avg. Pct. of Orig. List<br />
Price Received<br />
Percent Change<br />
Year-over-Year<br />
June 2014 84.1% 1.1%<br />
May 2014 81.4% -0.9%<br />
April 2014 82.4% -4.7%<br />
March 2014 84.5% 10.5%<br />
February 2014 92.2% 5.5%<br />
January 2014 81.5% -1.8%<br />
December 2013 81.7% -0.2%<br />
November 2013 80.6% 6.6%<br />
October 2013 83.7% 2.7%<br />
September 2013 75.9% -5.6%<br />
August 2013 85.1% 0.6%<br />
July 2013 84.2% 0.4%<br />
June 2013 83.2% -3.9%<br />
95%<br />
90%<br />
85%<br />
80%<br />
75%<br />
70%<br />
65%<br />
2010 2011 2012 2013<br />
J F M A M J J A S O N D J F M A M J J A S O N D J F M A M J J A S O N D J F M A M J J A S O N D J F M A M J<br />
Produced by Florida REALTORS® with data provided by Florida's multiple listing services. Statistics for each month compiled from MLS feeds on the 15th day of the following month.<br />
Data released on Tuesday, July 22, 2014. Next data release is Thursday, August 21, 2014.
Inventory<br />
Months Supply of<br />
Inventory<br />
Monthly Market Detail - June 2014<br />
Manufactured Homes<br />
Bay County Association of REALTORS®<br />
This report describes member activity for the association and is not confined to any specific geographic area.<br />
Inventory (Active Listings)<br />
The number of property listings active at the end of<br />
the month<br />
Economists' note : There are a number of ways to calculate Inventory,<br />
so these numbers may not match up to others you see in your market.<br />
We calculate Inventory by counting the number of active listings on the<br />
last day of the month, and hold this number to compare with the same<br />
month the following year.<br />
Month<br />
Inventory<br />
Percent Change<br />
Year-over-Year<br />
June 2014 202 -5.6%<br />
May 2014 210 -7.9%<br />
April 2014 214 -2.7%<br />
March 2014 218 4.8%<br />
February 2014 222 15.6%<br />
January 2014 222 13.8%<br />
December 2013 231 15.5%<br />
November 2013 227 5.6%<br />
October 2013 208 -4.1%<br />
September 2013 227 7.1%<br />
August 2013 222 -0.4%<br />
July 2013 208 -8.4%<br />
June 2013 214 -7.8%<br />
400<br />
2010 2011 2012 2013<br />
300<br />
200<br />
100<br />
0<br />
J F M A M J J A S O N D J F M A M J J A S O N D J F M A M J J A S O N D J F M A M J J A S O N D J F M A M J<br />
Months Supply of Inventory<br />
An estimate of the number of months it will take to<br />
deplete the current Inventory given recent sales rates<br />
Economists' note : This is an indicator of the state of the market,<br />
whether it is a buyers' market or a sellers' market. The benchmark for<br />
a balanced market (favoring neither buyer nor seller) is 5.5 Months of<br />
Inventory. Higher numbers indicate a buyers' market, lower numbers<br />
a sellers' market.<br />
Month<br />
Months Supply<br />
Percent Change<br />
Year-over-Year<br />
June 2014 11.6 -20.5%<br />
May 2014 12.3 -18.7%<br />
April 2014 12.9 -16.4%<br />
March 2014 13.4 -4.9%<br />
February 2014 14.7 16.9%<br />
January 2014 14.9 13.8%<br />
December 2013 15.1 8.6%<br />
November 2013 15.0 -3.2%<br />
October 2013 14.2 -9.6%<br />
September 2013 15.2 -4.3%<br />
August 2013 15.0 -6.6%<br />
July 2013 13.8 -13.4%<br />
June 2013 14.6 -9.9%<br />
35.0<br />
30.0<br />
25.0<br />
20.0<br />
15.0<br />
10.0<br />
2010 2011 2012 2013<br />
J F M A M J J A S O N D J F M A M J J A S O N D J F M A M J J A S O N D J F M A M J J A S O N D J F M A M J<br />
Produced by Florida REALTORS® with data provided by Florida's multiple listing services. Statistics for each month compiled from MLS feeds on the 15th day of the following month.<br />
Data released on Tuesday, July 22, 2014. Next data release is Thursday, August 21, 2014.
<strong>Closed</strong> <strong>Sales</strong><br />
Median Days<br />
on Market<br />
Monthly Market Detail - June 2014<br />
Manufactured Homes<br />
Bay County Association of REALTORS®<br />
This report describes member activity for the association and is not confined to any specific geographic area.<br />
<strong>Closed</strong> <strong>Sales</strong> by Sale Price<br />
The number of sales transactions which closed during<br />
the month<br />
Economists' note : <strong>Closed</strong> <strong>Sales</strong> are one of the simplest—yet most<br />
important—indicators for the residential real estate market. When<br />
comparing <strong>Closed</strong> <strong>Sales</strong> across markets of different sizes, we<br />
recommend using the year-over-year percent changes rather than the<br />
absolute counts. Realtors® and their clients should also be wary of<br />
month-to-month comparisons of <strong>Closed</strong> <strong>Sales</strong> because of potential<br />
seasonal effects.<br />
9<br />
8<br />
7<br />
6<br />
5<br />
4<br />
3<br />
2<br />
1<br />
0<br />
Less than<br />
$50,000<br />
June 2013 June 2014<br />
$50,000 -<br />
$99,999<br />
$100,000 -<br />
$149,999<br />
$150,000 -<br />
$199,999<br />
$200,000 -<br />
$249,999<br />
$250,000 -<br />
$299,999<br />
Sale Price<br />
<strong>Closed</strong> <strong>Sales</strong><br />
Percent Change<br />
Year-over-Year<br />
Less than $50,000 8 0.0%<br />
$50,000 - $99,999 8 100.0%<br />
$100,000 - $149,999 4 -20.0%<br />
$150,000 - $199,999 1 N/A<br />
$200,000 - $249,999 0 N/A<br />
$250,000 - $299,999 0 N/A<br />
$300,000 - $399,999 0 N/A<br />
$400,000 - $599,999 0 N/A<br />
$600,000 - $999,999 0 N/A<br />
$1,000,000 or more 0 N/A<br />
$300,000 -<br />
$399,999<br />
$400,000 -<br />
$599,999<br />
$600,000 -<br />
$999,999<br />
$1,000,000 or<br />
more<br />
9<br />
8<br />
7<br />
6<br />
5<br />
4<br />
3<br />
2<br />
1<br />
0<br />
Median Days on Market by Sale Price<br />
The median number of days that properties sold during<br />
the month were on the market<br />
Economists' note: Median Days on Market is the amount of time the<br />
"middle" property selling this month was on the market. That is, 50%<br />
of homes selling this month took less time to sell, and 50% of homes<br />
took more time to sell. We use the median rather than the average<br />
because the median is not particularly sensitive to sales of homes that<br />
took an unusually large amount of time to sell relative to the vast<br />
majority of homes in the market.<br />
400<br />
350<br />
300<br />
250<br />
200<br />
150<br />
100<br />
50<br />
0<br />
Less than<br />
$50,000<br />
June 2013 June 2014<br />
$50,000 -<br />
$99,999<br />
$100,000 -<br />
$149,999<br />
$150,000 -<br />
$199,999<br />
$200,000 -<br />
$249,999<br />
$250,000 -<br />
$299,999<br />
Sale Price<br />
$50,000 - $99,999 137 20.2%<br />
$100,000 - $149,999<br />
Median Days on<br />
Market<br />
Percent Change<br />
Year-over-Year<br />
Less than $50,000 85 13.3%<br />
290 -22.9%<br />
$150,000 - $199,999 1 N/A<br />
$200,000 - $249,999 (No <strong>Sales</strong>) N/A<br />
$250,000 - $299,999<br />
(No <strong>Sales</strong>)<br />
N/A<br />
$300,000 - $399,999 (No <strong>Sales</strong>) N/A<br />
$400,000 - $599,999 (No <strong>Sales</strong>) N/A<br />
$600,000 - $999,999 (No <strong>Sales</strong>) N/A<br />
$1,000,000 or more (No <strong>Sales</strong>) N/A<br />
$300,000 -<br />
$399,999<br />
$400,000 -<br />
$599,999<br />
$600,000 -<br />
$999,999<br />
$1,000,000 or<br />
more<br />
400<br />
350<br />
300<br />
250<br />
200<br />
150<br />
100<br />
50<br />
0<br />
Produced by Florida REALTORS® with data provided by Florida's multiple listing services. Statistics for each month compiled from MLS feeds on the 15th day of the following month.<br />
Data released on Tuesday, July 22, 2014. Next data release is Thursday, August 21, 2014.
New Listings<br />
Inventory<br />
Monthly Market Detail - June 2014<br />
Manufactured Homes<br />
Bay County Association of REALTORS®<br />
This report describes member activity for the association and is not confined to any specific geographic area.<br />
New Listings by Initial Listing Price<br />
The number of properties put onto the market during<br />
the month<br />
Economists' note: In a recovering market, we expect that new listings<br />
will eventually rise as sellers raise their estimations of value. But this<br />
increase will take place only after the market has turned up, so New<br />
Listings are a lagging indicator of the health of the market. Also be<br />
aware of properties which have been withdrawn from the market and<br />
then relisted. These are not really New Listings.<br />
16<br />
14<br />
12<br />
10<br />
8<br />
6<br />
4<br />
2<br />
0<br />
Less than<br />
$50,000<br />
June 2013 June 2014<br />
$50,000 -<br />
$99,999<br />
$100,000 -<br />
$149,999<br />
$150,000 -<br />
$199,999<br />
$200,000 -<br />
$249,999<br />
$250,000 -<br />
$299,999<br />
Initial Listing Price<br />
New Listings<br />
Percent Change<br />
Year-over-Year<br />
Less than $50,000 6 -14.3%<br />
$50,000 - $99,999 15 0.0%<br />
$100,000 - $149,999 6 -14.3%<br />
$150,000 - $199,999 1 -50.0%<br />
$200,000 - $249,999 0 N/A<br />
$250,000 - $299,999 1 N/A<br />
$300,000 - $399,999 0 N/A<br />
$400,000 - $599,999 0 N/A<br />
$600,000 - $999,999 0 N/A<br />
$1,000,000 or more 0 N/A<br />
$300,000 -<br />
$399,999<br />
$400,000 -<br />
$599,999<br />
$600,000 -<br />
$999,999<br />
$1,000,000 or<br />
more<br />
16<br />
14<br />
12<br />
10<br />
8<br />
6<br />
4<br />
2<br />
0<br />
Inventory by Current Listing Price<br />
The number of property listings active at the end of<br />
the month<br />
Economists' note: There are a number of ways to calculate Inventory,<br />
so these numbers may not match up to others you see in your market.<br />
We calculate Inventory by counting the number of active listings on the<br />
last day of the month, and hold this number to compare with the same<br />
month the following year.<br />
120<br />
100<br />
80<br />
60<br />
40<br />
20<br />
0<br />
Less than<br />
$50,000<br />
June 2013 June 2014<br />
$50,000 -<br />
$99,999<br />
$100,000 -<br />
$149,999<br />
$150,000 -<br />
$199,999<br />
$200,000 -<br />
$249,999<br />
$250,000 -<br />
$299,999<br />
Current Listing Price<br />
Inventory<br />
Percent Change<br />
Year-over-Year<br />
Less than $50,000 32 -3.0%<br />
$50,000 - $99,999 106 -3.6%<br />
$100,000 - $149,999 46 -9.8%<br />
$150,000 - $199,999 13 8.3%<br />
$200,000 - $249,999 3 0.0%<br />
$250,000 - $299,999 2 -33.3%<br />
$300,000 - $399,999 0 -100.0%<br />
$400,000 - $599,999 0 N/A<br />
$600,000 - $999,999 0 N/A<br />
$1,000,000 or more 0 N/A<br />
$300,000 -<br />
$399,999<br />
$400,000 -<br />
$599,999<br />
$600,000 -<br />
$999,999<br />
$1,000,000 or<br />
more<br />
120<br />
100<br />
80<br />
60<br />
40<br />
20<br />
0<br />
Produced by Florida REALTORS® with data provided by Florida's multiple listing services. Statistics for each month compiled from MLS feeds on the 15th day of the following month.<br />
Data released on Tuesday, July 22, 2014. Next data release is Thursday, August 21, 2014.
<strong>Closed</strong> <strong>Sales</strong><br />
Median Sale Price<br />
Monthly Distressed Market - June 2014<br />
Manufactured Homes<br />
Bay County Association of REALTORS®<br />
This report describes member activity for the association and is not confined to any specific geographic area.<br />
June 2014 June 2013<br />
Percent Change<br />
Year-over-Year<br />
Traditional<br />
<strong>Closed</strong> <strong>Sales</strong><br />
Median Sale Price<br />
19 12 58.3%<br />
$65,000 $66,450 -2.2%<br />
Foreclosure/REO<br />
<strong>Closed</strong> <strong>Sales</strong><br />
Median Sale Price<br />
2 5 -60.0%<br />
$35,000 $27,000 29.6%<br />
Short Sale<br />
<strong>Closed</strong> <strong>Sales</strong><br />
Median Sale Price<br />
0 0 N/A<br />
(No <strong>Sales</strong>) (No <strong>Sales</strong>) N/A<br />
100%<br />
90%<br />
80%<br />
70%<br />
60%<br />
50%<br />
40%<br />
30%<br />
20%<br />
10%<br />
0%<br />
$100,000<br />
$90,000<br />
$80,000<br />
$70,000<br />
2010 2011 2012 2013<br />
Traditional Foreclosure/REO Short Sale<br />
J F M A M J J A S O N D J F M A M J J A S O N D J F M A M J J A S O N D J F M A M J J A S O N D J F M A M J<br />
$60,000<br />
$50,000<br />
$40,000<br />
$30,000<br />
$20,000<br />
$10,000<br />
$0<br />
J F M A M J J A S O N D J F M A M J J A S O N D J F M A M J J A S O N D J F M A M J J A S O N D J F M A M J<br />
2010 2011 2012 2013<br />
Produced by Florida REALTORS® with data provided by Florida's multiple listing services. Statistics for each month compiled from MLS feeds on the 15th day of the following month.<br />
Data released on Tuesday, July 22, 2014. Next data release is Thursday, August 21, 2014.