Server Overload Detection and Prediction Using Pattern Classification
Server Overload Detection and Prediction Using Pattern Classification
Server Overload Detection and Prediction Using Pattern Classification

You also want an ePaper? Increase the reach of your titles
YUMPU automatically turns print PDFs into web optimized ePapers that Google loves.
<strong>Server</strong> <strong>Overload</strong> <strong>Detection</strong> <strong>and</strong> <strong>Prediction</strong><br />
<strong>Using</strong> <strong>Pattern</strong> <strong>Classification</strong><br />
Cor-Paul Bezemer<br />
Delft University of Technology<br />
The Netherl<strong>and</strong>s<br />
c.bezemer@tudelft.nl<br />
Andy Zaidman<br />
Delft University of Technology<br />
The Netherl<strong>and</strong>s<br />
a.e.zaidman@tudelft.nl<br />
Categories <strong>and</strong> Subject Descriptors<br />
D.2.8 [Software Engineering]: Metrics—performance measures<br />
General Terms<br />
Performance<br />
1. INTRODUCTION<br />
One of the key factors in customer satisfaction is the application<br />
performance. In traditional settings, it is usually<br />
not very difficult to manually detect a performance problem,<br />
however, with the advent of ultra-large-scale (ULS)<br />
systems [4], manual performance monitoring <strong>and</strong> prediction<br />
becomes tedious <strong>and</strong> would thus ideally require automation.<br />
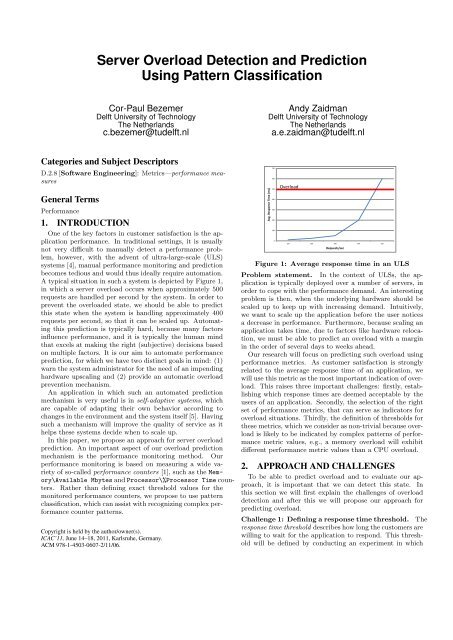
A typical situation in such a system is depicted by Figure 1,<br />
in which a server overload occurs when approximately 500<br />
requests are h<strong>and</strong>led per second by the system. In order to<br />
prevent the overloaded state, we should be able to predict<br />
this state when the system is h<strong>and</strong>ling approximately 400<br />
requests per second, so that it can be scaled up. Automating<br />
this prediction is typically hard, because many factors<br />
influence performance, <strong>and</strong> it is typically the human mind<br />
that excels at making the right (subjective) decisions based<br />
on multiple factors. It is our aim to automate performance<br />
prediction, for which we have two distinct goals in mind: (1)<br />
warn the system administrator for the need of an impending<br />
hardware upscaling <strong>and</strong> (2) provide an automatic overload<br />
prevention mechanism.<br />
An application in which such an automated prediction<br />
mechanism is very useful is in self-adaptive systems, which<br />
are capable of adapting their own behavior according to<br />
changes in the environment <strong>and</strong> the system itself [5]. Having<br />
such a mechanism will improve the quality of service as it<br />
helps these systems decide when to scale up.<br />
In this paper, we propose an approach for server overload<br />
prediction. An important aspect of our overload prediction<br />
mechanism is the performance monitoring method. Our<br />
performance monitoring is based on measuring a wide variety<br />
of so-called performance counters [1], such as the Memory\Available<br />
Mbytes <strong>and</strong> Processor\%Processor Time counters.<br />
Rather than defining exact threshold values for the<br />
monitored performance counters, we propose to use pattern<br />
classification, which can assist with recognizing complex performance<br />
counter patterns.<br />
Copyright is held by the author/owner(s).<br />
ICAC’11, June 14–18, 2011, Karlsruhe, Germany.<br />
ACM 978-1-4503-0607-2/11/06.<br />
Avg. Response Time (ms)<br />
700<br />
600<br />
500<br />
400<br />
300<br />
200<br />
100<br />
0<br />
<strong>Overload</strong><br />
100 200 300 400 500<br />
Requests/sec<br />
Figure 1: Average response time in an ULS<br />
Problem statement. In the context of ULSs, the application<br />
is typically deployed over a number of servers, in<br />
order to cope with the performance dem<strong>and</strong>. An interesting<br />
problem is then, when the underlying hardware should be<br />
scaled up to keep up with increasing dem<strong>and</strong>. Intuitively,<br />
we want to scale up the application before the user notices<br />
a decrease in performance. Furthermore, because scaling an<br />
application takes time, due to factors like hardware relocation,<br />
we must be able to predict an overload with a margin<br />
in the order of several days to weeks ahead.<br />
Our research will focus on predicting such overload using<br />
performance metrics. As customer satisfaction is strongly<br />
related to the average response time of an application, we<br />
will use this metric as the most important indication of overload.<br />
This raises three important challenges: firstly, establishing<br />
which response times are deemed acceptable by the<br />
users of an application. Secondly, the selection of the right<br />
set of performance metrics, that can serve as indicators for<br />
overload situations. Thirdly, the definition of thresholds for<br />
these metrics, which we consider as non-trivial because overload<br />
is likely to be indicated by complex patterns of performance<br />
metric values, e.g., a memory overload will exhibit<br />
different performance metric values than a CPU overload.<br />
2. APPROACH AND CHALLENGES<br />
To be able to predict overload <strong>and</strong> to evaluate our approach,<br />
it is important that we can detect this state. In<br />
this section we will first explain the challenges of overload<br />
detection <strong>and</strong> after this we will propose our approach for<br />
predicting overload.<br />
Challenge 1: Defining a response time threshold. The<br />
response time threshold describes how long the customers are<br />
willing to wait for the application to respond. This threshold<br />
will be defined by conducting an experiment in which
we will introduce delays in an application <strong>and</strong> ask users how<br />
they valued the perceived performance. It is necessary to<br />
have multiple thresholds as, e.g., users are willing to wait<br />
longer for the generation of a report than for a GUI action.<br />
Challenge 2: Selecting the metrics. To monitor the<br />
state of the server we will monitor a set of performance counters<br />
using PerfMon on our Windows-based servers. Initially<br />
we will monitor a large set of performance counters, but as<br />
we collect more data, we will use statistics to select the most<br />
significant counters to monitor.<br />
Challenge 3: Defining performance counter thresholds.<br />
Defining performance counter thresholds is more difficult<br />
because these are hardware-specific <strong>and</strong> can interrelate<br />
in a complex way. Therefore, we need a more intelligent way<br />
of describing performance counter thresholds rather than<br />
just using extreme values. In the next paragraph we describe<br />
how we will use pattern classification for this.<br />
<strong>Overload</strong> <strong>Detection</strong> <strong>Using</strong> <strong>Classification</strong>. <strong>Classification</strong><br />
is an example of pattern recognition, in which a set<br />
of input values are assigned to a given set of classes, for<br />
example, determine whether a server is or is not in overloaded<br />
state. To design a classifier, a training set containing<br />
patterns <strong>and</strong> their known output classes is required. After<br />
designing the classifier, it can be used to classify unknown<br />
patterns. Our training data will contain triples of the form<br />
(filename, performance counter pattern, response time). A<br />
performance counter pattern consists of the concatenated<br />
values of the monitored performance counters. Note that<br />
the response time is used to decide whether the pattern represents<br />
<strong>and</strong> overloaded state.<br />
Generating the Training Data. To correctly train<br />
our classifier, we need patterns for normal <strong>and</strong> overloaded<br />
states. An observation is that it may be difficult to get data<br />
for overloaded states as we are trying to avoid such states in<br />
production environments. Therefore, we have to reproduce<br />
the data in a test or isolated environment.<br />
To get this data for a server, which is not in production<br />
yet, we will use JMeter 1 to perform a stress test. During this<br />
stress test, the load will vary from normal to overload. By<br />
monitoring the response time during the stress test, patterns<br />
can be gathered for normal <strong>and</strong> overloaded states.<br />
Because performance counter thresholds are hardwarespecific,<br />
different servers may have different performance<br />
counter patterns in an overloaded state. To avoid running<br />
a stress test on a production server, we propose the use of<br />
an Application Experience Index, or AppExI. This catalog<br />
contains classifiers designed for servers in the past for a certain<br />
application. By selecting the classifier for the server in<br />
the AppExI which resembles the internal hardware of the<br />
production server the closest, we can get an initial version<br />
of the classifier of that production server.<br />
Designing the classifier. As we do not know the distribution<br />
of our training data yet, we will run various classifier<br />
generation algorithms (using the Matlab toolbox PRTools 2 )<br />
<strong>and</strong> select the best working classifier afterwards.<br />
Validation. To validate our classifiers, we will use crossvalidation.<br />
In addition, we will r<strong>and</strong>omly send a short questionnaire<br />
to application users to ask how they valued the<br />
1 http://jakarta.apache.org/jmeter/<br />
2 http://www.prtools.org/<br />
performance of the application during that session. If the<br />
performance was considered bad, we can use the logged performance<br />
patterns to redesign <strong>and</strong> optimize the classifier.<br />
2.1 <strong>Overload</strong> prediction<br />
Rather than detecting overload, we want to be able to<br />
predict it. To do this, we will automate an approach that<br />
is intuitively used by system administrators when monitoring<br />
a system. When administrators inspect the performance<br />
of a system, they search log files for upward (or<br />
downward) trends in performance counter values. A clear<br />
example of this is free harddrive space. The longer the<br />
Logical Disk\%Free Space performance counter exhibits a<br />
downward trend, the more likely it is that a performance<br />
problem is about to occur, in this case a full harddrive. As<br />
we have explained for monitoring, detecting simple trends is<br />
relatively easy but detecting complex patterns is difficult.<br />
Therefore, we will use pattern classification for overload<br />
prediction as well. Our goal is to train our classifier in such<br />
a way that it is able to detect series of patterns which lead<br />
to server overload, in other words, consecutive performance<br />
states which eventually evolve to a known threshold performance<br />
counter pattern.<br />
3. RELATED WORK<br />
Existing research on using pattern classification for overload<br />
detection <strong>and</strong> prediction is mostly focused on preventive<br />
mechanisms, such as admission control <strong>and</strong> load balancing<br />
[2, 3]. The main concern we have with using only a prevention<br />
mechanism, is that it does not advise us on when<br />
to scale a system up. In addition, admission control negatively<br />
affects the performance of some customers, which our<br />
approach tries to avoid.<br />
4. FUTURE WORK<br />
Future work will consist of the implementation <strong>and</strong> evaluation<br />
of our approach, including an evaluation on an industrial<br />
application.<br />
5. REFERENCES<br />
[1] R. Berrendorf <strong>and</strong> H. Ziegler. PCL – the performance<br />
counter library: A common interface to access<br />
hardware performance counters on microprocessors.<br />
Technical Report FZJ-ZAM-IB-9816, Central Institute<br />
for Applied Mathematics – Research Centre Juelich<br />
GmbH, 1998.<br />
[2] M. Dantas <strong>and</strong> A. Pinto. A load balancing approach<br />
based on a genetic machine learning algorithm. In Proc.<br />
Int. Symp. on High Performance Computing Systems<br />
<strong>and</strong> Applications (HPCS), pages 124 – 130. IEEE, 2005.<br />
[3] R. Fontaine, P. Laurencot, <strong>and</strong> A. Aussem. Mixed<br />
neural <strong>and</strong> feedback controller for apache web server.<br />
ICGST Int. Journal on Computer Network <strong>and</strong><br />
Internet Research, CNIR, 09(1):25–30, 2009.<br />
[4] L. Northrop, P. Feiler, R. P. Gabriel, J. Goodenough,<br />
R. Linger, T. Longstaff, R. Kazman, M. Klein,<br />
D. Schmidt, K. Sullivan, <strong>and</strong> K. Wallnau.<br />
Ultra-Large-Scale Systems - The Software Challenge of<br />
the Future. S.E. Institute, Carnegie Mellon, 2006.<br />
[5] M. Salehie <strong>and</strong> L. Tahvildari. Self-adaptive software:<br />
L<strong>and</strong>scape <strong>and</strong> research challenges. ACM Transactions<br />
on Autonomous <strong>and</strong> Adaptive Systems, 4(2):14:1–14:42,<br />
2009.