The impact of schools on young people's transition to university
The impact of schools on young people's transition to university
The impact of schools on young people's transition to university
You also want an ePaper? Increase the reach of your titles
YUMPU automatically turns print PDFs into web optimized ePapers that Google loves.
<str<strong>on</strong>g>The</str<strong>on</strong>g> analysis identifies a cluster <str<strong>on</strong>g>of</str<strong>on</strong>g> 36 high-performing <str<strong>on</strong>g>schools</str<strong>on</strong>g> and another cluster <str<strong>on</strong>g>of</str<strong>on</strong>g> 40 <str<strong>on</strong>g>schools</str<strong>on</strong>g> that<br />
perform poorly across the two outcomes. <str<strong>on</strong>g>The</str<strong>on</strong>g> high-achieving cluster is predominantly made up <str<strong>on</strong>g>of</str<strong>on</strong>g><br />
Catholic and independent <str<strong>on</strong>g>schools</str<strong>on</strong>g>, whereas the majority <str<strong>on</strong>g>of</str<strong>on</strong>g> low-achieving <str<strong>on</strong>g>schools</str<strong>on</strong>g> bel<strong>on</strong>g <strong>to</strong> the<br />
government sec<strong>to</strong>r. However, four government <str<strong>on</strong>g>schools</str<strong>on</strong>g> are in the high-achieving cluster and <strong>on</strong>e each<br />
from the Catholic and independent sec<strong>to</strong>rs are am<strong>on</strong>g the low-achievers.<br />
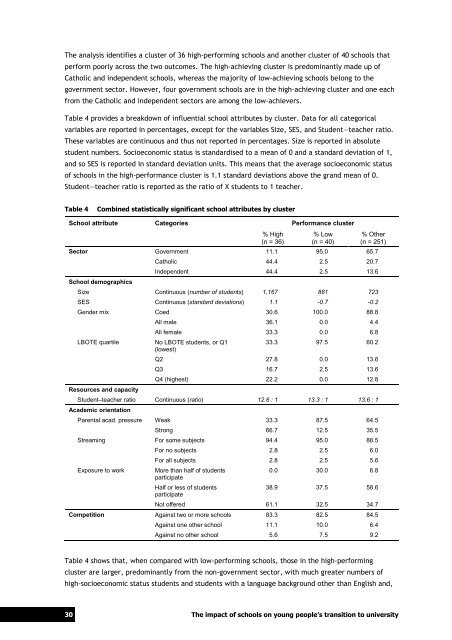
Table 4 provides a breakdown <str<strong>on</strong>g>of</str<strong>on</strong>g> influential school attributes by cluster. Data for all categorical<br />
variables are reported in percentages, except for the variables Size, SES, and Student—teacher ratio.<br />
<str<strong>on</strong>g>The</str<strong>on</strong>g>se variables are c<strong>on</strong>tinuous and thus not reported in percentages. Size is reported in absolute<br />
student numbers. Socioec<strong>on</strong>omic status is standardised <strong>to</strong> a mean <str<strong>on</strong>g>of</str<strong>on</strong>g> 0 and a standard deviati<strong>on</strong> <str<strong>on</strong>g>of</str<strong>on</strong>g> 1,<br />
and so SES is reported in standard deviati<strong>on</strong> units. This means that the average socioec<strong>on</strong>omic status<br />
<str<strong>on</strong>g>of</str<strong>on</strong>g> <str<strong>on</strong>g>schools</str<strong>on</strong>g> in the high-performance cluster is 1.1 standard deviati<strong>on</strong>s above the grand mean <str<strong>on</strong>g>of</str<strong>on</strong>g> 0.<br />
Student—teacher ratio is reported as the ratio <str<strong>on</strong>g>of</str<strong>on</strong>g> X students <strong>to</strong> 1 teacher.<br />
Table 4<br />
Combined statistically significant school attributes by cluster<br />
School attribute Categories Performance cluster<br />
% High<br />
(n = 36)<br />
% Low<br />
(n = 40)<br />
% Other<br />
(n = 251)<br />
Sec<strong>to</strong>r Government 11.1 95.0 65.7<br />
School demographics<br />
Catholic 44.4 2.5 20.7<br />
Independent 44.4 2.5 13.6<br />
Size C<strong>on</strong>tinuous (number <str<strong>on</strong>g>of</str<strong>on</strong>g> students) 1,167 881 723<br />
SES C<strong>on</strong>tinuous (standard deviati<strong>on</strong>s) 1.1 -0.7 -0.2<br />
Gender mix Coed 30.6 100.0 88.8<br />
LBOTE quartile<br />
Resources and capacity<br />
All male 36.1 0.0 4.4<br />
All female 33.3 0.0 6.8<br />
No LBOTE students, or Q1<br />
(lowest)<br />
33.3 97.5 60.2<br />
Q2 27.8 0.0 13.6<br />
Q3 16.7 2.5 13.6<br />
Q4 (highest) 22.2 0.0 12.8<br />
Student–teacher ratio C<strong>on</strong>tinuous (ratio) 12.6 : 1 13.3 : 1 13.6 : 1<br />
Academic orientati<strong>on</strong><br />
Parental acad. pressure Weak 33.3 87.5 64.5<br />
Str<strong>on</strong>g 66.7 12.5 35.5<br />
Streaming For some subjects 94.4 95.0 88.5<br />
Exposure <strong>to</strong> work<br />
For no subjects 2.8 2.5 6.0<br />
For all subjects 2.8 2.5 5.6<br />
More than half <str<strong>on</strong>g>of</str<strong>on</strong>g> students<br />
participate<br />
Half or less <str<strong>on</strong>g>of</str<strong>on</strong>g> students<br />
participate<br />
0.0 30.0 6.8<br />
38.9 37.5 58.6<br />
Not <str<strong>on</strong>g>of</str<strong>on</strong>g>fered 61.1 32.5 34.7<br />
Competiti<strong>on</strong> Against two or more <str<strong>on</strong>g>schools</str<strong>on</strong>g> 83.3 82.5 84.5<br />
Against <strong>on</strong>e other school 11.1 10.0 6.4<br />
Against no other school 5.6 7.5 9.2<br />
Table 4 shows that, when compared with low-performing <str<strong>on</strong>g>schools</str<strong>on</strong>g>, those in the high-performing<br />
cluster are larger, predominantly from the n<strong>on</strong>-government sec<strong>to</strong>r, with much greater numbers <str<strong>on</strong>g>of</str<strong>on</strong>g><br />
high-socioec<strong>on</strong>omic status students and students with a language background other than English and,<br />
30 <str<strong>on</strong>g>The</str<strong>on</strong>g> <str<strong>on</strong>g>impact</str<strong>on</strong>g> <str<strong>on</strong>g>of</str<strong>on</strong>g> <str<strong>on</strong>g>schools</str<strong>on</strong>g> <strong>on</strong> <strong>young</strong> people’s transiti<strong>on</strong> <strong>to</strong> <strong>university</strong>


