Introduction of the Chain Fisher Measure of Real GDP
Introduction of the Chain Fisher Measure of Real GDP
Introduction of the Chain Fisher Measure of Real GDP
You also want an ePaper? Increase the reach of your titles
YUMPU automatically turns print PDFs into web optimized ePapers that Google loves.
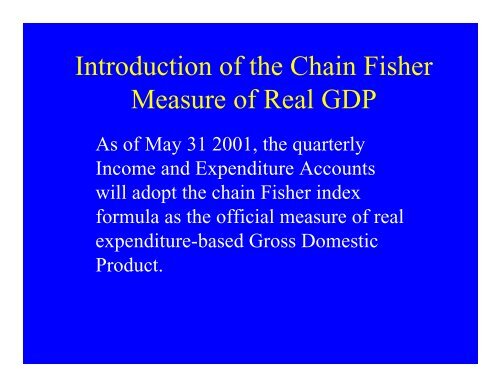
<strong>Introduction</strong> <strong>of</strong> <strong>the</strong> <strong>Chain</strong> <strong>Fisher</strong><br />
<strong>Measure</strong> <strong>of</strong> <strong>Real</strong> <strong>GDP</strong><br />
As <strong>of</strong> May 31 2001, <strong>the</strong> quarterly<br />
Income and Expenditure Accounts<br />
will adopt <strong>the</strong> chain <strong>Fisher</strong> index<br />
formula as <strong>the</strong> <strong>of</strong>ficial measure <strong>of</strong> real<br />
expenditure-based Gross Domestic<br />
Product.
Why Change?<br />
• The new calculation produces <strong>the</strong> most<br />
accurate measure <strong>of</strong> quarter to quarter<br />
growth in <strong>GDP</strong> and its components;<br />
• The change brings <strong>the</strong> Canadian measure in<br />
line with <strong>the</strong> US quarterly Income and<br />
Product Accounts which also use <strong>the</strong> chain<br />
<strong>Fisher</strong> formula to measure real <strong>GDP</strong>.
What is different?<br />
• The weights used to add up real <strong>GDP</strong> will<br />
be based on <strong>the</strong> <strong>Fisher</strong> formula instead <strong>of</strong><br />
<strong>the</strong> Laspeyres formula<br />
• <strong>Chain</strong>ing is done quarterly instead <strong>of</strong><br />
periodically
The Old <strong>Measure</strong><br />
• Laspeyres formula<br />
LV<br />
=<br />
∑<br />
∑<br />
p<br />
p<br />
0<br />
0<br />
q<br />
q<br />
t<br />
0<br />
• chained periodically
Strengths and Weaknesses <strong>of</strong> <strong>the</strong> Old <strong>Measure</strong><br />
• Strengths<br />
– easy to use statistically and analytically<br />
– additive in periods following <strong>the</strong> most recent<br />
base year<br />
• Weaknesses<br />
– biased because weights are from <strong>the</strong> past<br />
– tends to « drift » due to bias<br />
– non-additive prior to <strong>the</strong> base year
The New <strong>Measure</strong><br />
• The <strong>Fisher</strong> formula<br />
FV<br />
=<br />
∑<br />
∑<br />
p<br />
p<br />
t−1<br />
t−1<br />
q<br />
q<br />
t<br />
t−1<br />
×<br />
∑<br />
∑<br />
p q<br />
t<br />
t<br />
p q<br />
t<br />
t−1<br />
• chained each quarter
The <strong>Fisher</strong> Formula<br />
FV<br />
=<br />
∑<br />
p<br />
t−<br />
1<br />
q<br />
t<br />
×<br />
∑<br />
p<br />
t<br />
q<br />
t<br />
∑<br />
p<br />
t−<br />
1<br />
q<br />
t−<br />
1<br />
∑<br />
p<br />
t<br />
q<br />
t−<br />
1
Level <strong>of</strong> Detail<br />
• 379 components <strong>of</strong> seasonally adjusted data<br />
– 130 Personal Expenditure<br />
– 25 Government Expenditure<br />
– 30 Capital Formation<br />
– 56 Inventories<br />
– 68 Imports<br />
– 69 Exports
Strengths and Weaknesses <strong>of</strong> <strong>the</strong> New <strong>Measure</strong><br />
• Strengths<br />
– substitution bias is minimized<br />
– « drift » is minimized<br />
• Weaknesses<br />
– computationally difficult<br />
– not additive for any time period due to chaining
What is <strong>the</strong> Economic<br />
Significance <strong>of</strong> <strong>the</strong> Change?<br />
• The Laspeyres measure overstates<br />
economic growth when:<br />
– some prices are declining monotonically<br />
relative to o<strong>the</strong>r prices in <strong>the</strong> economy (ICT)<br />
– <strong>the</strong>re is an abrupt shift in relative prices (Crude<br />
petroleum)
Impact on <strong>GDP</strong> & Selected Components
Impact on <strong>GDP</strong> & Selected Components
Investment Growth Comparison<br />
8<br />
6<br />
4<br />
Canada vs US<br />
%<br />
2<br />
0<br />
-2<br />
-4<br />
-6<br />
92q2<br />
92q4<br />
93q2<br />
93q4<br />
94q2<br />
94q4<br />
95q2<br />
95q4<br />
96q2<br />
96q4<br />
97q2<br />
97q4<br />
98q2<br />
98q4<br />
99q2<br />
99q4<br />
Gross Private Domestic Invest., US<br />
Gross Private Domestic Invest., Canada, Laspeyres
Investment Growth Comparison - <strong>Fisher</strong><br />
Canada vs US<br />
%<br />
8<br />
6<br />
4<br />
2<br />
0<br />
-2<br />
-4<br />
-6<br />
92q2<br />
92q4<br />
93q2<br />
93q4<br />
94q2<br />
94q4<br />
95q2<br />
95q4<br />
96q2<br />
96q4<br />
97q2<br />
97q4<br />
98q2<br />
98q4<br />
99q2<br />
99q4<br />
Gross Private Domestic Invest., US<br />
Gross Private Domestic Invest., Canada, <strong>Fisher</strong>
Impact on Overall <strong>GDP</strong> Growth<br />
2<br />
1.5<br />
Laspeyres (base year 1992) vs <strong>Chain</strong> <strong>Fisher</strong><br />
%change<br />
1<br />
0.5<br />
0<br />
-0.5<br />
92q2<br />
92q4<br />
93q2<br />
93q4<br />
94q2<br />
94q4<br />
95q2<br />
95q4<br />
96q2<br />
96q4<br />
97q2<br />
97q4<br />
98q2<br />
98q4<br />
99q2<br />
99q4<br />
00q2<br />
Laspeyres<br />
<strong>Chain</strong> <strong>Fisher</strong>
Cumulative Effect on <strong>GDP</strong><br />
% drift <strong>of</strong> <strong>GDP</strong><br />
ie. cumulative difference between Laspeyres growth and chain <strong>Fisher</strong> growth<br />
1.4<br />
1.2<br />
1<br />
0.8<br />
0.6<br />
%<br />
0.4<br />
0.2<br />
0<br />
-0.2<br />
-0.4<br />
92q2<br />
92q4<br />
93q2<br />
93q4<br />
94q2<br />
94q4<br />
95q2<br />
95q4<br />
96q2<br />
96q4<br />
97q2<br />
97q4<br />
98q2<br />
98q4<br />
99q2<br />
99q4<br />
00q2
Decomposition into Effect <strong>of</strong> Formula Change and<br />
Frequency <strong>of</strong> <strong>Chain</strong>ing<br />
"drift" components<br />
1.2<br />
1<br />
0.8<br />
0.6<br />
%<br />
0.4<br />
0.2<br />
0<br />
-0.2<br />
-0.4<br />
92q2<br />
92q4<br />
93q2<br />
93q4<br />
94q2<br />
94q4<br />
95q2<br />
95q4<br />
96q2<br />
96q4<br />
97q2<br />
97q4<br />
98q2<br />
98q4<br />
99q2<br />
99q4<br />
00q2<br />
Laspeyres (base year 1992) minus quarterly chain Laspeyres<br />
quarterly chain Laspeyres minus quarterly chain <strong>Fisher</strong>
Supplementary Information<br />
• To facilitate analysis, STC will publish<br />
« contribution to change » tables for each<br />
set <strong>of</strong> chained estimates published (personal<br />
expenditure, capital formation, international<br />
trade, investment in inventories)<br />
• 1997 constant price data will be published<br />
as overlap for 2 years
Contribution to Change<br />
∑<br />
−<br />
−<br />
−<br />
−<br />
×<br />
+<br />
−<br />
×<br />
+<br />
×<br />
=<br />
∆<br />
j<br />
j<br />
t<br />
j<br />
t<br />
t<br />
j<br />
t<br />
i<br />
t<br />
i<br />
t<br />
i<br />
t<br />
t<br />
i<br />
t<br />
t<br />
i<br />
q<br />
p<br />
FP<br />
p<br />
q<br />
q<br />
p<br />
FP<br />
p<br />
C<br />
1<br />
1<br />
1<br />
1<br />
,<br />
)<br />
)<br />
/<br />
((<br />
)<br />
(<br />
)<br />
)<br />
/<br />
((<br />
100<br />
%
Conclusions<br />
• This change is important to make Canada ’s<br />
<strong>of</strong>ficial estimate <strong>of</strong> economic growth more<br />
accurate and comparable to that <strong>of</strong> <strong>the</strong> US<br />
• Statistics Canada will do its best to help<br />
users in <strong>the</strong> transition to <strong>the</strong> <strong>Fisher</strong> measure


