Weymouth and Portland Visitor Survey - Visit Dorset
Weymouth and Portland Visitor Survey - Visit Dorset
Weymouth and Portland Visitor Survey - Visit Dorset

Create successful ePaper yourself
Turn your PDF publications into a flip-book with our unique Google optimized e-Paper software.
2012<br />
<strong>Weymouth</strong> <strong>and</strong> Portl<strong>and</strong> <strong><strong>Visit</strong>or</strong><br />
<strong>Survey</strong><br />
27 th July ‐ 11 th August 2012<br />
Image courtesy of dorsetforyou.com<br />
Prepared by the Market Research Group at Bournemouth University<br />
1
Contents<br />
Introduction 3<br />
Section 1: Decision to visit the area 5<br />
Section 2: Perceptions of visit <strong>and</strong> area 14<br />
Section 3: Type of visitor 26<br />
Section 4: Staying visitors 28<br />
Section 5: <strong><strong>Visit</strong>or</strong> economic spend 31<br />
Section 6: <strong><strong>Visit</strong>or</strong> profile 33<br />
Section 7: Summary 40<br />
Section 8: Conclusion 43<br />
Section 9: Recommendations 44<br />
Appendix 1: Questionnaire <strong>and</strong> summary results<br />
Appendix 2: Economic spend by visitor group<br />
Appendix 3: Profile of Olympic first time visitor<br />
2
Introduction<br />
The Economy group of <strong>Weymouth</strong> <strong>and</strong> Portl<strong>and</strong> partnership commissioned the Market<br />
Research Group at Bournemouth University to undertake a survey of visitors to the Borough<br />
during the Olympic Sailing events. The purpose of the study was to see the profile of visitors<br />
to the area, their perception of the area, <strong>and</strong> how much they were spending in the area<br />
during their visit.<br />
The Market Research Group<br />
The Economy group commissioned the Market Research Group (MRG) at Bournemouth<br />
University to undertake this research. MRG has been working with Local Authorities <strong>and</strong><br />
tourist providers in <strong>Dorset</strong> for over ten years <strong>and</strong> aims to be a key independent resource for<br />
the provision <strong>and</strong> interpretation of local <strong>and</strong> national market intelligence, <strong>and</strong> social trends.<br />
MRG offers expertise, experience <strong>and</strong> advice tailored to suit the information needs of<br />
individual clients. Further bespoke data analysis <strong>and</strong> the production of longitudinal data is<br />
available on request.<br />
Methodology<br />
This report analyses <strong>and</strong> explores the results from the <strong>Weymouth</strong> <strong>and</strong> Portl<strong>and</strong> visitors’<br />
survey 2012. Fieldwork commenced on Friday 27 July through to Saturday 11 August 2012<br />
<strong>and</strong> was conducted face to face with r<strong>and</strong>omly selected visitors on location (in primary<br />
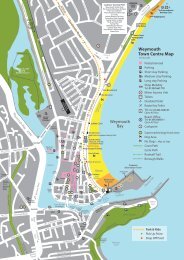
locations in <strong>Weymouth</strong> town centre) by qualified researchers. Completed questionnaires<br />
were delivered to the Market Research Group’s data entry suite. The closed responses were<br />
scanned <strong>and</strong> the open ended responses were manually data entered <strong>and</strong> coded. The data<br />
file was then cleaned <strong>and</strong> quality checked using ISO guidelines, <strong>and</strong> is stored in adherence<br />
to the Data Protection Act 1998.<br />
Previous research<br />
The Market Research Group has previously undertaken visitor surveys in <strong>Weymouth</strong> <strong>and</strong><br />
Portl<strong>and</strong>, the last one of which was undertaken in 2009. Wherever possible comparisons will<br />
be made.<br />
Sample Size <strong>and</strong> Statistical Validity<br />
A sample size of 691 was achieved. A sample of 691 implies that the results are<br />
representative of the visitor population to within ± 3.73% at the 95% confidence level (i.e.<br />
there is only 1 chance in 20 of the margin of error contained within the results to be greater<br />
than 3.73%). This is a strong sample size to provide <strong>Weymouth</strong> <strong>and</strong> Portl<strong>and</strong> with a robust<br />
evidence base for most analysis. Further, more detailed analysis by variables (or subgroups)<br />
will require those smaller populations to be representative of the larger visitor population<br />
from which the sample is taken. This is unlikely in these circumstances <strong>and</strong> therefore caution<br />
needs to be taken when analysing by variables that have a smaller population associated<br />
with them.<br />
3
<strong>Weymouth</strong> <strong>and</strong> Portl<strong>and</strong> events<br />
Qualified interviewers collected responses around the following events which were taking<br />
place on or near <strong>Weymouth</strong> seafront. Interviews were conducted between 12pm <strong>and</strong> 7pm<br />
through the fieldwork period.<br />
The <strong>Weymouth</strong> Bayside Festival<br />
The <strong>Weymouth</strong> Bayside Festival was a ticketed festival run by a private company. The<br />
company running the festival went into administration during the Olympic sailing events on<br />
Friday 3 August which meant the festival did not run for the entirety of the Olympic period.<br />
<strong>Weymouth</strong> <strong>and</strong> Portl<strong>and</strong> Live Site<br />
The Live Site was located on <strong>Weymouth</strong> Beach <strong>and</strong> visitors could watch Olympic events for<br />
free on two giant 60 ft screens.<br />
The Sports Arena<br />
The Sports Arena was located on <strong>Weymouth</strong> beach <strong>and</strong> offered a range of free sports<br />
including sailing, kayaking, wheelchair basketball <strong>and</strong> volleyball.<br />
The <strong>Weymouth</strong> Sea Life Tower<br />
The <strong>Weymouth</strong> Sea Life Tower is an observation deck, 174 foot high, which opened in time<br />
for the Olympic sailing events.<br />
Technical notes<br />
Sample size <strong>and</strong> sub set size – The total base sample for each question can be found to<br />
the bottom left of the graph (labelled BASE:). When questions have been analysed by<br />
demographic information or key driver questions the sub set sample size will be found in<br />
brackets next to individual labels within the graph/table.<br />
Average calculations - Some questions in this report have been analysed by mean, mode<br />
or median values. Here is a brief explanation of these terms<br />
Mean – provides the average score. The mean is the sum of all the numbers divided by the<br />
total number in the sample.<br />
Median – The median is the middle point at which there are equal number of data points<br />
whose value lies above <strong>and</strong> below the median value.<br />
Mode- Is the value/number which appears most often in a set of numbers.<br />
4
Section 1: Decision to visit the area<br />
Just over one fifth of respondents (21%) said that the Olympic sailing events were their sole<br />
reason for visiting <strong>Weymouth</strong>. Just under two fifths stated that the sailing events were their<br />
main reason for visiting. 40% of respondents would have visited <strong>Weymouth</strong> on that day<br />
regardless of the sailing events.<br />
Figure 1: Role of Olympic sailing events in decision to visit (%)<br />
I had never heard of the sailing events before my visit<br />
1%<br />
I knew of the sailing events but it played no role in my<br />
decision to visit<br />
39%<br />
It was my main reason for visiting<br />
38%<br />
It was my sole reason for visiting<br />
21%<br />
BASE: 673<br />
0% 5% 10% 15% 20% 25% 30% 35% 40% 45%<br />
5
To explore this further it is important to look at the break down of visitors who stated that<br />
their ‘sole’ purpose for visiting <strong>Weymouth</strong> <strong>and</strong> Portl<strong>and</strong> was the Olympic sailing events. Age<br />
<strong>and</strong> Gender did not have a significant effect on participant’s stating that their purpose for<br />
visiting <strong>Weymouth</strong> <strong>and</strong> Portl<strong>and</strong> was ‘solely’ the Olympics. However, male respondents were<br />
more likely to say the Olympic sailing events were their ‘sole reason for visiting’ as were<br />
respondents aged 55 – 64 <strong>and</strong> 18 – 34. Additionally, there was only 1% difference between<br />
the responses of those visiting with or without children in terms of the sailing events being<br />
the ‘sole’ reason for visiting the area.<br />
Figure 2: Role of Olympic sailing events in decision to visit<br />
‘My sole reason for visiting’ by age <strong>and</strong> gender <strong>and</strong> visiting with children (%)<br />
55 ‐ 64 (107)<br />
18 ‐ 24 (32)<br />
Male (247)<br />
25 ‐ 34 (75)<br />
Children (272)<br />
No children (332)<br />
All (673)<br />
45 ‐ 54 (124)<br />
65 ‐ 74 (97)<br />
Female (394)<br />
35 ‐ 44 (149)<br />
75 + (26)<br />
14%<br />
20%<br />
20%<br />
19%<br />
22%<br />
21%<br />
21%<br />
21%<br />
23%<br />
23%<br />
25%<br />
28%<br />
0% 5% 10% 15% 20% 25% 30%<br />
BASE: VARIED AS LABELLED<br />
6
<strong><strong>Visit</strong>or</strong>s on a day trip were significantly more likely to state that the Olympic sailing events<br />
were their sole reason for visiting the area (27%) compared to staying visitors (14%). Half of<br />
the staying visitors surveyed (50%) would have visited the area regardless of the Olympic<br />
sailing events taking place. To ascertain whether their was a significant effect on staying<br />
visitor numbers in <strong>Weymouth</strong> <strong>and</strong> Portl<strong>and</strong> further research with accommodation providers<br />
about visitor numbers may provide more clarity.<br />
Figure 3: Role of Olympic sailing events in decision to visit<br />
by day / stay visitor (%)<br />
I had never heard of the sailing events<br />
before my visit<br />
3%<br />
0%<br />
I knew of the sailing events but it<br />
played no role in my decision to visit<br />
It was my main reason for visiting<br />
47%<br />
32%<br />
35%<br />
41%<br />
Stay (299)<br />
Day (359)<br />
It was my sole reason for visiting<br />
14%<br />
27%<br />
0% 10% 20% 30% 40% 50%<br />
BASE: VARIED AS LABELLED<br />
7
One of the main theories which needs to be explored is whether the sailing events in<br />
<strong>Weymouth</strong> <strong>and</strong> Portl<strong>and</strong> attracted a new type of visitor. To start to unravel this it is first<br />
important to analyse visitors’ frequency of visit to the area.<br />
Frequency of visit<br />
Respondents were asked how often they visited the <strong>Weymouth</strong> <strong>and</strong> Portl<strong>and</strong> area. 17% of<br />
respondents stated that it was their first visit to the area. Just over one third (35%) said that<br />
they visited the area more than once a year, 18% said they visited about once a year <strong>and</strong><br />
18% that they visited every few years. Just over one tenth (12%) of the sample stated that<br />
they lived in the area. Yearly visitations may suggest seasonal variation for some tourists -<br />
<strong>and</strong> therefore those core 12% who live locally may have different intentions <strong>and</strong> motivators<br />
to visit out of season.<br />
Figure 4: Frequency of visit to <strong>Weymouth</strong> <strong>and</strong> Portl<strong>and</strong> (%)<br />
40%<br />
35%<br />
35%<br />
30%<br />
25%<br />
20%<br />
17%<br />
18% 18%<br />
15%<br />
12%<br />
10%<br />
5%<br />
0%<br />
This is my first<br />
visit<br />
More than<br />
once a year<br />
About once a<br />
year<br />
Every few<br />
years<br />
I live here<br />
BASE: 666<br />
When frequency of visit is analysed by purpose of visit no significant differences are<br />
apparent. Nearly two thirds (64%) of first time visitors to the area stated that the sailing<br />
events were their ‘sole’ or ‘main’ reason for visiting <strong>Weymouth</strong> <strong>and</strong> Portl<strong>and</strong>. Just over half<br />
(55%) of those visitors who visit the area more than once a year stated the sailing events<br />
were their ‘sole’ or ‘main’ reason for visiting. Two thirds of visitors (66%) who visit either<br />
‘once a year’ or ‘every few years’ stated that the sailing events were their ‘sole’ or ‘main’<br />
purpose for visiting the area.<br />
8
Figure 5: Frequency of visit by purpose of visit (%)<br />
This is my<br />
first visit<br />
(113)<br />
More than<br />
once a year<br />
(228)<br />
About once a<br />
year (119)<br />
Every few<br />
years (117)<br />
I live here<br />
(77)<br />
It was my sole reason for visiting 27% 16% 24% 26% 16%<br />
It was my main reason for visiting 37% 39% 41% 41% 36%<br />
I knew of the sailing events but it<br />
played no role in my decision to visit<br />
I had never heard of the sailing<br />
events before my visit<br />
60%<br />
50%<br />
40%<br />
30%<br />
20%<br />
10%<br />
0%<br />
31% 45% 34% 32% 48%<br />
5% 0% 1% 2% 0%<br />
BASE: VARIED AS LABELLED<br />
Olympic ‘sole’/ ‘main’ reason for visiting <strong>and</strong> first time visitor’s profile<br />
From the overall sample, 10% of visitors stated that it was their first visit to the area <strong>and</strong> that<br />
the Olympic Sailing events were their ‘sole’ or ‘main’ reason for visiting. The profile of these<br />
visitors can be explored further to see whether they are likely to return to the area, whether<br />
they will be advocates of the area <strong>and</strong> the type of people that they are.<br />
82% of this type of visitor state that they are either ‘very likely’ or ‘quite likely’ to return to the<br />
area again. 42% had a positive view of the area prior to visiting. 76% of these visitors said<br />
that their opinion of <strong>Weymouth</strong> <strong>and</strong> Portl<strong>and</strong> was now ‘higher’ or ‘much higher’ having visited<br />
during the Olympic sailing events.<br />
When prior perceptions of the area <strong>and</strong> perceptions of the area having visited during the<br />
Olympic sailing events is analysed the results are encouraging. Not one visitor from this<br />
profile group stated that their opinion of the area was lower than before. The key opinions to<br />
look at are those visitors who had a neutral view of the area before to see how their<br />
perceptions have changed. 92% of visitors from this profile who had a previously neutral<br />
perception of the area now state that their opinion of the area is ‘much higher’ or ‘higher’<br />
than before.<br />
9
Table 1: Prior <strong>and</strong> post visit perceptions<br />
‘first time visitors to <strong>Weymouth</strong> whose ‘main’/’sole’ reason for visiting was the<br />
Olympic Sailing events.<br />
I now have<br />
a much<br />
higher<br />
opinion of<br />
the area<br />
I now have<br />
a higher<br />
opinion of<br />
the area<br />
My opinion<br />
of the area<br />
has<br />
remained<br />
the same<br />
My opinion<br />
of the area<br />
is lower<br />
than before<br />
the sailing<br />
events<br />
My opinion<br />
of the area<br />
is much<br />
lower than<br />
before the<br />
sailing<br />
events<br />
Total<br />
I had a very positive view of the area 50% 10% 40% 0% 0% 100%<br />
I had a positive view of the area 10% 40% 50% 0% 0% 100%<br />
I had a neutral view of the area 46% 46% 7% 0% 0% 100%<br />
I had a negative view of the area 0% 100% 0% 0% 0% 100%<br />
I had a very negative view of the area 0% 100% 0% 0% 0% 100%<br />
Don't know / no opinion 45% 45% 9% 0% 0% 100%<br />
Total 35% 41% 24% 0% 0% 100%<br />
BASE: 71<br />
For more information about this profile of visitor please see appendix 3. Only future research<br />
<strong>and</strong> visitor surveys which monitor visitor profile, purpose of visit <strong>and</strong> motivation to visit<br />
beyond 2012 will fully establish whether <strong>Weymouth</strong> <strong>and</strong> Portl<strong>and</strong> has attracted new visitors<br />
to the area.<br />
10
Specific events<br />
Respondents were asked which events <strong>and</strong>/or areas they had accessed during their visit.<br />
59% had visited the live site on the seafront; one third had visited the Bayside Festival <strong>and</strong><br />
29% had visited the sports arena. One quarter stated that they visited an ‘other’ area. The<br />
‘other’ areas mentioned by respondents were the town centre <strong>and</strong> shops, the<br />
harbour/quayside <strong>and</strong> Hope Square, beach, pier <strong>and</strong> Nothe Gardens in the non-ticketed<br />
area. It is worth referring to the introduction which has a description of each of the<br />
events/areas.<br />
Figure 6: which events/areas have you visited during your visit? (%)<br />
70%<br />
60%<br />
59%<br />
50%<br />
40%<br />
30%<br />
20%<br />
34%<br />
29%<br />
20%<br />
26%<br />
10%<br />
0%<br />
The<br />
<strong>Weymouth</strong><br />
Bayside<br />
Festival<br />
<strong>Weymouth</strong><br />
<strong>and</strong> Portl<strong>and</strong><br />
Live Site<br />
The Sports<br />
Arena<br />
The<br />
<strong>Weymouth</strong> Sea<br />
Life Tower<br />
Other<br />
BASE: 631<br />
11
Respondents aged 18 – 54 were more likely to visit the ‘Live Site’ compared to those aged<br />
55 <strong>and</strong> over. Respondents aged 25 – 54 were more likely to visit the ‘Sports Arena’. This<br />
group was also most likely to be visiting with children. Respondents aged 65 <strong>and</strong> over were<br />
more likely to visit the ‘Sea Life Tower’ compared to other age groups.<br />
Figure 7: which events/areas have you visited during your visit?<br />
by age group (%)<br />
80%<br />
70%<br />
60%<br />
50%<br />
40%<br />
30%<br />
20%<br />
10%<br />
0%<br />
The<br />
<strong>Weymouth</strong><br />
Bayside<br />
Festival<br />
<strong>Weymouth</strong><br />
<strong>and</strong><br />
Portl<strong>and</strong><br />
Live Site<br />
The Sports<br />
Arena<br />
The<br />
<strong>Weymouth</strong><br />
Sea Life<br />
Tower<br />
Other<br />
18 ‐ 24 (29) 28% 66% 3% 17% 38%<br />
25 ‐ 34 (68) 41% 65% 40% 12% 19%<br />
35 ‐ 44 (141) 30% 67% 37% 17% 19%<br />
45 ‐ 54 (119) 43% 68% 33% 21% 22%<br />
55 ‐ 64 (99) 38% 54% 16% 20% 28%<br />
65 ‐ 74 (96) 29% 51% 24% 30% 35%<br />
75 + (23) 43% 22% 26% 26% 52%<br />
18 ‐ 24 (29)<br />
25 ‐ 34 (68)<br />
35 ‐ 44 (141)<br />
45 ‐ 54 (119)<br />
55 ‐ 64 (99)<br />
65 ‐ 74 (96)<br />
75 + (23)<br />
BASE: VARIED AS LABELLED<br />
12
Respondents who were visiting the area with children were significantly more likely to visit<br />
the ‘Sports Arena’. Respondents without children in their party were significantly more likely<br />
to visit the Bayside festival.<br />
Figure 8: which events/areas have you visited during your visit?<br />
by visiting with children (%)<br />
70%<br />
60%<br />
63%<br />
57%<br />
50%<br />
40%<br />
30%<br />
20%<br />
10%<br />
40%<br />
30%<br />
44%<br />
16%<br />
19%<br />
22%<br />
Children (257)<br />
No children (314)<br />
0%<br />
The <strong>Weymouth</strong><br />
<strong>Weymouth</strong> <strong>and</strong> Portl<strong>and</strong><br />
Bayside Live Site<br />
Festival<br />
The Sports<br />
Arena<br />
The<br />
<strong>Weymouth</strong><br />
Sea Life<br />
Tower<br />
BASE: VARIED AS LABELLED<br />
13
Section 2: Perceptions of visit <strong>and</strong> area<br />
The vast majority of respondents (97%) rated their time spent in <strong>Weymouth</strong> <strong>and</strong> Portl<strong>and</strong> as<br />
‘very good’ or ‘good’.<br />
Figure 9: How would you rate your time spent in <strong>Weymouth</strong> <strong>and</strong> Portl<strong>and</strong> today? (%)<br />
Very good<br />
63%<br />
Good<br />
34%<br />
Neither good nor poor<br />
Poor<br />
Very poor<br />
Don't know / no opinion<br />
3%<br />
0%<br />
0%<br />
0%<br />
0% 10% 20% 30% 40% 50% 60% 70%<br />
BASE: 680<br />
Female respondents, respondents aged 55 <strong>and</strong> over <strong>and</strong> respondents visiting the area<br />
without children were more likely to rate their day as ‘very good’ compared to other visitors.<br />
The only significant difference observed when this question is analysed by demographic<br />
information is that significantly more females than males rated the time spent in <strong>Weymouth</strong> &<br />
Portl<strong>and</strong> as ‘very good’.<br />
Figure 10: How would you rate your time spent in <strong>Weymouth</strong> <strong>and</strong> Portl<strong>and</strong><br />
today? ‘Very good’ by age/gender/visiting with children<br />
75 + (25)<br />
Female (397)<br />
65 ‐ 74 (101)<br />
55 ‐ 64 (106)<br />
No children (334)<br />
All (680)<br />
45 ‐ 54 (124)<br />
25 ‐ 34 (75)<br />
Children (276)<br />
18 ‐ 24 (31)<br />
35 ‐ 44 (152)<br />
Male (251)<br />
67%<br />
66%<br />
64%<br />
63%<br />
63%<br />
61%<br />
60%<br />
60%<br />
58%<br />
58%<br />
56%<br />
76%<br />
0% 10% 20% 30% 40% 50% 60% 70% 80%<br />
BASE: VARIED AS LABELLED<br />
14
No significant differences were found when ‘time spent in <strong>Weymouth</strong> <strong>and</strong> Portl<strong>and</strong>’ is<br />
analysed by the event <strong>and</strong> areas respondents had visited. 69% of respondents who visited<br />
the <strong>Weymouth</strong> Sea Life Tower rated the time they spent in <strong>Weymouth</strong> <strong>and</strong> Portl<strong>and</strong> as ‘very<br />
good’, 63% of respondents who had visited the <strong>Weymouth</strong> <strong>and</strong> Portl<strong>and</strong> ‘Live Site’ rated<br />
their day as ‘very good’. This suggests that what people actually visited did not affect their<br />
perception of the visit <strong>and</strong> the area. This is positive for overall enjoyment of the area <strong>and</strong><br />
suggests that ratings of time spent in <strong>Weymouth</strong> & Portl<strong>and</strong> were not affected by the specific<br />
area visited, <strong>and</strong> that all areas contributed to an enjoyable experience.<br />
Figure 11: How would you rate your time spent in <strong>Weymouth</strong> <strong>and</strong> Portl<strong>and</strong> today?<br />
‘Very good’ by event/areas visited<br />
70%<br />
69%<br />
69%<br />
69%<br />
68%<br />
67%<br />
66%<br />
65%<br />
65%<br />
66%<br />
64%<br />
63%<br />
63%<br />
62%<br />
61%<br />
60%<br />
59%<br />
The <strong>Weymouth</strong><br />
Bayside Festival<br />
<strong>Weymouth</strong> <strong>and</strong><br />
Portl<strong>and</strong> Live Site<br />
The Sports Arena<br />
The <strong>Weymouth</strong><br />
Sea Life Tower<br />
Other<br />
BASE: 631<br />
15
Respondents were asked about their perceptions of <strong>Weymouth</strong> <strong>and</strong> Portl<strong>and</strong> before visiting<br />
the area during the Olympic sailing events. More than three quarters of respondents (78%)<br />
stated that they had a positive view of <strong>Weymouth</strong> <strong>and</strong> Portl<strong>and</strong> prior to attending the sailing<br />
events. Again this is positive for the area as it suggests that <strong>Weymouth</strong> <strong>and</strong> Portl<strong>and</strong> is<br />
attractive to repeat visitors, somewhat independently of the Olympic Games (even though<br />
participants enjoyed the events).<br />
Figure 12: Perception of area prior to visiting during the Olympics (%)<br />
I had a very positive view of the area<br />
43%<br />
I had a positive view of the area<br />
35%<br />
I had a neutral view of the area<br />
15%<br />
I had a negative view of the area<br />
3%<br />
I had a very negative view of the area<br />
0%<br />
Don't know / no opinion<br />
3%<br />
0% 5% 10% 15% 20% 25% 30% 35% 40% 45%<br />
BASE: 680<br />
When prior views about the area are analysed by demographics the only significant<br />
difference highlighted is between visitors aged 75 <strong>and</strong> over <strong>and</strong> visitors aged 35 - 44.<br />
<strong><strong>Visit</strong>or</strong>s aged 75 <strong>and</strong> over are significantly more likely to have had a ‘very positive’ view of<br />
the area prior to visiting during the sailing events compared to those visitors aged 35 - 44.<br />
However, it is important to note that only 4% of visitors were over 75yrs old <strong>and</strong> sample size<br />
is small for this.<br />
16
Figure 13: Perceptions of <strong>Weymouth</strong> <strong>and</strong> Portl<strong>and</strong> prior to visiting the Olympics<br />
I had a ‘very positive’ view by age/gender <strong>and</strong> visiting with children (%)<br />
75 + (26)<br />
55 ‐ 64 (106)<br />
65 ‐ 74 (102)<br />
45 ‐ 54 (125)<br />
No children (336)<br />
Male (250)<br />
18 ‐ 24 (32)<br />
All (680)<br />
Female (399)<br />
Children (276)<br />
25 ‐ 34 (75)<br />
35 ‐ 44 (150)<br />
32%<br />
49%<br />
46%<br />
45%<br />
45%<br />
44%<br />
44%<br />
43%<br />
42%<br />
40%<br />
40%<br />
65%<br />
0% 10% 20% 30% 40% 50% 60% 70%<br />
BASE: VARIED AS LABELLED<br />
17
Staying visitors had a significantly more positive view of <strong>Weymouth</strong> <strong>and</strong> Portl<strong>and</strong> prior to<br />
attending the sailing events. Staying visitors were more likely to state ‘I had a very positive<br />
view of the area’ compared to those who were on a day trip from home. <strong><strong>Visit</strong>or</strong>s who were on<br />
a day trip were more likely to say they had ‘a positive view of the area’ prior to attending the<br />
sailing events.<br />
Figure 14: Perception of area prior to visiting the Olympics<br />
By day / stay visitors (%)<br />
60%<br />
50%<br />
40%<br />
30%<br />
20%<br />
10%<br />
0%<br />
37%<br />
50%<br />
I had a very<br />
positive view<br />
of the area<br />
40%<br />
30%<br />
I had a<br />
positive view<br />
of the area<br />
15%<br />
15%<br />
I had a<br />
neutral view<br />
of the area<br />
5%<br />
1% 1% 2%<br />
5%<br />
0%<br />
I had a<br />
negative view<br />
of the area<br />
I had a very<br />
negative view<br />
of the area<br />
Don't know /<br />
no opinion<br />
Day (362)<br />
Stay(301)<br />
BASE: VARIED AS LABELLED<br />
Just under half of respondents’ (48%) opinions of <strong>Weymouth</strong> <strong>and</strong> Portl<strong>and</strong> improved after<br />
visiting the area for the Olympic sailing events, just over half (51%) stayed the same. Again,<br />
this is a good indication of the value of <strong>Weymouth</strong> <strong>and</strong> Portl<strong>and</strong> as a tourist destination<br />
before the Olympic Games, even though the games have had a positive impact on public<br />
perceptions of the area as a tourist destination.<br />
Figure 15: Perceptions of <strong>Weymouth</strong> <strong>and</strong> Portl<strong>and</strong> after visiting the Olympic sailing<br />
events (%)<br />
0% 10% 20% 30% 40% 50% 60%<br />
I now have a much higher opinion of the<br />
area<br />
I now have a higher opinion of the area<br />
22%<br />
26%<br />
My opinion of the area has remained<br />
the same<br />
My opinion of the area is lower than<br />
before the sailing events<br />
My opinion of the area is much lower<br />
than before the sailing events<br />
1%<br />
1%<br />
51%<br />
BASE: 681<br />
18
When visitor’s opinions of <strong>Weymouth</strong> <strong>and</strong> Portl<strong>and</strong> after visiting the sailing events is<br />
analysed by the different demographic groups no significant differences are highlighted.<br />
However, it is worthy of note that visitors aged 18 – 24 <strong>and</strong> 35 – 44 were more likely to say<br />
that they now have a higher opinion of the area. Female visitors <strong>and</strong> respondents visiting<br />
without children were also more likely to say they now have a higher opinion of the area after<br />
visiting during the Olympic sailing events. Given their higher enjoyment overall, this is not to<br />
imply that having children at the Olympic sailing events marred visitors’ experience of what<br />
was being provided.<br />
Figure 16: Perceptions of <strong>Weymouth</strong> <strong>and</strong> Portl<strong>and</strong> after visiting the Olympic sailing<br />
events (%)<br />
‘Higher opinion of area’ by age/gender/visiting with children<br />
18 ‐ 24 (32)<br />
35 ‐ 44 (151)<br />
Female (399)<br />
55 ‐ 64 (106)<br />
25 ‐ 34 (76)<br />
No children (334)<br />
All (681)<br />
Male (251)<br />
Children (279)<br />
45 ‐ 54 (125)<br />
65 ‐ 74 (101)<br />
75 + (25)<br />
36%<br />
56%<br />
54%<br />
50%<br />
50%<br />
50%<br />
48%<br />
48%<br />
47%<br />
47%<br />
45%<br />
44%<br />
0% 10% 20% 30% 40% 50% 60%<br />
BASE: VARIED AS LABELLED<br />
<strong><strong>Visit</strong>or</strong>s aged 65 <strong>and</strong> above are less likely to say that they have a higher opinion of<br />
<strong>Weymouth</strong> <strong>and</strong> Portl<strong>and</strong> since visiting the area during the Olympic sailing events. It is worth<br />
noting that satisfaction levels in this group are already good for the area.<br />
When analysing whether visitors’ perceptions of the area had changed as a result of<br />
attending the sailing events it is essential to re-visit visitors’ original perceptions of the area.<br />
Only 24 visitors (4%) from the sample had a negative view of the area before attending the<br />
sailing events. Of these 24 visitors 75% (18 visitors) said that they either now had ‘a much<br />
higher opinion’ or ‘a higher opinion’ of the area (highlighted below in green). Five visitors<br />
who had previously had a negative opinion of the area said that their opinion remained the<br />
same (highlighted below in orange). One visitor who had previously had a negative view of<br />
the area stated that their opinion of the area having attended the sailing events ‘was much<br />
lower than before’ (highlighted below in red).<br />
What is more, when looking at the perceptions of those visitors who had a neutral view of the<br />
area prior to attending the sailing events, 71% of these visitors had a higher opinion of the<br />
area after attending the sailing events (highlighted below in green), 28% still had a neutral<br />
19
view of the area (highlighted below in amber) <strong>and</strong> 2% had a more negative view of the area<br />
(highlighted below in red). This clearly demonstrates the positive influence of the Games on<br />
participants’ opinions of the area.<br />
When looking at the perceptions of respondents who had a positive view of the area prior to<br />
attending the sailing events (combining those who said ‘I had a very positive view of the<br />
area’ <strong>and</strong> ‘I had a positive view of the area’), 41% state that they now have an even higher<br />
opinion of the area (highlighted below in green). Just over half (57%) state that their opinion<br />
of the area remains the same (highlighted below in orange) <strong>and</strong> only 1% said that they now<br />
have a more negative view of the area (highlighted below in red).<br />
20
Figure 17: Perceptions of <strong>Weymouth</strong> <strong>and</strong> Portl<strong>and</strong> before <strong>and</strong> after attending sailing events (%)<br />
70%<br />
60%<br />
50%<br />
40%<br />
30%<br />
20%<br />
10%<br />
0%<br />
I had a very<br />
positive view of<br />
the area (288)<br />
I had a positive<br />
view of the area<br />
(241)<br />
I had a neutral<br />
view of the area<br />
(101)<br />
I had a negative<br />
view of the area<br />
(22)<br />
I had a very<br />
negative view of<br />
the area (2)<br />
Don't know / no<br />
opinion (22)<br />
I now have a much higher opinion of the area 24% 13% 31% 27% 0% 36%<br />
I now have a higher opinion of the area 16% 30% 40% 50% 50% 36%<br />
My opinion of the area has remained the same 59% 55% 28% 18% 50% 27%<br />
My opinion of the area is lower than before the sailing<br />
events<br />
My opinion of the area is much lower than before the<br />
sailing events<br />
1% 1% 1% 0% 0% 0%<br />
0% 0% 1% 5% 0% 0%<br />
BASE: VARIED AS LABELLED<br />
21
The vast majority of respondents stated that they would be ‘very likely’ or ‘likely’ to visit<br />
<strong>Weymouth</strong> <strong>and</strong> Portl<strong>and</strong> again in the future.<br />
80%<br />
70%<br />
73%<br />
Figure 18: Likelihood of repeat visit (%)<br />
60%<br />
50%<br />
40%<br />
30%<br />
20%<br />
10%<br />
0%<br />
23%<br />
2% 1% 2%<br />
Very likely Quite likely Quite unlikely Very unlikely Don't know<br />
BASE: 674<br />
When the likelihood of respondents making a repeat visit is analysed by key demographic<br />
information no significant differences are noted. However, visitors aged 65 <strong>and</strong> over are<br />
slightly more likely to state that they are ‘very likely’ to visit again, as are respondents who<br />
visited the area without children. <strong><strong>Visit</strong>or</strong>s aged 35 - 44 are less likely to say that they are<br />
‘very likely’ to visit the area again.<br />
Figure 19: Likelihood of repeat visit (%)<br />
‘Very likely’ by gender/age/visiting with children<br />
75 + (24)<br />
65 ‐ 74 (100)<br />
No children …<br />
45 ‐ 54 (123)<br />
18 ‐ 24 (31)<br />
25 ‐ 34 (76)<br />
All (674)<br />
Female (393)<br />
Male (250)<br />
Children …<br />
55 ‐ 64 (107)<br />
35 ‐ 44 (149)<br />
79%<br />
76%<br />
76%<br />
74%<br />
74%<br />
73%<br />
73%<br />
72%<br />
71%<br />
70%<br />
68%<br />
88%<br />
0% 20% 40% 60% 80% 100%<br />
BASE: VARIED AS LABELLED<br />
22
Whether a visitor is on a day trip from home or is a staying visitor does not have an impact<br />
on their likelihood to visit the area again. 97% of those on a day trip <strong>and</strong> 94% of those on a<br />
staying trip are likely to visit the area again. 1% of those on a day trip <strong>and</strong> 4% of those on a<br />
staying trip are unlikely to visit the <strong>Weymouth</strong> <strong>and</strong> Portl<strong>and</strong> area again.<br />
Figure 20: Likelihood of repeat visit (%)<br />
by type of visitor<br />
80%<br />
70%<br />
74%<br />
71%<br />
60%<br />
50%<br />
40%<br />
30%<br />
20%<br />
23%<br />
23%<br />
Day trip from home (353)<br />
Staying visitor (303)<br />
10%<br />
0%<br />
Very likely<br />
Quite<br />
likely<br />
1% 3%<br />
0% 1% 2% 2%<br />
Quite<br />
unlikely<br />
Very<br />
unlikely<br />
Don't<br />
know<br />
BASE: VARIED AS LABELLED<br />
23
When the likelihood of a repeat visit is analysed by a visitor’s frequency of visit, 86% of respondents who were on their first visit to <strong>Weymouth</strong><br />
<strong>and</strong> Portl<strong>and</strong> stated that they were likely to visit the area again. 99% of those who visited <strong>Weymouth</strong> <strong>and</strong> Portl<strong>and</strong> more than once a year were<br />
likely to visit again, 98% of those who visit approximately once a year are likely to visit the area again <strong>and</strong> 93% of those who visit every few<br />
years are likely to visit again. This indicates that repeat visits only enhance the likelihood of returning again, <strong>and</strong> is a motivating insight for local<br />
tourist providers to maximise on the potential longer term impact of the Olympic <strong>and</strong> Paralympic Games in <strong>Weymouth</strong> <strong>and</strong> Portl<strong>and</strong>.<br />
Figure 21: Likelihood of repeat visit (%)<br />
by frequency of visit<br />
100%<br />
90%<br />
80%<br />
70%<br />
60%<br />
50%<br />
40%<br />
30%<br />
20%<br />
10%<br />
0%<br />
This is my first visit (113)<br />
More than once a year<br />
(227)<br />
About once a year (120) Every few years (118) I live here (78)<br />
Very likely 38% 91% 73% 57% 94%<br />
Quite likely 48% 8% 25% 36% 6%<br />
Quite unlikely 6% 0% 0% 3% 0%<br />
Very unlikely 2% 0% 1% 1% 0%<br />
Don't know 6% 0% 1% 4% 0%<br />
BASE: VARIED AS LABELLED<br />
24
An indubitable indicator of tourist satisfaction for <strong>Weymouth</strong> <strong>and</strong> Portl<strong>and</strong> is that the vast<br />
majority of visitors (97%) would recommend <strong>Weymouth</strong> <strong>and</strong> Portl<strong>and</strong> to their friends <strong>and</strong><br />
family.<br />
Figure 22: recommend the area to friends or family (%)<br />
70%<br />
65%<br />
60%<br />
50%<br />
40%<br />
30%<br />
32%<br />
20%<br />
10%<br />
0%<br />
2% 0% 1%<br />
Very likely Quite likely Quite unlikely Very unlikely Don't know<br />
BASE: 676<br />
<strong><strong>Visit</strong>or</strong>s aged 65 <strong>and</strong> over were more inclined to indicate that they were ‘very likely’ to<br />
recommend the area to friends <strong>and</strong> family. Respondents visiting with no children <strong>and</strong> female<br />
visitors also indicated they were ‘very likely’ to recommend the area to friends <strong>and</strong> family.<br />
Figure 23 recommend the area to friends or family (%)<br />
Very likely by gender/age <strong>and</strong> visiting with children<br />
75 + (24)<br />
65 ‐ 74 (100)<br />
45 ‐ 54 (123)<br />
No children (333)<br />
18 ‐ 24 (30)<br />
Female (394)<br />
All (676)<br />
Children (274)<br />
35 ‐ 44 (151)<br />
Male (252)<br />
55 ‐ 64 (107)<br />
25 ‐ 34 (76)<br />
75%<br />
72%<br />
70%<br />
67%<br />
67%<br />
66%<br />
65%<br />
65%<br />
64%<br />
62%<br />
61%<br />
58%<br />
0% 10% 20% 30% 40% 50% 60% 70% 80%<br />
BASE: VARIED AS LABELLED<br />
25
Section 3: Type of visitor<br />
Just over half of respondents (56%) were on a day trip from home whilst just under (44%)<br />
were on a staying trip in the area.<br />
Figure 24: What type of trip are you on? (%)<br />
44% Day trip from home<br />
56%<br />
Staying visitor<br />
BASE: 668<br />
<strong><strong>Visit</strong>or</strong>s aged 18 – 34 <strong>and</strong> visitors over the age of 55 were more likely to be on a day trip<br />
from home. <strong><strong>Visit</strong>or</strong>s aged 35 – 54 were more likely to be on a staying trip. Respondents<br />
visiting the area without children were more likely to be on a day trip from home rather than<br />
staying overnight.<br />
Figure 25: What type of trip are you on? (%)<br />
by visiting with children/gender/age group<br />
90%<br />
80%<br />
70%<br />
60%<br />
50%<br />
40%<br />
30%<br />
20%<br />
10%<br />
0%<br />
Children<br />
(275)<br />
No<br />
children<br />
(329)<br />
Male<br />
(246)<br />
Female<br />
(394)<br />
18 ‐ 24<br />
(32)<br />
25 ‐ 34<br />
(75)<br />
35 ‐ 44<br />
(148)<br />
45 ‐ 54<br />
(122)<br />
55 ‐ 64<br />
(107)<br />
65 ‐ 74<br />
(98)<br />
Day trip from home 50% 61% 52% 58% 56% 61% 48% 43% 54% 71% 81%<br />
Staying visitor 50% 39% 48% 42% 44% 39% 52% 57% 46% 29% 19%<br />
75 +<br />
(26)<br />
BASE: VARIED AS LABELLED<br />
26
Number of people in group<br />
Respondents were asked how many people were in the immediate group they were visiting<br />
with. The mean average group size was 3.87 people, the median group size was 3 <strong>and</strong> the<br />
modal group size was 2. <strong><strong>Visit</strong>or</strong>s aged 25 – 44 have a greater group mean size compared to<br />
visitors aged 45 <strong>and</strong> over. Whether twosomes, couples <strong>and</strong> groups are formed of romantic,<br />
family or friendship ties may be worth investigating in further research for the area.<br />
Table 2: Average group size by different visitor group<br />
Type of visitor<br />
Average group<br />
size<br />
All visitors 3.87<br />
Day visitors (365) 3.41<br />
Staying visitor (291) 4.40<br />
Staying visitor (<strong>Weymouth</strong> <strong>and</strong> Portl<strong>and</strong>) (218) 4.55<br />
Staying visitor (outside of <strong>Weymouth</strong> <strong>and</strong> Portl<strong>and</strong>) (73) 3.97<br />
<strong><strong>Visit</strong>or</strong> whose main or sole purpose for attending was the sailing<br />
3.65<br />
events. (391)<br />
<strong><strong>Visit</strong>or</strong> whose purpose for visiting the area was not the sailing events<br />
4.09<br />
(266)<br />
<strong><strong>Visit</strong>or</strong> likely to visit the area again (631) 3.89<br />
<strong><strong>Visit</strong>or</strong> unlikely to attend the area again (15)* 4.47<br />
<strong><strong>Visit</strong>or</strong> aged 18 - 24 (30) * 3.93<br />
<strong><strong>Visit</strong>or</strong> aged 25 - 34 (73) 4.27<br />
<strong><strong>Visit</strong>or</strong> aged 35 - 44 (150) 4.65<br />
<strong><strong>Visit</strong>or</strong> aged 45 - 54 (123) 3.69<br />
<strong><strong>Visit</strong>or</strong> aged 55 - 64 (106) 2.84<br />
<strong><strong>Visit</strong>or</strong> aged 65 - 74 (100) 3.84<br />
<strong><strong>Visit</strong>or</strong> aged 75 + (25) * 2.92<br />
<strong><strong>Visit</strong>or</strong>s with children (275) 4.94<br />
<strong><strong>Visit</strong>or</strong>s without children (329) 2.98<br />
* Indicates small sample size<br />
27
Section 4: Staying visitors<br />
The majority of staying visitors (67%) had accommodation within <strong>Weymouth</strong>, 4% were<br />
staying in Portl<strong>and</strong>, <strong>and</strong> 9% were staying in West <strong>Dorset</strong> with Bridport, Lyme Regis <strong>and</strong><br />
Dorchester being the most popular places to stay within this subset. 7% of staying visitors<br />
were based in Purbeck, with Wareham, Lulworth <strong>and</strong> Durdle Door being the most popular<br />
places to stay within this subset. 4% of staying visitors were staying in the conurbation of<br />
Poole <strong>and</strong> Bournemouth <strong>and</strong> 9% of visitors were staying elsewhere in other locations.<br />
Figure 26: Where are you staying? (%)<br />
80%<br />
60%<br />
40%<br />
20%<br />
0%<br />
67%<br />
4% 3% 1%<br />
7% 9%<br />
9%<br />
0%<br />
<strong>Weymouth</strong> Portl<strong>and</strong> Poole Bournemouth Purbeck West <strong>Dorset</strong> North <strong>Dorset</strong> Other<br />
BASE: 293<br />
One third of staying visitors (34%) were staying in a camper van/mobile home/caravan/tent.<br />
One fifth of staying visitors (20%) were staying with friends or family. Just over one tenth<br />
(12%) were staying in a guest house/bed <strong>and</strong> breakfast <strong>and</strong> 7% were staying in hotels.<br />
Figure 27 Type of accommodation (%)<br />
40%<br />
35%<br />
34%<br />
30%<br />
25%<br />
20%<br />
20%<br />
15%<br />
10%<br />
5%<br />
7%<br />
12%<br />
7%<br />
11%<br />
4%<br />
3% 2%<br />
0%<br />
Hotel<br />
Guest<br />
House /<br />
Bed <strong>and</strong><br />
Breakfast<br />
Self<br />
catering<br />
house, flat<br />
or cottage<br />
Static<br />
caravan /<br />
Chalet<br />
Camper<br />
van /<br />
mobile<br />
home /<br />
caravan /<br />
tent<br />
Holiday<br />
park<br />
Home of a<br />
friend or<br />
relative<br />
Second<br />
home<br />
Other<br />
BASE: 297<br />
28
Number of nights in the area<br />
The mean average number of nights staying visitors spent in the area was 7.27. The median<br />
<strong>and</strong> modal number of nights spent in the area was 7. The minimum number of nights spent<br />
in the area was 1 <strong>and</strong> the maximum was 44. The table below shows the mean number of<br />
nights analysed by location of stay. Caution needs to be taken when looking at the table<br />
below due to the small sample size of some areas, for this reason results should be used as<br />
indicative only. The mean number of nights for those visitors staying in <strong>Weymouth</strong> is 7.46.<br />
Table 3: Mean number of nights by place of stay<br />
Mean number of nights<br />
<strong>Weymouth</strong> (189) 7.46<br />
Portl<strong>and</strong> (12) 6.67<br />
Dorchester (8) 5.50<br />
Poole (8) 6.50<br />
Bournemouth (3) 12.33<br />
Bridport (10) 6.90<br />
Wareham (7) 8.29<br />
Swanage (2) 9.00<br />
Other (21) 5.52<br />
Purbeck (12) 8.00<br />
West <strong>Dorset</strong> (10) 5.40<br />
North <strong>Dorset</strong> (2) 16.50<br />
29
Cost of accommodation<br />
The mean cost of accommodation per person was £25.06 per night. The median was £20.00<br />
<strong>and</strong> the modal cost was £50.00 per person per night.<br />
When the mean cost of accommodation is analysed by type of accommodation the mean<br />
average cost for staying in a Guest House or Bed <strong>and</strong> Breakfast is £43.56 per person, per<br />
night, for a hotel it is £41.66 per person, per night. The lowest mean average cost by type of<br />
accommodation is £13.91 per person, per night for staying in a camper van / mobile home /<br />
caravan or tent.<br />
Table 4: mean cost of accommodation by type of accommodation<br />
Type of accommodation<br />
Mean cost per<br />
person per night<br />
Hotel (12) 41.66<br />
Guest House / Bed <strong>and</strong> Breakfast (31) 43.56<br />
Self catering house, flat or cottage (15) 35.51<br />
Static caravan / Chalet (15) 28.48<br />
Camper van / mobile home / caravan / tent (82) 13.91<br />
Holiday park (7) 29.78<br />
Other (2) 97.50<br />
30
Section 5: <strong><strong>Visit</strong>or</strong> economic spend<br />
For every visitor to <strong>Weymouth</strong> <strong>and</strong> Portl<strong>and</strong> a total of £23.24 per person was spent within the<br />
local area, £2.51 was spent outside <strong>Weymouth</strong> <strong>and</strong> Portl<strong>and</strong> but within <strong>Dorset</strong>, <strong>and</strong> £1.14<br />
was spent outside of <strong>Dorset</strong>. The greatest amount of money was spent on food <strong>and</strong> drink<br />
(£9.39) within the area followed by fares <strong>and</strong> petrol (£5.77) <strong>and</strong> durable goods (£2.23).<br />
In <strong>Weymouth</strong> <strong>and</strong><br />
Portl<strong>and</strong><br />
Mean spend per visitor<br />
Outside <strong>Weymouth</strong><br />
<strong>and</strong> Portl<strong>and</strong> but in<br />
<strong>Dorset</strong><br />
Outside <strong>Dorset</strong><br />
Food <strong>and</strong> drink £9.39 £0.97 £0.34<br />
Convenience goods £2.08 £0.15 £0.01<br />
Durable goods £2.23 £0.28 £0.00<br />
Entertainment <strong>and</strong><br />
£1.22 £0.20 £0.04<br />
leisure<br />
<strong><strong>Visit</strong>or</strong> attractions £1.58 £0.14 £0.06<br />
Fares <strong>and</strong> petrol £5.77 £0.75 £0.65<br />
Other £0.97 £0.03 £0.04<br />
Total average spend £23.24 £2.51 £1.14<br />
A full break down of economic spends by different visitor types can be found in Appendix 2.<br />
31
The table below shows the mean spend per person, in each of the different visitor groups,<br />
<strong>and</strong> how much they spent in <strong>Weymouth</strong> <strong>and</strong> Portl<strong>and</strong>, outside <strong>Weymouth</strong> <strong>and</strong> Portl<strong>and</strong> but<br />
within <strong>Dorset</strong> <strong>and</strong> outside of <strong>Dorset</strong>.<br />
The types of visitors who spent the most in the <strong>Weymouth</strong> <strong>and</strong> Portl<strong>and</strong> area during their<br />
visit were:<br />
• <strong><strong>Visit</strong>or</strong>s aged 25 - 34<br />
• <strong><strong>Visit</strong>or</strong>s aged 55 - 64<br />
• <strong><strong>Visit</strong>or</strong>s aged 45 – 54<br />
• <strong><strong>Visit</strong>or</strong>s from socio economic groups B <strong>and</strong> C1<br />
• <strong><strong>Visit</strong>or</strong>s staying in <strong>Weymouth</strong> <strong>and</strong> Portl<strong>and</strong><br />
• <strong><strong>Visit</strong>or</strong>s without children in their visiting group<br />
• <strong><strong>Visit</strong>or</strong>s who were not visiting because of the sailing events<br />
• <strong><strong>Visit</strong>or</strong>s who are likely to return to the area again<br />
Type of visitor<br />
Table 5: <strong><strong>Visit</strong>or</strong> expenditure<br />
In<br />
<strong>Weymouth</strong><br />
<strong>and</strong><br />
Portl<strong>and</strong><br />
Outside<br />
<strong>Weymouth</strong><br />
<strong>and</strong><br />
Portl<strong>and</strong> but<br />
in <strong>Dorset</strong><br />
Outside<br />
<strong>Dorset</strong><br />
Total mean<br />
spend<br />
All visitors £23.24 £2.51 £1.14 £26.89<br />
Day visitors £15.62 £0.72 £0.63 £16.97<br />
Staying visitor £32.38 £4.67 £1.74 £38.79<br />
Staying visitor (<strong>Weymouth</strong> <strong>and</strong><br />
Portl<strong>and</strong>)<br />
Staying visitor (outside of<br />
<strong>Weymouth</strong> <strong>and</strong> Portl<strong>and</strong>)<br />
<strong><strong>Visit</strong>or</strong> main or sole purpose for<br />
attending was the sailing events.<br />
<strong><strong>Visit</strong>or</strong> whose purpose for visiting<br />
the area was not the sailing<br />
events<br />
£36.76 £0.90 £0.86 £38.52<br />
£22.55 £13.16 £3.78 £39.49<br />
£21.09 £2.02 £1.43 £24.54<br />
£26.55 £3.36 £0.80 £30.71<br />
<strong><strong>Visit</strong>or</strong> likely to visit the area again £23.61 £2.31 £1.12 £27.04<br />
<strong><strong>Visit</strong>or</strong> unlikely to attend the area £19.65 £8.61 £1.97 £30.23<br />
again<br />
<strong><strong>Visit</strong>or</strong> aged 18 - 24 £17.23 £2.72 £1.47 £21.42<br />
<strong><strong>Visit</strong>or</strong> aged 25 - 34 £35.61 £0.88 £0.87 £37.36<br />
<strong><strong>Visit</strong>or</strong> aged 35 - 44 £18.70 £2.60 £0.87 £22.17<br />
<strong><strong>Visit</strong>or</strong> aged 45 - 54 £26.08 £2.52 £2.35 £30.95<br />
<strong><strong>Visit</strong>or</strong> aged 55 - 64 £26.81 £3.58 £1.06 £31.45<br />
<strong><strong>Visit</strong>or</strong> aged 65 - 74 £19.61 £0.97 £1.15 £21.73<br />
<strong><strong>Visit</strong>or</strong> aged 75 + £18.01 £0.28 £0.00 £18.29<br />
<strong><strong>Visit</strong>or</strong>s with children £18.04 £3.12 £0.68 £21.84<br />
<strong><strong>Visit</strong>or</strong>s without children £28.84 £2.29 £1.68 £32.81<br />
Socio economic classification B £27.41 £5.03 £0.52 £32.96<br />
Socio economic classification C1 £22.79 £2.39 £1.84 £27.02<br />
Socio economic classification C2 £21.61 £1.44 £0.78 £23.83<br />
Socio economic classification D £24.06 £0.93 £1.43 £26.42<br />
32
Section 6: <strong><strong>Visit</strong>or</strong> profile<br />
Just under two fifths of the visitors surveyed were male (39%) <strong>and</strong> just over three fifths were<br />
female (61%). This has changed slightly from the gender profile seen in the 2009 survey<br />
where 55% were Male <strong>and</strong> 45% Female.<br />
Figure 28: Gender of respondent<br />
61%<br />
39%<br />
Male (253)<br />
Female (402)<br />
BASE: 655<br />
One quarter of the sample was 35 – 44 years of age, which was the most common age<br />
group.<br />
Figure 29: Age of respondent<br />
30%<br />
25%<br />
20%<br />
25%<br />
20%<br />
17% 16%<br />
15%<br />
12%<br />
10%<br />
5%<br />
5%<br />
4%<br />
0%<br />
18 ‐ 24 25 ‐ 34 35 ‐ 44 45 ‐ 54 55 ‐ 64 65 ‐ 74 75 +<br />
BASE: 622<br />
33
When comparing the age profile of visitors between 2009 <strong>and</strong> 2012 there seems to have<br />
been a slight increase in the number of visitors under the age of 44 <strong>and</strong> a decrease in those<br />
aged between the ages of 45 – 74. If we refer back to respondents’ purpose for visiting the<br />
area: visitors aged 18 – 34 were most likely to say their ‘sole’ reason for visiting was<br />
because of the sailing events. More evidence as to whether the sailing events attracted<br />
younger visitors or whether the overall visitor profile to <strong>Weymouth</strong> <strong>and</strong> Portl<strong>and</strong> has changed<br />
will be available once the Market Research Groups’ <strong>Dorset</strong> visitor survey 2012 report is<br />
released at the end of this year.<br />
Figure 30: Age of respondent 2009 / 2012<br />
30%<br />
25%<br />
20%<br />
25%<br />
23%<br />
22%<br />
20%<br />
17%<br />
25%<br />
18%<br />
16%<br />
15%<br />
10%<br />
5%<br />
5%<br />
2%<br />
12%<br />
9%<br />
4%<br />
2%<br />
2012 (622)<br />
2009 (129)<br />
0%<br />
18 ‐ 24 25 ‐ 34 35 ‐ 44 45 ‐ 54 55 ‐ 64 65 ‐ 74 75 +<br />
BASE: VARIED AS LABELLED<br />
Just fewer than half the sample (45%) was visiting the area with children in their group.<br />
Figure 31: Respondents visiting with children<br />
55%<br />
45%<br />
Children (280)<br />
No children (338)<br />
BASE: 618<br />
34
The majority of visitors (80%) aged 35 - 44 were visiting the area with children. <strong><strong>Visit</strong>or</strong>s aged<br />
over 55 were least likely to have visited with children in their group.<br />
Figure 32: Age of respondent analysed by visiting the area with children<br />
90%<br />
80%<br />
80%<br />
70%<br />
60%<br />
50%<br />
40%<br />
38%<br />
59%<br />
53%<br />
30%<br />
20%<br />
17% 19%<br />
17%<br />
10%<br />
0%<br />
18 ‐ 24<br />
(32)<br />
25 ‐ 34<br />
(73)<br />
35 ‐ 44<br />
(146)<br />
45 ‐ 54<br />
(118)<br />
55 ‐ 64<br />
(106)<br />
65 ‐ 74<br />
(100)<br />
75 + (24)<br />
BASE: VARIED AS LABELLED<br />
Respondents were asked the occupation of the main wage earner in their household. Their<br />
response was then categorised into social economic groups.<br />
Table 6: Socio – economic group<br />
A<br />
B<br />
C1<br />
C2<br />
D<br />
E<br />
Market Research socio- economic groups<br />
Higher managerial, administrative,<br />
professional e.g. Chief executive, senior civil<br />
servant, surgeon<br />
Intermediate managerial, administrative,<br />
professional e.g. bank manager, teacher<br />
Supervisory, clerical, junior managerial e.g.<br />
shop floor supervisor, bank clerk, sales<br />
person<br />
Skilled manual workers e.g. electrician,<br />
carpenter<br />
Semi-skilled <strong>and</strong> unskilled manual workers<br />
e.g. assembly line worker, refuse collector,<br />
messenger<br />
Casual labourers, state pensioners,<br />
unemployed e.g. pensioners without private<br />
pensions <strong>and</strong> anyone living on basic benefits<br />
35
Since 2009 there has been a slight increase in visitors in the A, D <strong>and</strong> E socio - economic<br />
groups <strong>and</strong> a slight decrease in visitors from groups C1 <strong>and</strong> C2. The percentage of visitors<br />
from socio - economic classification group B has remained constant. It is unknown if this has<br />
changed within the last three years or whether the change applies specifically to the Olympic<br />
visitor profile. This will be explored in more depth later in the year when the Market Research<br />
Groups’ <strong>Dorset</strong> visitor survey 2012 report is released.<br />
Figure 33: Occupation of main wage earner (%)<br />
35%<br />
30%<br />
25%<br />
20%<br />
15%<br />
21% 21%<br />
32% 32%<br />
29%<br />
25%<br />
20%<br />
14%<br />
2012 (565)<br />
2009 (147)<br />
10%<br />
5%<br />
0%<br />
3%<br />
1%<br />
2%<br />
0%<br />
A B C1 C2 D E<br />
BASE: VARIED AS LABELLED<br />
36
Table 7: <strong><strong>Visit</strong>or</strong> home post code analysis<br />
Respondents were asked to supply their home postcode <strong>and</strong> this showed that one third<br />
(33%) lived in <strong>Dorset</strong> <strong>and</strong> just over a quarter (26%) lived in one of <strong>Dorset</strong>’s neighbouring<br />
counties (Devon, Somerset, Wiltshire or Hampshire).<br />
County<br />
<strong>Dorset</strong> 33%<br />
Somerset 11%<br />
Hampshire 6%<br />
Wiltshire 5%<br />
Devon 4%<br />
West Midl<strong>and</strong>s 4%<br />
Berkshire 4%<br />
Bristol 4%<br />
Yorkshire 3%<br />
Surrey 2%<br />
London 2%<br />
Oxfordshire 2%<br />
Wales 2%<br />
Nottinghamshire 2%<br />
Essex 2%<br />
Leicestershire 1%<br />
Buckinghamshire 1%<br />
Herefordshire 1%<br />
Scotl<strong>and</strong> 1%<br />
East Sussex 1%<br />
Gloucestershire 1%<br />
Merseyside 1%<br />
Northampton 1%<br />
Derbyshire 1%<br />
Lancashire 1%<br />
Kent 1%<br />
Bedfordshire 1%<br />
Cornwall 1%<br />
Cambridgeshire 1%<br />
Other areas 3%<br />
37
Table 8: <strong><strong>Visit</strong>or</strong> home post code analysis (day visitor)<br />
As would be expected the vast majority (85%) of visitors on a day trip were visiting either<br />
from <strong>Dorset</strong> or one of the surrounding counties.<br />
County<br />
Day trip<br />
<strong>Dorset</strong> 53%<br />
Somerset 16%<br />
Hampshire 6%<br />
Devon 5%<br />
Wiltshire 5%<br />
Bristol 3%<br />
Berkshire 2%<br />
Other<br />
9%<br />
38
Table 9: <strong><strong>Visit</strong>or</strong> home post code analysis (staying visitor)<br />
Staying visitors to <strong>Weymouth</strong> <strong>and</strong> Portl<strong>and</strong> during the Olympic sailing events travelled from<br />
all over the UK.<br />
County<br />
Staying visitor<br />
West Midl<strong>and</strong>s 8%<br />
Hampshire 7%<br />
Berkshire 6%<br />
Wiltshire 5%<br />
Yorkshire 5%<br />
<strong>Dorset</strong> 4%<br />
Surrey 4%<br />
Bristol 4%<br />
Somerset 4%<br />
Devon 4%<br />
Oxfordshire 4%<br />
Leicestershire 4%<br />
Essex 4%<br />
London 3%<br />
Wales 3%<br />
Nottinghamshire 3%<br />
Buckinghamshire 2%<br />
Gloucestershire 2%<br />
Northampton 2%<br />
Herefordshire 2%<br />
Scotl<strong>and</strong> 2%<br />
Merseyside 2%<br />
Lancashire 2%<br />
East Sussex 2%<br />
Derbyshire 2%<br />
Kent 2%<br />
Bedfordshire 2%<br />
Cornwall 2%<br />
Cambridgeshire 2%<br />
Other<br />
5%<br />
39
Section 7: Summary of results<br />
It is important to remember when concluding this research that the results represent opinions<br />
from visitors to <strong>Weymouth</strong> town centre during the Olympic sailing events. The majority of<br />
questionnaires were conducted near or within the Live Site, the Bayside Festival, the<br />
esplanade <strong>and</strong> the harbour area. This survey would not have captured the views of many of<br />
those spectators attending the sailing events at the official Olympic ticketed spectator site.<br />
Section 1: Decision to visit the area<br />
Three out of every five (59%) of the visitor sample stated that the Olympic sailing events<br />
were their main reason for visiting the area. <strong><strong>Visit</strong>or</strong>s who were on a day trip from home were<br />
more likely to say that the Olympic sailing events were their ‘sole’ reason for visiting the area<br />
compared to those who were on a staying trip to the area.<br />
There has been an increase in visitors aged between 18 – 34 when compared with the age<br />
profile of respondents to the 2009 visitor survey. This age group were also more likely to say<br />
that the Olympic sailing events were their ‘sole’ reason for visiting the area. Therefore, it is<br />
possible that the Olympic sailing events have attracted a younger visitor profile to the area.<br />
More information surrounding this will be available once the <strong>Dorset</strong> visitor survey 2012 report<br />
is released at the end of this year. This will help evaluate whether the sailing events have<br />
attracted a younger profile or whether the overall visitor population to <strong>Weymouth</strong> <strong>and</strong><br />
Portl<strong>and</strong> has changed over time.<br />
The limitations to this study mean that we cannot evaluate how many people who would<br />
usually visit <strong>Weymouth</strong> <strong>and</strong> Portl<strong>and</strong> did not do so because of the Olympic sailing events. To<br />
estimate this the council would need to look at visitor numbers from previous years to see if<br />
there was a difference in footfall because of the sailing events.<br />
Section 2: Perceptions of the visit <strong>and</strong> of <strong>Weymouth</strong> <strong>and</strong> Portl<strong>and</strong><br />
The vast majority of respondents (97%) rated their time spent in <strong>Weymouth</strong> <strong>and</strong> Portl<strong>and</strong><br />
positively, while the remaining 3% felt neutral about their visit. As the majority of visitors<br />
were positive about their visit it was important to look at the extent to which they were<br />
positive about their visit to draw any differences between groups. Female visitors, visitors<br />
over the age of 55 <strong>and</strong> respondents who were visiting without children were most likely to<br />
rate the time they spent in <strong>Weymouth</strong> <strong>and</strong> Portl<strong>and</strong> as ‘very good’.<br />
<strong><strong>Visit</strong>or</strong>s were asked about their perception of <strong>Weymouth</strong> <strong>and</strong> Portl<strong>and</strong> prior to visiting the<br />
area during the Olympic sailing events. Just over three quarters (78%) had a positive view of<br />
the area. <strong><strong>Visit</strong>or</strong>s aged 45 <strong>and</strong> over were more likely to view the area as ‘very positive’<br />
compared to visitors under the age of 45. <strong><strong>Visit</strong>or</strong>s who were on a staying trip away from<br />
home had a higher positive perception of the area compared to those on a day trip.<br />
Nearly half of the visitors interviewed (48%) said that their opinion of the area was now<br />
higher after visiting during the Olympic sailing events. Just over half (51%) said that their<br />
opinion of the area had remained the same <strong>and</strong> only 2% said that their opinion was lower<br />
than before their visit. <strong><strong>Visit</strong>or</strong>s aged 18 – 24 <strong>and</strong> 35 - 44 were more likely to have a higher<br />
opinion of the area after visiting during the Olympic sailing events. Female respondents <strong>and</strong><br />
40
those visiting without children were also more likely to have a higher opinion of the area after<br />
they had visited during the Olympic sailing events.<br />
When looking at perceptions of the area after visiting compared to prior opinions of<br />
<strong>Weymouth</strong> <strong>and</strong> Portl<strong>and</strong>, it can be seen that for the small group of visitors who had a<br />
negative prior perception, 75% of these said that they now had either ‘a much higher opinion’<br />
or ‘a higher opinion’ of the area. For visitors who had a neutral view of the area prior to the<br />
sailing events, 71% had a higher opinion after attending the events. Of those who had a<br />
positive view of <strong>Weymouth</strong> <strong>and</strong> Portl<strong>and</strong> prior to visiting the Olympic sailing events, 41%<br />
state that they now have a higher opinion of the area.<br />
<strong>Visit</strong>s to <strong>Weymouth</strong> <strong>and</strong> Portl<strong>and</strong> during the sailing events proved a good experience for the<br />
majority of visitors <strong>and</strong> increased positive opinions of the area. The majority of those who<br />
already felt positive either remained so or became more positive. The majority of those who<br />
felt neutral or negative about the area now have a more positive view. Only 2% of the<br />
sample stated that their opinion of the area was less positive.<br />
The vast majority of visitors (96%) are likely to visit the <strong>Weymouth</strong> <strong>and</strong> Portl<strong>and</strong> area again.<br />
86% of respondents who said it was their first visit to the area stated that they are likely to<br />
return. The vast majority of visitors (97%) would recommend the area to friends <strong>and</strong> family.<br />
Section 3: Type of visitor<br />
Just over half of respondents (56%) were on a day trip from home whilst the remainder<br />
(44%) were staying in the area.<br />
The average group size visiting the area was 3.87 people.<br />
17% of visitors were visiting the <strong>Weymouth</strong> <strong>and</strong> Portl<strong>and</strong> area for the first time. 12% of those<br />
interviewed lived in the <strong>Weymouth</strong> <strong>and</strong> Portl<strong>and</strong> area.<br />
64% of visitors on their first trip to the area stated that the Olympic sailing events were their<br />
‘main’ or ‘sole’ purpose for visiting.<br />
Section 4: Staying visitors<br />
The majority of staying visitors were based in <strong>Weymouth</strong> (67%). The mean number of nights<br />
spent in the area was 7.27 <strong>and</strong> the mean cost of accommodation per person, per night was<br />
£25.06.<br />
41
Section 5: Economic spend<br />
<strong><strong>Visit</strong>or</strong>s to <strong>Weymouth</strong> <strong>and</strong> Portl<strong>and</strong> spent a total of £23.24 per person within the local area;<br />
£2.51 was spent per person outside of the <strong>Weymouth</strong> <strong>and</strong> Portl<strong>and</strong> area but within <strong>Dorset</strong><br />
<strong>and</strong> £1.14 per person was spent outside of <strong>Dorset</strong>. The majority of visitors spent most of<br />
their money on food <strong>and</strong> drink <strong>and</strong> fares <strong>and</strong> petrol. <strong><strong>Visit</strong>or</strong> groups who spent the most<br />
during their visit to <strong>Weymouth</strong> <strong>and</strong> Portl<strong>and</strong> were those aged 25 – 34 <strong>and</strong> 45 – 64. <strong><strong>Visit</strong>or</strong>s<br />
who were not in the area because of the sailing events spent more than those who were<br />
visiting for the sailing events. <strong><strong>Visit</strong>or</strong>s who are likely to return to the area spent more than<br />
those unlikely to return.<br />
Section 6: <strong><strong>Visit</strong>or</strong> profile<br />
Just under two fifths of the visitors surveyed were male <strong>and</strong> just over three fifths were<br />
female. This has changed slightly from the gender profile of visitors from the 2009 survey<br />
where 55% were male <strong>and</strong> 45% were female.<br />
17% of the sample was aged 18 – 34, 45% was aged 35 – 54, 33% was aged 55 – 74 <strong>and</strong><br />
4% was aged 75 <strong>and</strong> over.<br />
42
Section 8: Conclusion<br />
Overall, respondents enjoyed their visit to <strong>Weymouth</strong> <strong>and</strong> Portl<strong>and</strong> during the Olympic<br />
sailing events. Most are likely to visit again, although we can not be certain how often <strong>and</strong><br />
when the repeat visit is likely to take place. The majority of visitors will also be advocates of<br />
the area, with 97% likely to recommend the area to friends <strong>and</strong> family. Opinions regarding<br />
<strong>Weymouth</strong> <strong>and</strong> Portl<strong>and</strong> had improved as a result of visiting the area during the Olympic<br />
sailing events for the majority of respondents.<br />
The findings from this research suggest that <strong>Weymouth</strong> <strong>and</strong> Portl<strong>and</strong> as a tourist destination<br />
is successful in its “offer” to visitors who are attracted to the area year after year. This is<br />
highlighted by the number of repeat visits <strong>and</strong> perceptions <strong>and</strong> enjoyment of the area.<br />
<strong>Weymouth</strong> <strong>and</strong> Portl<strong>and</strong> as a tourist destination may want to focus its efforts on the 10% of<br />
the overall sample who were on their first visit to the area <strong>and</strong> whose main or sole reason for<br />
visiting was the Olympic sailing events. What will make this 10% of visitors return to the<br />
area for future visits? To answer this question it is essential to look at the visitor profile of this<br />
group <strong>and</strong> think about the tourism “offer” to this type of visitor. Although the sample in this<br />
research is relatively small it is still large enough to draw some indicative analysis.<br />
This research shows that staying visitors from this group are significantly less likely to be<br />
staying in the <strong>Weymouth</strong> area compared to the overall visitor profile. <strong>Weymouth</strong> <strong>and</strong><br />
Portl<strong>and</strong> as a destination may want to think about their staying accommodation offer to this<br />
group.<br />
This group had a greater mean spend than the overall sample (£32.34 compared to £26.89)<br />
of the total sample, but spent less in the <strong>Weymouth</strong> <strong>and</strong> Portl<strong>and</strong> area compared to the<br />
wider sample (£21.32 compared to £23.24 of the total sample). If this profile of visitor<br />
actually stayed in the <strong>Weymouth</strong> <strong>and</strong> Portl<strong>and</strong> area then it is inevitable that their spend in the<br />
area would increase instead of being spent elsewhere in <strong>Dorset</strong> or further a field.<br />
Just over half (54%) of this profile (first time visitors, specifically for the Olympics) were aged<br />
35 – 54 <strong>and</strong> the profile of this visitor is slightly younger than the overall sample, with<br />
significantly less people over the age of 65 compared to the wider sample. More information<br />
about this group of visitor can be found in appendix 3.<br />
43
Section 9: Recommendation<br />
1.) Findings from this report will need to be considered in conjunction with feedback from<br />
other mechanisms such as the media, feedback from businesses <strong>and</strong> future profiling<br />
of <strong>Weymouth</strong> <strong>and</strong> Portl<strong>and</strong> visitors to determine the long term effects of <strong>Weymouth</strong><br />
<strong>and</strong> Portl<strong>and</strong> hosting the Olympic sailing events in 2012.<br />
2.) To increase visitor spend in the <strong>Weymouth</strong> <strong>and</strong> Portl<strong>and</strong> area should look to increase<br />
what it offers or increase the promotion of what is offers to visitors aged 25 – 34, as<br />
this research shows that visitors in this age profile spend more compared to visitors<br />
in other age categories. <strong>Weymouth</strong> <strong>and</strong> Portl<strong>and</strong> will need to think about <strong>and</strong> find<br />
information on what types of activities <strong>and</strong> offers will attract this age group to the<br />
area. It should also look to attract more visitors from B <strong>and</strong> C1 social economic<br />
groups as the research shows visitors from these groups spend more money in the<br />
local area.<br />
3.) To increase the number of staying visitors to <strong>Weymouth</strong> <strong>and</strong> Portl<strong>and</strong> (20% of<br />
staying visitors were staying in accommodation elsewhere in <strong>Dorset</strong>) the partnership<br />
may want to look in to what accommodation “offer” would appeal to those first time<br />
visitors who were staying elsewhere in <strong>Dorset</strong>.<br />
4.) <strong>Weymouth</strong> <strong>and</strong> Portl<strong>and</strong> may want to concentrate its efforts on designing marketing<br />
material for potential visitors from Wiltshire, Hampshire, Devon <strong>and</strong> Somerset as a<br />
large proportion of visitors to <strong>Weymouth</strong> <strong>and</strong> Portl<strong>and</strong> currently live in these areas.<br />
However, this will not necessarily increase the proportion of visitors who will stay<br />
overnight. <strong>Weymouth</strong> <strong>and</strong> Portl<strong>and</strong> may wish to consider how it can turn day trips in<br />
to staying trips for visitors living in these areas.<br />
The top five locations where staying visitors live are the West Midl<strong>and</strong>s, Hampshire,<br />
Berkshire, Wiltshire <strong>and</strong> Yorkshire. More research at the end of the year (2012) will<br />
be available to see if this is representative of the staying visitor population to<br />
<strong>Weymouth</strong> <strong>and</strong> Portl<strong>and</strong>.<br />
44
Appendix 1 Questionnaire <strong>and</strong> topline results<br />
<strong>Weymouth</strong> <strong>and</strong> Portl<strong>and</strong> <strong><strong>Visit</strong>or</strong> Questionnaire<br />
We would be grateful if you could complete this short questionnaire <strong>and</strong> tell us about your trip to <strong>Weymouth</strong> <strong>and</strong><br />
Portl<strong>and</strong> during the Olympic sailing events. This research is being undertaken on behalf of <strong>Weymouth</strong> <strong>and</strong> Portl<strong>and</strong><br />
Borough Council.<br />
Q1<br />
What date did you visit <strong>Weymouth</strong> <strong>and</strong> Portl<strong>and</strong><br />
during the Olympic sailing events? (If spending<br />
more than one day here please enter the date of<br />
your first day of visit) (dd/mm/yy)<br />
Q7<br />
How likely are you to visit <strong>Weymouth</strong> <strong>and</strong><br />
Portl<strong>and</strong> again in the future?<br />
(Please tick one option)<br />
Very likely Quite likely Quite<br />
Very unlikely Don't know<br />
unlikely<br />
73% 23% 2% 1% 2%<br />
Q2<br />
Q3<br />
Q4<br />
Q5<br />
Q6<br />
What role did the Olympic sailing events play in<br />
your decision to visit <strong>Weymouth</strong> today?<br />
(Please tick one option)<br />
It was my sole reason for visiting ........................... 21%<br />
It was my main reason for visiting.......................... 38%<br />
I knew of the sailing events but it played no role in my<br />
decision to visit .................................................. 39%<br />
I had never heard of the sailing events before my visit 1%<br />
Which events/areas have you visited during your<br />
visit? (Please tick all that apply)<br />
The <strong>Weymouth</strong> Bayside Festival ........................... 34%<br />
<strong>Weymouth</strong> <strong>and</strong> Portl<strong>and</strong> Live Site.......................... 59%<br />
The Sports Arena ............................................... 29%<br />
The <strong>Weymouth</strong> Sea Life Tower ............................. 20%<br />
Other ............................................................... 26%<br />
If other, please<br />
state<br />
Overall, how would you rate your time spent in<br />
<strong>Weymouth</strong> <strong>and</strong> Portl<strong>and</strong> today?<br />
(Please tick one option)<br />
Very good Good Neither Poor Very poor Don't know<br />
good nor<br />
/ no<br />
poor<br />
opinion<br />
63% 34% 3% 0% 0% 0%<br />
Prior to attending the Olympic sailing events in<br />
<strong>Weymouth</strong> <strong>and</strong> Portl<strong>and</strong> what was your opinion<br />
of the area? (Please tick one option)<br />
I had a very positive view of the area ..................... 43%<br />
I had a positive view of the area ............................ 35%<br />
I had a neutral view of the area ............................. 15%<br />
I had a negative view of the area ........................... 3%<br />
I had a very negative view of the area .................... 0%<br />
Don't know / no opinion ....................................... 3%<br />
Has visiting the Olympic sailing events changed<br />
your opinion of <strong>Weymouth</strong> <strong>and</strong> Portl<strong>and</strong>?<br />
(Please tick one option)<br />
I now have a much higher opinion of the area .......... 22%<br />
I now have a higher opinion of the area .................. 26%<br />
My opinion of the area has remained the same ........ 51%<br />
My opinion of the area is lower than before the sailing<br />
events .............................................................<br />
My opinion of the area is much lower than before the<br />
sailing events ....................................................<br />
1%<br />
1%<br />
Q8<br />
Q9<br />
How likely are you to recommend the area to<br />
friends or family? (Please tick one option)<br />
Very likely Quite likely Quite Very unlikely Don't know<br />
unlikely<br />
65% 32% 2% 0% 1%<br />
What type of trip are you on?<br />
(Please tick one option)<br />
Day trip from home .............................. 56%<br />
Staying visitor..................................... 44%<br />
Q10 Where are you staying? (Please tick one option)<br />
<strong>Weymouth</strong> ................ 67% Purbeck .................... 7%<br />
Portl<strong>and</strong> ................... 4% West <strong>Dorset</strong>............... 9%<br />
Poole ...................... 3% North <strong>Dorset</strong> .............. 0%<br />
Bournemouth............. 1% Other ........................ 9%<br />
If other please<br />
state<br />
Q11 What sort of accommodation are you staying in?<br />
(Please tick one option)<br />
Hotel................................................................ 7%<br />
Guest House / Bed <strong>and</strong> Breakfast .......................... 12%<br />
Self catering house, flat or cottage ......................... 7%<br />
Static caravan / Chalet ........................................ 11%<br />
Camper van / mobile home / caravan / tent.............. 34%<br />
Holiday park...................................................... 4%<br />
Home of a friend or relative .................................. 20%<br />
Second home .................................................... 3%<br />
Other ............................................................... 2%<br />
Q12<br />
If other please<br />
state<br />
How many nights do you intend to spend in the<br />
area? (Please write the number in figures)<br />
Mean 7.27<br />
Q13 How many days do you intend to spend in<br />
<strong>Weymouth</strong> <strong>and</strong> Portl<strong>and</strong>?<br />
(Please write the number in figures)<br />
Mean 4.42
Q14 Please tell us the total amount your group will be<br />
spending on accommodation during your stay in<br />
the area (including meals at your<br />
accommodation). (Please write figure in £s)<br />
Mean value, per person, per night £25.06<br />
Q15 Including yourself, how many people are in your<br />
immediate party/group?<br />
Mean 3.87<br />
Q16 How often do you visit <strong>Weymouth</strong> <strong>and</strong> Portl<strong>and</strong>? (Please tick one option)<br />
This is my first visit More than once a year About once a year Every few years I live here<br />
17% 35% 18% 18% 12%<br />
Q17 Could you tell me approximately how much you <strong>and</strong> your immediate party spent in total or intend to spend<br />
today as a result of your visit to <strong>Weymouth</strong> <strong>and</strong> Portl<strong>and</strong> on the various items below? Mean spend<br />
In <strong>Weymouth</strong> <strong>and</strong> Portl<strong>and</strong> Outside <strong>Weymouth</strong> <strong>and</strong> Outside <strong>Dorset</strong><br />
Portl<strong>and</strong> but in <strong>Dorset</strong><br />
Food <strong>and</strong> drink (excluding meals or accommodation) £9.39 £0.97 £0.34<br />
Convenience goods (ice cream, sweets, postcards etc) £2.08 £0.15 £0.01<br />
Durable goods (clothing, books, household items etc) £2.23 £0.28 £0.00<br />
Entertainment <strong>and</strong> leisure (tickets / cinema etc) £1.22 £0.20 £0.04<br />
<strong><strong>Visit</strong>or</strong> attractions £1.58 £0.14 £0.06<br />
Fares <strong>and</strong> petrol (including the cost of getting here) £5.77 £0.75 £0.65<br />
Other costs (e.g. car parking, deckchair hire) £0.97 £0.03 £0.04<br />
Q18 UK visitors please provide your postcode,<br />
overseas visitors please provide your country of<br />
origin.<br />
Q19 Please tell us the occupation of the main wage<br />
earner in your household?<br />
Q20 Are you retired? (Please tick one option)<br />
Yes .......................... 29% No ........................... 71%<br />
Q21 Are you...? (Please tick one option)<br />
Male ......................... 39% Female ..................... 61%<br />
Q22 Please indicate your age. (Please tick one option)<br />
18 - 24 ..................... 5% 55 - 64 ...................... 17%<br />
25 - 34 ..................... 12% 65 - 74 ...................... 16%<br />
35 - 44 ..................... 25% 75 + ......................... 4%<br />
45 - 54 ..................... 20%<br />
Q23 Including yourself, please indicate the number of<br />
adults <strong>and</strong> children visiting with you today.<br />
(Please tick one box for each row)<br />
0 1 2 3 4 5 6 +<br />
Adults 1% 13% 56% 12% 10% 4% 4%<br />
Children (Under 16) 26% 24% 32% 10% 4% 1% 1%<br />
Q24 <strong>Weymouth</strong> <strong>and</strong> Portl<strong>and</strong> Borough Council would like to be able to contact you in the future with information<br />
about future trips to the area. Please enter your email address below. This will be held securely by the council<br />
<strong>and</strong> only used for their purposes.<br />
Free Prize Draw<br />
If you would like to be entered into a free prize draw for the chance of winning one of three prizes (1 x £100 voucher<br />
<strong>and</strong> 2 x £50 voucher of your choice) please enter your details below. These will only be used to contact the winners of<br />
the prize draw.<br />
Q25 Name<br />
Q26 Contact telephone number<br />
Thank you for completing this questionnaire. Please either return back to the researcher or by<br />
post by Friday 17 August in the freepost reply envelope supplied, to the Market Research Group<br />
at Bournemouth University.
Appendix 2 Economic spend by different visitor type<br />
For every one day visitor to <strong>Weymouth</strong> <strong>and</strong> Portl<strong>and</strong> a total spend of £15.62 per person was<br />
spent within the local area, £0.72 was spent outside of the <strong>Weymouth</strong> <strong>and</strong> Portl<strong>and</strong> area but<br />
within <strong>Dorset</strong> <strong>and</strong> £0.63 was spent outside of <strong>Dorset</strong>. The greatest amount of money was<br />
spent on food <strong>and</strong> drink within the area followed by fares <strong>and</strong> petrol.<br />
Mean spend per day visitor<br />
In <strong>Weymouth</strong> <strong>and</strong><br />
Portl<strong>and</strong><br />
Outside <strong>Weymouth</strong><br />
<strong>and</strong> Portl<strong>and</strong> but in<br />
<strong>Dorset</strong><br />
Outside <strong>Dorset</strong><br />
Food <strong>and</strong> drink £5.87 £0.25 £0.11<br />
Convenience goods £1.40 £0.04 £0.00<br />
Durable goods £1.40 £0.00 £0.00<br />
Entertainment <strong>and</strong><br />
£0.97 £0.00 £0.00<br />
leisure<br />
<strong><strong>Visit</strong>or</strong> attractions £1.13 £0.00 £0.00<br />
Fares <strong>and</strong> petrol £4.13 £0.42 £0.52<br />
Other £0.72 £0.01 £0.00<br />
Total average spend £15.62 £0.72 £0.63<br />
For every one staying visitor to <strong>Weymouth</strong> <strong>and</strong> Portl<strong>and</strong> a total spend of £32.38 per person<br />
was spent within the local area, £4.67 was spent outside of the <strong>Weymouth</strong> <strong>and</strong> Portl<strong>and</strong> area<br />
but within <strong>Dorset</strong> <strong>and</strong> £1.74 was spent outside of <strong>Dorset</strong>. The greatest amount of money was<br />
spent on food <strong>and</strong> drink within the area followed by fares <strong>and</strong> petrol.<br />
Mean spend per staying visitor<br />
In <strong>Weymouth</strong> <strong>and</strong><br />
Portl<strong>and</strong><br />
Outside <strong>Weymouth</strong><br />
<strong>and</strong> Portl<strong>and</strong> but in<br />
<strong>Dorset</strong><br />
Outside <strong>Dorset</strong><br />
Food <strong>and</strong> drink £13.61 £1.84 £0.61<br />
Convenience goods £2.89 £0.29 £0.02<br />
Durable goods £3.23 £0.61 £0.00<br />
Entertainment <strong>and</strong><br />
£1.52 £0.44 £0.10<br />
leisure<br />
<strong><strong>Visit</strong>or</strong> attractions £2.13 £0.30 £0.13<br />
Fares <strong>and</strong> petrol £7.73 £1.14 £0.80<br />
Other £1.27 £0.05 £0.08<br />
Total average spend £32.38 £4.67 £1.74
For every one staying visitor actually staying in <strong>Weymouth</strong> <strong>and</strong> Portl<strong>and</strong> a total spend of<br />
£36.76 per person was spent within the local area, £0.90 was spent outside of the<br />
<strong>Weymouth</strong> <strong>and</strong> Portl<strong>and</strong> area but within <strong>Dorset</strong> <strong>and</strong> £0.86 was spent outside of <strong>Dorset</strong>. The<br />
greatest amount of money was spent on food <strong>and</strong> drink within the area followed by fares <strong>and</strong><br />
petrol.<br />
Mean spend per staying in <strong>Weymouth</strong> <strong>and</strong> Portl<strong>and</strong> visitor<br />
In <strong>Weymouth</strong> <strong>and</strong> Outside <strong>Weymouth</strong> Outside <strong>Dorset</strong><br />
Portl<strong>and</strong> <strong>and</strong> Portl<strong>and</strong> but in<br />
<strong>Dorset</strong><br />
Food <strong>and</strong> drink £16.28 £0.29 £0.19<br />
Convenience goods £3.37 £0.08 £0.00<br />
Durable goods £3.39 £0.00 £0.00<br />
Entertainment <strong>and</strong><br />
leisure<br />
£1.71 £0.23 £0.00<br />
<strong><strong>Visit</strong>or</strong> attractions £2.35 £0.00 £0.10<br />
Fares <strong>and</strong> petrol £8.33 £0.30 £0.46<br />
Other £1.33 £0.00 £0.11<br />
Total average spend £36.76 £0.90 £0.86<br />
For every one staying visitor not staying in <strong>Weymouth</strong> <strong>and</strong> Portl<strong>and</strong> a total spend of £22.55<br />
per person was spent within the local area, £13.16 was spent outside of the <strong>Weymouth</strong> <strong>and</strong><br />
Portl<strong>and</strong> area but within <strong>Dorset</strong> <strong>and</strong> £3.78 was spent outside of <strong>Dorset</strong>. The greatest amount<br />
of money was spent on food <strong>and</strong> drink within the area followed by fares <strong>and</strong> petrol.<br />
Mean spend per staying elsewhere visitor<br />
In <strong>Weymouth</strong> <strong>and</strong> Outside <strong>Weymouth</strong> Outside <strong>Dorset</strong><br />
Portl<strong>and</strong> <strong>and</strong> Portl<strong>and</strong> but in<br />
<strong>Dorset</strong><br />
Food <strong>and</strong> drink £7.60 £5.32 £1.56<br />
Convenience goods £1.81 £0.76 £0.08<br />
Durable goods £2.88 £1.98 £0.00<br />
Entertainment <strong>and</strong><br />
£1.09 £0.90 £0.32<br />
leisure<br />
<strong><strong>Visit</strong>or</strong> attractions £1.63 £0.99 £0.20<br />
Fares <strong>and</strong> petrol £6.38 £3.04 £1.59<br />
Other £1.16 £0.17 £0.03<br />
Total average spend £22.55 £13.16 £3.78
For every one visitor whose main purpose was to visit <strong>Weymouth</strong> <strong>and</strong> Portl<strong>and</strong> because of<br />
the Olympic sailing events a total spend of £21.09 per person was spent within the local<br />
area, £2.02 was spent outside of the <strong>Weymouth</strong> <strong>and</strong> Portl<strong>and</strong> area but within <strong>Dorset</strong> <strong>and</strong><br />
£1.43 was spent outside of <strong>Dorset</strong>. The greatest amount of money was spent on food <strong>and</strong><br />
drink within the area followed by fares <strong>and</strong> petrol.<br />
Mean spend per visitor whose main or sole purpose was to visit <strong>Weymouth</strong> <strong>and</strong> Portl<strong>and</strong><br />
because of the sailing events<br />
In <strong>Weymouth</strong> <strong>and</strong> Outside <strong>Weymouth</strong> Outside <strong>Dorset</strong><br />
Portl<strong>and</strong> <strong>and</strong> Portl<strong>and</strong> but in<br />
<strong>Dorset</strong><br />
Food <strong>and</strong> drink £9.04 £0.71 £0.38<br />
Convenience goods £1.90 £0.12 £0.00<br />
Durable goods £1.63 £0.16 £0.00<br />
Entertainment <strong>and</strong><br />
£1.01 £0.21 £0.05<br />
leisure<br />
<strong><strong>Visit</strong>or</strong> attractions £1.45 £0.07 £0.02<br />
Fares <strong>and</strong> petrol £5.10 £0.73 £0.91<br />
Other £0.96 £0.02 £0.07<br />
Total average spend £21.09 £2.02 £1.43<br />
For every one visitor to <strong>Weymouth</strong> <strong>and</strong> Portl<strong>and</strong> whose main purpose was not to visit the<br />
Olympic sailing events a total spend of £26.55 per person was spent within the local area,<br />
£3.36 was spent outside of the <strong>Weymouth</strong> <strong>and</strong> Portl<strong>and</strong> area but within <strong>Dorset</strong> <strong>and</strong> £0.80<br />
was spent outside of <strong>Dorset</strong>. The greatest amount of money was spent on food <strong>and</strong> drink<br />
within the area followed by fares <strong>and</strong> petrol.<br />
Mean spend per visitor whose purpose of visiting <strong>Weymouth</strong> <strong>and</strong> Portl<strong>and</strong> was not because<br />
of the sailing events<br />
In <strong>Weymouth</strong> <strong>and</strong> Outside <strong>Weymouth</strong> Outside <strong>Dorset</strong><br />
Portl<strong>and</strong> <strong>and</strong> Portl<strong>and</strong> but in<br />
<strong>Dorset</strong><br />
Food <strong>and</strong> drink £10.12 £1.41 £0.30<br />
Convenience goods £2.36 £0.20 £0.03<br />
Durable goods £3.11 £0.46 £0.00<br />
Entertainment <strong>and</strong><br />
£1.57 £0.19 £0.04<br />
leisure<br />
<strong><strong>Visit</strong>or</strong> attractions £1.74 £0.24 £0.13<br />
Fares <strong>and</strong> petrol £6.64 £0.81 £0.30<br />
Other £1.01 £0.05 £0.00<br />
Total average spend £26.55 £3.36 £0.80
For every one visitor to <strong>Weymouth</strong> <strong>and</strong> Portl<strong>and</strong> who is likely to visit the area again a total<br />
spend of £23.61 per person was spent within the local area, £2.31 was spent outside of the<br />
<strong>Weymouth</strong> <strong>and</strong> Portl<strong>and</strong> area but within <strong>Dorset</strong> <strong>and</strong> £1.12 was spent outside of <strong>Dorset</strong>. The<br />
greatest amount of money was spent on food <strong>and</strong> drink within the area followed by fares <strong>and</strong><br />
petrol.<br />
Mean spend of visitor likely to visit the area again<br />
In <strong>Weymouth</strong> <strong>and</strong><br />
Portl<strong>and</strong><br />
Outside <strong>Weymouth</strong><br />
<strong>and</strong> Portl<strong>and</strong> but in<br />
<strong>Dorset</strong><br />
Outside <strong>Dorset</strong><br />
Food <strong>and</strong> drink £9.54 £0.87 £0.33<br />
Convenience goods £2.12 £0.14 £0.01<br />
Durable goods £2.25 £0.29 £0.00<br />
Entertainment <strong>and</strong> leisure £1.26 £0.21 £0.05<br />
<strong><strong>Visit</strong>or</strong> attractions £1.61 £0.06 £0.06<br />
Fares <strong>and</strong> petrol £5.88 £0.71 £0.67<br />
Other £0.95 £0.03 £0.00<br />
Total average spend £23.61 £2.31 £1.12<br />
For every one visitor to <strong>Weymouth</strong> <strong>and</strong> Portl<strong>and</strong> who is unlikely to visit the area again a total<br />
spend of £19.65 per person was spent within the local area, £8.61 was spent outside of the<br />
<strong>Weymouth</strong> <strong>and</strong> Portl<strong>and</strong> area but within <strong>Dorset</strong> <strong>and</strong> £1.97 was spent outside of <strong>Dorset</strong>. The<br />
greatest amount of money was spent on food <strong>and</strong> drink within the area followed by fares <strong>and</strong><br />
petrol.<br />
Mean spend per visitor who are unlikely to visit the area again.<br />
In <strong>Weymouth</strong> <strong>and</strong> Outside <strong>Weymouth</strong> Outside <strong>Dorset</strong><br />
Portl<strong>and</strong> <strong>and</strong> Portl<strong>and</strong> but in<br />
<strong>Dorset</strong><br />
Food <strong>and</strong> drink £8.49 £3.75 £0.72<br />
Convenience goods £1.59 £0.48 £0.00<br />
Durable goods £1.92 £0.18 £0.01<br />
Entertainment <strong>and</strong><br />
£0.81 £0.12 £0.00<br />
leisure<br />
<strong><strong>Visit</strong>or</strong> attractions £1.14 £2.02 £0.00<br />
Fares <strong>and</strong> petrol £4.03 £1.93 £0.42<br />
Other £1.67 £0.13 £0.82<br />
Total average spend £19.65 £8.61 £1.97
For every one visitor to <strong>Weymouth</strong> <strong>and</strong> Portl<strong>and</strong> who is aged between 18 – 24 a total spend<br />
of £17.23 per person was spent within the local area, £2.72 was spent outside of the<br />
<strong>Weymouth</strong> <strong>and</strong> Portl<strong>and</strong> area but within <strong>Dorset</strong> <strong>and</strong> £1.47 was spent outside of <strong>Dorset</strong>. The<br />
greatest amount of money was spent on food <strong>and</strong> drink within the area followed by fares <strong>and</strong><br />
petrol.<br />
Mean spend per visitor aged 18 - 24<br />
In <strong>Weymouth</strong> <strong>and</strong> Outside <strong>Weymouth</strong> Outside <strong>Dorset</strong><br />
Portl<strong>and</strong> <strong>and</strong> Portl<strong>and</strong> but in<br />
<strong>Dorset</strong><br />
Food <strong>and</strong> drink £4.94 £1.08 £0.57<br />
Convenience goods £0.92 £0.16 £0.00<br />
Durable goods £2.91 £1.08 £0.01<br />
Entertainment <strong>and</strong><br />
£1.26 £0.05 £0.00<br />
leisure<br />
<strong><strong>Visit</strong>or</strong> attractions £1.53 £0.00 £0.00<br />
Fares <strong>and</strong> petrol £5.05 £0.19 £0.89<br />
Other £0.62 £0.16 £0.00<br />
Total average spend £17.23 £2.72 £1.47<br />
For every one visitor to <strong>Weymouth</strong> <strong>and</strong> Portl<strong>and</strong> who is aged between 25 – 34 a total spend<br />
of £35.61 per person was spent within the local area, £0.88 was spent outside of the<br />
<strong>Weymouth</strong> <strong>and</strong> Portl<strong>and</strong> area but within <strong>Dorset</strong> <strong>and</strong> £0.87 was spent outside of <strong>Dorset</strong>. The<br />
greatest amount of money was spent on food <strong>and</strong> drink within the area followed by fares <strong>and</strong><br />
petrol.<br />
Mean spend per visitor aged 25 - 34<br />
In <strong>Weymouth</strong> <strong>and</strong> Outside <strong>Weymouth</strong> Outside <strong>Dorset</strong><br />
Portl<strong>and</strong> <strong>and</strong> Portl<strong>and</strong> but in<br />
<strong>Dorset</strong><br />
Food <strong>and</strong> drink £16.11 £0.51 £0.34<br />
Convenience goods £3.94 £0.05 £0.01<br />
Durable goods £2.72 £0.00 £0.00<br />
Entertainment <strong>and</strong><br />
£1.30 £0.00 £0.00<br />
leisure<br />
<strong><strong>Visit</strong>or</strong> attractions £1.87 £0.00 £0.00<br />
Fares <strong>and</strong> petrol £8.34 £0.30 £0.52<br />
Other £1.33 £0.02 £0.00<br />
Total average spend £35.61 £0.88 £0.87
For every one visitor to <strong>Weymouth</strong> <strong>and</strong> Portl<strong>and</strong> who is aged between 35 – 44 a total spend<br />
of £18.70 per person was spent within the local area, £2.60 was spent outside of the<br />
<strong>Weymouth</strong> <strong>and</strong> Portl<strong>and</strong> area but within <strong>Dorset</strong> <strong>and</strong> £0.87 was spent outside of <strong>Dorset</strong>. The<br />
greatest amount of money was spent on food <strong>and</strong> drink within the area followed by fares <strong>and</strong><br />
petrol.<br />
Mean spend per visitor aged 35 - 44<br />
In <strong>Weymouth</strong> <strong>and</strong> Outside <strong>Weymouth</strong> Outside <strong>Dorset</strong><br />
Portl<strong>and</strong> <strong>and</strong> Portl<strong>and</strong> but in<br />
<strong>Dorset</strong><br />
Food <strong>and</strong> drink £6.22 £1.26 £0.27<br />
Convenience goods £1.83 £0.22 £0.00<br />
Durable goods £2.36 £0.03 £0.00<br />
Entertainment <strong>and</strong><br />
£0.91 £0.07 £0.00<br />
leisure<br />
<strong><strong>Visit</strong>or</strong> attractions £1.13 £0.38 £0.00<br />
Fares <strong>and</strong> petrol £5.24 £0.60 £0.45<br />
Other £1.01 £0.04 £0.15<br />
Total average spend £18.70 £2.60 £0.87<br />
For every one visitor to <strong>Weymouth</strong> <strong>and</strong> Portl<strong>and</strong> who is aged between 45 – 54 a total spend<br />
of £26.08 per person was spent within the local area, £2.52 was spent outside of the<br />
<strong>Weymouth</strong> <strong>and</strong> Portl<strong>and</strong> area but within <strong>Dorset</strong> <strong>and</strong> £2.35 was spent outside of <strong>Dorset</strong>. The<br />
greatest amount of money was spent on food <strong>and</strong> drink within the area followed by fares <strong>and</strong><br />
petrol.<br />
Mean spend per visitor aged 45 - 54<br />
In <strong>Weymouth</strong> <strong>and</strong> Outside <strong>Weymouth</strong> Outside <strong>Dorset</strong><br />
Portl<strong>and</strong> <strong>and</strong> Portl<strong>and</strong> but in<br />
<strong>Dorset</strong><br />
Food <strong>and</strong> drink £10.19 £1.14 £0.57<br />
Convenience goods £2.31 £0.08 £0.06<br />
Durable goods £3.02 £0.18 £0.00<br />
Entertainment <strong>and</strong><br />
£0.87 £0.25 £0.24<br />
leisure<br />
<strong><strong>Visit</strong>or</strong> attractions £2.15 £0.09 £0.22<br />
Fares <strong>and</strong> petrol £6.23 £0.74 £1.24<br />
Other £1.31 £0.04 £0.02<br />
Total average spend £26.08 £2.52 £2.35
For every one visitor to <strong>Weymouth</strong> <strong>and</strong> Portl<strong>and</strong> who is aged between 55 – 64 a total spend<br />
of £26.81 per person was spent within the local area, £3.58 was spent outside of the<br />
<strong>Weymouth</strong> <strong>and</strong> Portl<strong>and</strong> area but within <strong>Dorset</strong> <strong>and</strong> £1.06 was spent outside of <strong>Dorset</strong>. The<br />
greatest amount of money was spent on food <strong>and</strong> drink within the area followed by fares <strong>and</strong><br />
petrol.<br />
Mean spend per visitor aged 55 - 64<br />
In <strong>Weymouth</strong> <strong>and</strong> Outside <strong>Weymouth</strong> Outside <strong>Dorset</strong><br />
Portl<strong>and</strong> <strong>and</strong> Portl<strong>and</strong> but in<br />
<strong>Dorset</strong><br />
Food <strong>and</strong> drink £13.06 £0.82 £0.00<br />
Convenience goods £2.00 £0.28 £0.00<br />
Durable goods £2.16 £0.47 £0.00<br />
Entertainment <strong>and</strong><br />
£1.38 £0.47 £0.00<br />
leisure<br />
<strong><strong>Visit</strong>or</strong> attractions £1.72 £0.24 £0.00<br />
Fares <strong>and</strong> petrol £5.91 £1.30 £1.06<br />
Other £0.58 £0.00 £0.00<br />
Total average spend £26.81 £3.58 £1.06<br />
For every one visitor to <strong>Weymouth</strong> <strong>and</strong> Portl<strong>and</strong> who is aged between 65 – 74 a total spend<br />
of £19.61 per person was spent within the local area, £0.97 was spent outside of the<br />
<strong>Weymouth</strong> <strong>and</strong> Portl<strong>and</strong> area but within <strong>Dorset</strong> <strong>and</strong> £1.15 was spent outside of <strong>Dorset</strong>. The<br />
greatest amount of money was spent on food <strong>and</strong> drink within the area followed by fares <strong>and</strong><br />
petrol.<br />
Mean spend per visitor aged 65 - 74<br />
In <strong>Weymouth</strong> <strong>and</strong> Outside <strong>Weymouth</strong> Outside <strong>Dorset</strong><br />
Portl<strong>and</strong> <strong>and</strong> Portl<strong>and</strong> but in<br />
<strong>Dorset</strong><br />
Food <strong>and</strong> drink £8.45 £0.54 £0.75<br />
Convenience goods £1.40 £0.00 £0.00<br />
Durable goods £1.47 £0.00 £0.00<br />
Entertainment <strong>and</strong><br />
£0.98 £0.00 £0.00<br />
leisure<br />
<strong><strong>Visit</strong>or</strong> attractions £1.60 £0.00 £0.13<br />
Fares <strong>and</strong> petrol £5.00 £0.43 £0.27<br />
Other £0.71 £0.00 £0.00<br />
Total average spend £19.61 £0.97 £1.15
For every one visitor to <strong>Weymouth</strong> <strong>and</strong> Portl<strong>and</strong> who is aged over 75 a total spend of £18.01<br />
per person was spent within the local area, £0.28 was spent outside of the <strong>Weymouth</strong> <strong>and</strong><br />
Portl<strong>and</strong> area but within <strong>Dorset</strong> <strong>and</strong> £0.00 was spent outside of <strong>Dorset</strong>. The greatest amount<br />
of money was spent on food <strong>and</strong> drink within the area followed by fares <strong>and</strong> petrol.<br />
Mean spend per visitor aged 75 +<br />
In <strong>Weymouth</strong> <strong>and</strong><br />
Portl<strong>and</strong><br />
Outside <strong>Weymouth</strong><br />
<strong>and</strong> Portl<strong>and</strong> but in<br />
<strong>Dorset</strong><br />
Outside <strong>Dorset</strong><br />
Food <strong>and</strong> drink £6.70 £0.00 £0.00<br />
Convenience goods £2.70 £0.00 £0.00<br />
Durable goods £0.94 £0.00 £0.00<br />
Entertainment <strong>and</strong><br />
£0.86 £0.00 £0.00<br />
leisure<br />
<strong><strong>Visit</strong>or</strong> attractions £0.60 £0.00 £0.00<br />
Fares <strong>and</strong> petrol £5.37 £0.23 £0.00<br />
Other £0.84 £0.05 £0.00<br />
Total average spend £18.01 £0.28 £0.00<br />
For every one visitor to <strong>Weymouth</strong> <strong>and</strong> Portl<strong>and</strong> visiting with children a total spend of £18.04<br />
per person was spent within the local area, £3.12 was spent outside of the <strong>Weymouth</strong> <strong>and</strong><br />
Portl<strong>and</strong> area but within <strong>Dorset</strong> <strong>and</strong> £0.68 was spent outside of <strong>Dorset</strong>. The greatest amount<br />
of money was spent on food <strong>and</strong> drink within the area followed by fares <strong>and</strong> petrol.<br />
Mean spend per visitor visiting with children<br />
In <strong>Weymouth</strong> <strong>and</strong> Outside <strong>Weymouth</strong> Outside <strong>Dorset</strong><br />
Portl<strong>and</strong> <strong>and</strong> Portl<strong>and</strong> but in<br />
<strong>Dorset</strong><br />
Food <strong>and</strong> drink £6.43 £1.11 £0.06<br />
Convenience goods £1.91 £0.21 £0.00<br />
Durable goods £1.89 £0.24 £0.00<br />
Entertainment <strong>and</strong><br />
£0.79 £0.25 £0.00<br />
leisure<br />
<strong><strong>Visit</strong>or</strong> attractions £1.50 £0.33 £0.08<br />
Fares <strong>and</strong> petrol £4.33 £0.94 £0.46<br />
Other £1.19 £0.04 £0.08<br />
Total average spend £18.04 £3.12 £0.68
For every one visitor to <strong>Weymouth</strong> <strong>and</strong> Portl<strong>and</strong> visiting with children a total spend of £28.84<br />
per person was spent within the local area, £2.29 was spent outside of the <strong>Weymouth</strong> <strong>and</strong><br />
Portl<strong>and</strong> area but within <strong>Dorset</strong> <strong>and</strong> £1.68 was spent outside of <strong>Dorset</strong>. The greatest amount<br />
of money was spent on food <strong>and</strong> drink within the area followed by fares <strong>and</strong> petrol.<br />
Mean spend per visitor visiting without children<br />
In <strong>Weymouth</strong> <strong>and</strong> Outside <strong>Weymouth</strong> Outside <strong>Dorset</strong><br />
Portl<strong>and</strong> <strong>and</strong> Portl<strong>and</strong> but in<br />
<strong>Dorset</strong><br />
Food <strong>and</strong> drink £12.62 £1.03 £0.64<br />
Convenience goods £2.32 £0.11 £0.02<br />
Durable goods £2.63 £0.37 £0.00<br />
Entertainment <strong>and</strong><br />
£1.26 £0.07 £0.09<br />
leisure<br />
<strong><strong>Visit</strong>or</strong> attractions £1.80 £0.01 £0.06<br />
Fares <strong>and</strong> petrol £7.43 £0.67 £0.86<br />
Other £0.78 £0.03 £0.01<br />
Total average spend £28.84 £2.29 £1.68
Appendix 3: <strong><strong>Visit</strong>or</strong> profile<br />
The information below relates to first time visitors to <strong>Weymouth</strong> <strong>and</strong> Portl<strong>and</strong> whose ‘main’ or ‘sole’<br />
reason for visiting was the Olympic sailing events. The graphs below compare these visitors,<br />
labelled as ‘first time sole/main visitor’ with any visitor that does not fit into this description,<br />
labelled ‘other visitor’.<br />
Total base ‘first time sole/main visitor’: 72<br />
Total base ‘other visitor’: 620<br />
Gender<br />
80%<br />
70%<br />
60%<br />
50%<br />
40%<br />
30%<br />
20%<br />
10%<br />
0%<br />
72%<br />
60%<br />
40%<br />
28%<br />
First time sole/main (68) Other visitor (587)<br />
Female<br />
Male<br />
28% of first time sole/main visitors were male <strong>and</strong> 72% female. In<br />
comparison, 40% of other visitors were male, <strong>and</strong> 60% female.<br />
Age group<br />
The age of the first time<br />
sole/main visitor profile<br />
is slightly younger than<br />
the age of ‘other<br />
visitors’ profile.<br />
Significantly more ‘other<br />
visitors’ are aged over<br />
65.<br />
30%<br />
25%<br />
20%<br />
15%<br />
10%<br />
5%<br />
0%<br />
13%<br />
9%<br />
8%<br />
5%<br />
28%<br />
26%<br />
First time sole/main (65)<br />
24%<br />
22%<br />
Other visitor (557)<br />
19%<br />
17% 17% 8%<br />
5%<br />
0%<br />
18 ‐ 24 25 ‐ 34 35 ‐ 44 45 ‐ 54 55 ‐ 64 65 ‐ 74 75 +
Economic class<br />
1%<br />
Other visitor (504)<br />
E<br />
5%<br />
First time sole/main (61)<br />
D<br />
21%<br />
15%<br />
C2<br />
27%<br />
8%<br />
C1<br />
29%<br />
33%<br />
B<br />
19%<br />
36%<br />
A 3%<br />
3%<br />
0% 5% 10% 15% 20% 25% 30% 35% 40%<br />
The economic class of<br />
the first time sole/main<br />
visitor profile is higher<br />
than that of ‘other<br />
visitors’.<br />
Significantly more first<br />
time sole/main visitors<br />
are in economic class B,<br />
while significantly more<br />
‘other visitors’ are in<br />
class C2.<br />
Type of trip<br />
70%<br />
60%<br />
67%<br />
59%<br />
50%<br />
40%<br />
33%<br />
41%<br />
Day trip from home<br />
Staying visitor<br />
30%<br />
20%<br />
10%<br />
0%<br />
First time sole/main (72) Other visitor (600)<br />
Staying location<br />
Other 7%<br />
North <strong>Dorset</strong> 0%<br />
2%<br />
West <strong>Dorset</strong> 9%<br />
12%<br />
Purbeck 6%<br />
12%<br />
Bournemouth 1%<br />
4%<br />
Poole 3%<br />
2%<br />
Portl<strong>and</strong> 5%<br />
2%<br />
<strong>Weymouth</strong><br />
21%<br />
Other visitor (267)<br />
First time sole/main (48)<br />
71%<br />
44%<br />
Significantly more first<br />
time sole/main visitors<br />
are staying, as opposed<br />
to on a day trip from<br />
home.<br />
Of those that are<br />
staying, significantly<br />
more ‘other visitors’ are<br />
staying in <strong>Weymouth</strong>,<br />
while significantly more<br />
first time sole/main<br />
visitors are staying in<br />
other locations.<br />
0% 10% 20% 30% 40% 50% 60% 70% 80%
Home of first time sole/main visitors<br />
12%<br />
11%<br />
10%<br />
9% 9%<br />
8%<br />
7% 7%<br />
6%<br />
5% 5% 5% 5%<br />
4%<br />
2%<br />
0%<br />
Hampshire Devon Berkshire <strong>Dorset</strong> Wiltshire Somerset London Wales Cornwall<br />
The top 5 counties where first time sole/main visitors live are Hampshire, Devon, Berkshire, <strong>Dorset</strong>,<br />
<strong>and</strong> Wiltshire. Due to the small sample size, it is hard to make sound observations relating to this.
The Market Research Group<br />
Fern Barrow<br />
Talbot Campus<br />
Poole<br />
<strong>Dorset</strong><br />
BH12 5BB<br />
UK<br />
t +44 (0)1202 61372<br />
e mrg@bournemouth.ac.uk<br />
2