USBTracer/Trainer User's Manual - Teledyne LeCroy
USBTracer/Trainer User's Manual - Teledyne LeCroy
USBTracer/Trainer User's Manual - Teledyne LeCroy

Create successful ePaper yourself
Turn your PDF publications into a flip-book with our unique Google optimized e-Paper software.
<strong>LeCroy</strong> Corporation<br />
3385 Scott Blvd., Santa Clara, CA 95054 Tel:+1/408.727.6600 Fax+1/408.727.6622<br />
<strong>LeCroy</strong> <strong>USBTracer</strong>/<strong>Trainer</strong> <br />
USB 2.0 Design & Verification System<br />
User <strong>Manual</strong><br />
<strong>Manual</strong> Version 2.20<br />
For Software Version 2.20<br />
3 March 2006
<strong>LeCroy</strong> <strong>USBTracer</strong>/<strong>Trainer</strong> User <strong>Manual</strong><br />
SW Version 2.20<br />
Document Disclaimer<br />
The information in this document has been carefully checked and is believed to be reliable.<br />
However, no responsibility can be assumed for inaccuracies that may not have been<br />
detected. <strong>LeCroy</strong> reserves the right to revise the information in this document without<br />
notice or penalty.<br />
Changes or Modifications<br />
Any change or modification not expressly approved by <strong>LeCroy</strong> voids the user’s authority<br />
to operate this equipment.<br />
Trademarks and Servicemarks<br />
CATC, Advisor, <strong>USBTracer</strong>, USB<strong>Trainer</strong>, USBMobile, USBMobileHS, and BusEngine are<br />
trademarks of <strong>LeCroy</strong>.<br />
Microsoft, Windows 98SE, Windows Me, Windows 2000, Windows XP, and Windows NT<br />
are registered trademarks of Microsoft Inc.<br />
All other trademarks are property of their respective companies.<br />
Copyright<br />
Copyright © 2006, <strong>LeCroy</strong>; All Rights Reserved. This document may be printed and<br />
reproduced without additional permission, but all copies should contain this copyright<br />
notice.<br />
FCC Conformance Statement<br />
This equipment has been tested and found to comply with the limits for a Class A digital<br />
device, pursuant to Part 15 of the FCC Rules. These limits are designed to provide<br />
reasonable protection against harmful interference when the equipment is operated in a<br />
commercial environment. This equipment generates, uses, and can radiate radio frequency<br />
energy and, if not installed and used in accordance with the instruction manual, may cause<br />
harmful interference to radio communications. Operation of this equipment in a residential<br />
area is likely to cause harmful interference in which case the user is required to correct the<br />
interference at his own expense. The end user of this product should be aware that any<br />
changes or modifications made to this equipment without the approval of <strong>LeCroy</strong> could<br />
result in the product not meeting the Class A limits, in which case the FCC could void the<br />
user's authority to operate the equipment.<br />
EU Conformance Statement<br />
This equipment complies with the EMC Directive 89/336/EEC and the Low Voltage<br />
Directive 73/23/EEC, and their associated amendments for Class A Information<br />
Technology Equipment. It has been tested and found to comply with EN55022:1998 Class<br />
A (EN61000-3-2:1998, EN61000-3-3:1995) and EN55024:1998 (EN61000-4-2:1998,<br />
EN61000-4-3:1996, EN61000-4-4:1996, EN61000-4-5:1996, EN61000-4-6:1997,<br />
EN61000-4-11:1998), and EN60950:1999. In a domestic environment this product may<br />
cause radio interference in which case the user may be required to take adequate measures.<br />
Part number: 730-0020-00<br />
ii
<strong>LeCroy</strong> <strong>USBTracer</strong>/<strong>Trainer</strong> User <strong>Manual</strong><br />
SW Version 2.20<br />
TABLE OF CONTENTS<br />
Chapter 1 Overview. . . . . . . . . . . . . . . . . . . . . . . . . . . . . . . . . . . . . 1<br />
General Description . . . . . . . . . . . . . . . . . . . . . . . . . . . . . . . . . 1<br />
Features. . . . . . . . . . . . . . . . . . . . . . . . . . . . . . . . . . . . . . . . . . . 3<br />
Traffic Generation. . . . . . . . . . . . . . . . . . . . . . . . . . . . . . . . 5<br />
Hi-Speed Slow Clock . . . . . . . . . . . . . . . . . . . . . . . . . . . . . 5<br />
Graphical Bus Traffic Display . . . . . . . . . . . . . . . . . . . . . . . . . 5<br />
Accurate Time Management. . . . . . . . . . . . . . . . . . . . . . . . . . . 6<br />
Comprehensive Error Detection and Analysis . . . . . . . . . . . . . 7<br />
Real-Time Event Triggering and Capture Filtering . . . . . . . . . 7<br />
Advanced Event Counting & Sequencing . . . . . . . . . . . . . . . . 8<br />
BusEngine Technology . . . . . . . . . . . . . . . . . . . . . . . . . . . . . . . 8<br />
Specifications . . . . . . . . . . . . . . . . . . . . . . . . . . . . . . . . . . . . . . 9<br />
Package . . . . . . . . . . . . . . . . . . . . . . . . . . . . . . . . . . . . . . . 9<br />
Connectors . . . . . . . . . . . . . . . . . . . . . . . . . . . . . . . . . . . . . 9<br />
Weight . . . . . . . . . . . . . . . . . . . . . . . . . . . . . . . . . . . . . . . . 9<br />
Power Requirements . . . . . . . . . . . . . . . . . . . . . . . . . . . . . . 9<br />
Environmental Conditions . . . . . . . . . . . . . . . . . . . . . . . . . 9<br />
Probing Characteristics . . . . . . . . . . . . . . . . . . . . . . . . . . . 9<br />
Switches . . . . . . . . . . . . . . . . . . . . . . . . . . . . . . . . . . . . . . . 9<br />
Indicators (LEDs) . . . . . . . . . . . . . . . . . . . . . . . . . . . . . . . 10<br />
UPAS . . . . . . . . . . . . . . . . . . . . . . . . . . . . . . . . . . . . . . . . 10<br />
Recording Memory Size . . . . . . . . . . . . . . . . . . . . . . . . . . 10<br />
Chapter 2 Quick Installation . . . . . . . . . . . . . . . . . . . . . . . . . . . . 13<br />
Installing the Software and Starting the Program. . . . . . . . . . 14<br />
Your First USB Recording . . . . . . . . . . . . . . . . . . . . . . . . . . . 14<br />
Capturing Your First Trace . . . . . . . . . . . . . . . . . . . . . . . . 16<br />
Trace View Features . . . . . . . . . . . . . . . . . . . . . . . . . . . . . 17<br />
Chapter 3 Detailed Installation . . . . . . . . . . . . . . . . . . . . . . . . . . 19<br />
System Components/Packing List . . . . . . . . . . . . . . . . . . . . . 19<br />
The Installed <strong>USBTracer</strong> Unit . . . . . . . . . . . . . . . . . . . . . . . . 19<br />
LED and Button Descriptions. . . . . . . . . . . . . . . . . . . . . . 19<br />
<strong>USBTracer</strong> System Setup . . . . . . . . . . . . . . . . . . . . . . . . . . . . 21<br />
AC Power Source . . . . . . . . . . . . . . . . . . . . . . . . . . . . . . . . . . 21<br />
External Interface Breakout Board . . . . . . . . . . . . . . . . . . . . . 22<br />
Pin-Outs for the Data In/Out Connector . . . . . . . . . . . . . . 23<br />
Prototype Rework Area . . . . . . . . . . . . . . . . . . . . . . . . . . 23<br />
PC Connection . . . . . . . . . . . . . . . . . . . . . . . . . . . . . . . . . . . . 24<br />
Analyzer PC Requirements. . . . . . . . . . . . . . . . . . . . . . . . . . . 24<br />
Setting Up the Analyzer . . . . . . . . . . . . . . . . . . . . . . . . . . . . . 24<br />
Installing the Analyzer Software on the PC . . . . . . . . . . . . . . 25<br />
iii
<strong>LeCroy</strong> <strong>USBTracer</strong>/<strong>Trainer</strong> User <strong>Manual</strong><br />
SW Version 2.20<br />
<strong>USBTracer</strong> Program Startup . . . . . . . . . . . . . . . . . . . . . . . . . . 26<br />
Making a Recording . . . . . . . . . . . . . . . . . . . . . . . . . . . . . . . . 26<br />
Chapter 4 Updates . . . . . . . . . . . . . . . . . . . . . . . . . . . . . . . . . . . . . 27<br />
Software, Firmware, and BusEngine Revisions . . . . . . . . . . . 27<br />
Software Updates . . . . . . . . . . . . . . . . . . . . . . . . . . . . . . . . . . 28<br />
BusEngine and Firmware Updates . . . . . . . . . . . . . . . . . . . . . 28<br />
Updating the BusEngine . . . . . . . . . . . . . . . . . . . . . . . . . . 28<br />
Updating the Firmware . . . . . . . . . . . . . . . . . . . . . . . . . . . 29<br />
Automatic Updates . . . . . . . . . . . . . . . . . . . . . . . . . . . . . . 29<br />
<strong>Manual</strong> Updates to BusEngine and Firmware . . . . . . . . . 31<br />
<strong>Manual</strong>ly Updating the Firmware. . . . . . . . . . . . . . . . . . . 33<br />
Resetting the Analyzer . . . . . . . . . . . . . . . . . . . . . . . . . . . . . . 33<br />
Chapter 5 Software Overview . . . . . . . . . . . . . . . . . . . . . . . . . . . 35<br />
Starting the <strong>USBTracer</strong> Program . . . . . . . . . . . . . . . . . . . . . . 35<br />
Tooltips . . . . . . . . . . . . . . . . . . . . . . . . . . . . . . . . . . . . . . . . . . 35<br />
The Main Display Windows . . . . . . . . . . . . . . . . . . . . . . . . . . 36<br />
View Options . . . . . . . . . . . . . . . . . . . . . . . . . . . . . . . . . . . . . 39<br />
Resetting the Toolbar . . . . . . . . . . . . . . . . . . . . . . . . . . . . 39<br />
Tool Bar . . . . . . . . . . . . . . . . . . . . . . . . . . . . . . . . . . . . . . 40<br />
Status Bar . . . . . . . . . . . . . . . . . . . . . . . . . . . . . . . . . . . . . . . . 41<br />
Recording Progress . . . . . . . . . . . . . . . . . . . . . . . . . . . . . . 42<br />
Recording Status . . . . . . . . . . . . . . . . . . . . . . . . . . . . . . . . 43<br />
Recording Activity . . . . . . . . . . . . . . . . . . . . . . . . . . . . . . 44<br />
Search Status. . . . . . . . . . . . . . . . . . . . . . . . . . . . . . . . . . . 45<br />
Navigation Tools. . . . . . . . . . . . . . . . . . . . . . . . . . . . . . . . . . . 45<br />
Zoom In. . . . . . . . . . . . . . . . . . . . . . . . . . . . . . . . . . . . . . . 45<br />
Zoom Out . . . . . . . . . . . . . . . . . . . . . . . . . . . . . . . . . . . . . 45<br />
Wrap . . . . . . . . . . . . . . . . . . . . . . . . . . . . . . . . . . . . . . . . . 45<br />
<strong>USBTracer</strong> Analyzer Keyboard Shortcuts . . . . . . . . . . . . . . . 46<br />
Chapter 6 Recording Options. . . . . . . . . . . . . . . . . . . . . . . . . . . . 49<br />
General Recording Options . . . . . . . . . . . . . . . . . . . . . . . . . . 50<br />
Recording Type. . . . . . . . . . . . . . . . . . . . . . . . . . . . . . . . . 50<br />
Options . . . . . . . . . . . . . . . . . . . . . . . . . . . . . . . . . . . . . . . 51<br />
Buffer Size . . . . . . . . . . . . . . . . . . . . . . . . . . . . . . . . . . . . 51<br />
Trigger Position . . . . . . . . . . . . . . . . . . . . . . . . . . . . . . . . 52<br />
Options Name . . . . . . . . . . . . . . . . . . . . . . . . . . . . . . . . . . 52<br />
Trace File Name & Path . . . . . . . . . . . . . . . . . . . . . . . . . . 53<br />
iv
<strong>LeCroy</strong> <strong>USBTracer</strong>/<strong>Trainer</strong> User <strong>Manual</strong><br />
SW Version 2.20<br />
Recording Options - Misc. . . . . . . . . . . . . . . . . . . . . . . . . . . . 54<br />
Analyzer Speed . . . . . . . . . . . . . . . . . . . . . . . . . . . . . . . . . 55<br />
Generator/Analyzer Clocking Overrides . . . . . . . . . . . . . 56<br />
USB On-The-Go . . . . . . . . . . . . . . . . . . . . . . . . . . . . . . . . 56<br />
USB<strong>Trainer</strong> Generator-related Parameters . . . . . . . . . . . . 56<br />
Slow Clock Selection . . . . . . . . . . . . . . . . . . . . . . . . . . . . . . . 58<br />
Events Recording Options . . . . . . . . . . . . . . . . . . . . . . . . . . . 59<br />
Packet Identifiers . . . . . . . . . . . . . . . . . . . . . . . . . . . . . . . 60<br />
Token Patterns. . . . . . . . . . . . . . . . . . . . . . . . . . . . . . . . . . 60<br />
Frame Patterns . . . . . . . . . . . . . . . . . . . . . . . . . . . . . . . . . 61<br />
Device Requests . . . . . . . . . . . . . . . . . . . . . . . . . . . . . . . . 61<br />
Data Pattern. . . . . . . . . . . . . . . . . . . . . . . . . . . . . . . . . . . . 62<br />
Bus Conditions . . . . . . . . . . . . . . . . . . . . . . . . . . . . . . . . . 64<br />
Errors . . . . . . . . . . . . . . . . . . . . . . . . . . . . . . . . . . . . . . . . 64<br />
External Input Signals. . . . . . . . . . . . . . . . . . . . . . . . . . . . 66<br />
Transactions . . . . . . . . . . . . . . . . . . . . . . . . . . . . . . . . . . . 66<br />
Data Length. . . . . . . . . . . . . . . . . . . . . . . . . . . . . . . . . . . . 67<br />
Splits . . . . . . . . . . . . . . . . . . . . . . . . . . . . . . . . . . . . . . . . . 68<br />
Extern Data7 - Data0 In . . . . . . . . . . . . . . . . . . . . . . . . . . 68<br />
Actions Recording Options. . . . . . . . . . . . . . . . . . . . . . . . . . . 69<br />
Actions Window Layout . . . . . . . . . . . . . . . . . . . . . . . . . . 69<br />
Connecting Events to Actions. . . . . . . . . . . . . . . . . . . . . . . . . 70<br />
Connecting Counters to Events. . . . . . . . . . . . . . . . . . . . . . . . 70<br />
Using Action Buttons . . . . . . . . . . . . . . . . . . . . . . . . . . . . . . . 73<br />
Trigger. . . . . . . . . . . . . . . . . . . . . . . . . . . . . . . . . . . . . . . . 73<br />
Restart . . . . . . . . . . . . . . . . . . . . . . . . . . . . . . . . . . . . . . . . 73<br />
Filter Out/In . . . . . . . . . . . . . . . . . . . . . . . . . . . . . . . . . . . 73<br />
Other Actions: External Output Signals . . . . . . . . . . . . . . . . . 74<br />
Saving Recording Options . . . . . . . . . . . . . . . . . . . . . . . . . . . 76<br />
Recording Bus Data . . . . . . . . . . . . . . . . . . . . . . . . . . . . . . . . 76<br />
Merging Trace Files . . . . . . . . . . . . . . . . . . . . . . . . . . . . . . . . 77<br />
Chapter 7 Display Options . . . . . . . . . . . . . . . . . . . . . . . . . . . . . . 81<br />
General Display Options. . . . . . . . . . . . . . . . . . . . . . . . . . . . . 82<br />
Color/Format/Hiding Display Options . . . . . . . . . . . . . . . . . . 84<br />
Color Display Options . . . . . . . . . . . . . . . . . . . . . . . . . . . 84<br />
Formats Display Options . . . . . . . . . . . . . . . . . . . . . . . . . 86<br />
Hiding Display Options . . . . . . . . . . . . . . . . . . . . . . . . . . 87<br />
Level Hiding Display Options . . . . . . . . . . . . . . . . . . . . . . . . 88<br />
Saving Display Options . . . . . . . . . . . . . . . . . . . . . . . . . . . . . 89<br />
v
<strong>LeCroy</strong> <strong>USBTracer</strong>/<strong>Trainer</strong> User <strong>Manual</strong><br />
SW Version 2.20<br />
Chapter 8 Reading a Trace . . . . . . . . . . . . . . . . . . . . . . . . . . . . . . 91<br />
Trace View Features . . . . . . . . . . . . . . . . . . . . . . . . . . . . . . . . 91<br />
Set Marker. . . . . . . . . . . . . . . . . . . . . . . . . . . . . . . . . . . . . . . . 92<br />
Edit or Clear Marker . . . . . . . . . . . . . . . . . . . . . . . . . . . . . . . . 93<br />
View Raw Bits . . . . . . . . . . . . . . . . . . . . . . . . . . . . . . . . . . . . 93<br />
Expanding and Collapsing Data Fields. . . . . . . . . . . . . . . . . . 94<br />
Using the Expand/Collapse Data Field Arrows . . . . . . . . 94<br />
Double-Clicking to Expand/Collapse Data Fields . . . . . . 94<br />
Expanding or Collapsing All Data Fields . . . . . . . . . . . . . 95<br />
Using the Data Field Pop-up Menus. . . . . . . . . . . . . . . . . 95<br />
View Data Block. . . . . . . . . . . . . . . . . . . . . . . . . . . . . . . . . . . 96<br />
Pop-up Tool-tips . . . . . . . . . . . . . . . . . . . . . . . . . . . . . . . . . . . 97<br />
Hide SOF Packets . . . . . . . . . . . . . . . . . . . . . . . . . . . . . . . . . . 97<br />
Hide NAKs . . . . . . . . . . . . . . . . . . . . . . . . . . . . . . . . . . . . . . . 97<br />
Hide Devices. . . . . . . . . . . . . . . . . . . . . . . . . . . . . . . . . . . . . . 97<br />
Hide Chirps . . . . . . . . . . . . . . . . . . . . . . . . . . . . . . . . . . . . . . . 97<br />
Switch to Transactions View. . . . . . . . . . . . . . . . . . . . . . . . . . 98<br />
View Decoded Transactions . . . . . . . . . . . . . . . . . . . . . . . . . 100<br />
Expanded and Collapsed Transactions . . . . . . . . . . . . . . 100<br />
Switch to Split Transaction View . . . . . . . . . . . . . . . . . . . . . 101<br />
Switch to Transfer View . . . . . . . . . . . . . . . . . . . . . . . . . . . . 102<br />
View Decoded Transfers. . . . . . . . . . . . . . . . . . . . . . . . . . . . 104<br />
Expanded and Collapsed Transfers. . . . . . . . . . . . . . . . . 104<br />
Decoding Protocol-Specific Fields in Transactions/Transfers . .<br />
105<br />
Switch to Host Wire Adapter Segment View . . . . . . . . . . . . 106<br />
Switch to Host Wire Adapter Transfer View . . . . . . . . . . . . 107<br />
Switch to Device Wire Adapter Segment View . . . . . . . . . . 107<br />
Switch to Device Wire Adapter Transfer View . . . . . . . . . . 108<br />
Using the Trace Navigator . . . . . . . . . . . . . . . . . . . . . . . . . . 108<br />
Navigator Bar Attributes. . . . . . . . . . . . . . . . . . . . . . . . . 110<br />
Chapter 9 Decode Requests . . . . . . . . . . . . . . . . . . . . . . . . . . . . 111<br />
Class and Vendor Definition Files . . . . . . . . . . . . . . . . . . . . 111<br />
Class/Vendor Decoding Options. . . . . . . . . . . . . . . . . . . . . . 113<br />
Mapping Request Recipient to Class/Vendor Decoding. 113<br />
Mapping Endpoint to Class/Vendor Decoding . . . . . . . . 115<br />
Mapping Request RPipe to Class/Vendor Decoding . . . 118<br />
Mapping Endpoint RPipe to Class/Vendor Decoding. . . 119<br />
Mapping Request DWA RPipe to Class/Vendor Decoding .<br />
120<br />
Mapping Endpoint DWA RPipes to Class/Vendor Decoding<br />
122<br />
vi
<strong>LeCroy</strong> <strong>USBTracer</strong>/<strong>Trainer</strong> User <strong>Manual</strong><br />
SW Version 2.20<br />
General Options . . . . . . . . . . . . . . . . . . . . . . . . . . . . . . . . . . 123<br />
Decoding USB Device Requests . . . . . . . . . . . . . . . . . . 123<br />
Decoding Standard Requests . . . . . . . . . . . . . . . . . . . . . 125<br />
Decoding Class Requests . . . . . . . . . . . . . . . . . . . . . . . . 126<br />
Decoding Vendor Requests. . . . . . . . . . . . . . . . . . . . . . . 126<br />
Decoding Undefined USB/WUSB Device Requests . . . 127<br />
Decoding using Endpoint Information . . . . . . . . . . . . . . 127<br />
Changing the Layout of Decode Requests . . . . . . . . . . . 127<br />
Chapter 10 Other Features . . . . . . . . . . . . . . . . . . . . . . . . . . . . . . 129<br />
Search . . . . . . . . . . . . . . . . . . . . . . . . . . . . . . . . . . . . . . . . . . 129<br />
Go to Trigger. . . . . . . . . . . . . . . . . . . . . . . . . . . . . . . . . . 129<br />
Go to Packet/Transaction/Transfer . . . . . . . . . . . . . . . . . 129<br />
Go to Marker. . . . . . . . . . . . . . . . . . . . . . . . . . . . . . . . . . 130<br />
Go To . . . . . . . . . . . . . . . . . . . . . . . . . . . . . . . . . . . . . . . 131<br />
Find . . . . . . . . . . . . . . . . . . . . . . . . . . . . . . . . . . . . . . . . . 136<br />
Find Next . . . . . . . . . . . . . . . . . . . . . . . . . . . . . . . . . . . . 137<br />
Search Direction . . . . . . . . . . . . . . . . . . . . . . . . . . . . . . . 137<br />
Edit Comment . . . . . . . . . . . . . . . . . . . . . . . . . . . . . . . . . . . . 138<br />
Reports . . . . . . . . . . . . . . . . . . . . . . . . . . . . . . . . . . . . . . . . . 138<br />
File Information . . . . . . . . . . . . . . . . . . . . . . . . . . . . . . . 139<br />
Error Summary . . . . . . . . . . . . . . . . . . . . . . . . . . . . . . . . 140<br />
Timing Calculations . . . . . . . . . . . . . . . . . . . . . . . . . . . . 141<br />
Traffic Summary . . . . . . . . . . . . . . . . . . . . . . . . . . . . . . . 142<br />
Bus Utilization . . . . . . . . . . . . . . . . . . . . . . . . . . . . . . . . 143<br />
Real Time Monitoring. . . . . . . . . . . . . . . . . . . . . . . . . . . 147<br />
Chapter 11 Traffic Generation with USB<strong>Trainer</strong>. . . . . . . . . . . . 151<br />
USB<strong>Trainer</strong> Traffic Generation Files . . . . . . . . . . . . . . . 151<br />
Creating Traffic Generation Files . . . . . . . . . . . . . . . . . . 152<br />
Editing a Generation File . . . . . . . . . . . . . . . . . . . . . . . . . . . 154<br />
Toolbar . . . . . . . . . . . . . . . . . . . . . . . . . . . . . . . . . . . . . . 154<br />
File Tabs . . . . . . . . . . . . . . . . . . . . . . . . . . . . . . . . . . . . . 156<br />
Error Log. . . . . . . . . . . . . . . . . . . . . . . . . . . . . . . . . . . . . 156<br />
Tooltips . . . . . . . . . . . . . . . . . . . . . . . . . . . . . . . . . . . . . . 156<br />
Loading the Generation File . . . . . . . . . . . . . . . . . . . . . . . . . 156<br />
Traffic Generation Modes: Bitstream vs. Intelliframe . . 159<br />
Starting Traffic Generation . . . . . . . . . . . . . . . . . . . . . . . 159<br />
Repeating a Generation Session . . . . . . . . . . . . . . . . . . . 160<br />
Stop Traffic Generation. . . . . . . . . . . . . . . . . . . . . . . . . . 160<br />
Device Emulation . . . . . . . . . . . . . . . . . . . . . . . . . . . . . . . . . 160<br />
Creating a Generation File . . . . . . . . . . . . . . . . . . . . . . . 160<br />
Setting Generation Options. . . . . . . . . . . . . . . . . . . . . . . 161<br />
Run the Traffic Generation Script File . . . . . . . . . . . . . . 161<br />
vii
<strong>LeCroy</strong> <strong>USBTracer</strong>/<strong>Trainer</strong> User <strong>Manual</strong><br />
SW Version 2.20<br />
Format of the Traffic Generation Files . . . . . . . . . . . . . . . . . 162<br />
How to Contact <strong>LeCroy</strong>. . . . . . . . . . . . . . . . . . . . . . . . . . . . . . . . . 173<br />
Limited Hardware Warranty . . . . . . . . . . . . . . . . . . . . . . . . . . . . 173<br />
Index . . . . . . . . . . . . . . . . . . . . . . . . . . . . . . . . . . . . . . . . . . . 177<br />
viii
<strong>LeCroy</strong> <strong>USBTracer</strong>/<strong>Trainer</strong> User <strong>Manual</strong><br />
SW Version 2.20<br />
1. Overview<br />
The <strong>LeCroy</strong> <strong>USBTracer</strong> USB 2.0 Design & Verification System is the<br />
latest in <strong>LeCroy</strong>’s broad portfolio of analysis tools. As a fifth generation<br />
product, it builds upon solid knowledge of the needs of the USB<br />
development and test communities. The result is a USB bus & protocol<br />
Analyzer with unprecedented functionality, unparalleled flexibility, and<br />
uncompromising user friendliness. The <strong>USBTracer</strong> interfaces with standard<br />
USB cables and connections to capture and display all speeds of USB bus<br />
traffic.<br />
1.1 General Description<br />
<strong>USBTracer</strong> is a hardware module that installs into the <strong>LeCroy</strong> Universal<br />
Protocol Analyzer System. Once installed, <strong>USBTracer</strong> can be easily<br />
configured and controlled by a portable or desktop PC connected via its<br />
USB port. <strong>USBTracer</strong> provides customers with the familiar "CATC Trace"<br />
user interface that is the de facto industry standard for documenting the<br />
performance of high-speed serial protocols.<br />
<strong>USBTracer</strong> is a non-intrusive testing tool for the USB protocol providing<br />
traffic capture and analysis. Hardware triggering allows real-time events to<br />
be captured. Hardware filtering allows the different types of packets to be<br />
filtered in or out of the recording. Filtering allows users to focus recordings<br />
on events of interest and to preserve recording memory so that the recording<br />
time can be extended.<br />
1
<strong>LeCroy</strong> <strong>USBTracer</strong>/<strong>Trainer</strong> User <strong>Manual</strong><br />
SW Version 2.20<br />
Recorded data is displayed in colored graphics in a trace viewer application.<br />
This application has advanced search and viewing capabilities that allow<br />
you to quickly locate specific data, errors and other desired conditions,<br />
thereby focussing the user’s attention on events of interest.<br />
<strong>USBTracer</strong> functions with any personal computer using the Microsoft ®<br />
Windows ® 98SE, 2000, ME, or XP operating system and equipped with a<br />
functional USB interface.<br />
The Analyzer is a plug-in module that is installed into a <strong>LeCroy</strong> Universal<br />
Protocol Analyzer System (UPAS). Together, the Analyzer and UPAS are<br />
controlled from a personal computer USB port across a USB connection.<br />
<strong>USBTracer</strong> provides on-the-fly detection of and triggering on such events<br />
as Tokens and Errors. Whether recording manually or with a specified<br />
trigger condition, <strong>USBTracer</strong> continuously records the link data in a<br />
wrap-around fashion until manually stopped or until the Trigger Event is<br />
detected and a specified post-Trigger amount of link data is recorded.<br />
Upon detection of a triggering event, the analyzer continues to record data<br />
up to a point specified by the user. Real-time detection of events can be<br />
individually enabled or disabled to allow triggering on events as they<br />
happen. This includes predefined exception or error conditions and a<br />
user-defined set of trigger events. The unit can also be triggered by an<br />
externally supplied signal. An external DB-25 connector provides a path for<br />
externally supplied data or timing data to be recorded along with traffic.<br />
2
<strong>LeCroy</strong> <strong>USBTracer</strong>/<strong>Trainer</strong> User <strong>Manual</strong><br />
SW Version 2.20<br />
This DB-25 connector also provides a path for <strong>USBTracer</strong> to transmit<br />
externally the software trigger signal or a user-defined event for purposes of<br />
probing and use by other circuitry.<br />
The <strong>USBTracer</strong> software provides powerful search functions that enable<br />
investigation of particular events and allow the software to identify and<br />
highlight specific events. In addition to immediate analysis, you can print<br />
any part of the data. Use the Save As feature to save the data on disk for later<br />
viewing. The program also provides a variety of timing information and<br />
data analysis reports.<br />
Please refer to the Universal Serial Bus Specification, version 2.0 for details<br />
on the protocol. The USB specification is available from the USB<br />
Implementers Forum (USB-IF) at:<br />
USB Implementers Forum<br />
1730 SW Skyline Blvd.<br />
Suite 203<br />
Portland, OR 97221<br />
Tel: +1/503.296.9892<br />
Fax: +1/503.297.1090<br />
Web: http://www.usb.org/<br />
1.2 Features<br />
General<br />
• Fully compliant with USB specification revision 2.0.<br />
• Flexible design - reconfigurable hardware for future enhancements.<br />
• Convenient modular system architecture with field upgradeable firmware<br />
and recording engine.<br />
• Supports all USB speeds (480 Mb/s, 12Mb/s and 1.5 Mb/s).<br />
• On the UPAS 2500H platform, Hi-Speed recording and generation<br />
requires an optional, separately priced key. See your <strong>LeCroy</strong><br />
representative for more information.<br />
• Dual recording channels aid in the development of multiple speed<br />
functions upstream and downstream of speed-matching hub or<br />
transaction translator.<br />
• User friendly "CATC Trace" interface that displays bus traffic using<br />
color and graphics.<br />
• Trace Viewer available as free non-recording, view-only software.<br />
• Online and context-sensitive help.<br />
• Power-on self-diagnostics.<br />
• Three year warranty and hot-line customer support.<br />
3
<strong>LeCroy</strong> <strong>USBTracer</strong>/<strong>Trainer</strong> User <strong>Manual</strong><br />
SW Version 2.20<br />
• Can be used in conjunction with the <strong>LeCroy</strong> USB<strong>Trainer</strong> USB Traffic<br />
Generator hardware module to create a fully customizable USB test<br />
platform.<br />
Physical Components<br />
• Hardware module for the <strong>LeCroy</strong> Universal Protocol Analyzer System.<br />
• Operated by any desktop or portable Microsoft Windows 98, 98SE,<br />
2000, ME, or XP computer with USB capability.<br />
• Convenient Plug-and-Play USB installation.<br />
• High impedance tap inserts non-intrusively in any branch of a USB<br />
system.<br />
• 512 MB of physical data recording memory.<br />
• Two all speed recording channels, which include Low, Full, or Hi-Speed.<br />
• Full-Speed USB connection to desktop or portable host PC. Hi-Speed on<br />
UPAS 2500H platform.<br />
• Internal wide-range AC power supply.<br />
• Break-out board (included) - used to interface to external test equipment.<br />
Recording Options<br />
• Versatile triggering - bit-wise value and mask data patterns up to sixteen<br />
bytes wide for Setup transactions and data packets.<br />
• Triggering on new High-speed PIDs and split transaction special tokens<br />
(ERR, SPLIT, PING, NYET, DATA2, and MDATA).<br />
• CATC Trace displays and enumerates High-speed Micro Frames.<br />
• Three forms of triggering: Snapshot, <strong>Manual</strong> and Event.<br />
• Transaction sequencer allows triggering on a token qualified by a data<br />
pattern and /or specific handshake or alternately transactions can be<br />
filtered (i.e., NAK’d transactions).<br />
• Advanced triggering with event counting and sequencing.<br />
• Dedicated trigger for recording input and output used to interface to<br />
external test equipment.<br />
• Triggering on multiple error conditions - PID bad, bit stuffing bad, CRC<br />
bad, end-of-packet bad, babble, loss of activity, frame length violation,<br />
time-out or turn-around violation, data toggle violation, Token, Bus<br />
Conditions, Data Length, excessive empty frames.<br />
• Real-time traffic capture filtering and data packet truncation variable up<br />
to 256 bytes.<br />
• Adjustable buffer size from 0.4 MB to 512 MB.<br />
4
<strong>LeCroy</strong> <strong>USBTracer</strong>/<strong>Trainer</strong> User <strong>Manual</strong><br />
SW Version 2.20<br />
Display Options<br />
• Utilizes "CATC Trace" graphical display of bus packets, transactions,<br />
split transactions and transfers.<br />
• Numerous packets and transactions can be grouped under a single<br />
transfer while quickly decoding all essential information.<br />
• Decoding of split transactions up and down stream of a transaction<br />
translator is accomplished with a special hierarchical view.<br />
• Variety of reports provided to summarize key statistics and conditions of<br />
interest with the ability to jump to the selected item in the trace display.<br />
• Flexible input signaling can be recorded with the CATC Trace.<br />
• Trace Viewer is backward compatible with Advisor, Chief,<br />
Inspector, and Detective trace files.<br />
• User-friendly trigger position indicated by different colors of pre- and<br />
post-trigger packet color.<br />
• Markers can be set to assist with navigation and time calculations.<br />
• Hide start-of-frame (SOF) packets as well as any packet or transaction.<br />
• Search for a specific PID.<br />
• Detects & alerts the user to every potential bus error, protocol violation,<br />
& combinations thereof.<br />
• High resolution, accurate time stamping of bus packets, timing<br />
measurement and analysis functions.<br />
• Extensive search and packet hiding capabilities.<br />
• Comprehensive device class decoding plus user defined protocol<br />
decoding.<br />
Traffic Generation<br />
• Traffic generation capability available as an add-on module for the<br />
Universal Protocol Analyzer System called USB<strong>Trainer</strong>.<br />
Hi-Speed Slow Clock<br />
The ability to Trace and Generate Hi-Speed traffic at fractional (slow) clock<br />
rate is available on both <strong>USBTracer</strong> platforms (2500 and 2500H), and can<br />
be purchased via a License Key. Contact <strong>LeCroy</strong> for more information.<br />
1.3 Graphical Bus Traffic Display<br />
The <strong>USBTracer</strong> transaction displays use color and graphics to show the<br />
captured transactions in an immediate, understandable and useful format.<br />
5
<strong>LeCroy</strong> <strong>USBTracer</strong>/<strong>Trainer</strong> User <strong>Manual</strong><br />
SW Version 2.20<br />
Packets are shown on separate rows, with their individual fields both labeled<br />
and color-coded. Packets are also numbered (sequentially, as recorded),<br />
time-stamped. Protocol errors are automatically detected and visibly<br />
highlighted in red.<br />
The display is customizable, allowing the user to control the color scheme<br />
and the formatting of field contents. A hide feature allows users to enable<br />
the suppression of SOF packets and user defined packets or fields that might<br />
be uninteresting in a given context. Display formats can be named and saved<br />
for later use. Pop-up "tool-tips" annotate packet fields with even more<br />
detailed information about their contents.<br />
The display software operates independently of the hardware, allowing it to<br />
function as a stand-alone "trace viewer" that is freely distributed.<br />
1.4 Accurate Time Management<br />
<strong>USBTracer</strong> uses internal counter/timer circuitry to enable a reliable,<br />
accurate (16.67 ns resolution) time stamping of recorded bus traffic. This<br />
timing information is displayed in the trace and in measurement and<br />
analysis functions. Any number of markers can be added by the user to<br />
denote specific packets, and further timing measurements can be made from<br />
one marker to another or from marker to trigger. All time fields are<br />
presented as a time stamp, idle time, bit time or in a new time delta in either<br />
decimal or hexadecimal format.<br />
6
<strong>LeCroy</strong> <strong>USBTracer</strong>/<strong>Trainer</strong> User <strong>Manual</strong><br />
SW Version 2.20<br />
An essential feature of time management is that idle traffic does not<br />
consume the analyzer memory. Because of this unique technology, accurate<br />
timing calculations can be made while still preserving valuable recording<br />
memory for important bus traffic.<br />
1.5 Comprehensive Error Detection and Analysis<br />
<strong>USBTracer</strong> detects and alerts the user to every potential bus error, protocol<br />
violation and/or combination thereof. The analyzer contains circuitry in the<br />
BusEngine to perform real-time triggering on multiple error conditions,<br />
such as PID bad, bit stuffing bad, header or data CRC bad, end-of-packet<br />
bad, babble, loss of activity, frame length violation, time-out or turn-around<br />
violation and data toggle violation. The analyzer program highlights all the<br />
hardware detected errors and further examines the trace file for additional<br />
protocol errors, including wrong packet length, data payload violation, and<br />
packet termination not on a byte boundary.<br />
1.6 Real-Time Event Triggering and Capture Filtering<br />
No attribute of a bus and protocol analyzer is more important than its<br />
capacity for extracting useful information from a crowded stream of bus<br />
traffic. The ability to accurately identify and selectively record transactions<br />
of interest is the trait most valuable to the user. <strong>USBTracer</strong> offers a unique<br />
approach to this challenge. By using a set of "recording resources", over a<br />
dozen configureable hardware building blocks, each can be optimized to<br />
perform a particular activity appropriate to the task. A recording resource<br />
can independently await an initialization signal, monitor its external<br />
environment (external signals, other resources) in search of a particular<br />
event and take a subsequent action (triggering, inclusive or exclusive<br />
filtering, counting, etc.). Under control of the user interface, these resources<br />
can be selected, configured and combined to search for complex trigger<br />
conditions and selectively capture the associated transactions.<br />
Thus, as well as triggering on basic events, such as specific bus conditions,<br />
packet identifiers (PID), etc. (see the Specifications section for a complete<br />
list), <strong>USBTracer</strong> can easily manage the most challenging requirements. For<br />
example: "trigger on the fifth occurrence of a SETUP Token device number<br />
nine", or "trigger on a SET INTERFACE request, following a specified<br />
eight-byte bulk data pattern match from this scanner, and do not capture any<br />
start-of-frame (SOF) packets."<br />
The user can set the size of the recording memory, specify the pre- and<br />
post-trigger capture ratio, and truncate large data packets up to 256 bytes.<br />
7
<strong>LeCroy</strong> <strong>USBTracer</strong>/<strong>Trainer</strong> User <strong>Manual</strong><br />
SW Version 2.20<br />
1.7 Advanced Event Counting & Sequencing<br />
The count and sequence options define rules for data recording sessions.<br />
These options provide the ability to configure and control the order of<br />
events that have been selected for triggering or filtering. There are two<br />
counters and a restart option that causes the sequencing to start again.<br />
By utilizing this feature, designers can specify a specific sequence of up to<br />
seven events that must occur before the analyzer triggers and finishes<br />
capturing data. This allows designers to pinpoint certain types of events for<br />
recording. Without this feature, designers must scroll through potentially<br />
megabytes of recorded data to locate a specific sequence or occurrence of a<br />
sequence that can take hours to locate before being able to begin analyzing<br />
the data of interest.<br />
1.8 BusEngine Technology<br />
The <strong>LeCroy</strong> BusEngine Technology is at the heart of the new <strong>USBTracer</strong><br />
Analyzer. The BusEngine core uses state-of-the-art Electrically<br />
Programmable Logic Device (EPLD) technology and incorporates both the<br />
real-time recording engine and the configurable building blocks that<br />
implement data/state/error detection, triggering, capture filtering, external<br />
signal monitoring, and event counting & sequencing. Like the<br />
flash-memory-based firmware that controls its operation, all BusEngine<br />
logic is fully field upgradeable, using configuration files.<br />
8
<strong>LeCroy</strong> <strong>USBTracer</strong>/<strong>Trainer</strong> User <strong>Manual</strong><br />
SW Version 2.20<br />
1.9 Specifications<br />
<strong>USBTracer</strong> is a hardware module that installs into the Universal Protocol<br />
Analyzer System. The following specifications describe a combined<br />
<strong>USBTracer</strong>/Universal Protocol Analyzer System.<br />
Package<br />
UPAS<br />
12.2 x 12.2 x 3.5 inches<br />
(31.1 x 31.1 x 8.9 cm)<br />
Connectors<br />
Weight<br />
<strong>USBTracer</strong> Plug-in 4.5 x 6.7 x 1.3 inches<br />
(11.3 x 17.0 x 3.2 cm)<br />
UPAS<br />
UPAS<br />
<strong>USBTracer</strong> Plug-in<br />
Power Requirements<br />
AC power connection<br />
External trigger connection<br />
Host connection (USB, type "B")<br />
7.5 lb. (3.4 kg)<br />
1.0 lb. (0.5 kg)<br />
90-254VAC, 47-63Hz (universal input), 100W maximum<br />
Environmental Conditions<br />
Operating Range<br />
Storage Range<br />
Humidity<br />
Probing Characteristics<br />
Connection<br />
Switches<br />
Power<br />
<strong>Manual</strong> Trigger<br />
0 to 55 °C (32 to 131 °F)<br />
-20 to 80 °C (-4 to 176 °F)<br />
10 to 90%, non-condensing<br />
High Speed USB Connectors<br />
Standard cables<br />
On/off<br />
When pressed forces a trigger event<br />
9
<strong>LeCroy</strong> <strong>USBTracer</strong>/<strong>Trainer</strong> User <strong>Manual</strong><br />
SW Version 2.20<br />
Indicators (LEDs)<br />
UPAS<br />
Power (PWR):<br />
Status (STATUS):<br />
Recording (REC):<br />
Triggered (TRG):<br />
Recording Memory Size<br />
Illuminated when the analyzer is powered on.<br />
Illuminated solid during self test, blinking during<br />
failure, off when the analyzer is functioning properly.<br />
Illuminated when the analyzer is actively recording<br />
traffic data.<br />
Illuminated during power-on testing and when the<br />
analyzer has detected a valid trigger condition.<br />
Uploading (UPLD): Illuminated when the analyzer is uploading its<br />
recording memory to the Host PC for displaying the<br />
CATC Trace.<br />
512 M x 8-bit DRAM for traffic data capture, timing, state and other data.<br />
Host Compatibility<br />
Works with any PC equipped with a functioning USB port and running the<br />
Microsoft Windows 98SE, ME, 2000, or XP operating system.<br />
Required Setup<br />
Microsoft Internet Explorer, Version 5 or newer.<br />
Hardware<br />
Processor: For optimum performance, use processors of the Intel Pentium<br />
III/Pentium 4 family, AMD Athlon/Duron family, or other compatible<br />
processors with clock speed of 500mHz or higher (Processors of the Intel<br />
Pentium II/Celeron family or AMD K6 family with clock speed of 300mHz<br />
is a minimum).<br />
Memory: For the best performance, it is recommended to have physical<br />
RAM twice the size of the recording buffer setup - 512MB or more<br />
(minimum of 128MB of RAM).<br />
Hard Disk: At least 20MB of free hard disk space is required for the<br />
installation. Additional disk space is needed for storing the recorded data in<br />
files during the recordings process (can be as much as 500MB when<br />
recording a full buffer size).<br />
Display: Resolution of 1024 x 768 with at least 16-bit color is<br />
recommended (resolution of 800 × 600 with 16-bit color is a minimum).<br />
10
<strong>LeCroy</strong> <strong>USBTracer</strong>/<strong>Trainer</strong> User <strong>Manual</strong><br />
SW Version 2.20<br />
Connectivity: A USB interface is required to connect to the <strong>USBTracer</strong><br />
analyzer. This is not a requirement if the application is going to be used only<br />
as a viewer.<br />
Power Cord Set<br />
Cord Manufacturer and Models:<br />
• 180-0005-00 Quail 5000.079 UL, CSA<br />
• 180-0013-00 Quail 8500.098 VDE, KEMA, CEBERC, NEMDO,<br />
DEMDO, SETI, OVE, SEV<br />
• 180-0014-00 Quail 9650.098 ASTA<br />
<strong>USBTracer</strong>s on the UPAS 2500H Platform<br />
UPAS 2500H <strong>USBTracer</strong> is a USB 2.0 Certified Hi-Speed Device. To<br />
upload at Hi-Speed, you must have a USB 2.0 Certified Host Controller and<br />
be running Microsoft Windows 2000 SP3 or Windows XP.<br />
The UPAS 2500H ships in one of two configurations: Classic and Hi-Speed.<br />
The Classic version can trace and generate traffic at Low and Full Speeds.<br />
The Hi-Speed version can trace and generate traffic at All speeds: Low,<br />
Full, and Hi.<br />
The Classic model may be upgraded to a Hi-Speed model by the purchase<br />
of a License Key from <strong>LeCroy</strong>. Contact your <strong>LeCroy</strong> representative for<br />
more information.<br />
Note: The UPAS 2500 and UPAS 2500H products include internal 1.1<br />
and 2.0 Hubs. You might see the drivers for these generic hubs<br />
being installed upon the initial plug-in.<br />
11
<strong>LeCroy</strong> <strong>USBTracer</strong>/<strong>Trainer</strong> User <strong>Manual</strong><br />
SW Version 2.20<br />
12
<strong>LeCroy</strong> <strong>USBTracer</strong>/<strong>Trainer</strong> User <strong>Manual</strong><br />
SW Version 2.20<br />
2. Quick Installation<br />
<strong>USBTracer</strong> is factory-installed hardware module that is sold as part of the<br />
<strong>LeCroy</strong> Universal Protocol Analyzer System.<br />
The Universal Protocol Analyzer System (UPAS) together with the<br />
<strong>USBTracer</strong> module and associated software are easily installed on most<br />
Microsoft ® Windows ® -based personal computer systems. You can begin<br />
making USB recordings after following these initial steps. However, if you<br />
are new to protocol analyzers, or are unsure about what to do after reading<br />
the Quick Installation instructions, or if your analyzer does not work after<br />
you follow these instructions, read through the subsequent sections in this<br />
manual.<br />
Step 1<br />
Step 2<br />
Step 3<br />
Step 4<br />
Step 5<br />
Step 6<br />
Step 7<br />
Step 8<br />
Step 9<br />
Connect the AC power cable to the rear of the Analyzer.<br />
Connect the USB port on the back of the Analyzer to the PC using<br />
the LONG (6-foot/2-meter) USB cable.<br />
Insert the CD.<br />
Turn on the power switch on the rear of the Analyzer.<br />
Click Next when you see the window of "Add New Hardware<br />
Wizard."<br />
Follow the on-screen Plug-and-Play instructions.<br />
Click Finish when you see the message that says "Windows has<br />
finished installing the software that your new hardware requires"<br />
and the file "Tracer.inf" has been installed in your PC.<br />
Run the program a:\setup and follow the on-screen instructions.<br />
Select About <strong>USBTracer</strong>... from the Help menu.<br />
If you can see all of the information listed below, you can record a<br />
trace:<br />
• <strong>USBTracer</strong> Software Version<br />
• <strong>USBTracer</strong> Firmware Version<br />
• BusEngine Version<br />
• Unit Serial Number<br />
13
<strong>LeCroy</strong> <strong>USBTracer</strong>/<strong>Trainer</strong> User <strong>Manual</strong><br />
SW Version 2.20<br />
2.1 Installing the Software and Starting the Program<br />
Step 1<br />
Step 2<br />
Insert the <strong>USBTracer</strong> CD into the CD-ROM drive on the host PC<br />
and follow the on-screen instructions to install the <strong>USBTracer</strong><br />
application.<br />
To start the application, launch the <strong>LeCroy</strong> <strong>USBTracer</strong> program<br />
from the Start Menu:<br />
Start > Programs > <strong>LeCroy</strong> > <strong>LeCroy</strong> <strong>USBTracer</strong><br />
The <strong>USBTracer</strong> main window opens:<br />
2.2 Your First USB Recording<br />
After installing and launching the software, you can test <strong>USBTracer</strong> by<br />
performing the following steps:<br />
Step 1<br />
Step 2<br />
Connect a USB cable to each of the two connectors on the<br />
<strong>USBTracer</strong> module, then connect the other ends to the USB device<br />
under test and USB host system.<br />
Select Recording Options under Setup on the Menu Bar.<br />
14
<strong>LeCroy</strong> <strong>USBTracer</strong>/<strong>Trainer</strong> User <strong>Manual</strong><br />
SW Version 2.20<br />
Step 3<br />
Select the General tab to display the following dialog box showing<br />
factory default settings such as Snapshot and 4 Mbytes buffer size.<br />
For the first recording, you can leave these settings unchanged.<br />
Step 4<br />
Step 5<br />
Click OK to activate the recording options you selected.<br />
Turn on the USB devices that are to be tested and cause them to<br />
generate USB traffic.<br />
Step 6 Click on the Tool Bar.<br />
Step 7<br />
<strong>USBTracer</strong> starts to record the USB traffic immediately. After<br />
4 Mbytes of traffic are recorded, the analyzer uploads the data and<br />
displays the packets in the trace window.<br />
To terminate recording before the snapshot automatically<br />
completes, click<br />
on the Tool Bar.<br />
When the recording session is finished, the traffic is uploaded from<br />
the Analyzer to the hard drive on your PC as a file named data.usb<br />
or the name you assigned as the default filename. While the file is<br />
15
<strong>LeCroy</strong> <strong>USBTracer</strong>/<strong>Trainer</strong> User <strong>Manual</strong><br />
SW Version 2.20<br />
being uploaded, you should see a brown progress bar at the bottom<br />
of the screen. When the bar disappears, it indicates that the data has<br />
been uploaded to disk.<br />
Step 8<br />
Step 9<br />
To save a current recording for future reference, select Save As<br />
under File on the Menu Bar.<br />
OR<br />
Click<br />
on the Tool Bar to display the standard Save As screen.<br />
Give the recording a unique name and save it to the appropriate<br />
directory.<br />
Capturing Your First Trace<br />
After a moment, the recording terminates and the results display:<br />
16
<strong>LeCroy</strong> <strong>USBTracer</strong>/<strong>Trainer</strong> User <strong>Manual</strong><br />
SW Version 2.20<br />
Trace View Features<br />
• The <strong>USBTracer</strong> packet view display makes extensive use of color<br />
and graphics to fully document the captured traffic.<br />
• Packets are shown on separate rows, with their individual fields<br />
both labeled and color coded.<br />
• Packets are numbered (sequentially, as recorded), time-stamped<br />
(with a resolution of 16.67 ns), and highlighted to show the<br />
transmitted speed (low-speed, full-speed or high-speed).<br />
• Display formats can be named and saved for later use.<br />
• Pop-up Tool Tips annotate packet fields with detailed information<br />
about their contents<br />
• Data fields can be collapsed to occupy minimal space in the display<br />
(which can in turn be zoomed in and out to optimize screen<br />
utilization).<br />
The display software can operate independent of the hardware and so can<br />
function as a stand-alone Trace Viewer that may be freely distributed.<br />
17
<strong>LeCroy</strong> <strong>USBTracer</strong>/<strong>Trainer</strong> User <strong>Manual</strong><br />
SW Version 2.20<br />
18
<strong>LeCroy</strong> <strong>USBTracer</strong>/<strong>Trainer</strong> User <strong>Manual</strong><br />
SW Version 2.20<br />
3. Detailed Installation<br />
3.1 System Components/Packing List<br />
• One stand-alone <strong>USBTracer</strong> Analyzer module<br />
• Five USB cables<br />
• <strong>USBTracer</strong> software program installation diskettes<br />
• Product documentation<br />
3.2 The Installed <strong>USBTracer</strong> Unit<br />
<strong>USBTracer</strong> is a module that inserts into the left slot on the <strong>LeCroy</strong><br />
Universal Protocol Analyzer System (UPAS). Once installed, the<br />
<strong>USBTracer</strong> Analyzer activates the user-accessible controls and LEDs on the<br />
front and rear panels of the UPAS.<br />
Figure 1<br />
Front Panel<br />
Figure 2<br />
Rear Panel<br />
LED and Button Descriptions<br />
The following section describes the LEDs, buttons, and connectors on the<br />
module and UPAS.<br />
19
<strong>LeCroy</strong> <strong>USBTracer</strong>/<strong>Trainer</strong> User <strong>Manual</strong><br />
SW Version 2.20<br />
LEDs on the Far Left Side of the UPAS<br />
• Green PWR (Power) indicator LED for UPAS: Lights when the<br />
unit power is switched on.<br />
• Red Status indicator LED for UPAS: Lights during boot up.<br />
LEDs and Button on the UPAS under the Left Module Slot<br />
The LEDs and button on the UPAS enclosure under the left module slot<br />
function in conjunction with the <strong>USBTracer</strong> module inserted above it:<br />
• Green REC (Recording) LED: Lights when the unit is recording.<br />
• Orange TRG (Triggered) LED: Lights when the unit triggers on an<br />
event.<br />
• Green UPLD (Upload): Lights when unit is uploading data to PC.<br />
• <strong>Manual</strong> Trigger push-button: Allows a manual Trace capture.<br />
LEDs and Button on the UPAS under the Right Module Slot<br />
The LEDs and button under the right module slot are reserved for <strong>LeCroy</strong><br />
generator modules such as the USB<strong>Trainer</strong> USB Traffic Generator<br />
(described in Chapter 11: Traffic Generation with USB<strong>Trainer</strong> on page<br />
151):<br />
• Green HS: Illuminates when Hi-Speed is being generated.<br />
• Orange Classic: Illuminates when Full or Low Speed is being<br />
generated. Classic also illuminates during power-on testing and is<br />
turned off at the end of the power on cycle. If the LED blinks at the<br />
end of this cycle, the hardware is faulty.<br />
• Green Intelliframe: Illuminates when Intelliframe traffic is being<br />
generated using Intelliframe mode, an intelligent adaptive traffic<br />
mode. If off, the generation is in Bitstream mode. See the section on<br />
"Traffic Generation Modes: Bitstream versus Intelliframe" in<br />
Chapter 11 for more information.<br />
• Start/Stop: Push-button allows manual Trace capture.<br />
• Wide range AC connector module:<br />
— Power socket<br />
— Power on/off switch<br />
— Enclosed 5x20 mm 2.0A 250 V fast acting glass fuse<br />
Warning<br />
For continued protection against fire, replace fuse only with the type<br />
and rating specified above.<br />
20
<strong>LeCroy</strong> <strong>USBTracer</strong>/<strong>Trainer</strong> User <strong>Manual</strong><br />
SW Version 2.20<br />
• Two External Ports marked Ext. 1 and Ext. 2.<br />
• USB type B host computer connector<br />
• Data In/Out DB-25 (25-pin) external interface connector<br />
Warning<br />
Do not open the UPAS enclosure. There are no operator serviceable<br />
parts inside. Refer servicing to <strong>LeCroy</strong>.<br />
3.3 <strong>USBTracer</strong> System Setup<br />
<strong>USBTracer</strong> is a module that inserts into the Universal Protocol Analyzer<br />
System. The UPAS, in turn, is connected and controlled by a desktop or<br />
laptop PC via a USB connection.<br />
To set up the system hardware:<br />
• Insert the <strong>USBTracer</strong> module into the UPAS.<br />
• Connect the Analyzer to an AC power source.<br />
• Connect to the analyzing PC via USB.<br />
• Connect USB cable to the device under test.<br />
3.4 AC Power Source<br />
Step 1<br />
Connect the Analyzer box to a 100-volt to 240-volt, 50 Hz to 60 Hz,<br />
120 W power outlet using the provided power cord.<br />
Note<br />
The Analyzer is capable of supporting supply voltages between<br />
100-volt and 240-volt, 50 Hz or 60 Hz, thus supporting all known<br />
supply voltages around the world.<br />
Step 2<br />
Use the power switch located on the rear panel to turn the analyzer<br />
unit on and off.<br />
Note At power-on, the analyzer initializes itself in approximately 25<br />
seconds and performs an exhaustive self-diagnostic that lasts about<br />
45 seconds. The Status LED illuminates during the power-on testing<br />
and turns off when testing is finished. If the diagnostics fail, the<br />
Status LED blinks, indicating a hardware failure. If this occurs, call<br />
<strong>LeCroy</strong> Customer Support for assistance.<br />
21
<strong>LeCroy</strong> <strong>USBTracer</strong>/<strong>Trainer</strong> User <strong>Manual</strong><br />
SW Version 2.20<br />
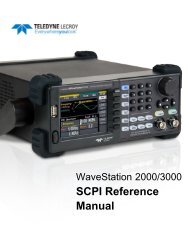
3.5 External Interface Breakout Board<br />
The External Interface Breakout Board is an accessory that allows<br />
convenient access to several potentially useful standard, LV TTL output and<br />
input signals. It also offers a simple way to connect logic analyzers or other<br />
tools to the <strong>USBTracer</strong> Analyzer unit. Six ground pins and one 5-volt pin<br />
are provided.<br />
Figure 3<br />
External Interface Breakout Board<br />
The Breakout Board connects via a cable to the Data In/Out connector<br />
located on the rear of the analyzer box. Each signaling pin is isolated by a<br />
100Ω series resistor and a buffer inside the Analyzer box.<br />
Figure 4<br />
Data In/Out Connector (on cable)<br />
22
<strong>LeCroy</strong> <strong>USBTracer</strong>/<strong>Trainer</strong> User <strong>Manual</strong><br />
SW Version 2.20<br />
Pin-Outs for the Data In/Out Connector<br />
Table 11 lists the pin-out and signal descriptions for the Data In/Out<br />
connector on a cable that connects to the Breakout board.<br />
Table 1 Data In/Out Connector – Pin-Out<br />
Pin Signal Name Signal Description<br />
1 RSV Reserved<br />
2 GND Ground<br />
3 GP OUT General Purpose Output<br />
4 TRG IN 1 Trigger In 1<br />
5 GND Ground<br />
6 DATA 6 Data 6<br />
7 DATA 4 Data 4<br />
8 DATA 3 Data 3<br />
9 DATA 1 Data 1<br />
10 GND Ground<br />
11 RSV Reserved<br />
12 RSV Reserved<br />
13 +5V +5 Volts, 250 mA DC Source<br />
14 RSV Reserved<br />
15 GND Ground<br />
16 TRG OUT Trigger Out<br />
17 TRG IN 0 Trigger In 0<br />
18 DATA 7 Data 7<br />
19 DATA 5 Data 5<br />
20 GND Ground<br />
Note<br />
(*) Pins 4 and 17 have the same function. They allow external signals<br />
to be used to cause triggering or recording. Pins 3 and 16 are used to<br />
transmit output signals.<br />
Prototype Rework Area<br />
The Breakout Board contains a prototype rework area for making custom<br />
circuits for rapid development. The area consists of plated-through holes, 20<br />
columns wide by 27 rows long. The top row of holes is connected to GND<br />
and the bottom row is connected to +5V. The remaining holes are not<br />
connected. Use the rework area to insert custom components and wire-wrap<br />
their respective signal, power, and ground pins.<br />
23
<strong>LeCroy</strong> <strong>USBTracer</strong>/<strong>Trainer</strong> User <strong>Manual</strong><br />
SW Version 2.20<br />
3.6 PC Connection<br />
Use the LONGEST (6-foot/2-meter) of the five USB cables provided to<br />
connect the host computer to the <strong>USBTracer</strong> Analyzer box.<br />
3.7 Analyzer PC Requirements<br />
Please refer to the Readme.txt file on the installation CD for PC and<br />
operating system requirements.<br />
3.8 Setting Up the Analyzer<br />
Step 1<br />
Connect the provided AC power cord to the rear of the UPAS and to<br />
a 100-volt to 240-volt, 50 Hz to 60 Hz, 100 W power outlet.<br />
Note<br />
The Analyzer is capable of supporting supply voltages between<br />
100-volt and 240-volt, 50 Hz or 60 Hz, thus supporting all known<br />
supply voltages around the world.<br />
Step 2<br />
Turn on the power switch on the rear of the analyzer.<br />
Note<br />
At power-on, the analyzer initializes itself in approximately ten<br />
seconds and performs an exhaustive self-diagnostic that lasts about<br />
five seconds. The Trigger LED illuminates during the power-on<br />
testing and turns off when testing is finished. If the diagnostics fail,<br />
the trigger LED blinks continuously, indicating a hardware failure.<br />
If this occurs, call <strong>LeCroy</strong> Customer Support for assistance.<br />
Step 3<br />
Connect the USB cable between the USB port on the back of the<br />
analyzer and a USB port on the analyzing PC.<br />
The host operating system detects the analyzer and begins to install<br />
the USB driver.<br />
24
<strong>LeCroy</strong> <strong>USBTracer</strong>/<strong>Trainer</strong> User <strong>Manual</strong><br />
SW Version 2.20<br />
3.9 Installing the Analyzer Software on the PC<br />
Once <strong>USBTracer</strong> has been recognized as a USB device, install the<br />
<strong>USBTracer</strong> software on the PC administering the analyzer:<br />
Step 1<br />
Step 2<br />
Step 3<br />
Step 4<br />
Insert the <strong>USBTracer</strong> CD into the CD ROM drive of the PC<br />
that will administer the Analyzer.<br />
Follow Microsoft ® Windows ® on-screen Plug-and-Play<br />
instructions for the automatic installation of the <strong>USBTracer</strong><br />
Analyzer as a USB device on your analyzing PC (the required USB<br />
files are included on the <strong>USBTracer</strong> CD.<br />
Select Install Software from the installation CD and follow<br />
the on-screen installation instructions.<br />
The <strong>USBTracer</strong> application installs on the PC hard disk.<br />
To start the application, launch the <strong>LeCroy</strong> <strong>USBTracer</strong> program<br />
from the Start Menu:<br />
Start > Programs > <strong>LeCroy</strong> > <strong>LeCroy</strong> <strong>USBTracer</strong>.<br />
The <strong>USBTracer</strong> program opens.<br />
25
<strong>LeCroy</strong> <strong>USBTracer</strong>/<strong>Trainer</strong> User <strong>Manual</strong><br />
SW Version 2.20<br />
3.10 <strong>USBTracer</strong> Program Startup<br />
You can start the <strong>USBTracer</strong> program from the Desktop or from the<br />
installed directory. The program always begins with its main screen active:<br />
The software may be used with or without <strong>USBTracer</strong>. When used without<br />
<strong>USBTracer</strong>, the program functions in a Trace Viewer mode to view,<br />
analyze, and print captured protocol traffic.<br />
When the program is used with the <strong>USBTracer</strong> Protocol Analyzer attached<br />
to the computer, you can set trigger conditions, record, monitor and analyze<br />
the activity of your USB bus.<br />
3.11 Making a Recording<br />
After installation, the software is configured to make a Snapshot recording<br />
of USB traffic.<br />
See Section 2.2 "Your First USB Recording" on page 14 to make your first<br />
recording of this traffic.<br />
26
<strong>LeCroy</strong> <strong>USBTracer</strong>/<strong>Trainer</strong> User <strong>Manual</strong><br />
5SW Version 2.20<br />
4. Updates<br />
From time to time as modifications are made to the <strong>USBTracer</strong> Analyzer,<br />
it is necessary to update the <strong>USBTracer</strong> for optimal performance. Updates<br />
can be performed two ways: either automatically or manually. This chapter<br />
describes both procedures.<br />
4.1 Software, Firmware, and BusEngine Revisions<br />
The Readme.txt file on the first installation disk and in the installed<br />
directory gives last-minute updates about the current release. Included with<br />
each release are the most recent downloadable images of the Firmware and<br />
the BusEngine.<br />
Once the Analyzer has completed the self diagnostics and is connected to<br />
the PC, you can check the latest revision of the software and BusEngine by<br />
selecting About <strong>USBTracer</strong>… from the Help menu.<br />
About <strong>USBTracer</strong> details revisions of the following software and<br />
hardware:<br />
• <strong>USBTracer</strong> Software Version<br />
• <strong>USBTracer</strong> Firmware Version<br />
• BusEngine Version<br />
• Unit Serial Number<br />
Note<br />
When contacting <strong>LeCroy</strong> for technical support, please have<br />
available all the revisions reported in the About <strong>USBTracer</strong><br />
window.<br />
27
<strong>LeCroy</strong> <strong>USBTracer</strong>/<strong>Trainer</strong> User <strong>Manual</strong><br />
SW Version 2.20<br />
4.2 Software Updates<br />
When a new software release is available, it is posted on the Support page<br />
of the <strong>LeCroy</strong> website at www.lecroy.com/support.html.<br />
To update the software:<br />
Step 1<br />
Step 2<br />
Step 3<br />
Step 4<br />
Step 5<br />
Step 6<br />
Step 7<br />
Step 8<br />
Step 9<br />
In the About <strong>USBTracer</strong> screen, verify which version of<br />
<strong>USBTracer</strong> Software you are currently running.<br />
Find the latest released software version on the <strong>LeCroy</strong> website<br />
under Support.<br />
If you are running the latest version of the software, no<br />
further action is needed.<br />
If you are not running the latest version, continue to Step 3.<br />
Download the Zip files from the website.<br />
Unzip the files into your choice of directory.<br />
Click Start, then Run, and browse to where you unzipped the files.<br />
Select the program named Setup and click Open.<br />
Click OK to run the Setup and begin the installation.<br />
Follow the on-screen instructions to complete the installation.<br />
Read the Readme file for important information on changes in the<br />
release.<br />
4.3 BusEngine and Firmware Updates<br />
BusEngine and Firmware updates often need to be performed when you<br />
update the <strong>USBTracer</strong> software. These updates can be performed<br />
automatically or manually. Both processes are described.<br />
Updating the BusEngine<br />
The BusEngine core is the heart of the <strong>USBTracer</strong> Analyzer. Using<br />
state-of-the-art Electronically Programmable Logic Device (EPLD)<br />
technology, it incorporates both the high speed recording engine and the<br />
configurable building blocks that implement data/state/error detections,<br />
triggering, capture filtering, external signal monitoring, and event counting<br />
and sequencing. Both the BusEngine program and the Firmware that<br />
manages the internal microcontroller are fully field upgradeable.<br />
28
<strong>LeCroy</strong> <strong>USBTracer</strong>/<strong>Trainer</strong> User <strong>Manual</strong><br />
5SW Version 2.20<br />
Within a new software release, it may be necessary to update the Analyzer’s<br />
BusEngine hardware for proper operation. The Readme file lets you know<br />
if this is necessary.<br />
Updating the Firmware<br />
Within a new software release, it may also be necessary to update the<br />
Analyzer’s firmware for proper operation. The Readme file informs you if<br />
this is necessary.<br />
Automatic Updates<br />
When the <strong>USBTracer</strong> software is upgraded, the software may become<br />
incompatible with the BusEngine and Firmware. If a recording is attempted,<br />
<strong>USBTracer</strong> displays an error message and then automatically begins an<br />
update process for the BusEngine and Firmware.<br />
To perform an automatic BusEngine and Firmware update, follow these<br />
steps:<br />
Step 1<br />
Step 1<br />
If needed, update the <strong>USBTracer</strong> software using the steps outlined<br />
in "Software Updates" described above.<br />
Turn on the Analyzer.<br />
Step 2 On the Tool Bar, click the button.<br />
Since the BusEngine and/or the Firmware are incompatible with the<br />
current <strong>USBTracer</strong> software version, an error message appears<br />
displaying your current versions and indicating what versions you<br />
need to install.<br />
29
<strong>LeCroy</strong> <strong>USBTracer</strong>/<strong>Trainer</strong> User <strong>Manual</strong><br />
SW Version 2.20<br />
Step 3<br />
Click Yes to close the window closes and open the Analyzer Setup<br />
window.<br />
Step 4<br />
Click Update BusEngine or Update Firmware.<br />
You can select only one item at this point. If both the BusEngine and<br />
the Firmware need to be updated, the update completes for the first<br />
item and then returns to the above screen so the second update can<br />
be performed.<br />
If you are running Microsoft ® Windows ® 98, you get the following<br />
message when the second update is completed:<br />
30
<strong>LeCroy</strong> <strong>USBTracer</strong>/<strong>Trainer</strong> User <strong>Manual</strong><br />
5SW Version 2.20<br />
Step 5<br />
Power cycle <strong>USBTracer</strong> to complete the update.<br />
If you are running Windows 2000, the analyzer automatically<br />
reboots and displays the following message. When this message<br />
appears, click OK. You do not need to power cycle the analyzer.<br />
<strong>Manual</strong> Updates to BusEngine and Firmware<br />
You can manually update the <strong>USBTracer</strong> Firmware and/or BusEngine by<br />
performing the following steps:<br />
Step 1<br />
Select Analyzer under Setup on the Menu Bar to display the<br />
Analyzer Setup screen:<br />
31
<strong>LeCroy</strong> <strong>USBTracer</strong>/<strong>Trainer</strong> User <strong>Manual</strong><br />
SW Version 2.20<br />
Step 2<br />
To update the BusEngine, click Update BusEngine on the<br />
Analyzer Setup screen to display the Select the engine file to<br />
download window:<br />
The program displays the correct file (Upas_Usb2_2A_be.rbf) in<br />
the File name field. This file is used to update the analyzer alone<br />
(i.e., without a Traffic Generator). The other file<br />
(Upas_Usb2_2A_1G_be.rbf) should be selected if you upgrading a<br />
UPAS system with both an analyzer and Traffic Generator.<br />
If you have purchased device emulation, then the needed BusEngine<br />
file is Upas_usb2_1A_1G-be.rbf.<br />
Note<br />
The most current Primary BusEngine file was copied to your<br />
\<strong>LeCroy</strong>\<strong>USBTracer</strong> directory when you installed the program.<br />
Step 3<br />
Step 4<br />
Click Open.<br />
Power cycle the analyzer.<br />
Re-initialization takes a couple of minutes.<br />
32
<strong>LeCroy</strong> <strong>USBTracer</strong>/<strong>Trainer</strong> User <strong>Manual</strong><br />
5SW Version 2.20<br />
<strong>Manual</strong>ly Updating the Firmware<br />
To update the firmware:<br />
Step 1<br />
Click Update Firmware on the Analyzer Setup screen to display<br />
the Select firmware file window:<br />
The program has already automatically searched for the correct file<br />
and displays it in the File name field.<br />
Step 2<br />
Step 3<br />
Click Open.<br />
The Analyzer updates the Firmware.<br />
Unplug the USB cable from the back of the Analyzer box and then<br />
reinsert it so the new Firmware update can take effect.<br />
4.4 Resetting the Analyzer<br />
The Analyzer Setup window contains a reset button at the top of the<br />
window. Its function is the equivalent of power cycling the Analyzer.<br />
33
<strong>LeCroy</strong> <strong>USBTracer</strong>/<strong>Trainer</strong> User <strong>Manual</strong><br />
SW Version 2.20<br />
34
<strong>LeCroy</strong> <strong>USBTracer</strong>/<strong>Trainer</strong> User <strong>Manual</strong><br />
SW Version 2.20<br />
5. Software Overview<br />
The <strong>USBTracer</strong> Trace Viewer is an application that may be used with or<br />
without the Analyzer box. When used without an Analyzer box, the program<br />
functions in a Trace Viewer mode to view, analyze, and print captured<br />
protocol traffic from <strong>USBTracer</strong> Analyzers. The software also allows you<br />
to view trace files created by the <strong>LeCroy</strong> Chief, Advisor, Detective,<br />
and Inspector. Opening a file created with either of these Analyzers<br />
displays a screen asking if you want to convert the old file to the new format<br />
under the name convert.usb.<br />
When the program is used with the <strong>USBTracer</strong> Analyzer attached to the<br />
computer, you can monitor and analyze the activity of your USB branch<br />
from either of the USB ports on the front of the Analyzer.<br />
5.1 Starting the <strong>USBTracer</strong> Program<br />
To start the <strong>USBTracer</strong> Program:<br />
Step 1<br />
Select Start > Programs > <strong>LeCroy</strong> > <strong>LeCroy</strong> <strong>USBTracer</strong>.<br />
5.2 Tooltips<br />
Tooltips provide useful information about cells in the<br />
trace and buttons in the application. To display a tooltip,<br />
position the mouse pointer over an item.<br />
35
<strong>LeCroy</strong> <strong>USBTracer</strong>/<strong>Trainer</strong> User <strong>Manual</strong><br />
SW Version 2.20<br />
5.3 The Main Display Windows<br />
While some of the analyzer’s Main Display window options are familiar,<br />
many contain options specific to the analyzer program.<br />
Menu<br />
File<br />
New .utg file.<br />
Open<br />
Close<br />
Save As<br />
Print<br />
Print Preview<br />
Print Setup<br />
Edit as Text<br />
Edit Comment<br />
Check Syntax of .utg file<br />
Export>><br />
Packets to Text (Packet<br />
View Format)<br />
Packets to .CSV<br />
(Comma Separated<br />
Values for Excel, etc.)<br />
Format)<br />
Packets to Host Traffic<br />
Generator Text File<br />
(.utg)<br />
Packets to Device<br />
Emulation Traffic<br />
Generation Text File<br />
(.utg)<br />
Data<br />
Merge Trace Files<br />
Import<br />
Compare Endpoint Data<br />
Exit<br />
Function<br />
Creates a new, empty traffic generation file. Available only if a<br />
trace file (.usb) is open. To edit a .utg file, click the Edit as Text<br />
button in the toolbar.<br />
Opens a file.<br />
Closes the current file.<br />
Saves all or a range of packets from the current file.<br />
Prints part or all of the current traffic data file.<br />
Produces an on-screen preview before printing.<br />
Sets the options for the current or new printer.<br />
Opens the Script Editor. Available only when a traffic generation<br />
file (.utg) is open.<br />
Creates or edits the Trace file comment field.<br />
Reads open .utg file and checks syntax for errors. Available only<br />
when a traffic generation file (.utg) is open.<br />
Saves all or part of a trace to a text file or generator file.<br />
Saves trace as text file in Packet View Format.<br />
Saves trace as a comma-separated-values text file for use with<br />
Microsoft ® Excel.<br />
Saves trace as script file that can be used by a Generator to generate<br />
a trace.<br />
Exports packets to Device Emulation files. This option does not<br />
export transactions.<br />
Exports Transfer data as text or binary file.<br />
Merges two simultaneously recorded files into a single file. (This<br />
command does not work if the files were recorded at different<br />
times).<br />
Import data from .vcd file<br />
Allows you to select two endpoints of different directions with the<br />
same address and verify that the data OUT/IN is identical to the data<br />
IN/OUT from the other endpoint. Used when running echo-types of<br />
tests for data integrity. Available only when a trace file (.usb) is<br />
open.<br />
Exits the <strong>USBTracer</strong> program.<br />
36
<strong>LeCroy</strong> <strong>USBTracer</strong>/<strong>Trainer</strong> User <strong>Manual</strong><br />
SW Version 2.20<br />
Menu<br />
Setup<br />
Display Options<br />
Recording Options<br />
Setup Analyzer<br />
Record<br />
Start<br />
Stop<br />
Upload Again<br />
Generate<br />
Start<br />
IntelliFrame Generation<br />
Mode<br />
Bitstream Generation<br />
Mode<br />
Repeat Mode<br />
Report<br />
File Information<br />
Error Summary<br />
Timing Calculations<br />
Traffic Summary<br />
Bus Utilization<br />
Search<br />
Go to Trigger<br />
Go to Packet/<br />
Transaction/Transfer<br />
Go to Marker »<br />
Go to »<br />
Find<br />
Find Next<br />
Search Direction<br />
Function<br />
Provides display options such as color, formats, and filters.<br />
Provides setup options for recording, triggering events and filtering.<br />
Allows you to update the BusEngine and Firmware.<br />
Causes the Analyzer to begin recording USB activity.<br />
Causes the Analyzer to stop recording.<br />
Allows you to upload a different portion of the captured trace if the<br />
previous upload was only partially uploaded.<br />
Starts traffic generation. Once traffic generation has begun, the Start<br />
command becomes Stop and lets you stop traffic generation.<br />
Sets the mode of generation to IntelliFrame. Use before Start.<br />
Sets the mode of generation to bitstream. Use before Start.<br />
Allows you to repeat once, a specified number of times, or an<br />
infinite number of times using the Generation Repeat Mode<br />
window.<br />
Displays information about the recording such as the number of<br />
packets and triggering setup.<br />
Summarizes the errors throughout the recording. Allows for fast<br />
navigation to packet with errors.<br />
Calculates timing between two packets and bus utilization.<br />
Summarizes the numbers and types of errors, packets, transactions,<br />
split transactions, and transfers that occurred in the open trace.<br />
Displays graphs of packet length, bus usage, and bus usage by<br />
device.<br />
Positions the display to show the first packet that follows the trigger<br />
event.<br />
Positions the display to the packet/transaction/transfer number<br />
selected in the Go to Packet/Transaction/Transfer menu.<br />
Positions the display to the selected marked packet.<br />
Positions the display to the selected event, condition, value, or type.<br />
Allows complex searches on multiple criteria.<br />
Repeats the previous Find operation.<br />
Allows the search direction to be changed from Forward to<br />
Backward or vice versa.<br />
37
<strong>LeCroy</strong> <strong>USBTracer</strong>/<strong>Trainer</strong> User <strong>Manual</strong><br />
SW Version 2.20<br />
Menu<br />
View<br />
Toolbars<br />
Status Bar<br />
Real-time Statistics<br />
Zoom In<br />
Zoom Out<br />
Wrap<br />
Hide SOF’s<br />
Hide NAK’s<br />
Hide Devices<br />
Hide Chirps<br />
Apply Decoding Scripts<br />
Packet Level<br />
Transaction Level<br />
Split Transaction Level<br />
Transfer Level<br />
Refresh Decoding<br />
Window<br />
New Window<br />
Cascade<br />
Tile Horizontal<br />
Tile Vertical<br />
Arrange Icons<br />
Windows ...<br />
Function<br />
Displays list of available toolbars.<br />
Switches display of the Status Bar on or off.<br />
Allows you to view traffic statistics as they occur.<br />
Increases the size of the displayed elements.<br />
Decreases the size of the displayed elements.<br />
Wraps displayed packets within the window.<br />
Hides Start of Frames.<br />
Hides NAK’ed Transactions.<br />
Hides packets belonging to specified devices by address and<br />
endpoint.<br />
Hide the Chirp-K and Chirp-J Bus conditions. These are recorded<br />
only in <strong>USBTracer</strong>.<br />
Decoding scripts set the values of the display and recording options<br />
for optimum views of trace information from specific vendors or<br />
classes of data. This menu option allows you to select the vendor or<br />
class of data for the request recipients and endpoints listed in the<br />
Request Recipients and Endpoints menu. You can keep the settings<br />
across recordings.<br />
Displays Packets.<br />
Displays Transactions.<br />
Displays Split Transactions.<br />
Displays Transfers.<br />
Force the software to re-decode transactions and transfers. Useful if<br />
you have applied a decoding mapping which helps fully decode a<br />
sequence of transfers, as is the case with Mass Storage decoding.<br />
Switches display of the Tool Bar on or off.<br />
Displays all open windows in an overlapping arrangement.<br />
Displays all open windows in a above-below arrangement.<br />
Displays all open windows in a side-by-side arrangement.<br />
Arranges minimized windows at the bottom of the display.<br />
Displays a list of open windows.<br />
Help<br />
Help Displays online help. You can also select F1.<br />
Help Topics<br />
Update License<br />
Display License<br />
Information<br />
About USB <strong>USBTracer</strong><br />
Displays online help.<br />
Opens a dialog box for updating your <strong>LeCroy</strong> license.<br />
Displays information related to licensing.<br />
Displays version information about USB <strong>USBTracer</strong>.<br />
38
<strong>LeCroy</strong> <strong>USBTracer</strong>/<strong>Trainer</strong> User <strong>Manual</strong><br />
SW Version 2.20<br />
5.4 View Options<br />
You can hide, display or reset toolbars by selecting<br />
View > Tool bars from the menu bar.<br />
Resetting the Toolbar<br />
From time to time (such as following a software<br />
upgrade), it is possible for the buttons on the toolbar<br />
to not match their intended function. You can reset<br />
the toolbar by performing the following steps:<br />
Step 1<br />
Step 2<br />
Select View > Tool bars from the menu bar.<br />
Select Customize from the submenu to display the Customize<br />
dialog box.<br />
39
<strong>LeCroy</strong> <strong>USBTracer</strong>/<strong>Trainer</strong> User <strong>Manual</strong><br />
SW Version 2.20<br />
Step 3<br />
Select the Toolbars tab to display the Toolbars page of the<br />
Customize dialog box.<br />
Step 4<br />
Click the Reset All button.<br />
The toolbar resets to the factory defaults.<br />
Tool Bar<br />
The Tool Bar provides quick and convenient access to the most popular<br />
<strong>USBTracer</strong> program functions. Tool tips briefly describe the functionality<br />
of each icon and menu item as the mouse arrow is moved over the icon/item.<br />
Open file<br />
Find Next<br />
Save As<br />
File Information Report<br />
Preview<br />
Error Report<br />
Edit as Text<br />
Timing and Bus Usage Calculations<br />
Print…<br />
Traffic Summary<br />
Setup Record Options<br />
Bus Utilization<br />
40
<strong>LeCroy</strong> <strong>USBTracer</strong>/<strong>Trainer</strong> User <strong>Manual</strong><br />
SW Version 2.20<br />
Setup Display Options<br />
Open the Navigator bar<br />
Start Recording<br />
Display Packets<br />
Stop Recording<br />
Display Transactions<br />
Display Realtime Statistics.<br />
Display Split Transactions<br />
Zoom In<br />
Display Transfers<br />
Zoom Out<br />
Display Host Wire Adapter Segments<br />
Wrap<br />
Display Host Wire Adapter Transfers<br />
Hide SOFs<br />
Display Device Wire Adapter Segments<br />
Hide NAK’ed transactions.<br />
Hide Devices<br />
Display Device Wire Adapter Transfer<br />
Start or Stop Traffic Generation (available if<br />
you have the USB<strong>Trainer</strong> modul)e.<br />
Hide Chirps<br />
Bitstream and Intelliframe modes<br />
Assign High Level Decodes.<br />
Repeat Upload<br />
Find<br />
Repeat Mode. This button becomes active<br />
when a traffic generation file (*.utg) is open.<br />
5.5 Status Bar<br />
The Status bar is located at the bottom of the main display window.<br />
Depending on the current activity, the bar can be divided into as many as<br />
four segments.<br />
41
<strong>LeCroy</strong> <strong>USBTracer</strong>/<strong>Trainer</strong> User <strong>Manual</strong><br />
SW Version 2.20<br />
Recording Progress<br />
When you begin recording, the left-most segment of the Status Bar displays<br />
a Recording Progress Indicator:<br />
As recording progresses, the Progress Indicator changes to reflect the<br />
recording progress graphically:<br />
• In the Progress Indicator, a black vertical line illustrates the<br />
location of the Trigger Position you selected in Recording Options.<br />
— Pre-Trigger progress is displayed in the field to the left of the<br />
Trigger Position in the before-Trigger color specified in the<br />
Display Options.<br />
— When the Trigger Position is reached, the progress indicator<br />
wiggles as it waits for the trigger.<br />
— After the trigger occurs, the field to the right of the Trigger<br />
Position fills in the after-Trigger color specified in the Display<br />
Options.<br />
— When recording is complete, the upper half of the progress<br />
indicator fills in white, indicating the progress of the data<br />
upload to the host computer.<br />
You should be aware of two exceptional conditions:<br />
• If a Trigger Event occurs during the before-Trigger recording, the<br />
before-Trigger color changes to the after-Trigger color to indicate<br />
that not all the expected data was recorded pre-Trigger.<br />
• When you click Stop before or after a Trigger Event, the Progress<br />
Bar adjusts accordingly to begin uploading the most recently<br />
recorded data.<br />
The Progress Bar fills with color in proportion to the specified size and<br />
actual rate at which the hardware is writing and reading the recording<br />
memory. However, the Progress Indicator is normalized to fill the space<br />
within the Status Bar.<br />
42
<strong>LeCroy</strong> <strong>USBTracer</strong>/<strong>Trainer</strong> User <strong>Manual</strong><br />
SW Version 2.20<br />
Recording Status<br />
During recording, the current Recording Status is displayed in the next<br />
segment. When you activate the Record function, this segment flashes one<br />
of the following messages (depending on the selected Recording Options):<br />
• Trigger?<br />
• Triggered!<br />
• Uploading<br />
After recording stops,<br />
• The flashing message changes to Uploading data–x% done (x%<br />
indicates the percentage completion of the data uploading process).<br />
• The traffic data is copied to disk (overwriting any previous version<br />
of this file) using the default file name data.usb. If two channels of<br />
traffic are recorded, <strong>USBTracer</strong> creates two files:data_0.usb and<br />
data_1.usb. You can also create a file name of your choice by<br />
specifying one in the Recording Options dialog box.<br />
To abort the upload process:<br />
• Press Esc on your keyboard<br />
OR<br />
• Again click in the Tool Bar.<br />
You are asked if you want to keep or discard the partially uploaded data.<br />
Note: While uploading is in progress, clicking the stop button again brings<br />
up a dialog opens a dialog that allows you to do a partial upload, flush the<br />
current file, keep what has uploaded at this point, and to continue uploading.<br />
43
<strong>LeCroy</strong> <strong>USBTracer</strong>/<strong>Trainer</strong> User <strong>Manual</strong><br />
SW Version 2.20<br />
The Partial Upload button is enabled when you have partially uploaded data.<br />
When you click Partial Upload, a dialog box appears that gives you options<br />
on what portion of data you want to upload again.<br />
When the data is saved, the Recorded Data file appears in the main display<br />
window and the Recording Status window is cleared.<br />
Recording Activity<br />
• If the recording resulted from a Trigger Event, the first packet<br />
following the Trigger (or the packet that caused the Trigger) is<br />
initially positioned second from the top of the display.<br />
• If the recording did not result from a Trigger Event, the display<br />
begins with the first packet in the traffic file.<br />
During recording, the fourth segment from the left of the Status Bar displays<br />
Recording activity as a series of vertical bars.<br />
The more vertical bars that are displayed, the greater the amount of activity<br />
being recorded. If there are no vertical bars, there is no recorded activity.<br />
During uploading, the percent of the completed upload is displayed.<br />
Note<br />
If packets are filtered from the recording or data are truncated,<br />
the recording activity is reduced.<br />
44
<strong>LeCroy</strong> <strong>USBTracer</strong>/<strong>Trainer</strong> User <strong>Manual</strong><br />
SW Version 2.20<br />
Search Status<br />
The rightmost segment displays the current search direction: Fwd (forward)<br />
or Bwd (backward). Change the search direction from the Search Menu or<br />
double-click in the Search Status segment.<br />
5.6 Navigation Tools<br />
You can zoom in and out, and wrap packets/transactions/transfers to fit<br />
within the screen using the following buttons:<br />
Zoom In<br />
Zoom In increases the size of the displayed elements, allowing fewer (but<br />
larger) packet fields per screen.<br />
• Click on the Tool Bar.<br />
Zoom Out<br />
Zoom Out decreases the size of the displayed elements, allowing more (but<br />
smaller) packet fields per screen.<br />
• Click on the Tool Bar.<br />
Wrap<br />
Select Wrap to adjust the Trace View so that packets fit onto one line. If a<br />
packet is longer than the size of the window, the horizontal scroll bar can be<br />
used to see the hidden part of the packet.<br />
• Click on the Tool Bar or select Wrap under View on the Menu<br />
Bar.<br />
45
<strong>LeCroy</strong> <strong>USBTracer</strong>/<strong>Trainer</strong> User <strong>Manual</strong><br />
SW Version 2.20<br />
5.7 <strong>USBTracer</strong> Analyzer Keyboard Shortcuts<br />
Several frequently-used operations are bound to keyboard shortcuts.<br />
Table 1: Keyboard Shortcuts<br />
Operation<br />
Key Combination<br />
Trace Navigation<br />
Find Next<br />
Search Backwards<br />
Search Forwards<br />
Jump to First Packet<br />
Jump to Last Packet<br />
Go to Any Error<br />
Go to Channel 0<br />
Go to Channel 1<br />
F3<br />
Ctrl+B<br />
Ctrl+F<br />
Ctrl+Home<br />
Ctrl+End<br />
Shift+E<br />
Ctrl+Shift+0<br />
Ctrl+Shift+1<br />
PID<br />
Go to ACK<br />
Go to DATA0<br />
Go to DATA1<br />
Go to DATA2<br />
Go to DATAx<br />
Go to IN<br />
Go to MDATA<br />
Go to NAK<br />
Go to NYET<br />
Go to OUT<br />
Go to PING<br />
Go to PRE/ERR<br />
Go to SETUP<br />
Go to SOF<br />
Go to SPLIT<br />
Go to STALL<br />
Shift+A<br />
Shift+0<br />
Shift+1<br />
Shift+2<br />
Shift+D<br />
Shift+I<br />
Shift+M<br />
Shift+N<br />
Shift+Y<br />
Shift+O<br />
Shift+G<br />
Shift+P<br />
Shift+S<br />
Shift+F<br />
Shift+X<br />
Shift+L<br />
46
<strong>LeCroy</strong> <strong>USBTracer</strong>/<strong>Trainer</strong> User <strong>Manual</strong><br />
SW Version 2.20<br />
Bus Conditions<br />
Go to Reset<br />
Go to Resume<br />
Go to SE0<br />
Go to SE1<br />
Go to Keep-Alive<br />
Go to Suspend<br />
Go to Chirp<br />
Go to Full Speed J<br />
Go to Full Speed K<br />
Shift+T<br />
Shift+6<br />
Shift+Z<br />
Shift+7<br />
Shift+5<br />
Shift+U<br />
Shift+C<br />
Shift+J<br />
Shift+K<br />
OTG<br />
Go to SRP<br />
Go to HNP<br />
Go to VBus Voltage Change<br />
Go to OTG Host A<br />
Go to OTG Host B<br />
Ctrl+Q<br />
Shift+H<br />
Shift+V<br />
Ctrl+Shift+A<br />
Ctrl+Shift+B<br />
Misc.<br />
Marker Menu<br />
Open File<br />
Print…<br />
Record<br />
Stop Recording<br />
Open Display Options dialog<br />
Open Recording Options dialog<br />
Hide SOFs<br />
Hide NAKs<br />
Hide Chirps<br />
Apply Decoding Scripts<br />
Ctrl+M<br />
Ctrl+O<br />
Ctrl+P<br />
Ctrl+R<br />
Ctrl+T<br />
Ctrl+Shift+D<br />
Ctrl+Shift+R<br />
Ctrl+Shift+S<br />
Ctrl+Shift+N<br />
Ctrl+Shift+C<br />
Ctrl+Shift+Y<br />
47
<strong>LeCroy</strong> <strong>USBTracer</strong>/<strong>Trainer</strong> User <strong>Manual</strong><br />
SW Version 2.20<br />
48
<strong>LeCroy</strong> <strong>USBTracer</strong>/<strong>Trainer</strong> User <strong>Manual</strong><br />
SW Version 2.20<br />
6. Recording Options<br />
Use Recording Options to create and change various features that control<br />
the way information is recorded by the <strong>USBTracer</strong> Analyzer.<br />
To open the Recording Options dialog box:<br />
• Select Recording Options under Setup on the Menu Bar.<br />
OR<br />
• Click on the Tool Bar.<br />
You see the Recording Options dialog box:<br />
The Recording Options window always opens with the General tab<br />
showing.<br />
49
<strong>LeCroy</strong> <strong>USBTracer</strong>/<strong>Trainer</strong> User <strong>Manual</strong><br />
SW Version 2.20<br />
6.1 General Recording Options<br />
The General Recording Options allow you to select or adjust the recording<br />
type, the buffer size, the amount of post-trigger recording, and the trace<br />
filename and path.<br />
Recording Type<br />
The Recording Type box presents three options that allow<br />
you to set how <strong>USBTracer</strong> begins and ends a recording.<br />
The options are: Snapshot, <strong>Manual</strong> Trigger, and Event<br />
Trigger.<br />
Snapshot<br />
A Snapshot is a fixed-length recording. The size of this recording is set by<br />
the Buffer Size box. Recording begins when<br />
when either the selected buffer size is filled or the<br />
is clicked and ends<br />
button is pressed.<br />
<strong>Manual</strong> Trigger<br />
A <strong>Manual</strong> Trigger is a recording whose trigger point is caused by pressing<br />
the trigger button on the front panel.<br />
Recording begins when you click on the Tool Bar. Recording<br />
continues in a circular manner within the limits set by the buffer size.<br />
Recording ends when is clicked on the Tool Bar or after post-trigger<br />
memory has been filled following depression of the trigger button on the<br />
front panel.<br />
Event Trigger<br />
Recording begins when you click<br />
on the Tool Bar.<br />
Recording continues in a circular manner within the limits set by the buffer<br />
size until an event is detected that meets the Trigger conditions specified in<br />
the Triggering Options and the defined amount of data has been recorded<br />
after the Trigger Event.<br />
50
<strong>LeCroy</strong> <strong>USBTracer</strong>/<strong>Trainer</strong> User <strong>Manual</strong><br />
SW Version 2.20<br />
Options<br />
• Truncate Data Fields: Allows data fields to be truncated during<br />
recording in order to save Analyzer memory and allow recording of<br />
more packets. Enter a minimum data length value in the Bytes box.<br />
<strong>USBTracer</strong> truncates the data to the stated value or slightly larger.<br />
Note<br />
Truncation of data may cause incorrect transaction or transfer<br />
decoding.<br />
• Beep When Trigger Occurs: The computer connected to the<br />
<strong>USBTracer</strong> beeps three times when a Trigger condition is first<br />
detected.<br />
• Auto-Merge 2 Channel Trace Files: Causes <strong>USBTracer</strong> to merge<br />
traffic of the two recording channels into a file called<br />
data_merged.usb (or whatever name you wish to give it).<br />
<strong>USBTracer</strong> also makes two other files during this recording:<br />
data_0.usb and data_1.usb (or whatever names you choose to give<br />
them). If unchecked, <strong>USBTracer</strong> creates only two files: one for<br />
Classic-Speed traffic and another for Hi-Speed traffic.<br />
• Save External Interface Signals: Causes <strong>USBTracer</strong> to save<br />
signals from a Break-out board (pins Data7 - Data0) as fields in the<br />
trace.<br />
• Trigger/Filter Channel: Presents a choice of Channel 0 or<br />
Channel 1. The selected choice tells <strong>USBTracer</strong> what channel it<br />
should use to perform its triggers/filters. If you want to set<br />
triggers/filters on both channels, then you must select a channel,<br />
assign trigger/filter events and actions, then select the other channel<br />
and assign trigger filter events and actions to it. In other words, you<br />
must set your events and actions twice - once for each channel. The<br />
channel you are currently applying the triggers/filters to is shown in<br />
the Dialog Title Bar.<br />
Buffer Size<br />
You can adjust the size of the recording buffer from 0.4 megabytes to 512<br />
megabytes.<br />
The Recording type option determines how this buffer is used. Although<br />
there are 512 megabytes of physical memory in the Analyzer, the efficiency<br />
of the recording is about a 2:1 ratio of physical memory to actual USB<br />
traffic. Shorter USB packets yield a slightly less efficient recording. The<br />
non-traffic portion of physical memory is utilized for control and timing<br />
information.<br />
51
<strong>LeCroy</strong> <strong>USBTracer</strong>/<strong>Trainer</strong> User <strong>Manual</strong><br />
SW Version 2.20<br />
Note<br />
The scale is not linear and affords more granularity in the smaller<br />
buffer sizes.<br />
Trigger Position<br />
You can adjust the amount of recording to be done post-Trigger or select<br />
where you want the Trigger located within the defined buffer. You can<br />
adjust the Triggering Position between 1 and 99% post-Trigger. Trigger<br />
Position is available only when <strong>Manual</strong> Trigger or Event Trigger is<br />
selected as Recording type.<br />
As an example, if the buffer size is set to 16MB, then for the following<br />
Trigger Position settings, the amount of pre- and post-Trigger data is<br />
• 95% post-triggering: 0.8MB pre-trigger, 15.2MB post-trigger<br />
• 75% post-triggering: 4MB pre-trigger, 12MB post-trigger<br />
• 50% post-triggering: 8MB pre-trigger, 8MB post-trigger<br />
• 25% post-triggering: 12MB pre-trigger, 4MB post-trigger<br />
• 5% post-triggering: 15.2MB pre-trigger, 0.8MB post-trigger<br />
Note<br />
When a Trigger occurs, recording continues until the<br />
post-Trigger amount of the buffer is filled or when Stop is<br />
selected.<br />
Options Name<br />
The Options Name is a descriptive label of the current Recording Options<br />
settings. Options Names are associated with files that have a .rec suffix.<br />
The default option name is default. Default preserves the current Recording<br />
Options settings.<br />
The purpose of the Options Name box is to give you a place to preserve<br />
different Recording Options that you use on a recurrent basis. For example,<br />
if you use two or three different Recording Options configurations, you can<br />
save these configurations and load them the next time they are needed.<br />
Because Options Names are descriptive labels and not file names, you can<br />
enter in any text you like into the box. Your labels can be very descriptive<br />
such as "Trigger on High Speed traffic when CRC errors occur."<br />
To create a new Recording Options name:<br />
Step 1<br />
Step 2<br />
Enter a comment for the new file in the Options Name field.<br />
Click Save to display the Save As window.<br />
52
<strong>LeCroy</strong> <strong>USBTracer</strong>/<strong>Trainer</strong> User <strong>Manual</strong><br />
SW Version 2.20<br />
Step 3<br />
Step 4<br />
Specify a filename (*.rec)<br />
Click Save.<br />
To load a Recording Options name:<br />
Step 1<br />
Step 2<br />
Click Load to display the Open window.<br />
From the list of .rec files, select the one that represents your Options<br />
Name.<br />
The options settings for that name then display.<br />
Trace File Name & Path<br />
Trace File Name & Path opens a Save As dialog box for saving your trace<br />
file. The default recording file name is data.usb for Low, Full, and High<br />
Speed recordings. If you are recording on both channels, then <strong>USBTracer</strong><br />
creates two files: data_0.usb for Channel 0, and data_1.usb for Channel 1.<br />
• Click Trace File Name & Path.<br />
You see a Save As… window in which to enter the recording file name<br />
*.usb for all subsequent recordings.<br />
53
<strong>LeCroy</strong> <strong>USBTracer</strong>/<strong>Trainer</strong> User <strong>Manual</strong><br />
SW Version 2.20<br />
6.2 Recording Options - Misc<br />
The Misc page presents options for setting:<br />
• Analyzer speed<br />
• Device emulation<br />
• OTG<br />
• Clocking Overrides<br />
• Traffic Generation<br />
54
<strong>LeCroy</strong> <strong>USBTracer</strong>/<strong>Trainer</strong> User <strong>Manual</strong><br />
SW Version 2.20<br />
Analyzer Speed<br />
This option sets the speed of the traffic recorded by the analyzer. Normally,<br />
the default setting "Auto-detect" is used. This setting tells the analyzer to<br />
discover what speed traffic is running and to label packets accordingly. If<br />
you are having problems with your recordings, you might try setting the<br />
traffic speed to one of the fixed values -- Low, Full, and Hi speed. These<br />
settings are used when you want to manually set the traffic speed.<br />
In some rare cases, auto-detection circuitry causes Full Speed devices to fail<br />
to enumerate on plug-in. Changing the analyzer speed to Full Speed can<br />
sometimes solve this problem.<br />
Setting the speed to one of the fixed values is sometimes useful for<br />
debugging purposes. For example, if a device that is producing numerous<br />
errors at a particular speed, you may wish to set the recording to that speed<br />
in order to ensure that the analyzer does not misread the error packets and<br />
label them the wrong speed. While it is unlikely that the analyzer will<br />
mislabel packets in this way, manually setting the recording speed<br />
guarantees that the analyzer always records packets at the correct speed.<br />
You can set the speed for one or both channels.<br />
Notes on Hi Speed Recordings<br />
Erroneous chirp blocks can be recorded on an idle bus when the Device has<br />
its FS terminations on while the Host has HS terminations connected. This<br />
causes a small differential voltage (a.k.a "tiny-J") on the USB bus that<br />
causes false Chirp detection.<br />
This condition occurs during speed negotiation:<br />
• On a HS bus, the condition is momentary just before the device<br />
chirps.<br />
• On a CS bus, the condition occurs both before and after the device<br />
chirp (until the end of Reset). The user is discouraged from using<br />
"Speed=HIGH" to record signals on a classic speed bus.<br />
• The analyzer stops recording anything for 2.5 milliseconds<br />
following a FS_K state (which is at least 2 microseconds long).<br />
This is to avoid presenting "garbage" which is a by-product of the<br />
high-speed probe settling down.<br />
55
<strong>LeCroy</strong> <strong>USBTracer</strong>/<strong>Trainer</strong> User <strong>Manual</strong><br />
SW Version 2.20<br />
Generator/Analyzer Clocking Overrides<br />
Generator/Analyzer Clocking Overrides allows changes to be made to the<br />
analyzer/generator clocking. Select Slow Clock, then enter a value in the<br />
box on the right. The value that is entered tells the analyzer how much to<br />
divide the base clock by. For example, entering a 4 causes Full Speed traffic<br />
to be generated at a 3-megabit rate as opposed to the standard 12-megabit<br />
rate.<br />
USB On-The-Go<br />
USB On-The-Go option sets analyzer to record the USB On-The-Go<br />
traffic. This protocol lets you run two devices, specify one of them as the<br />
host, one of them as the device, and to assign each device a name.<br />
USB<strong>Trainer</strong> Generator-related Parameters<br />
Default to IntelliFrame Mode sets IntelliFrame default to "ON."<br />
In IntelliFrame mode, the generator can wait for Device responses to<br />
complete before it continues generating more host packets. For example,<br />
after issuing an IN, the generator looks for the DATAx packet issued by the<br />
device to finish, and then issues an ACK. This way, the data length can vary<br />
and does not need to be pre-calculated. Also, using the "idle=TO_EOF"<br />
statement allows the generator to calculate where the end of the frame<br />
occurs, so that a subsequent "frame=AUTO" statement creates a Start of<br />
Frame at the correct time. Moreover, the Generator can be made to retry<br />
transactions that are NAKed automatically, and to use the PING protocol<br />
where appropriate. Retries can be made to occur within the same frame or<br />
in the next frame. For further information on the flexible behavior that can<br />
be instituted during the generation, see the syntax descriptions for the<br />
generation files. An additional advantage of the IntelliFrame mode is that it<br />
creates an image in the Generator’s memory that is MUCH smaller than that<br />
of the Bitstream mode, so it downloads much faster.<br />
Disable Generator Memory [allow 512 MB traces with a USB<strong>Trainer</strong><br />
plug-in] allows you to specify 512 MB traces on systems with a<br />
USB<strong>Trainer</strong> plug-in.<br />
Device Emulation Mode [tracing limited to Channel 0 only]: Allows<br />
changes to the Resume time and the device address.<br />
Device Resumes: If checked, the Device is responsible for issuing the<br />
Resume signal after waiting the specified amount of time following a<br />
suspend. If the Device Resumes option is not selected, the device waits<br />
indefinitely for the Host to resume signalling.<br />
56
<strong>LeCroy</strong> <strong>USBTracer</strong>/<strong>Trainer</strong> User <strong>Manual</strong><br />
SW Version 2.20<br />
Delay Time: The time (in milliseconds) to wait after suspend before<br />
initiating a Resume.<br />
Resume Time: The Resume Time (in milliseconds) is used to configure<br />
how long a device should issue a Resume (K) signal once the delay time has<br />
occurred. Be careful to make this shorter than what the host does once it<br />
recognizes the Resume signal as a Remote Wakeup.<br />
If the Device Resumes option is not selected, the device waits indefinitely<br />
for the Host to resume signalling.<br />
• Use Address in .utg file: Causes the analyzer to use whatever<br />
Device address has been specified in the.utg file.<br />
• Emulate Device’s Hex Address: Allows the user to specify a<br />
different address than the one specified in the .utg file. This option<br />
is useful in cases where the host does not use the same address each<br />
time.<br />
• Chirp Reset Length: Allows the Reset Length for Chirps to be<br />
edited. The default is 50 milliseconds. (Host generation only).<br />
57
<strong>LeCroy</strong> <strong>USBTracer</strong>/<strong>Trainer</strong> User <strong>Manual</strong><br />
SW Version 2.20<br />
6.3 Slow Clock Selection<br />
You can use the slow clock selection to slow down the base clock during<br />
generation. This also changes the Analyzer’s clock base to match.<br />
Step 1<br />
Step 2<br />
Step 3<br />
Step 4<br />
In the Misc tab, make sure you are out of Auto-Detect mode.<br />
Select the Slow Clock checkbox.<br />
In the Divide By field, enter a value.<br />
Click OK.<br />
Using this feature for Hi-Speed requires a License Key from <strong>LeCroy</strong>.<br />
Contact your <strong>LeCroy</strong> representative.<br />
58
<strong>LeCroy</strong> <strong>USBTracer</strong>/<strong>Trainer</strong> User <strong>Manual</strong><br />
SW Version 2.20<br />
6.4 Events Recording Options<br />
The Event triggering and filtering options allow you to set specific<br />
parameters for each Event Group. When an Event Group is selected, a field<br />
appears that allows you to select specific conditions within the<br />
corresponding Event Group. As details are selected, other Event Group<br />
details may become "grayed out" because of limited hardware resources in<br />
the Analyzer. Information about the resources available is displayed below<br />
the Event Group details. When a detail is grayed out, it is inactive and<br />
cannot be selected. If an Event Group remains inactive, the current version<br />
of the application or BusEngine does not support it.<br />
Click the Events tab on the Recording Options screen to display the Event<br />
Groups dialog box:<br />
59
<strong>LeCroy</strong> <strong>USBTracer</strong>/<strong>Trainer</strong> User <strong>Manual</strong><br />
SW Version 2.20<br />
Packet Identifiers<br />
Select Packet Identifiers under Event Groups. You see the Packet<br />
Identifiers window:<br />
The Packet Identifier (PID) field lists the available packet types. Select up<br />
to three packet types to use as a Recording Trigger.<br />
Token Patterns<br />
Select Token Patterns under Event Groups. You see the Token Patterns<br />
window:<br />
Specify up to three combinations of Address/Endpoint with any of the token<br />
PIDs. They can be triggered on or filtered in/out.<br />
60
<strong>LeCroy</strong> <strong>USBTracer</strong>/<strong>Trainer</strong> User <strong>Manual</strong><br />
SW Version 2.20<br />
Frame Patterns<br />
Select Frame Patterns under Event Groups. You see the Frame Patterns<br />
window:<br />
Identify frame patterns you want either to filter out of a Trace View or to use<br />
as a Trigger. You can select either All Start of Frame packets (SOF) to be<br />
filtered out or specify the Frame Number of a frame to trigger on.<br />
Device Requests<br />
Select Device Requests under Event Groups. You see the Device<br />
Requests window:<br />
61
<strong>LeCroy</strong> <strong>USBTracer</strong>/<strong>Trainer</strong> User <strong>Manual</strong><br />
SW Version 2.20<br />
Data Pattern<br />
You can select one or two Device Requests for triggering or filtering.<br />
Select Data Pattern under Event Groups. You see the Data Pattern<br />
window:<br />
Enter a Data Pattern to be triggered upon or click Edit to open a pattern<br />
editor and enter data on a bit-by-bit basis.<br />
62
<strong>LeCroy</strong> <strong>USBTracer</strong>/<strong>Trainer</strong> User <strong>Manual</strong><br />
SW Version 2.20<br />
Step 1<br />
Press the Edit button.<br />
You see a Bit-by-Bit window:<br />
Step 2<br />
Click your mouse on the bits within each byte that you wish to edit<br />
and enter in the appropriate text.<br />
The Mask and Match fields change to reflect your changes.<br />
63
<strong>LeCroy</strong> <strong>USBTracer</strong>/<strong>Trainer</strong> User <strong>Manual</strong><br />
SW Version 2.20<br />
Bus Conditions<br />
Select Bus Conditions under Event Groups. You see the Bus Conditions<br />
window:<br />
Errors<br />
Use any combination of the listed errors as a Trigger.<br />
Select Errors under Event Groups. You see the Errors window:<br />
64
<strong>LeCroy</strong> <strong>USBTracer</strong>/<strong>Trainer</strong> User <strong>Manual</strong><br />
SW Version 2.20<br />
Use any combination of the listed errors as a Trigger.<br />
• Bit Stuffing, Frame-Length, CRC, Pid, EOP, Short Byte<br />
checkboxes: Select one or more of these errors to set these as the<br />
basis for triggering or filtering. A Short Byte is a condition where<br />
EOP begins on a non-byte boundary.<br />
• Time-out Violation - Select this checkbox and then enter in the<br />
Turn-around time in the text box. This value tells the analyzer how<br />
much time should elapse before triggering/filtering. Clocks are 60<br />
MHz (with a resolution of 16.66 ns).<br />
• Excessive Empty Frame Detection - Select this option and enter<br />
the empty frame count in the text box. This value tells the analyzer<br />
how many frames should elapse before triggering/filtering.<br />
• Babble Start Violation - Select this checkbox to trigger or filter<br />
whenever the start of a packet occurs too late in a Frame.<br />
• Babble End Violation (or LOA) - Select this to trigger/filter when<br />
the end of a packet occurs too late in a Frame. Enter a value in the<br />
EOF offset box from 1 to 65,535 clocks to indicate the size of the<br />
offset from start of previous SOF.<br />
• Bad Data Toggle - Select this checkbox to trigger or filter<br />
whenever a Data0, Data1, Data2 toggle violation occurs.<br />
— Select IN or OUT if you only want triggering/filtering to<br />
occur only on IN or OUT transactions.<br />
— Check Incl Reset if you want the first toggle value after a<br />
reset to be considered "good" regardless of the value prior to<br />
that reset. If Unchecked, the toggle state is assumed to be<br />
preserved through the reset.<br />
— Select Addr and/or Endp to select Token Addresses and/or<br />
Endpoints.<br />
65
<strong>LeCroy</strong> <strong>USBTracer</strong>/<strong>Trainer</strong> User <strong>Manual</strong><br />
SW Version 2.20<br />
External Input Signals<br />
Select External Input Signals under Event Groups. You see the External<br />
Input Signals window:<br />
This window has three checkboxes: Input 0 (TRIG IN 0), Input 1<br />
(TRIGGER IN 1), and Input 2 (Ext. 1 or Ext. IN). Use any combination<br />
of the inputs as a Trigger.<br />
Transactions<br />
Select Transactions under Event Groups. You see the Transactions<br />
window:<br />
Use any combination of the listed errors as a Trigger.<br />
66
<strong>LeCroy</strong> <strong>USBTracer</strong>/<strong>Trainer</strong> User <strong>Manual</strong><br />
SW Version 2.20<br />
Data Length<br />
Select Data Length under Event Groups. You see the Data Length<br />
window:<br />
To trigger on data length, enter a value between 0 and 1024 in the box<br />
marked Data Length.<br />
67
<strong>LeCroy</strong> <strong>USBTracer</strong>/<strong>Trainer</strong> User <strong>Manual</strong><br />
SW Version 2.20<br />
Splits<br />
Select Splits under Event Groups. You see the following window.<br />
To trigger on splits, select a split type, and endpoint type, and an address.<br />
You can also select FS Isoch Out when you select the Isoch endpoint type.<br />
Extern Data7 - Data0 In<br />
Select Extern Data7 - Data0 In under Event Groups.<br />
To trigger on Extern Data 7 - Data0 In, enter values in the Match and Mask<br />
fields.<br />
68
<strong>LeCroy</strong> <strong>USBTracer</strong>/<strong>Trainer</strong> User <strong>Manual</strong><br />
SW Version 2.20<br />
6.5 Actions Recording Options<br />
The Actions screen serves as a means of setting Triggers, Filters (In or<br />
Out), and Counts for the events selected in the Events window.<br />
Actions Window Layout<br />
The Actions window divides into three sections: left, center, and right.<br />
The left section displays buttons for the events selected in the Events<br />
window. Events buttons tell <strong>USBTracer</strong> what it should look for during a<br />
recording. The number of Event buttons displayed depends on the number<br />
of Events selected in the Events window. If no Events were selected, no<br />
Event buttons are displayed.<br />
The right side of the window displays a pair of counters called Count1 and<br />
Count2. Counters provide a way for setting triggers based on a passage of<br />
a certain number of events. When an event is linked to a counter, the counter<br />
appears below the event on the left side of the screen.<br />
The right section displays three Action buttons: Trigger, Filter Out, and<br />
Restart. Action buttons controls <strong>USBTracer</strong>’s response to Event<br />
conditions. For example, if an Error button is linked to a Trigger button, the<br />
Action button tells <strong>USBTracer</strong> to trigger when the error condition occurs.<br />
The lines that join the different buttons indicate the links between Actions<br />
and Events.<br />
69
<strong>LeCroy</strong> <strong>USBTracer</strong>/<strong>Trainer</strong> User <strong>Manual</strong><br />
SW Version 2.20<br />
6.6 Connecting Events to Actions<br />
To create or edit links between Event buttons, Counters, and Action buttons,<br />
you click an Event button and then click a Counter or Action. By clicking<br />
an Event, an arrow connects the Event button to the cursor. When you click<br />
a Counter or Action button, the arrow becomes anchored to the selected<br />
button.<br />
To make an association:<br />
Step 1<br />
Step 2<br />
Step 3<br />
Step 4<br />
Step 5<br />
Select one or more Events from the Events window.<br />
Open the Actions window.<br />
Click the left mouse button on an Event button such as Errors.<br />
The elastic arrow appears.<br />
Point your mouse at the desired Action<br />
button.<br />
The elastic arrow moves with your mouse<br />
pointer.<br />
With the pointer over an Actions button, click again the left mouse<br />
button again.<br />
The arrow is anchored to the Action button. replaced with a black<br />
line connecting the Event button to the Action button.<br />
6.7 Connecting Counters to Events<br />
The right side of the Actions window contains two Counter<br />
buttons marked Count1 and Count2. These counters provide<br />
a way of triggering after a number of events have passed,<br />
such as "Trigger after the 20th IN packet."<br />
70
<strong>LeCroy</strong> <strong>USBTracer</strong>/<strong>Trainer</strong> User <strong>Manual</strong><br />
SW Version 2.20<br />
When an event is linked to a counter, the counter appears under that event<br />
on the left side of the Actions window. Counters have blue dots in their top<br />
left corner that provide access to pop-up menus. The menus provide the<br />
means of setting the counter value. The counter can be set between 1 and<br />
65,535.<br />
To connect an event to a counter,<br />
Step 1<br />
Step 2<br />
Step 3<br />
Step 4<br />
Step 5<br />
Open the Event window and select an Event.<br />
An Event button appears in the Actions window.<br />
Open the Actions window.<br />
The window displays an Event button that is connected to the<br />
Trigger button on the right via a line.<br />
Click the Event button.<br />
An arrow connects the Event button to the mouse pointer.<br />
Click one of the two counters.<br />
The Event automatically connects to the Counter button and then<br />
connects to the Trigger button.<br />
Click the blue dot in top left corner of<br />
your selected counter.<br />
A pop-up menu opens to allow you to<br />
configure the counter.<br />
71
<strong>LeCroy</strong> <strong>USBTracer</strong>/<strong>Trainer</strong> User <strong>Manual</strong><br />
SW Version 2.20<br />
Step 6<br />
Step 7<br />
Choose Change Counter Value to open the Input Counter Value<br />
dialog box.<br />
Set the counter to a value of your<br />
choice, then click OK.<br />
The Input Counter Value dialog<br />
box closes, and the Counter button<br />
displays your selection.<br />
Setting Multiple Conditions with Counters<br />
You can create multiple event conditions by linking two counters to two or<br />
more events.<br />
Linking Two Events to Two or More Counters - If an Event is linked to<br />
Count1 and a second event is linked to Count2, it creates an "or" statement.<br />
This statement reads "Trigger when Count1 OR Count2 has reached their<br />
specified values."<br />
This example reads "Trigger when Count1 has counted 9 Out<br />
packets or Count2 has counted 9 In packets."<br />
72
<strong>LeCroy</strong> <strong>USBTracer</strong>/<strong>Trainer</strong> User <strong>Manual</strong><br />
SW Version 2.20<br />
6.8 Using Action Buttons<br />
Trigger<br />
Restart<br />
The right section of the Actions window displays three<br />
Action buttons labeled Trigger, Filter Out/In, and Restart.<br />
The Trigger button enables event triggering.<br />
Restart causes counters to restart counting when a certain event occurs.<br />
When Restart is used, the screen has at least two links: one between an<br />
Event and the Restart button, and a second between an Event, Counter and<br />
an Action button.<br />
The screenshot below gives an example. The screen below reads "Look for<br />
IN and Out packets. When 10 OUT packets, trigger. However, if an IN<br />
packet occurs during the count, restart the count."<br />
Filter Out/In<br />
The Filter In/Out button causes events to be filtered in or out of the<br />
recording. Filter Out/In toggles between:<br />
• Filter In records ONLY those packets related to the specified<br />
event.<br />
• Filter Out records all packets EXCEPT those related to the<br />
specified event.<br />
73
<strong>LeCroy</strong> <strong>USBTracer</strong>/<strong>Trainer</strong> User <strong>Manual</strong><br />
SW Version 2.20<br />
Note<br />
Only events from the Token, Frame Event, Device Request, and<br />
Transaction Groups can be used to filter a recording.<br />
To filter in or out Token, Frame Event, Device Request, and/or Transaction<br />
Group events from a recording:<br />
Step 1<br />
Step 2<br />
Click the blue dot on Filter Out. (Note: the button<br />
may say Filter In depending on the last action<br />
specified.)<br />
You see the Filter Polarity menu:<br />
Use this menu to toggle the selection between Filter Out and Filter<br />
In.<br />
Select Filter In.<br />
The button changes to read Filter In.<br />
6.9 Other Actions: External Output Signals<br />
Most Event buttons can be configured to trigger external output signals.<br />
If a blue dot is present in the Event button, it means that a menu is present<br />
with three options for configuring external output signalling:<br />
• Enable External Trigger Output<br />
• Enable External Trigger Output only<br />
• External Trigger Form<br />
If you choose to enable External Output signalling, a small blue<br />
arrow projects from the Event button. This arrow is a reminder that<br />
External Signals have been set.<br />
To enable or disable external trigger output:<br />
Step 1<br />
Click the blue dot on an<br />
Event button.<br />
A menu similar to this one<br />
opens. Your menu may<br />
say "Disable" instead of<br />
"Enable."<br />
74
<strong>LeCroy</strong> <strong>USBTracer</strong>/<strong>Trainer</strong> User <strong>Manual</strong><br />
SW Version 2.20<br />
Step 2<br />
Select Enable External Trigger Output (or Disable External<br />
Trigger Output if that is the choice presented.)<br />
If you have chosen Enable External Trigger<br />
Output, a small arrow appears on the right side of<br />
the button. This arrow indicates that a condition has been set for<br />
creating an external output signal. Choosing Disable External<br />
Trigger causes the arrow to disappear.<br />
Enabling High Pulse, Low Pulse or Pulse Toggle Signal Outputs<br />
If you chose External Trigger Output in the previous steps, then an<br />
additional choice appears in the Blue Dot Menu called Enable External<br />
Trigger. This option lets you control the output signal.<br />
Step 1<br />
Step 2<br />
Click the blue dot on an event button that has a small arrow attached<br />
to it like the one shown above.<br />
A Blue Dot Menu opens. External Trigger Form should be an<br />
option. If it is not, choose Enable External Trigger and then reopen<br />
the menu.<br />
Choose External Trigger Form to display a menu with Pulse Low,<br />
Pulse High, and Toggle.<br />
Step 3<br />
Step 4<br />
Choose an option not currently selected.<br />
The menu closes.<br />
Reopen the menu.<br />
Note that your new selection is now checked.<br />
75
<strong>LeCroy</strong> <strong>USBTracer</strong>/<strong>Trainer</strong> User <strong>Manual</strong><br />
SW Version 2.20<br />
6.10 Saving Recording Options<br />
To complete your Recording Options settings, use the features at the bottom<br />
of the Recording Options screen. These features remain the same no matter<br />
which of the three Recording Options screens you are working in.<br />
• Click Save to save the currently specified Recording Options for<br />
use in future recording sessions. Any file name can be specified,<br />
though use of the .rec is recommended; if no extension is specified,<br />
.rec is added by default.<br />
• Click Load to load a previously saved *.rec file, thus restoring a<br />
previous set of Recording Options.<br />
• The Save as Default function is equivalent to the Save function,<br />
specifying the file name default.rec. Whenever you start up the<br />
Analyzer, it automatically loads the default.rec file if one exists.<br />
• Click OK to apply any changes and close this dialog box.<br />
• Click Cancel to cancel any immediate changes you have made and<br />
exit the Recording Options menu.<br />
6.11 Recording Bus Data<br />
To start recording USB traffic once the appropriate Recording Options have<br />
been set perform the following steps. Note: If you have inserted any event<br />
triggers, be sure to select Event Trigger under the General tab in the<br />
Recording Options dialog box.<br />
Step 1<br />
Select Start under Record on the Menu Bar<br />
OR<br />
Click<br />
on the Tool Bar.<br />
Your recording session can continue until it has finished naturally,<br />
or you may need to stop manually by clicking on the Tool Bar,<br />
depending on how you set the Recording Options.<br />
To manually stop recording:<br />
Step 2<br />
Select Stop under Record on the Menu Bar<br />
OR<br />
Click<br />
on the Tool Bar.<br />
Click again during the uploading to upload only a portion of the<br />
recorded memory.<br />
76
<strong>LeCroy</strong> <strong>USBTracer</strong>/<strong>Trainer</strong> User <strong>Manual</strong><br />
SW Version 2.20<br />
Note<br />
The manual Stop Recording feature is primarily of use when<br />
recording low-speed traffic, which can take a long time to fill the<br />
recording buffer.<br />
When the recording session is finished, the bus traffic is saved to the hard<br />
drive as a file named data.usb or whatever name you assign as the default<br />
filename.<br />
To save a current recording for future reference:<br />
Step 3<br />
Step 4<br />
Select Save As under File on the Menu Bar.<br />
OR<br />
Click<br />
on the Tool Bar.<br />
You see the standard Save As screen.<br />
Give the recording a unique name and save it to the appropriate<br />
directory.<br />
6.12 Merging Trace Files<br />
It is possible to merge a Classic-Speed trace file with a Hi-Speed trace file<br />
using the Merge Trace File command under the File menu. This option only<br />
works with files that were created simultaneously through a single recording<br />
session. If the files were recorded during separate recording sessions,<br />
<strong>USBTracer</strong> generates an error message and prevents the merge from<br />
completing.<br />
Note<br />
<strong>USBTracer</strong> is capable of merging High Speed and Classic<br />
Speeds traffic into a single merged file if the Auto-Merge 2<br />
Channel Trace Files option is checked in the Recording<br />
Options dialog box. See page 51 for details.<br />
77
<strong>LeCroy</strong> <strong>USBTracer</strong>/<strong>Trainer</strong> User <strong>Manual</strong><br />
SW Version 2.20<br />
To merge two trace files:<br />
Step 1<br />
Select File > Merge Trace Files to display a dialog box asking for<br />
the first source file.<br />
Note<br />
The Merge Trace Files command can be run with or without a<br />
trace file open on the screen. The merge process ignores the open<br />
file.<br />
Step 2<br />
Select the first trace file to be merged, then click Save.<br />
Note<br />
It does not matter which of the two trace files is first selected so<br />
long as both were recorded in the same session.<br />
Step 3<br />
Select the second trace file to be merged, then click Save.<br />
Confirm your choices.<br />
78
<strong>LeCroy</strong> <strong>USBTracer</strong>/<strong>Trainer</strong> User <strong>Manual</strong><br />
SW Version 2.20<br />
Step 4<br />
Click Yes.<br />
The two files are merged into the new file data_merged.usb.<br />
Note<br />
If you attempt to merge two files that were recorded in separate<br />
recording sessions, the following error message appears:<br />
79
<strong>LeCroy</strong> <strong>USBTracer</strong>/<strong>Trainer</strong> User <strong>Manual</strong><br />
SW Version 2.20<br />
80
<strong>LeCroy</strong> <strong>USBTracer</strong>/<strong>Trainer</strong> User <strong>Manual</strong><br />
SW Version 2.20<br />
7. Display Options<br />
You can select what information to display in Trace Views using the<br />
Display Options window.<br />
To open the Display Options window:<br />
• Select Display Options under Setup on the Menu Bar.<br />
OR<br />
• Click on the Tool Bar.:<br />
You can select General, Color/Format/Hiding, and Level Hiding display<br />
options. The following sections describe these display options.<br />
81
<strong>LeCroy</strong> <strong>USBTracer</strong>/<strong>Trainer</strong> User <strong>Manual</strong><br />
SW Version 2.20<br />
7.1 General Display Options<br />
You specify the main Trace View information types and settings using<br />
General Display Options (see figure on previous page):<br />
• Zoom Level: Zooms out from 100% (default) to 10% or zooms in<br />
from 100% to 200%.<br />
• Enable Tips: Pops up text when you position the cursor over a<br />
field.<br />
• Wrap: Wraps lines of traffic information instead of truncating lines<br />
at the right edge of the display.<br />
• Right click cell context menu: By default, clicking the left mouse<br />
button on a field heading displays a context-sensitive pop-up menu<br />
providing commands about the field and clicking the right mouse<br />
button pops up a menu with display options. After selecting this<br />
option, clicking the right mouse button on a field heading displays<br />
the context-sensitive pop-up menu and clicking the left mouse<br />
button does nothing.<br />
• Hierarchy Lines: Displays lines on the left side of Trace View<br />
showing the hierarchy from Packets to Transactions to<br />
Split Transactions to Transfers if you show higher-level decodes.<br />
• Timestamp Position: Aligns the Timestamp field<br />
"At the beginning" (in a column on the left side of the Trace View),<br />
"At the end" (in a column on the left side of the Trace View), or<br />
"Merge with Packet/TRanmsaction/Translation". Selecting this<br />
option allows easier comparison with previous or following<br />
timestamps.<br />
• Expand Packet Data Fields by default: Displays packet data<br />
fields in expanded mode. If this option is not selected, packet data<br />
fields display in collapsed mode, and you can expand them<br />
manually.<br />
• Allow any Toggle value after Bus Reset (Int and Bulk<br />
Endpoints): Depending on the device, after Bus Reset the endpoint<br />
toggle state might or might not be reset. Selecting this option<br />
prevents display of a toggle violation error.<br />
• Expand Script-Based Decoded Info by default: Displays<br />
decoded transfer fields in expanded mode. If this option is not<br />
selected, decoded transfer fields display in collapsed mode, and you<br />
can expand them manually.<br />
82
<strong>LeCroy</strong> <strong>USBTracer</strong>/<strong>Trainer</strong> User <strong>Manual</strong><br />
SW Version 2.20<br />
• 2-stage SOF Hiding: You can display all SOFs, hide all SOFs, or<br />
hide empty SOFs (show only SOFs with endpoint traffic and hide<br />
empty frames). Selecting this option allows you to hide empty<br />
SOFs with one click of the Hide SOF button or hide all SOFs with<br />
two clicks of the Hide SOF button.<br />
• Error Report: Displays the Errors section of the Traffic Summary<br />
window.<br />
• Timing Calculator: Displays the Timing Calculator window from<br />
the beginning of a packet or marker to the beginning of another<br />
packet or marker, including Total Time unit, Bus Utilization Time<br />
and Bandwidth, and selected Global, Low Speed, Full Speed, High<br />
Speed, Transactions, and Devices.<br />
• Traffic Summary: Displays the Traffic Summary window,<br />
showing all reports, including Packets, Transactions, Transfers, and<br />
Errors.<br />
• Bus Utilization: Displays the Bus Utilization window, including<br />
Packet length, Bus usage, and Bus usage by device.<br />
• Navigator: Displays the Navigation bar, including<br />
Pre/Post Triggers, Errors, and Types of Traffic.<br />
• Real-Time Statistics: Displays the Real-Time Statistics window,<br />
including Data Packet Count, Data Payload Throughput, and<br />
Bus Usage.<br />
• Trace Viewing Level: Displays Packets, Transactions,<br />
Split Transactions, Transfers, Host Wire Adapter Segments, Host<br />
Wire Adapter Transfers, Device Wire Adapter Segments, or Device<br />
Wire Adapter Transfers.<br />
• Fonts: Sets the font type and bold or italic style for Fields and Data.<br />
• Configuration Name: You can name the current set of<br />
Display Options values for use with an .opt file. (The options file<br />
can have a different name.)<br />
• Restore Factory Presets: Sets all Display Options values to the<br />
installed values.<br />
83
<strong>LeCroy</strong> <strong>USBTracer</strong>/<strong>Trainer</strong> User <strong>Manual</strong><br />
SW Version 2.20<br />
7.2 Color/Format/Hiding Display Options<br />
To modify the colors, formats, and hiding options, select the<br />
Color/Format/Hiding tab.<br />
Color Display Options<br />
The program uses a default set of colors for each type of data in each group<br />
of data. The colors and color combinations are appropriate for most graphic<br />
systems. You can alter any color.<br />
To specify a color for an information type, in the Color/Format/Hiding tab,<br />
select a row (such as Data) in the Group and Color column and expand it.<br />
84
<strong>LeCroy</strong> <strong>USBTracer</strong>/<strong>Trainer</strong> User <strong>Manual</strong><br />
SW Version 2.20<br />
Select a data type (such as Data Length) in the Group, then select a color in<br />
the Color section, using Standard or Custom colors. Use a bright color for<br />
each important field.<br />
To customize colors, use the Custom tab.<br />
85
<strong>LeCroy</strong> <strong>USBTracer</strong>/<strong>Trainer</strong> User <strong>Manual</strong><br />
SW Version 2.20<br />
Note<br />
You cannot change the color of an Invalid Data (packet error)<br />
field. It is permanently set to red.<br />
Formats Display Options<br />
For each type of data in each group of data, the program has a default data<br />
format. Examples of number data formats are Bin (binary), Dec (decimal),<br />
and Hex (hexadecimal). Examples of date and time data formats are Hex<br />
uFrame, Dec uFrame, Date & Time, Time, Bit Time, seconds,<br />
microseconds, and nanoseconds. An example of a text data format is ASCII.<br />
You can alter some data formats.<br />
To specify a data format for an information type, in the<br />
Color/Format/Hiding tab, select a row (such as Packet Fields) in the Group<br />
and Color column and expand it.<br />
Select a data type (such as PID Types) in the Group:<br />
86
<strong>LeCroy</strong> <strong>USBTracer</strong>/<strong>Trainer</strong> User <strong>Manual</strong><br />
SW Version 2.20<br />
Select a format in the Format section. The following formats are available<br />
for PID Types:<br />
If available, select Bit Order in the Format section. The options are MSB to<br />
LSB or LSB to MSB.<br />
Hiding Display Options<br />
By default, no data is hidden. You can hide any group of data and any type<br />
of data. You can hide transactions, SOFs; NAKs; High, Full, or Low Speed<br />
packets; traffic from one or both recording channels; and Addresses and<br />
Endpoints.<br />
To hide one or more fields, select the Group and Data type in the Group and<br />
Color column, then click the Hidden checkbox in the display or the Hidden<br />
checkbox in the Hidden section of the Format section.<br />
87
<strong>LeCroy</strong> <strong>USBTracer</strong>/<strong>Trainer</strong> User <strong>Manual</strong><br />
SW Version 2.20<br />
7.3 Level Hiding Display Options<br />
By default, no data packets, transactions, or bus conditions are hidden. You<br />
can hide:<br />
• Start of Frame packets<br />
• NAK’ed transactions<br />
• Chirp and SEO Bus conditions<br />
• High, Full, or Low Speed packets<br />
• Channel 0 or Channel 1 packets<br />
Select the Level Hiding tab, then select the data types to hide.<br />
88
<strong>LeCroy</strong> <strong>USBTracer</strong>/<strong>Trainer</strong> User <strong>Manual</strong><br />
SW Version 2.20<br />
7.4 Saving Display Options<br />
You can save a set of Display Options values, make a set the default settings,<br />
or use a saved set of values with the commands at the bottom of the Display<br />
Options window:<br />
• To save the current Display Options values in an options file for use<br />
in future sessions, click Save. Enter a file name without a file name<br />
extension. The program adds the .opt extension. (The file must<br />
have an .opt file name extension.)<br />
• To load a previously saved .opt file, click Load and select a file<br />
name.<br />
• To save the current Display Options values in the default.opt<br />
options file for use as the default display options, click Save as<br />
Default. (Do not delete the default.opt file.)<br />
• To apply the current Display Options values, click Apply. The<br />
Display Options window remains open.<br />
• To apply the current Display Options values and close the Display<br />
Options window, click OK.<br />
• To cancel unsaved changes to display values and exit the Display<br />
Options window, click Cancel.<br />
89
<strong>LeCroy</strong> <strong>USBTracer</strong>/<strong>Trainer</strong> User <strong>Manual</strong><br />
SW Version 2.20<br />
90
<strong>LeCroy</strong> <strong>USBTracer</strong>/<strong>Trainer</strong> User <strong>Manual</strong><br />
SW Version 2.20<br />
8. Reading a Trace<br />
8.1 Trace View Features<br />
• The <strong>USBTracer</strong> packet view display makes extensive use of color<br />
and graphics to fully document the captured traffic.<br />
• Packets are shown on separate rows, with their individual fields<br />
both labeled and color coded.<br />
• Packets are numbered (sequentially, as recorded), time-stamped<br />
(with a resolution of 16.67 ns), and highlighted to show the<br />
transmitted speed (low-speed, full-speed or high-speed).<br />
• Display formats can be named and saved for later use.<br />
• Pop-up Tool Tips detail the contents of packet fields.<br />
• Data fields can be collapsed to occupy minimal space in the display<br />
and you can zoom in and out to optimize screen utilization.<br />
• The display software can operated independently of the hardware<br />
and so can function as a stand-alone Trace Viewer that may be<br />
freely distributed.<br />
91
<strong>LeCroy</strong> <strong>USBTracer</strong>/<strong>Trainer</strong> User <strong>Manual</strong><br />
SW Version 2.20<br />
• High Speed SOFs display Microframes (shown below.)<br />
8.2 Set Marker<br />
You can define a unique Marker for each packet.<br />
To place a marker on a packet:<br />
Step 1<br />
Microframes<br />
Left-click Packet # for the packet you wish to mark to display the<br />
Packet menu:<br />
Step 2<br />
Select Set Marker.<br />
You see the Edit Marker Comment window where you can enter a<br />
unique comment about this packet.:<br />
Step 3<br />
Step 4<br />
Enter your comment.<br />
Click OK.<br />
A marked packet is indicated by a vertical red bar along the left edge of the<br />
packet # block:<br />
92
<strong>LeCroy</strong> <strong>USBTracer</strong>/<strong>Trainer</strong> User <strong>Manual</strong><br />
SW Version 2.20<br />
8.3 Edit or Clear Marker<br />
To clear or edit the comments associated with a packet marker:<br />
Step 1<br />
Left-click Packet # to display the Packet menu:<br />
Step 2<br />
To edit the Marker Comment, select Edit Marker Comment to<br />
display the Edit marker comment window. Edit the comment, then<br />
click OK:<br />
Step 3<br />
To clear a Marker, click Clear Marker.<br />
The vertical red Marker bar disappears.<br />
8.4 View Raw Bits<br />
You can expand a specific packet to view the raw bits in detail.<br />
To view the raw bits:<br />
Step 1<br />
Left-click Packet # for the packet you wish to view to display the<br />
Packet menu:<br />
93
<strong>LeCroy</strong> <strong>USBTracer</strong>/<strong>Trainer</strong> User <strong>Manual</strong><br />
SW Version 2.20<br />
Step 2<br />
Select Show Raw Bits to display the Raw Bits View for that packet:<br />
Along the top of the Raw Bits View is a linear strip of the logical bit values<br />
with corresponding field demarcations. Bit stuffing is displayed in color.<br />
Below the logical bit values is a representation of the D+/D- signaling<br />
complete with NRZ encoding. A scroll bar assists in navigation of larger<br />
packets. Two buttons under the label Packet are used to view previous or<br />
next packets. Two buttons under the label Zoom allow you to zoom in or<br />
out on packets.<br />
8.5 Expanding and Collapsing Data Fields<br />
You can expand a Data field to view it in greater detail or collapse it when<br />
you want a more compact view.<br />
Using the Expand/Collapse Data Field Arrows<br />
Data Fields can be easily expanded or<br />
collapsed by clicking the small triangular arrows<br />
on the left side of the data field.<br />
Double-Clicking to Expand/Collapse Data Fields<br />
Data fields can also be expanded or collapsed by double-clicking anywhere<br />
in the data field.<br />
94
<strong>LeCroy</strong> <strong>USBTracer</strong>/<strong>Trainer</strong> User <strong>Manual</strong><br />
SW Version 2.20<br />
Expanding or Collapsing All Data Fields<br />
Expand or collapse all data fields by holding down the button for more than<br />
a second.<br />
Using the Data Field Pop-up Menus<br />
Data fields can expanded or collapsed by clicking in a data field and<br />
selecting Expand Data or Collapse Data from the pop-up menu.<br />
To expand and collapse data using the menu:<br />
Step 1<br />
Left-click Data in the Data packet you want to expand or collapse.<br />
If your Data Trace View is currently expanded, you see the Collapse<br />
Data menu:<br />
If your Data Trace View is currently collapsed, you see the Expand<br />
Data menu:<br />
Step 2<br />
Select the desired Expand Data or Collapse Data menu item.<br />
The Trace View is repositioned with the selected packet(s) adjusted<br />
in the format you have specified.<br />
95
<strong>LeCroy</strong> <strong>USBTracer</strong>/<strong>Trainer</strong> User <strong>Manual</strong><br />
SW Version 2.20<br />
Expand or Collapse All Data Fields<br />
All data fields can be expanded or collapsed by selecting Expand All Data<br />
Fields or Collapse All Data Fields from the data field pop-up menus.<br />
8.6 View Data Block<br />
The data field pop-up menu has an option for<br />
viewing the raw bits in a data field.<br />
To view these bits:<br />
Step 1<br />
Step 2<br />
Click in the data field to open the data<br />
field pop-up menu.<br />
Select View Data Block.to open the<br />
Data Block dialog box.<br />
The View Data Block window has options for displaying the raw<br />
bits in different formats:<br />
• Format: Lets you display data in Hex, Decimal, ASCII or Binary<br />
formats<br />
• Show Per Line: Lets you control how many bits are displayed<br />
per line<br />
• Bit Order: Most Significant Bit, Least Significant Bit<br />
96
<strong>LeCroy</strong> <strong>USBTracer</strong>/<strong>Trainer</strong> User <strong>Manual</strong><br />
SW Version 2.20<br />
8.7 Pop-up Tool-tips<br />
Many fields within the trace display pop-up tool-tips when the mouse<br />
pointer is suspended over them. These tips provide added details about the<br />
field.<br />
8.8 Hide SOF Packets<br />
You can hide Start-of-Frame (SOF) packets that may be uninteresting in a<br />
given context from a Trace View by clicking the Hide SOF Packets button<br />
on the Tool Bar:<br />
• Click to hide all SOF packets.<br />
8.9 Hide NAKs<br />
You can hide NAKs that may be uninteresting in a given context from a<br />
Trace View by clicking the Hide NAKs button on the Tool Bar:<br />
• Click to hide all NAK packets.<br />
8.10 Hide Devices<br />
Click the button to open a menu for select any address/endpoint combination<br />
to be hidden. Hit the Ctrl key to select multiple values. This menu can be moved<br />
from its default location and floated in the trace window for later use.<br />
8.11 Hide Chirps<br />
Click the<br />
USB trace.<br />
button to hide any Chirped-J or Chirped-K packets recorded in a<br />
97
<strong>LeCroy</strong> <strong>USBTracer</strong>/<strong>Trainer</strong> User <strong>Manual</strong><br />
SW Version 2.20<br />
8.12 Switch to Transactions View<br />
A Transaction is defined in the USB specification as the delivery of service<br />
to an endpoint. This consists of a token packet, an optional data packet, and<br />
an optional handshake packet. The specific packets that make up the<br />
transaction vary based upon the transaction type.<br />
The program default display mode is Packet View. Before you can view<br />
decoded transactions, you must switch from Packet View to Transactions<br />
View.<br />
To select Transactions View:<br />
Step 1 Click to on the toolbar.<br />
The Trace View screen is re-drawn to display Transactions.<br />
Note<br />
This menu selection displays a check next to Show USB<br />
transactions when you have selected it. When you want to<br />
switch back to Packet View mode, right-click anywhere in the<br />
trace window and then left-click Show USB transactions.<br />
98
<strong>LeCroy</strong> <strong>USBTracer</strong>/<strong>Trainer</strong> User <strong>Manual</strong><br />
SW Version 2.20<br />
You can also switch to Transaction View from the Menu Bar:<br />
Step 1<br />
Select Display Options under Setup to display the Display Options<br />
General window:<br />
Step 2<br />
Step 3<br />
Check Transactions.<br />
Click OK.<br />
99
<strong>LeCroy</strong> <strong>USBTracer</strong>/<strong>Trainer</strong> User <strong>Manual</strong><br />
SW Version 2.20<br />
8.13 View Decoded Transactions<br />
Once you set Display Options, the Trace View screen is re-drawn to display<br />
decoded transactions in the colors and format you selected.<br />
When you instruct the Analyzer to display USB transactions, the<br />
components of each transaction are collected from the current recording and<br />
are grouped and indented below each decoded transaction. Each row shows<br />
a transaction with a unique numeration, a label, and color-coded decoding<br />
of important data.<br />
Expanded and Collapsed Transactions<br />
You can expand a specific transaction to view its parts, which are grouped<br />
and indented below the transaction.<br />
To expand a transaction:<br />
Step 1<br />
Left-click the transaction number you wish to view to display the<br />
Expand Transaction menu:<br />
100
<strong>LeCroy</strong> <strong>USBTracer</strong>/<strong>Trainer</strong> User <strong>Manual</strong><br />
SW Version 2.20<br />
Step 2<br />
Select Expand This Transaction.<br />
The screen displays the selected transaction in expanded format.<br />
Note<br />
The Expand/Collapse transaction feature operates as a toggle:<br />
when one format is active, the other appears as an option on the<br />
Expand/Collapse drop-down menu.<br />
To collapse a transaction, perform the same operation and select Collapse<br />
This Transaction.<br />
Note that you can choose to expand or collapse<br />
• Only the selected Transaction<br />
OR<br />
• All Transactions<br />
It is not necessary to use the Expand/Collapse Transactions menu to shift<br />
between expanded and collapsed views of a transaction:<br />
• Double-click in the Transaction number field to toggle back and<br />
forth between collapsed and expanded views.<br />
8.14 Switch to Split Transaction View<br />
To select Split Transaction View:<br />
Step 1 Click the button on the toolbar.<br />
The Trace View screen is re-drawn to display Split Transactions.<br />
101
<strong>LeCroy</strong> <strong>USBTracer</strong>/<strong>Trainer</strong> User <strong>Manual</strong><br />
SW Version 2.20<br />
You can also switch to Split Transactions View from the Menu Bar:<br />
Step 1<br />
Select Display Options under Setup.<br />
You see the Display Options General window:<br />
Step 2<br />
Check Split Transactions.<br />
8.15 Switch to Transfer View<br />
A Transfer is defined in the USB specification as one or more transactions<br />
between a software client and its function. USB transfers can be one of four<br />
kinds: Control, Interrupt, Bulk, and Isochronous. <strong>USBTracer</strong> is capable<br />
of displaying all four types.<br />
The default display mode is Packet View. Before you can view decoded<br />
transfers, you must switch from Packet View (or Transaction View) to<br />
Transfer View.<br />
102
<strong>LeCroy</strong> <strong>USBTracer</strong>/<strong>Trainer</strong> User <strong>Manual</strong><br />
SW Version 2.20<br />
To select Transfer View:<br />
Step 1 Click on the toolbar.<br />
The Trace View screen is re-drawn to display Transfers.<br />
Note<br />
Selecting Show USB transfers adds a check next to this menu<br />
item. If you want to return to Packet View, open the menu and<br />
reselect Show USB transfers. This action removes the check<br />
and returns the display to Packet View.<br />
You can also switch to Transfer View from the Menu Bar:<br />
Step 1 Select Display Options under Setup to display the Display Options<br />
General window:<br />
Step 2<br />
Step 3<br />
Check Transfers.<br />
Click OK.<br />
103
<strong>LeCroy</strong> <strong>USBTracer</strong>/<strong>Trainer</strong> User <strong>Manual</strong><br />
SW Version 2.20<br />
8.16 View Decoded Transfers<br />
Once you set Display Options, the Trace View screen is re-drawn to display<br />
decoded transfers in the colors and format you selected.<br />
When you instruct the Analyzer to display USB transfers, the components<br />
of each transfer are collected from the current recording and are grouped<br />
below each decoded transfer. Each transfer row shows a transfer with a<br />
unique numeration, a label, and color-coded decoding of important data.<br />
Expanded and Collapsed Transfers<br />
You can expand a specific transfer to view its parts, which are grouped and<br />
indented below the transfer.<br />
To expand a transfer:<br />
Step 1<br />
Left-click the transfer number you wish to view to display the<br />
Expand Transfer menu:<br />
104
<strong>LeCroy</strong> <strong>USBTracer</strong>/<strong>Trainer</strong> User <strong>Manual</strong><br />
SW Version 2.20<br />
Step 2<br />
Select Expand This USB Transfer to display the selected transfer<br />
in expanded format.<br />
Note<br />
The Expand/Collapse transfer feature operates as a toggle: when<br />
one format is active, the other appears as an option on the<br />
Expand/Collapse drop-down menu.<br />
To collapse a transfer, perform the same operation and select Collapse This<br />
USB Transfer.<br />
Note that you can choose to expand or collapse<br />
• Only the selected Transfer<br />
OR<br />
• All Transfers<br />
It is not necessary to use the Expand/Collapse Transfers menu to shift<br />
between expanded and collapsed views of a transfers:<br />
• Double-click in the Transfer number field to toggle back and forth<br />
between collapsed and expanded views.<br />
8.17 Decoding Protocol-Specific Fields in<br />
Transactions/Transfers<br />
When transfers or transactions are displayed, the fields in setup transactions<br />
or control, interrupt, and Bulk transfers by default do not get decoded and<br />
are shown in hexadecimal values. The exceptions are setup transactions and<br />
control transfers for standard USB device requests which are always<br />
decoded.<br />
105
<strong>LeCroy</strong> <strong>USBTracer</strong>/<strong>Trainer</strong> User <strong>Manual</strong><br />
SW Version 2.20<br />
In order to show specific decoding for class- and vendor-specific device<br />
requests and endpoints, you have to use the decoding association<br />
mechanism that is described in Chapter 9 on decoding. When you have<br />
performed the association, you see the protocol-specific fields of transfers<br />
and transactions decoded in the trace view.<br />
8.18 Switch to Host Wire Adapter Segment View<br />
A Host Wire Adapter Segment is one or more transfers between a PC and<br />
a host wire adapter. To view host wire adapter segments, switch to the Host<br />
Wire Adapter Segment trace viewing level.<br />
To select the Host Wire Adapter Segment trace viewing level:<br />
• Click on the toolbar.<br />
OR<br />
Select View > Show Host Wire Adapter Segment.<br />
OR<br />
Select Setup > Display Options to display the Display Options<br />
window, check HWA Segment, and then click OK.<br />
The program redraws the trace view.<br />
106
<strong>LeCroy</strong> <strong>USBTracer</strong>/<strong>Trainer</strong> User <strong>Manual</strong><br />
SW Version 2.20<br />
8.19 Switch to Host Wire Adapter Transfer View<br />
A Host Wire Adapter Transfer is one or more wire adapter segments or<br />
one or more transfers between a PC and a host wire adapter. To view host<br />
wire adapter transfers, switch to the Host Wire Adapter Transfer trace<br />
viewing level.<br />
To select the Host Wire Adapter Transfer trace viewing level:<br />
• Click on the toolbar.<br />
OR<br />
Select View > Show Host Wire Adapter Transfer.<br />
OR<br />
Select Setup > Display Options to display the Display Options<br />
window, check HWA Transfer, and then click OK.<br />
8.20 Switch to Device Wire Adapter Segment View<br />
A Device Wire Adapter Segment is one or more transfers between a PC<br />
and a device wire adapter. To view device wire adapter segments, switch to<br />
the Device Wire Adapter Segment trace viewing level.<br />
To select the Device Wire Adapter Segment trace viewing level:<br />
• Click on the toolbar.<br />
OR<br />
Select View > Show Device Wire Adapter Segment.<br />
OR<br />
Select Setup > Display Options to display the Display Options<br />
window, check DWA Segment, and then click OK.<br />
107
<strong>LeCroy</strong> <strong>USBTracer</strong>/<strong>Trainer</strong> User <strong>Manual</strong><br />
SW Version 2.20<br />
8.21 Switch to Device Wire Adapter Transfer View<br />
A Device Wire Adapter Transfer is one or more wire adapter segments or<br />
one or more transfers between a PC and a device wire adapter. To view<br />
device wire adapter transfers, switch to the Device Wire Adapter Transfer<br />
trace viewing level.<br />
To select the Device Wire Adapter Transfer trace viewing level:<br />
• Click on the toolbar.<br />
OR<br />
Select View > Show Device Wire Adapter Transfer.<br />
OR<br />
Select Setup > Display Options to display the Display Options<br />
window, check DWA Transfer, and then click OK.<br />
8.22 Using the Trace Navigator<br />
You can use the Trace Navigator to show the structure of the<br />
entire trace from different points on the Trace view, thereby<br />
refining the trace view to a packet range in the trace that is<br />
most interesting to you. This range can be set by you to show<br />
smaller parts of the trace.<br />
To display the Navigator bar, click in the toolbar or<br />
select the Navigation Bar checkbox in the Display Options<br />
General window.<br />
The Navigator bar can be repositioned in the trace and can be<br />
oriented horizontally or vertically, docked or undocked by<br />
dragging the parallel bars at the top or side of the Navigator<br />
bar. By default, the Navigator bar appears vertically to the<br />
right of the trace window.<br />
The Navigator bar represents different types of trace<br />
information in the order of the packets. The top of each bar<br />
corresponds to the first packet in the trace, and the bottom<br />
corresponds to the last packet. The Navigator bar is made up<br />
of three parts: Pre and Post-Trigger traffic, errors, and types<br />
of traffic.<br />
108
<strong>LeCroy</strong> <strong>USBTracer</strong>/<strong>Trainer</strong> User <strong>Manual</strong><br />
SW Version 2.20<br />
At any time, a line in the navigator bar of one pixel in height represents a<br />
fraction of the trace data. If the Navigation bar is 400 pixels high, then each<br />
bar in this example would represent 1/400 of the trace. If the trace had 4000<br />
packets total, each bar would represent ten packets. In the Types of Traffic<br />
portion of the navigation bar, the color of the bar would be that of the most<br />
important item in those ten packets. See "Navigator Bar Attributes" on the<br />
next pages.<br />
Drag the square at the top of bottom to set the size of a packet range. Drag<br />
the entire square to set the packet range to different values. A bubble appears<br />
showing the packet range while you are setting it. Right-click the Navigator<br />
to display the pop-up menu.<br />
• Pre/Post Trigger, Errors, Types of Traffic: Shows or hides<br />
specific type of traffic from the Navigator.<br />
• Set Range to Whole Trace: Resets packet range to the entire trace.<br />
• Set Range near Packet number: Sets the packet range near the<br />
packet where your mouse pointer is positioned in the Navigator bar.<br />
• Recent Ranges: Displays a history of ranges that were previously<br />
selected.<br />
109
<strong>LeCroy</strong> <strong>USBTracer</strong>/<strong>Trainer</strong> User <strong>Manual</strong><br />
SW Version 2.20<br />
Navigator Bar Attributes<br />
The traffic types above are shown in order of importance. For example, if a<br />
NAK’d transaction occurred in the same sample area as a SOF, the NAK<br />
would take precedence, and the Navigator would show the black bar.<br />
110
<strong>LeCroy</strong> <strong>USBTracer</strong>/<strong>Trainer</strong> User <strong>Manual</strong><br />
SW Version 2.20<br />
9. Decode Requests<br />
9.1 Class and Vendor Definition Files<br />
<strong>LeCroy</strong> analyzers use script files to decode class and vendor requests. The<br />
script files are read when the application is initialized. Once read, the<br />
analyzer then decodes class and vendor requests as instructed by the files.<br />
.REQ Files and .DSC Files - Represent the old method of decoding. .REQ<br />
stands for Requests and .DSC stands for Descriptors. This method was<br />
originally developed for some of <strong>LeCroy</strong>’s earlier USB analyzers and uses<br />
fixed definitional structures. <strong>LeCroy</strong> provides .req files for the following<br />
requests and classes:<br />
• Standard Requests (standard.req)<br />
• Hub Class (hub.req): No longer used: replaced by Script Decoder<br />
version .dec files<br />
• HID Class (hid.req)<br />
• Printer Class (printer.req)<br />
• Communications Class (communication.req)<br />
• Audio Class (audio.req)<br />
• Bluetooth USB HCI commands and events (bluetooth.req): No<br />
longer used: replaced by Script Decoder version .dec files)<br />
• Vendor Request definition file (vendor.req)<br />
To add your own .req file for a Class or Vendor Request:<br />
Step 1<br />
Use the Notepad application to create and edit your own Request<br />
Definition file (for example, my_vendor_commands.req).<br />
Note<br />
Step 2<br />
Step 3<br />
To learn to write such a file, review the Request (.req) files<br />
provided by <strong>LeCroy</strong>.<br />
Add the name of your Request file to the request.lst file.<br />
Click Setup. The decoding menu in the Class/Vendor List appears.<br />
111
<strong>LeCroy</strong> <strong>USBTracer</strong>/<strong>Trainer</strong> User <strong>Manual</strong><br />
SW Version 2.20<br />
.DEC Files - Represents the new method of decoding. DEC stands for<br />
"decoder" and describes both Class and Vendor requests in a C-like<br />
language. The .DEC files are in the Scripts directory under the application<br />
directory. Each .dec file stores an endpoint or request decode. When the<br />
application starts, these files are loaded dynamically. Subdirectories are<br />
supported.<br />
The following .dec files are provided:<br />
• Hid<br />
• Mass Storage Class<br />
— SCSI Bulk Protocol<br />
— UFI CBI Protocol<br />
• PTP Still Image Class Requests<br />
• Smart Card<br />
• Standard Requests<br />
• Video Class Requests<br />
• Virtual<br />
• Wire Adapter Class Requests and Radio Control Request<br />
You can create your own .dec file for a Class or Vendor Request. For more<br />
information on the format of these Script Decoder files and the Script<br />
Decoding language, read the Script Decoder <strong>Manual</strong>.<br />
112
<strong>LeCroy</strong> <strong>USBTracer</strong>/<strong>Trainer</strong> User <strong>Manual</strong><br />
SW Version 2.20<br />
9.2 Class/Vendor Decoding Options<br />
You can permanently assign a class or vendor decoding for an address<br />
and/or endpoint or interface in a trace file. Once assigned, the decoding<br />
occurs automatically when you display transactions.<br />
Mapping Request Recipient to Class/Vendor Decoding<br />
To assign a decoding group to a request recipient,<br />
Step 1<br />
Step 2<br />
Click the Apply Decoding Scripts button on the Toolbar.<br />
OR<br />
Left-click the Control Transfer field to display the<br />
USB Device Request menu:<br />
Select Map Request Recipients to Class/Vendor Decoding to<br />
display the Request Recipient and Endpoints dialog box:<br />
The Recipient field shows all Class and Vendor Request Recipients<br />
found in the trace file. The display shows the Host, Address, and<br />
Type (Class or Vendor) for the recipient. On the right are the names<br />
of Class/Vendor Decoding groups currently assigned to recipients.<br />
If blank, no decoding is assigned for a recipient.<br />
Step 3<br />
Select a recipient.<br />
113
<strong>LeCroy</strong> <strong>USBTracer</strong>/<strong>Trainer</strong> User <strong>Manual</strong><br />
SW Version 2.20<br />
Step 4<br />
Display the Class/Vendor Decoding Groups drop-down menu.<br />
The drop-down menu lists the defined Class/Vendor request<br />
decoding groups. The Class/Vendor Decoding Groups are:<br />
• No Decoding<br />
• Audio Class<br />
• Communication Class<br />
• HID Class<br />
• HUB Class Requests<br />
• Mass-Strg Bulk-only Requests<br />
• Mass-Strg Class UFI CBI Requests<br />
• Printer Class<br />
• PTP Still Image Class Requests<br />
• Standard Requests<br />
• Video Class Requests<br />
• Wire Adapter Radio Control Requests<br />
• Wire Adapter Class Requests<br />
Step 5<br />
Select a decoding group.<br />
OR<br />
Select No Decoding if you do not want any specific decoding.<br />
Step 6<br />
Step 7<br />
Repeat the previous steps for additional recipients.<br />
To retain a mapping from trace to trace DURING an application<br />
session, select the Keep Across Recordings checkbox.<br />
114
<strong>LeCroy</strong> <strong>USBTracer</strong>/<strong>Trainer</strong> User <strong>Manual</strong><br />
SW Version 2.20<br />
Step 8<br />
Click OK.<br />
Mapping Endpoint to Class/Vendor Decoding<br />
To assign a Class/Vendor Endpoint decoding,<br />
Step 1<br />
Step 2<br />
Step 3<br />
Click the Apply Decoding Scripts button on the Toolbar.<br />
OR<br />
Left-click the Bulk/Int Transfer field to display the<br />
USB Device Request menu.<br />
Select Map Endpoint to Class/Vendor Decoding to display the<br />
Request Recipients and Endpoints dialog box.<br />
Click the Endpoints tab to display the Endpoints dialog box.<br />
The Endpoint field (Endp) shows all Endpoints found in the trace<br />
file. The displays shows the Host, Address, and Direction for the<br />
recipient. On the right are the names of Class/Vendor Endpoint<br />
Decoding groups currently assigned to endpoints. If blank, no<br />
decoding is assigned for a recipient.<br />
Step 4<br />
Select an endpoint.<br />
115
<strong>LeCroy</strong> <strong>USBTracer</strong>/<strong>Trainer</strong> User <strong>Manual</strong><br />
SW Version 2.20<br />
Step 5<br />
Display the Class/Vendor Endpoint Decoding drop-down menu:<br />
The Class/Vendor Endpoint Decoding options for an OUT endpoint<br />
are:<br />
• No Decoding<br />
• CCID Bulk Out Message<br />
• Display DATA<br />
• Mass Strg Bulk-Only SCSI Out Endp<br />
• Mass Strg UFI_CBI Bulk Out Endp<br />
• PTP Still Image Bulk Out<br />
• Video Bulk Out<br />
• Video Isoch Out<br />
• Virtual UART<br />
• Wire Adapter Data Transfer Out Endp<br />
116
<strong>LeCroy</strong> <strong>USBTracer</strong>/<strong>Trainer</strong> User <strong>Manual</strong><br />
SW Version 2.20<br />
The Class/Vendor Endpoint Decoding options an IN or Interrupt<br />
endpoint are:<br />
• No Decoding<br />
• CCID Bulk In Message<br />
• Communication Class Notification<br />
• Display DATA<br />
• HID In Endp<br />
• Hub Class Status Change Endp<br />
• Mass Strg Bulk-Only SCSI In Endp<br />
• Mass Strg CBI Interrupt Endp<br />
• Mass Strg UFI_CBI Bulk In Endp<br />
• Mass Strg UFI_CBI Interrupt Endp<br />
• PTP Still Image Bulk In<br />
• PTP Still Image Interrupt<br />
• Video Bulk In<br />
• Video Interrupt<br />
• Video Isoch In<br />
• Virtual UART<br />
• Wire Adapter Radio Notif Endp<br />
• Wire Adapter Data Transfer In Endp<br />
• Wire Adapter Notif Endp<br />
Step 6<br />
Select the type of decoding.<br />
OR<br />
Select No Decoding if you do not want any specific decoding.<br />
Step 7<br />
Step 8<br />
Step 9<br />
Repeat the previous steps for any additional endpoints you would<br />
like to map.<br />
To retain a mapping from trace to trace DURING an application<br />
session, select the Keep Across Recordings checkbox.<br />
Click OK.<br />
117
<strong>LeCroy</strong> <strong>USBTracer</strong>/<strong>Trainer</strong> User <strong>Manual</strong><br />
SW Version 2.20<br />
Mapping Request RPipe to Class/Vendor Decoding<br />
Before mapping Request RPipes to Class/Vendor Decoding, you must first<br />
assign the following endpoint decoders:<br />
• Wire Adapter Data Out<br />
• Wire Adapter Data In<br />
• Wire Adapter Notif<br />
To assign a decoding group to a Request RPipe:<br />
Step 1<br />
Step 2<br />
Step 3<br />
Click the Apply Decoding Scripts button on the Toolbar.<br />
OR<br />
Left-click the Control Transfer field to display the<br />
USB Device Request menu.<br />
Select Map RPipe to Class/Vendor Decoding to display the<br />
Request Recipient and Endpoints dialog box.<br />
Click the Request RPipes tab to display the Request RPipes dialog<br />
box:<br />
The Recipient field shows all Class and Vendor Request recipients<br />
found in the trace file. The RPipe field shows all Class and Vendor<br />
Request RPipes found in the trace file. The displays shows the<br />
Otg Host, HWA address, and Type (Class or Vendor) for the<br />
recipient. On the right are the names of Class/Vendor Decoding<br />
groups currently assigned to recipients. If blank, no decoding is<br />
assigned for a recipient.<br />
Step 4<br />
Step 5<br />
Select a recipient.<br />
Display the Class/Vendor Decoding Groups drop-down menu.<br />
The Class/Vendor Decoding Groups are the same as for Request<br />
Recipients.<br />
118
<strong>LeCroy</strong> <strong>USBTracer</strong>/<strong>Trainer</strong> User <strong>Manual</strong><br />
SW Version 2.20<br />
Step 6<br />
Step 7<br />
Step 8<br />
Step 9<br />
Select a decoding group.<br />
OR<br />
Select No Decoding if you do not want any specific decoding.<br />
Repeat the previous steps for additional recipients.<br />
To retain a mapping from trace to trace DURING an application<br />
session, select the Keep Across Recordings checkbox.<br />
Click OK.<br />
Mapping Endpoint RPipe to Class/Vendor Decoding<br />
To assign a Class/Vendor Endpoint RPipes decoding:<br />
Step 1<br />
Step 2<br />
Step 3<br />
Click the Apply Decoding Scripts button on the Toolbar.<br />
OR<br />
Left-click the Bulk/Int Transfer field to display the<br />
USB Device Request menu.<br />
Select Map Endpoint RPipe to Class/Vendor Decoding to display<br />
the Request Recipients and Endpoints dialog box.<br />
Click the Endpoint RPipes tab to display the Endpoint RPipes<br />
dialog box:<br />
The RPipe field shows all RPipes found in the trace file. The<br />
displays shows the Otg Host, HWA address, and Direction for the<br />
recipient. On the right are the names of Class/Vendor Endpoint<br />
Decoding groups currently assigned to endpoints. If blank, no<br />
decoding is assigned for a recipient.<br />
Step 4<br />
Select an endpoint RPipe.<br />
119
<strong>LeCroy</strong> <strong>USBTracer</strong>/<strong>Trainer</strong> User <strong>Manual</strong><br />
SW Version 2.20<br />
Step 5<br />
Step 6<br />
Step 7<br />
Step 8<br />
Step 9<br />
Display the Class/Vendor Endpoint Decoding drop-down menu.<br />
The Class/Vendor Endpoint Decoding options are the same as for<br />
Endpoints.<br />
Select the type of decoding.<br />
OR<br />
Select No Decoding if you do not want any specific decoding.<br />
Repeat the previous steps for any additional RPipes you would like<br />
to map.<br />
To retain a mapping from trace to trace DURING an application<br />
session, select the Keep Across Recordings checkbox.<br />
Click OK.<br />
Mapping Request DWA RPipe to Class/Vendor Decoding<br />
Before mapping Request DWA RPipes to Class/Vendor Decoding, you<br />
must first assign the following endpoint decoders:<br />
• Wire Adapter Data Out<br />
• Wire Adapter Data In<br />
• Wire Adapter Notif<br />
To assign a decoding group to a Request RPipe:<br />
Step 1<br />
Step 2<br />
Click the Apply Decoding Scripts button on the Toolbar.<br />
OR<br />
Left-click the Control Transfer field to display the<br />
USB Device Request menu.<br />
Select Map DWA RPipe to Class/Vendor Decoding to display the<br />
Request Recipient and Endpoints dialog box.<br />
120
<strong>LeCroy</strong> <strong>USBTracer</strong>/<strong>Trainer</strong> User <strong>Manual</strong><br />
SW Version 2.20<br />
Step 3<br />
Click the Request DWA RPipes tab to display the Request DWA<br />
RPipes dialog box:<br />
Step 4<br />
Step 5<br />
Step 6<br />
Step 7<br />
Step 8<br />
Step 9<br />
The Recipient field shows all Class and Vendor Request recipients<br />
found in the trace file. The RPipe field shows all Class and Vendor<br />
Request RPipes found in the trace file. The displays shows the Otg<br />
Host, HWA address, and Type (Class or Vendor) for the recipient.<br />
On the right are the names of Class/Vendor Decoding groups<br />
currently assigned to recipients. If blank, no decoding is assigned for<br />
a recipient.<br />
Select a recipient.<br />
Display the Class/Vendor Decoding Groups drop-down menu.<br />
The Class/Vendor Decoding Groups are the same as for Request<br />
Recipients.<br />
Select a decoding group.<br />
OR<br />
Select No Decoding if you do not want any specific decoding.<br />
Repeat the previous steps for additional recipients.<br />
To retain a mapping from trace to trace DURING an application<br />
session, select the Keep Across Recordings checkbox.<br />
Click OK.<br />
121
<strong>LeCroy</strong> <strong>USBTracer</strong>/<strong>Trainer</strong> User <strong>Manual</strong><br />
SW Version 2.20<br />
Mapping Endpoint DWA RPipes to Class/Vendor Decoding<br />
To assign a Class/Vendor Endpoint DWA RPipes decoding:<br />
Step 1<br />
Step 2<br />
Step 3<br />
Click the Apply Decoding Scripts button on the Toolbar.<br />
OR<br />
Left-click the Bulk/Int Transfer field to display the<br />
USB/WUSB Device Request menu.<br />
Select Map Endpoint RPipe to Class/Vendor Decoding to display<br />
the Request Recipients and Endpoints dialog box.<br />
Click the Endpoint RPipes tab to display the Endpoint RPipes<br />
dialog box:<br />
The RPipe field shows all RPipes found in the trace file. The<br />
displays shows the Otg Host, HWA address, and Direction for the<br />
recipient. On the right are the names of Class/Vendor Endpoint<br />
Decoding groups currently assigned to endpoints. If blank, no<br />
decoding is assigned for a recipient.<br />
Step 4<br />
Step 5<br />
Step 6<br />
Step 7<br />
Select an endpoint DWA RPipe.<br />
Display the Class/Vendor Endpoint Decoding drop-down menu.<br />
The Class/Vendor Endpoint Decoding options are the same as for<br />
Endpoints.<br />
Select the type of decoding.<br />
OR<br />
Select No Decoding if you do not want any specific decoding.<br />
Repeat the previous steps for any additional RPipes you would like<br />
to map.<br />
122
<strong>LeCroy</strong> <strong>USBTracer</strong>/<strong>Trainer</strong> User <strong>Manual</strong><br />
SW Version 2.20<br />
Step 8<br />
Step 9<br />
To retain a mapping from trace to trace DURING an application<br />
session, select the Keep Across Recordings checkbox.<br />
Click OK.<br />
9.3 General Options<br />
Commands are transferred on USB using special control transfers called<br />
USB Device Requests. The Analyzer can decode Device Requests as they<br />
are defined in the USB specifications and various Device Class and Vendor<br />
specifications.<br />
Each USB Device Request is sent using a Control Transfer. Each Control<br />
Transfer starts with a SETUP transaction.<br />
Decoding USB Device Requests<br />
To decode a USB Device Request:<br />
Step 1<br />
Left-click the Control Transfer field or the SETUP field of the<br />
USB Device Request to display the USB Device Request menu:<br />
Note<br />
The menus shown in this section are context-sensitive. You may see<br />
slightly different menus.<br />
Step 2<br />
To refresh decoding, click Refresh Decoding for this Trace File. Use<br />
this option to reanalyze all transactions.<br />
123
<strong>LeCroy</strong> <strong>USBTracer</strong>/<strong>Trainer</strong> User <strong>Manual</strong><br />
SW Version 2.20<br />
Step 3<br />
To use the previous decoding, click Load most recent decoding<br />
mapping.<br />
This option loads the most recent mapping of endpoints/requests to<br />
decoding types that was done on a previous trace. If the endpoints of<br />
the new trace are the same as the last one mapped, the mappings are<br />
applied to the current trace. This saves the user from having to<br />
constantly apply the mapping to a new trace every time the<br />
application is restarted and a new trace created.<br />
The ability to retain the mapping from trace to trace DURING an<br />
application session already exists: the Keep Across Recordings<br />
button in the endpoint map dialog. This new feature simplifies the<br />
process when the application has been re-started.<br />
Note: You can also change the format, color, and hidden status of fields,<br />
using the same methods as in Display Options. (See Chapter 6,<br />
Display Options.)<br />
124
<strong>LeCroy</strong> <strong>USBTracer</strong>/<strong>Trainer</strong> User <strong>Manual</strong><br />
SW Version 2.20<br />
Decoding Standard Requests<br />
To decode a standard request:<br />
Step 1<br />
From the USB Device Request menu, select Decode Standard<br />
Request to display the View Fields for Standard Request text box:<br />
Step 2<br />
Step 3<br />
Step 4<br />
To find a word in the text box, click the Find button. Enter the word<br />
in the Find What field. To use a case-sensitive search, check Match<br />
Case. To find only the exact word, check Match Whole Word<br />
Only. You can search Up or Down. To search, click Find Next.<br />
To save the View Fields text box as an HTML file, click the Save As<br />
button, enter a file name in the Save As dialog box, then click Save.<br />
To view the previous or next Transfer Control field request of the<br />
same request type, click Previous or Next.<br />
The View Fields for Standard Request dialog box displays field definitions<br />
and values of the Standard Request.<br />
125
<strong>LeCroy</strong> <strong>USBTracer</strong>/<strong>Trainer</strong> User <strong>Manual</strong><br />
SW Version 2.20<br />
For field definitions, please refer to the Universal Serial Bus Specification,<br />
version 2.0. The USB specification is available from the USB Implementers<br />
Forum (USB-IF) at:<br />
USB Implementers Forum<br />
1730 SW Skyline Blvd.<br />
Suite 203<br />
Portland, OR 97221<br />
Tel: +1/503.296.9892<br />
Fax: +1/503.297.1090<br />
Web: http://www.usb.org/<br />
Decoding Class Requests<br />
Examples of a class request are Mass-Strg Class UFI CBI Requests,<br />
PTP Still Image Class Requests, Video Class Requests, and Wire Adapter<br />
Class Requests.<br />
To decode a class request:<br />
Step 1<br />
From the USB Device Request menu, select Decode ... Request to<br />
display the View Fields for ... Class Requests text box.<br />
The following figure shows a Wire Adapter Class Requests decoding:<br />
Decoding Vendor Requests<br />
To decode a vendor request:<br />
• From the USB Device Request menu, select Decode ... Request to<br />
display the View Fields for ... Vendor Requests text box.<br />
An example of a vendor request is UWBTracer Command Set.<br />
126
<strong>LeCroy</strong> <strong>USBTracer</strong>/<strong>Trainer</strong> User <strong>Manual</strong><br />
SW Version 2.20<br />
Decoding Undefined USB/WUSB Device Requests<br />
A Decoding Request may not belong to any of the defined decoding groups<br />
(Standard, Class, or Vendor).<br />
Decoding using Endpoint Information<br />
To decode using the endpoint information:<br />
Step 1<br />
Step 2<br />
Left-click the Bulk/Int Transfer field to display the<br />
Bulk/Int Transfer (IN/OUT transaction with data) menu.<br />
Select Decode as ... Endp to open a View Fields for ... Endp text<br />
box.<br />
The following figure shows a Wire Adapter Data Transfer Out Endp<br />
decoding:<br />
Changing the Layout of Decode Requests<br />
In the View ... Fields windows, the Decoding Information and the<br />
Descriptor information blocks (following the Request Summary<br />
information) have the following columns:<br />
• Field: such as bRequest, wValue, wIndex, bLength,<br />
bDescriptorType, wTotalLength<br />
• Length in bits<br />
• Offset in bits<br />
• Decoded: hex value typically equal to Hex Value<br />
• Hex Value: hex value typically equal to Decoded<br />
• Description: short description of field<br />
127
<strong>LeCroy</strong> <strong>USBTracer</strong>/<strong>Trainer</strong> User <strong>Manual</strong><br />
SW Version 2.20<br />
To change the layout of decode requests display:<br />
Step 1<br />
Click Layout to display the View ... Fields Dialog Layout dialog<br />
box:<br />
Step 2<br />
Step 3<br />
Step 4<br />
To display the available columns of data, use the checkboxes for<br />
Length, Offset, Decoded, Hex Value, and Description.<br />
You can Check All or Uncheck All.<br />
To show only the fields of Collapsed mode, check Show only fields<br />
specified for view in collapsed mode.<br />
To retain settings for future viewing of Decode Request fields, check<br />
Use these settings when View Fields dialog opens.<br />
128
<strong>LeCroy</strong> <strong>USBTracer</strong>/<strong>Trainer</strong> User <strong>Manual</strong><br />
SW Version 2.20<br />
10. Other Features<br />
10.1 Search<br />
The Search feature provides several options for searching through recorded<br />
traffic, allowing you to find specific packets based on triggering status,<br />
packet number, marking, or content.<br />
Go to Trigger<br />
To view the Search options:<br />
• Click Search in the Menu<br />
bar to display the Search<br />
drop-down menu:<br />
Note<br />
Go to Trigger is enabled only<br />
when a trigger has created the<br />
traffic file.<br />
To display a Trigger Event:<br />
• Select Go to Trigger under Search on the Menu Bar.<br />
The Trace View is repositioned to the first packet following the Trigger<br />
event. This packet is at the top of the screen.<br />
Go to Packet/Transaction/Transfer<br />
To display a specific packet:<br />
Step 1<br />
From the menu bar, select the command<br />
Search > Go to Packet/Transaction/Transfer<br />
to display the Go to Packet window:<br />
Step 2<br />
Step 3<br />
Step 4<br />
Select the desired viewing level (packet, transaction etc.) from the<br />
drop-down menu next to the words Go to.<br />
Enter the number of the packet you want to display.<br />
Click OK.<br />
129
<strong>LeCroy</strong> <strong>USBTracer</strong>/<strong>Trainer</strong> User <strong>Manual</strong><br />
SW Version 2.20<br />
The Trace View is repositioned with the selected packet at the top of<br />
your screen.<br />
Go to Marker<br />
To instruct the Analyzer to display a marked packet:<br />
Step 1<br />
Select Go to Marker under Search on the Menu Bar.<br />
You see a drop-down menu listing the marked packets in that Trace<br />
View:<br />
Step 2<br />
Select the desired packet from the displayed list.<br />
The Trace View is repositioned with the selected packet at the top of<br />
your screen.<br />
Note<br />
The Go to Marker feature functions in conjunction with the Set<br />
Marker feature. The comments within the parentheses<br />
following each marked packet are added or edited with the Set<br />
Marker feature. Please refer to Set Marker in Reading a<br />
Trace.<br />
You can use Ctrl+M to go immediately to the All Markers dialog.<br />
130
<strong>LeCroy</strong> <strong>USBTracer</strong>/<strong>Trainer</strong> User <strong>Manual</strong><br />
SW Version 2.20<br />
Go To<br />
The Go To feature takes you directly to an event in a Trace.<br />
Step 1<br />
Select Go To under Search on the Menu Bar to display the Go To<br />
drop-down menu:<br />
Step 2<br />
Select the event you want to go to and enter the necessary<br />
information.<br />
Packet IDs (PIDs)<br />
Select the type of packet to which you want to go.<br />
131
<strong>LeCroy</strong> <strong>USBTracer</strong>/<strong>Trainer</strong> User <strong>Manual</strong><br />
SW Version 2.20<br />
Errors<br />
The Errors menu allows you to search for five different types of error: PID,<br />
CRC5, CRC16, Packet Length, and Stuff Bits. Menu items appear in bold if<br />
they are present in the trace or are grayed out if not present in the trace, as<br />
shown in the example below.<br />
You can press Shift+E to go to the first error of any type.<br />
132
<strong>LeCroy</strong> <strong>USBTracer</strong>/<strong>Trainer</strong> User <strong>Manual</strong><br />
SW Version 2.20<br />
Data Length<br />
Allows you to search for data packets of particular lengths. Lengths are<br />
displayed in Bytes in a drop down menu as shown below. Selecting a length<br />
causes the display to move to the next instance of that packet length.<br />
Addr & Endp<br />
The Addr & Endp feature allows you to search for the next packet which<br />
contains a particular address and endpoint. All available address endpoint<br />
combinations are displayed in the pull down menu.<br />
133
<strong>LeCroy</strong> <strong>USBTracer</strong>/<strong>Trainer</strong> User <strong>Manual</strong><br />
SW Version 2.20<br />
Bus Conditions<br />
Allows you to search by bus conditions such as traffic speed, reset, and<br />
suspend. All available bus conditions are displayed in the pull down menu.<br />
134
<strong>LeCroy</strong> <strong>USBTracer</strong>/<strong>Trainer</strong> User <strong>Manual</strong><br />
SW Version 2.20<br />
On-the-Go<br />
Allows you to search for On-the-go attributes. The On-the-Go submenu<br />
contains entries for:<br />
• HNP: Host Negotiation Protocol<br />
• SRP: Session Request Protocol<br />
• Host: A: Hosts with an A plug<br />
• Host: B: Hosts with a B plug<br />
Channel<br />
Allows you to search for traffic by 1 (Classic-Speed) or 0 (Hi-Speed).<br />
135
<strong>LeCroy</strong> <strong>USBTracer</strong>/<strong>Trainer</strong> User <strong>Manual</strong><br />
SW Version 2.20<br />
Find<br />
Find allows searches to be conducted on an open trace using one or more<br />
criteria. You can search by packet, transactions, split transaction, transfer,<br />
by packet type and by fields within packets.<br />
Find is run by selecting Search >Find or by clicking<br />
on the toolbar.<br />
Searches can combine criteria using the options Intersection and Union.<br />
Intersection creates AND statements such as "Find all packets with x and<br />
y." Union creates OR statements such as "Find all packets with x OR y."<br />
You can also perform searches whereby packets or events are excluded from<br />
a trace. The Exclusion allows searches to be conducted.<br />
To perform a search:<br />
Step 1<br />
Select Find... under Search on the Menu Bar<br />
OR<br />
Click<br />
in the Tool Bar.<br />
You see the User-Defined Find Events screen:<br />
Step 2<br />
Select Packets, Transactions, Split Transactions, Transfers,<br />
HWA Segments, HWA Transfers, DWA Segments, or DWA<br />
Transfers, from the top left list box to list that type of event in the<br />
Events Group box.<br />
136
<strong>LeCroy</strong> <strong>USBTracer</strong>/<strong>Trainer</strong> User <strong>Manual</strong><br />
SW Version 2.20<br />
Step 3<br />
Step 4<br />
Select one or more events from the Events Group box.<br />
Select one of the following options:<br />
• Union: Find all packets matching ANY of the specified events.<br />
• Intersection: Find packets matching ALL of the specified events.<br />
• Exclusion: Exclude packets matching any of the specified events.<br />
Exclusion works with the other two options: Select Union AND<br />
Exclusion (=Exclude packets with ANY of the following fields)<br />
or Intersection AND Exclusion (=Exclude packets with ALL of<br />
the following fields.)<br />
Step 5<br />
Step 6<br />
If desired, set the search Direction and Origin.<br />
Click OK.<br />
After the search finishes, the program displays the packets meeting the<br />
search criteria.<br />
Find Next<br />
To apply the previous Find parameters to the next search:<br />
• Select Find Next under Search on the Menu Bar.<br />
OR<br />
Click<br />
on the Tool Bar.<br />
Search Direction<br />
Toggles the search forward or backwards. The current direction is indicated<br />
in the menu.<br />
137
<strong>LeCroy</strong> <strong>USBTracer</strong>/<strong>Trainer</strong> User <strong>Manual</strong><br />
SW Version 2.20<br />
10.2 Edit Comment<br />
You can create, view, or edit the 100-character comment field associated<br />
with each Trace file. These comments are visible in the Windows ® Explorer<br />
if the "Comments" attribute is included in the Details view.<br />
Step 1<br />
Select Edit Comment under File on the Menu Bar.<br />
You see the Edit comment for trace file window:<br />
Step 2<br />
Step 3<br />
Create, view, or edit the comment.<br />
Click OK.<br />
You can view comments in Windows Explorer by selecting the<br />
"Comments" attribute.<br />
10.3 Reports<br />
The Report menu provides several reports to assist you in analyzing USB<br />
traffic recorded by the Analyzer.<br />
138
<strong>LeCroy</strong> <strong>USBTracer</strong>/<strong>Trainer</strong> User <strong>Manual</strong><br />
SW Version 2.20<br />
File Information<br />
To display a File Information report:<br />
• Select File Information under Report in the Menu Bar.<br />
OR<br />
• Click in the Tool Bar to display the File Information screen:<br />
The File Information report provides information about how the recording<br />
was made, what the buffer settings were, what the trigger options were, and<br />
what version of all the Analyzer hardware was used to make the recording.<br />
139
<strong>LeCroy</strong> <strong>USBTracer</strong>/<strong>Trainer</strong> User <strong>Manual</strong><br />
SW Version 2.20<br />
Error Summary<br />
The Error Summary details all errors analyzed throughout the recording.<br />
• Select Error Summary under Report in the Menu Bar<br />
OR<br />
• Click in the Tool Bar to display the Error screen below the<br />
Trace View:<br />
140
<strong>LeCroy</strong> <strong>USBTracer</strong>/<strong>Trainer</strong> User <strong>Manual</strong><br />
SW Version 2.20<br />
Timing Calculations<br />
The Timing Calculator is used to measure timing between any two packets.<br />
• Select Timing Calculations under Report in the Menu Bar<br />
OR<br />
• Click in the Tool Bar to display the Timing and Bus Usage<br />
Calculator screen:<br />
141
<strong>LeCroy</strong> <strong>USBTracer</strong>/<strong>Trainer</strong> User <strong>Manual</strong><br />
SW Version 2.20<br />
Traffic Summary<br />
Traffic Summary summarizes the numbers and types of packets,<br />
transactions etc. that occurred in the open trace.<br />
To run Traffic Summary, select Report >Traffic Summary or<br />
click the button marked . The program prompts you to specify a range<br />
of packets, then displays the following window:<br />
142
<strong>LeCroy</strong> <strong>USBTracer</strong>/<strong>Trainer</strong> User <strong>Manual</strong><br />
SW Version 2.20<br />
Bus Utilization<br />
The Bus Utilization window displays information on bandwidth use for the<br />
three recording channels.<br />
To open the Bus Utilization window, select Report >Bus Utilization or<br />
click the button marked . A window opens with graph areas:<br />
143
<strong>LeCroy</strong> <strong>USBTracer</strong>/<strong>Trainer</strong> User <strong>Manual</strong><br />
SW Version 2.20<br />
Bus Utilization Buttons<br />
The Bus Utilization window has a row of buttons for changing the format of<br />
the displayed data and for exporting data:<br />
The buttons have the following functions:<br />
Save As - Saves the graphs<br />
as a bitmap file (*.bmp)<br />
Email - Creates an email<br />
with a *.bmp file attachment<br />
of the graphs<br />
Print<br />
Vertical zoom in<br />
Vertical zoom out<br />
Click and Drag zoom - Click diagonally to<br />
select and zoom in on part of the graph<br />
Full Screen<br />
View Settings - opens a<br />
sub-menu with options for<br />
formatting the display. See<br />
“View Settings Menu”<br />
below.<br />
Horizontal zoom in<br />
Select Range<br />
Sync and Graph areas - If two or more<br />
graphs are displayed, this button<br />
synchronizes the graphs to one another. Once<br />
synchronized, the positioning slider of one<br />
graph moves the other graphs.<br />
Graph Areas - Presents options for<br />
displaying additional graphs of data lengths,<br />
packet lengths, and percentage of bus<br />
utilized.<br />
Horizontal zoom out<br />
144
<strong>LeCroy</strong> <strong>USBTracer</strong>/<strong>Trainer</strong> User <strong>Manual</strong><br />
SW Version 2.20<br />
View Settings Menu<br />
Clicking the View Settings button causes a menu<br />
to open with options for formatting the display.<br />
• Orient Horizontally: changes the orientation<br />
of bus usage to horizontal. After selecting<br />
this option, the menu has Orient Vertically.<br />
• Tile Vertically: tiles the two graphs<br />
vertically (i.e., side by side). After selecting<br />
this option, the menu has Tile Horizontally.<br />
• Show Markers: Places "tick" marks along<br />
the x axis of each graph.<br />
• Show Plumb Line<br />
• Status: Opens a sub-menu with the following<br />
options:<br />
• Bar: Displays a status bar at bottom of graph.<br />
• Tooltip: Causes a tooltip to appear if you position your mouse<br />
pointer over part of the graph and leave it there for a couple of<br />
seconds.<br />
• None: Turns off tooltips and the status bar.<br />
• Grid Lines: Opens a sub-menu with the following options:<br />
— Both: Displays both X and Y axis gridlines<br />
— X Axis: Displays X axis gridlines<br />
— Y Axis: Display Y axis gridlines<br />
— None: Turns off gridlines<br />
• Grid on Top: Moves the grid lines above the graph.<br />
145
<strong>LeCroy</strong> <strong>USBTracer</strong>/<strong>Trainer</strong> User <strong>Manual</strong><br />
SW Version 2.20<br />
• Fonts and Colors - Opens a dialog box for setting the colors and<br />
fonts used in the graphs:<br />
Graph Areas Menu<br />
The Graph Areas menu allows you to view different information in the Bus<br />
Utilization window.<br />
To view information:<br />
Step 1 Click the button to open the Graph Areas menu.<br />
Step 2<br />
Step 3<br />
Select the data you want to appear in the Graph Areas window.<br />
To make a new graph, click New.<br />
146
<strong>LeCroy</strong> <strong>USBTracer</strong>/<strong>Trainer</strong> User <strong>Manual</strong><br />
SW Version 2.20<br />
To change the properties in the Bus Utilizations graph:<br />
Step 1<br />
In the Graph Area properties dialog box, select what you want your<br />
graph to display, then click OK.<br />
Step 2<br />
To make a new graph, click New.<br />
Real Time Monitoring<br />
The Real-Time Statistics window displays a graph of real-time link activity.<br />
Real Time Statistics displays a summary of the traffic currently being<br />
recorded by the analyzer.<br />
147
<strong>LeCroy</strong> <strong>USBTracer</strong>/<strong>Trainer</strong> User <strong>Manual</strong><br />
SW Version 2.20<br />
To display the Real-Time Statistics window, click<br />
open the Real Time Statistics window:<br />
in the Tool Bar to<br />
In order to see a graph of traffic, you must start recording.<br />
After starting InfiniBand link activity, press to start the Real-Time<br />
statistics monitor. As traffic is recorded, data is streamed in real time to this<br />
window and presented in a format of your choice.<br />
To stop the monitor, press .<br />
Real-Time Statistics Buttons<br />
The Real-Time Statistics toolbar has buttons for changing the format of the<br />
displayed data and for exporting data:<br />
The buttons have the following functions:<br />
Save As - Saves Real-Time<br />
graphs as bitmap files<br />
(*.bmp)<br />
Email - Creates an email<br />
with a *.bmp file attachment<br />
of the graphs<br />
Print<br />
Vertical zoom in<br />
Vertical zoom out<br />
Click and Drag zoom - Click diagonally to<br />
select and zoom in on part of the graph<br />
Full Screen<br />
Select Range<br />
148
<strong>LeCroy</strong> <strong>USBTracer</strong>/<strong>Trainer</strong> User <strong>Manual</strong><br />
SW Version 2.20<br />
View Settings - opens a<br />
sub-menu with options for<br />
formatting the display. See<br />
“View Settings Menu”<br />
below.<br />
Horizontal zoom in<br />
Horizontal zoom out<br />
Sync and Graph areas - If two or more<br />
graphs are displayed, this button<br />
synchronizes the graphs to one another. Once<br />
synchronized, the positioning slider of one<br />
graph moves the other graphs.<br />
Graph Areas - Presents options for<br />
displaying additional graphs of data lengths,<br />
packet lengths, and percentage of bus<br />
utilized.<br />
Start. Starts the Real-Time Monitor.<br />
Stop Real-Time Monitoring.<br />
Reset. Resets the graphs.<br />
Real-Time Statistical Monitor Pop-up Menu<br />
If you right-click a graph in the Real-Time window,<br />
a pop-up menu appears with options for changing the<br />
format of the display:<br />
• Undo Zoom: If you have zoomed in, undoes<br />
the zoom.<br />
• Fit to Graph Area: Displays graph so that<br />
the entire trace fits inside the graph area.<br />
• Y Scale Type:<br />
• Linear: Converts display to linear<br />
format.<br />
• Logarithmic: Converts display to logarithmic format.<br />
• Hide: Hides the selected graph.<br />
• Properties: Opens a dialog box with options for changing the<br />
colors, titles and other features of the graphs.<br />
Displaying Multiple Graphs<br />
The Real Time Statistics window gives you the ability to create up to three<br />
separate graphing windows so that you can create separate graphs of traffic<br />
and tile them vertically. Within these windows, you can format the graphs<br />
in a number of ways.<br />
• To view two or three graphs simultaneously,<br />
click the Graph Areas button.<br />
149
<strong>LeCroy</strong> <strong>USBTracer</strong>/<strong>Trainer</strong> User <strong>Manual</strong><br />
SW Version 2.20<br />
The following menu opens.<br />
Selecting a checkbox displays the selected graph type:<br />
• Statistics Accumulation: Plots the percentage of Link utilization<br />
by non-idle traffic for both directions of the link.<br />
• Data Packet Count (Packets/s): Plots counts of Data Packets per<br />
second for both directions of the link.<br />
• Data Payload Throughput (MBytes): Plots data payload<br />
throughput for both directions of the link.<br />
• Bus Usage: Plots amount of Bus usage.<br />
150
<strong>LeCroy</strong> <strong>USBTracer</strong>/<strong>Trainer</strong> User <strong>Manual</strong><br />
SW Version 2.20<br />
11. Traffic Generation with USB<strong>Trainer</strong><br />
USB<strong>Trainer</strong> is a USB Traffic Generator module that plugs into the right<br />
slot of the Universal Protocol Analyzer System (UPAS).<br />
USB<strong>Trainer</strong> is designed to generate USB traffic so that engineers can test<br />
designs under realistic conditions. Traffic Generation can also be used to<br />
transmit known bad packets, providing an opportunity for engineers to<br />
observe how a device handles specific adverse conditions.<br />
USB<strong>Trainer</strong> Traffic Generation Files<br />
USB<strong>Trainer</strong> generates USB traffic from traffic generation files (*.utg)<br />
which are text-based script files that instruct the Generator how to generate<br />
USB traffic. These script files can be edited with either a simple text editor<br />
such as Notepad or with the Script Editor utility provided by the<br />
<strong>USBTracer</strong> application. The Script Editor utility has several aids to<br />
simplify the process of writing and editing scripts: tool-tips, drop-down<br />
menus, and colored fields.<br />
The script example below shows the beginning of a traffic generation file<br />
created through the Export command. This command provides an easy way<br />
to create a generation file - you open a trace file, then run the Export<br />
command. The trace serves as a blueprint for the traffic generation file.<br />
151
<strong>LeCroy</strong> <strong>USBTracer</strong>/<strong>Trainer</strong> User <strong>Manual</strong><br />
SW Version 2.20<br />
The example below shows several commented lines followed by some<br />
instructions.<br />
This generation file causes USB<strong>Trainer</strong> to simulate a hub and to generate<br />
24,320 packets. See “Device Emulation” on page 160 for details about the<br />
format of traffic generation files.<br />
Creating Traffic Generation Files<br />
If you choose to write a script with a text editor, a good way to start is to edit<br />
the sample generation file that is provided: HS_Hub_Sample.utg. This file<br />
is located in the same directory as the USB<strong>Trainer</strong> application (for example,<br />
C:\Program Files\<strong>LeCroy</strong>\USB<strong>Trainer</strong>). You can open this generation<br />
file with Notepad or other editor and then add or remove text as needed.<br />
Creating a Traffic Generation File with the Export Command<br />
The Export command on <strong>USBTracer</strong> offers an easy alternative method of<br />
creating a generator file. This command converts the trace to a *.utg file,<br />
removes all device traffic, and leaves only the traffic from the host device.<br />
You can then use this file to emulate the host and determine whether the<br />
device under test is generating the correct traffic.<br />
When creating a .utg file through the Export Packets to Text (Generator<br />
Text File Format) menu selection, it is suggested that you use the default<br />
values presented. Adding NAK transactions clutters the .utg file, and<br />
including the device side packets creates a .utg file which does not work<br />
with a real device attached.<br />
To use the Export command:<br />
Step 1<br />
Step 2<br />
Start <strong>USBTracer</strong>.<br />
Open a trace that has the pattern of traffic you would like to generate.<br />
152
<strong>LeCroy</strong> <strong>USBTracer</strong>/<strong>Trainer</strong> User <strong>Manual</strong><br />
SW Version 2.20<br />
Step 3<br />
Select File > Export from the menu bar to display the File Export<br />
menu:<br />
Step 4<br />
Step 5<br />
Note<br />
Select Packets to Text (Generator<br />
Text File Format) from the Export<br />
drop-down menu.<br />
You see the Export to Generator<br />
Text window:<br />
Enter the numbers of the first and last<br />
packets in the series.<br />
The device packets are removed from<br />
the exported generator text. This is<br />
essential in creating a generator text<br />
file that can be used to handshake<br />
with your device.<br />
Step 6<br />
You can opt to regenerate the frame numbers and remove the<br />
NAKed transactions.<br />
Once the generator text file is exported, you may need to edit the file and<br />
adjust idle time to properly anticipate the responses from your device.<br />
153
<strong>LeCroy</strong> <strong>USBTracer</strong>/<strong>Trainer</strong> User <strong>Manual</strong><br />
SW Version 2.20<br />
11.1 Editing a Generation File<br />
A .utg file is a text file that can be edited with any text editor such as<br />
Notepad. A better editing option, however, is Script Editor, an utility that is<br />
built into the <strong>USBTracer</strong> application. Script Editor provides the usual<br />
editing functions such as select, cut, copy, and paste but also adds tool-tips,<br />
colored keywords, drop-down parameter values, and<br />
expandable/collapsible packet data fields.<br />
To launch the Script Editor, click the Script Editor button on the<br />
toolbar or right-click the trace window and choose Edit as Text.<br />
The Script Editor window opens in the lower portion of the trace window.<br />
The Script Editor divides into three areas: the toolbar, the script window,<br />
and the file tabs at the bottom of the window. If errors occur, a log opens at<br />
the bottom of the window.<br />
Toolbar<br />
The Script Editor toolbar contains buttons for saving your edits, navigating,<br />
searching and other functions.<br />
154
<strong>LeCroy</strong> <strong>USBTracer</strong>/<strong>Trainer</strong> User <strong>Manual</strong><br />
SW Version 2.20<br />
The buttons have the following functions:<br />
Save. Saves your edits and<br />
immediately updates the setting bars<br />
and Frames shown in the trace<br />
window.<br />
View Options. Opens a menu with<br />
three options: Enable Outlining,<br />
Toggle Outlining, and Line Numbers.<br />
See View Options Menu below.<br />
Add/Remove bookmark. Allows<br />
markers to be set or removed to<br />
aid in navigation.<br />
Go to next bookmark.<br />
Cut.<br />
Go to previous bookmark.<br />
Copy.<br />
Clear all bookmarks.<br />
Paste.<br />
Find.<br />
Undo.<br />
Find and Replace.<br />
Redo.<br />
Print.<br />
View Options Menu<br />
The View Options button has a menu with three options:<br />
• Enable Outlining: Adds an<br />
expandable/collapsible tree structure to the left<br />
side of the Script Editor showing the hierarchical<br />
relationships of the script lines.<br />
• Show Line Numbers: Adds line numbers to the<br />
left side of the Script Editor window.<br />
• Show Tooltips: Enables tooltips to appear when the mouse pointer<br />
is suspended over a script item.<br />
Pop-up Menu<br />
Right click anywhere in the script window to<br />
open a pop-up menu with the following options:<br />
• Cut<br />
• Copy<br />
• Paste<br />
• Position Trace View on Packet xxx<br />
• List Values<br />
• Toggle Outlining<br />
155
<strong>LeCroy</strong> <strong>USBTracer</strong>/<strong>Trainer</strong> User <strong>Manual</strong><br />
SW Version 2.20<br />
The List Values option displays the types of values that can be entered for a<br />
parameter in a line. To see the types of values, select the current parameter,<br />
then choose Show Values from the pop-up menu.<br />
File Tabs<br />
At the bottom of the window is a tab that shows the name of the .utg file. If<br />
your .utg file has an Include statement in it, the supporting Include files<br />
automatically open when the .utg file is first opened. Tabs for the opened<br />
Include files appear at the bottom of this window.<br />
Error Log<br />
Whenever you create a scripting error, a log opens at the bottom of the<br />
application window. When the error is corrected, the window automatically<br />
closes.<br />
Tooltips<br />
The Script Editor window includes extensive tooltips for each keyword. To<br />
see a tooltip, hold the mouse pointer over a keyword.<br />
11.2 Loading the Generation File<br />
The USB Traffic Generation files are scripts that instruct the analyzer how<br />
to generate USB traffic. A traffic generation file contains text in special<br />
format and is named with a "*.utg" extension. These files can be created by<br />
any text editor, or using the File > Export > Packets to Text<br />
(Generator File Format) menu selection when viewing a Trace File. There<br />
are several examples of Traffic Generation files included with the<br />
installation of the <strong>USBTracer</strong> software.<br />
156
<strong>LeCroy</strong> <strong>USBTracer</strong>/<strong>Trainer</strong> User <strong>Manual</strong><br />
SW Version 2.20<br />
To load a generation file:<br />
Step 1<br />
Select File > Open ... from the menu to display the Open dialog box:<br />
Step 2<br />
Step 3<br />
Step 4<br />
Select USB Tracer Generation Files (*.utg) from the drop-down<br />
menu marked Files of Type to display a list of Traffic Generation<br />
files.<br />
Select a Traffic Generation file (*.utg).<br />
Click Open.<br />
157
<strong>LeCroy</strong> <strong>USBTracer</strong>/<strong>Trainer</strong> User <strong>Manual</strong><br />
SW Version 2.20<br />
The file opens.<br />
Step 5<br />
Decide how many times you want the traffic<br />
pattern to be generated, then select a value<br />
from the Repeat drop-down menu.<br />
The Repeat mode allows for a single pass through the generation<br />
file, looping forever, or looping 1 to 65,534 times, as desired by the<br />
user. If a "wrap=HERE" location is found in the .utg file, that<br />
location is where the looping portion begins. The loop end is at the<br />
end of the .utg file or up to the "stop=HERE" statement in the file.<br />
158
<strong>LeCroy</strong> <strong>USBTracer</strong>/<strong>Trainer</strong> User <strong>Manual</strong><br />
SW Version 2.20<br />
Step 6<br />
Select the Generation mode in which to generate traffic (see below<br />
for an explanation) by depressing or undepressing the<br />
IntelliFrame button<br />
on the toolbar:<br />
• Depressed = IntelliFrame<br />
• Undepressed = Bitstream<br />
Traffic Generation Modes: Bitstream vs. Intelliframe<br />
IntelliFrame and Bitstream are modes that control how the generator<br />
interacts with other devices when it is generating traffic.<br />
• Bitstream Mode -In Bitstream Mode, the generator constructs a<br />
bitstream of traffic based on the UTG file and assumes that packets start<br />
at pre-calculated times. For example, after an IN packet, the generator<br />
waits a calculated fixed time before presenting an ACK. The time<br />
between them is determined by the "idle=" time statement in between the<br />
IN and ACK packets in the .utg file. In this mode, every bit time of a<br />
generation stream (including idles and SE0's) is represented by 4 bits of<br />
data, so the file to be downloaded to the Generator can be very large.<br />
• IntelliFrame Mode - In IntelliFrame mode, the generator can wait for<br />
Device responses to complete before it continues generating more host<br />
packets. For example, after issuing an IN, the generator looks for the<br />
DATAx packet issued by the device to finish, and then issues an ACK.<br />
This way, the data length can vary and does not need to be pre-calculated.<br />
Also, using the "idle=TO_EOF" statement allows the generator to<br />
calculate where the end of the frame occurs, so that a subsequent<br />
"frame=AUTO" statement creates a Start of Frame at the correct time.<br />
Moreover, the Generator can be made to retry transactions that are<br />
NAKed automatically, and to use the PING protocol where appropriate.<br />
Retries can be made to occur within the same frame or in the next frame.<br />
For further information on the flexible behavior that can be instituted<br />
during the generation, see the syntax descriptions for the generation files<br />
here. An additional advantage of the IntelliFrame mode is that it creates<br />
an image in the Generator's memory that is MUCH smaller than that of<br />
the Bitstream mode, so it downloads much faster.<br />
Note<br />
Device emulation only works in Intelliframe mode.<br />
Starting Traffic Generation<br />
To start traffic generation, click<br />
on the Tool Bar.<br />
159
<strong>LeCroy</strong> <strong>USBTracer</strong>/<strong>Trainer</strong> User <strong>Manual</strong><br />
SW Version 2.20<br />
Repeating a Generation Session<br />
If you wish to repeat a generation session, press the<br />
Traffic Generation Start/Stop<br />
the .utg file.<br />
button again. There is no need to reload<br />
You can make an additional entry in a Generator Text File that allows you<br />
to specify a portion of the file for repetition:<br />
• Enter wrap=here in the Generator Text File.<br />
The traffic above the entry is run only once. The traffic below the entry is<br />
repeated continuously.<br />
Note<br />
For a usage example, see the sample file Wrap.utg.<br />
Stop Traffic Generation<br />
To instruct the Analyzer to halt traffic generation:<br />
• Click on the Tool Bar.<br />
11.3 Device Emulation<br />
Device Emulation is a licensed option that allows USB<strong>Trainer</strong> to generate<br />
device-side traffic. Like host traffic generation, device emulation uses<br />
text-based generation files (.utg) to generate traffic.<br />
Device emulation has three steps: create a generation file, configure<br />
generation settings, and then generate traffic.<br />
Creating a Generation File<br />
Generation files can be created one of two ways:<br />
• Write a generation script file using either <strong>LeCroy</strong>'s<br />
context-sensitive script editor or any text editor that you choose.<br />
OR<br />
• Use a pre-recorded trace file that has the type of traffic that you<br />
want to generate. This file is a blueprint for the traffic generation<br />
script file.<br />
If you decide to use a pre-recorded trace file as a generation blueprint, then<br />
verify that the trace file contains traffic for only one device. If it does not,<br />
hide all the other devices (Setup > Level Hiding) and save the file as a new<br />
file without the hidden traffic (File > Save As and check the option Do not<br />
save hidden packets/transactions/transfers).<br />
160
<strong>LeCroy</strong> <strong>USBTracer</strong>/<strong>Trainer</strong> User <strong>Manual</strong><br />
SW Version 2.20<br />
Setting Generation Options<br />
Step 1<br />
Step 2<br />
Step 3<br />
Set the Traffic Generation options by configuring the Misc page in<br />
the Recording Options dialog box:<br />
Setup > Recording Options > Misc<br />
In the Misc page, select Device Emulation Mode.<br />
Configure Resume settings.<br />
• If you want the simulated device to issue Resumes, then select<br />
Device Resumes and enter a delay time (in milliseconds). If<br />
you do not select Device Resumes, then the emulated device<br />
waits for a Host to issue a Resume.<br />
• If you want the simulated device to take its address from the<br />
Traffic Generation (.utg) script file, then select<br />
Use Address in .utg file. This option causes the USB<strong>Trainer</strong> to<br />
read the .utg file and assign a Device Address based on the<br />
device traffic that it sees in the file.<br />
Note<br />
Step 4<br />
In this release, the Device Emulator does not look at the Set<br />
Address in the script, so if your host controller is running more<br />
than one device, it may enumerate your device emulator<br />
incorrectly when you begin to generate traffic. The solution is to<br />
manually assign a device address. To manually configure the<br />
Device Address, select Emulated Device's Hex Address and<br />
enter an address or mask (Note: A mask allows the USB<strong>Trainer</strong><br />
to respond to multiple device addresses.)<br />
Click OK to close the Recording Options dialog and apply the<br />
changes. The generation settings take effect as soon as you execute<br />
a script.<br />
Run the Traffic Generation Script File<br />
Step 1 Connect the USB<strong>Trainer</strong>'s port B (either Hi Speed or Classic Speed)<br />
to the Host.<br />
Step 2<br />
Open the Traffic Generation .utg file.<br />
Step 3 Begin traffic generation by clicking .<br />
161
<strong>LeCroy</strong> <strong>USBTracer</strong>/<strong>Trainer</strong> User <strong>Manual</strong><br />
SW Version 2.20<br />
When execution begins, USB<strong>Trainer</strong> reads the entire generation file and<br />
then parses the generation commands into groups according to their<br />
endpoints. Each of the parsed groups of commands are then written into<br />
dedicated memory segments in the generator. Up to eight memory segments<br />
can be created for the various endpoints. In the case of Endpoint 0 or any<br />
Control endpoints, a single memory segment is created.<br />
Each memory segment can be thought of as a queue of the commands and<br />
responses for a particular endpoint that occur in the generation file.<br />
Commands are stored sequentially within each memory segment as they<br />
occur in the generation file. For example, if a generation file has a sequence<br />
of command X and Y for the Endpoint 1, the commands are extracted in this<br />
order and placed in the Endpoint 1 memory segment.<br />
When the host calls for a particular device endpoint response, the first<br />
command listed in that endpoint memory segment is then executed. With<br />
each subsequent call to the same endpoint, commands are executed<br />
sequentially down the list as they occur in the memory segments. For<br />
example, if three calls were made to Endpoint 0 IN, then the first three<br />
commands in that endpoint's memory segment would then execute.<br />
Note<br />
Each of the endpoint memory segments execute independently:<br />
there are no behavioral interactions between the individual<br />
endpoints.<br />
11.4 Format of the Traffic Generation Files<br />
Whether you create a traffic generation from scratch or use the Export<br />
command in <strong>USBTracer</strong>, there are a few rules about the format of the<br />
generation file that you should review. These are presented in this section.<br />
162
<strong>LeCroy</strong> <strong>USBTracer</strong>/<strong>Trainer</strong> User <strong>Manual</strong><br />
SW Version 2.20<br />
Traffic is generated from a text file named *.utg. Within the text file:<br />
• The data format for data fields such as Pids and Raw bits is hex.<br />
• Each packet definition consists of this set of assignments:<br />
key=value.<br />
• White space is permitted around the equal sign.<br />
• There are no restrictions on dividing packet definition to lines nor is<br />
it necessary to define each packet in a separate line, although it is<br />
recommended.<br />
• The maximum number of characters in a line is 250.<br />
• The characters # and; indicate end-of-line comments (i.e. the rest of<br />
the line is ignored)<br />
• Comments are not allowed within brackets ( ).<br />
• No keys or values are case-sensitive.<br />
Each packet definition starts with one of these assignments:<br />
• pid=N (where N is a string representing a valid packet identifier or<br />
an eight bit value)<br />
OR<br />
• frame=N (where N is an eleven bit value of the frame number or<br />
the strings auto and keep_alive).<br />
A bus condition definition starts with one of these assignments:<br />
• reset=N (where N is a positive integer or string)<br />
• suspend=N (where N is a positive integer)<br />
• resume=N (where N is a positive integer)<br />
• chirp=here<br />
Subsequent assignments after a packet’s starting assignment define the<br />
values of particular fields within the packet. If a field is not defined, it is<br />
assumed to be 0. Values are assumed to be decimal unless they are prefixed<br />
with 0x and then are interpreted as hexadecimal. Values within a data block<br />
assignment are always assumed to be hexadecimal and should not be<br />
prefixed by 0x.<br />
163
<strong>LeCroy</strong> <strong>USBTracer</strong>/<strong>Trainer</strong> User <strong>Manual</strong><br />
SW Version 2.20<br />
Table 2: Support Keys for Defining Fields within a Packet<br />
Key Code Format Description<br />
File Control Keys<br />
file_type<br />
’UPAS’<br />
This must be included at the beginning of the file to<br />
’CHIEF’<br />
determine the speed of packets to be generated. Value<br />
must be "file_type=UPAS" to allow for High speed<br />
traffic, IntelliFrame operation, 'expected_pid' and<br />
'device_pid' key support. Full and Low speed traffic, and<br />
Bitstream operation are supported on all "file_type="<br />
values. If this statement does not appear in the file, the<br />
default is "file_type=CHIEF", allowing backward<br />
compatibility with older USB Chief .usb files.<br />
file_version integer This must be included after the "file_type=" key to<br />
determine the version of this file. Value is currently 3.<br />
Usage: "file_version=3"<br />
file_mode<br />
’HOST’<br />
Sets generation mode to host or device. For generation to<br />
’DEVICE’<br />
work, this must match the selection found in the<br />
Recording Options > Misc dialog.<br />
file_speed<br />
'HIGH'<br />
This must be included after the "file_version=" key to<br />
’HI’<br />
determine the speed of packets to be generated. Values<br />
are "HIGH', 'HI', 'FULL', or 'LOW'. Example:<br />
’FULL’<br />
"file_speed=FULL". Only one "file_speed=" is allowed<br />
'LOW'<br />
per .utg file, but low speed traffic on a full speed bus can<br />
be created by adding the "speed=LOW" key to a low<br />
speed packet in a file defined as "file_speed=FULL". No<br />
other mixing of speeds is allowed. 'HI' is the same as<br />
'HIGH' and was added to conform to the USB terms.<br />
loop_count<br />
wrap_count<br />
wrap<br />
loop<br />
0 through 16382<br />
or "infinite"<br />
’HERE’<br />
These two terms are interchangeable.<br />
Device Emulation Only. This key defines the loop count<br />
for each memory segment. Examples:<br />
"loop_count=INFINITE" or "wrap_count=9"<br />
This key marks the "wrap point" in the traffic. When<br />
generation is in Repeat mode, all the traffic before the<br />
wrap point is going to be sent once, all the traffic after the<br />
wrap point is going to be repeated in a loop.<br />
The usage of the keyword is "wrap=HERE" or<br />
"loop=HERE". For Device Emulation, the value would be<br />
a memory segment number, so that the looping is<br />
associated with only that one endpoint, such as "wrap=4".<br />
skip ’HERE’ Causes a region in the .utg file to be ignored, as if<br />
commented out. Can be used multiple times in the file.<br />
Must be used in conjunction with "skip_end=HERE".<br />
Example:<br />
skip=HERE frame=auto makes this statement be ignored!<br />
skip_end=HERE<br />
skip_end ’HERE’ Causes a region in the .utg file to be ignored, as if<br />
commented out. See above in "skip=HERE".<br />
164
<strong>LeCroy</strong> <strong>USBTracer</strong>/<strong>Trainer</strong> User <strong>Manual</strong><br />
SW Version 2.20<br />
Key Code Format Description<br />
stop string If you want to run only some first portion of the<br />
beginning of a .utg file, insert this statement where you<br />
want generation to halt. This saves having to edit a file<br />
into smaller files when testing a portion of traffic.<br />
The usage of the keyword is "stop=HERE".<br />
break ’HERE’ Host Generation Only. Enables you to generate up to a<br />
point in the .utg file, then wait for input before continuing<br />
in the file. During the breakpoint time, the traffic signal<br />
icon in the toolbar flashes yellow, indicating that a<br />
breakpoint was hit. When you click the traffic light icon,<br />
the generation resumes. If you want to stop rather than<br />
continue, select Stop from the Generation menu or hit the<br />
Start/Stop button on the front of the generator module.<br />
Start-of-frames are issued automatically during the<br />
breakpoint duration. When you resume running, traffic<br />
begins after another start-of-frame is issued.<br />
The "break=HERE" statement must be inserted between<br />
"frame=xxx" statements.<br />
Syntax example:<br />
frame=AUTO break=HERE frame=AUTO<br />
Endpoint Configuration<br />
begin_config 'HERE' Defines the beginning of the region in the file used to<br />
configure the endpoint types. The configuration is<br />
necessary to determine the default behavior of the NAK<br />
retry mechanism during IntelliFrame operation.Between<br />
the "begin_config=HERE" and the "end_config=HERE"<br />
statements is a series of "config_endpoint=xxx"<br />
statements, which define each endpoint's type and default<br />
retry behavior. The config region must precede any actual<br />
packet or bus condition statements. For Device<br />
Emulation, the config region is mandatory. It provides the<br />
mapping of the endpoints into their corresponding<br />
segments of analyzer memory, which contain the traffic<br />
for those endpoints. When exporting to a .utg file from a<br />
trace file, these sections are created automatically.<br />
Syntax example: begin_config=HERE<br />
end_config 'HERE' Terminates the region in the file used for configuring the<br />
endpoints. See "begin_config".<br />
Syntax example: end_config=HERE<br />
config_endpoint<br />
‘CONTROL’<br />
‘INTERRUPT’<br />
‘ISOCHRONOUS’<br />
‘BULK’<br />
Begins a statement that defines a particular endpoint's<br />
type, default retry behavior (Host Generation only), and<br />
memory segment (Device Emulation only)<br />
Usage example: config_endpoint=BULK addr=1 endp=3<br />
direction=OUT retry=TRUE<br />
retry_next_frame=FALSE<br />
165
<strong>LeCroy</strong> <strong>USBTracer</strong>/<strong>Trainer</strong> User <strong>Manual</strong><br />
SW Version 2.20<br />
Key Code Format Description<br />
endp_mem_seg 1<br />
2<br />
3<br />
4<br />
5<br />
6<br />
7<br />
8<br />
Device Emulation Only. Separates each endpoint<br />
function into a different queue (also referred to as a<br />
Memory Segment) of commands and responses. There<br />
are a maximum of eight of these queues, and each has a<br />
unique address/direction combination. For control<br />
endpoints, one queue is shared by both directions of the<br />
endpoint. Traffic on the Default Endpoint (Address 0,<br />
Endpoint 0) shares the same queue as the endpoint 0 of<br />
the selected device address (the address it gets from the<br />
Host through the SetAddress request). These always use<br />
"endp_mem_seg=1". These are all set automatically when<br />
exporting a trace file to a Device Emulation .utg file.<br />
direction<br />
retry<br />
‘IN’<br />
‘OUT’<br />
‘TRUE’<br />
‘FALSE’<br />
Defines the transfer direction of data for the specified<br />
endpoint. For all transfer types but CONTROL, there can<br />
be two distinct logical connections using the same<br />
address and endpoint. They would differ only in defined<br />
direction.<br />
Syntax example: direction=IN<br />
Host Generation Only. Defines whether an automatic<br />
retry should be performed on packets to/from this<br />
endpoint in the case that they are NAKed (or in some<br />
cases 'NYETed'), or if a timeout on device response<br />
occurs.<br />
RETRY only works for the Pids: Setup, In, and Out.<br />
If 'TRUE', the <strong>Trainer</strong> automatically retries the specified<br />
sequence if a Pid is received on the bus which does not<br />
match the 'expected_pid', or if a timeout occurs. The<br />
generator re-issues the host packet(s) after waiting either<br />
1/10th of a frame, or until after the next start-of-frame<br />
(depending on the value set for 'retry_next_frame') The<br />
retries continue until the 'expected_pid' is received. When<br />
a retry attempt finds its 'expected_pid', the <strong>Trainer</strong><br />
automatically generates a new start-of-frame before<br />
continuing with the rest of the Gen File. (The<br />
start-of-frame is either an SOF packet or a keep-alive<br />
signal.)<br />
If 'FALSE', the <strong>Trainer</strong> waits for a Pid before proceeding.<br />
There is no timeout. If a Pid is received which does not<br />
match the 'expected_pid', the <strong>Trainer</strong> continues to wait for<br />
the correct Pid to appear. If the user stops the generation,<br />
a message states that the generator was waiting patiently<br />
for the "expected_pid", and it never showed up. The user<br />
must examine the problem by viewing the trace file.<br />
This statement can also be used in conjunction with any<br />
"pid=xxx" statement in the .utg file. This can be done to<br />
override the configured or default retry behavior.<br />
Syntax example: retry=TRUE<br />
166
<strong>LeCroy</strong> <strong>USBTracer</strong>/<strong>Trainer</strong> User <strong>Manual</strong><br />
SW Version 2.20<br />
Key Code Format Description<br />
retry_next_frame<br />
‘TRUE’<br />
‘FALSE’<br />
Host Generation Only. Determines when a retry will be<br />
attempted after a failed match of an 'expected_pid'. This<br />
statement only applies if a "retry=TRUE" statement also<br />
exists.<br />
If 'TRUE', the <strong>Trainer</strong> waits until the current frame<br />
completes, issues a start of frame, and then retries the<br />
transaction.<br />
If 'FALSE', the <strong>Trainer</strong> waits 1/10th of a frame before<br />
retrying the transaction. Before each retry attempt, the<br />
<strong>Trainer</strong> checks to see where in the frame interval it is. If it<br />
is too close to the EOF, it automatically generates the<br />
next start-of-frame before performing the retry. If it is not<br />
too close to the EOF, it performs the retry without<br />
generating a new frame.<br />
This statement can also be used in conjunction with any<br />
"pid=xxx" statement in the .utg file. This can be done to<br />
override the configured or default retry behavior.<br />
Syntax example: retry_next_frame=FALSE<br />
ping_on_retry<br />
ping_after_nyet<br />
‘TRUE’<br />
‘FALSE’<br />
Host Generation Only. Determines whether an OUT<br />
transaction is retried by repeating the OUT-DATAx<br />
sequence, or whether a PING sequence should be<br />
initiated.<br />
If 'TRUE', the <strong>Trainer</strong> automatically generates PINGs<br />
(and retries) before going through a Retry Loop. PINGs<br />
are repeated until an ACK is received, and then the<br />
original OUT-DATAx transaction Sequence is attempted.<br />
During the PING retries, the trainer automatically<br />
generates frames. When the original Retry Sequence<br />
receives its 'expected_pid', the <strong>Trainer</strong> generates a new<br />
frame before continuing with the Gen File.<br />
If 'FALSE', the original transaction is always retried.This<br />
statement can also be used in conjunction with any<br />
"pid=xxx" statement in the .utg file. This can be done to<br />
override the configured or default retry behavior.<br />
Syntax example: ping_on_retry=TRUE<br />
Host Generation Only.<br />
If 'TRUE', the <strong>Trainer</strong> automatically generates PINGs<br />
(and retries) after receiving a NYET instead of the<br />
'expected_pid'. This feature is only used if the<br />
'expected_pid' is an ACK. PINGs are retried until an<br />
ACK is received. When the PING is ACKed, the <strong>Trainer</strong><br />
generates a new frame before continuing with the Gen<br />
File.<br />
If 'FALSE', the <strong>Trainer</strong> continues as if an ACK occurred.<br />
This statement can also be used in conjunction with any<br />
"pid=xxx" statement in the .utg file. This can be done to<br />
override the configured or default retry behavior.<br />
Syntax example: ping_after_nyet=TRUE<br />
167
<strong>LeCroy</strong> <strong>USBTracer</strong>/<strong>Trainer</strong> User <strong>Manual</strong><br />
SW Version 2.20<br />
Key Code Format Description<br />
Packet Starting Keys<br />
pid<br />
8 bits (0-0xFF)<br />
or<br />
pid string<br />
Host Generation Only. Use this as the first key of most<br />
packets sent by the Host (Exception: use "frame=" for<br />
SOF packets). The key should be assigned to a valid<br />
packet identifier string per the USB specification:<br />
'SETUP', 'IN', 'OUT', 'DATA0', 'DATA1', 'ACK', 'PRE',<br />
'PING', 'SPLIT', 'DATA2', or 'MDATA'. Optionally, you<br />
may assign this key a raw eight bit value to force an error<br />
condition.<br />
Warning: If you specify PID=0xNN, you must use<br />
"raw_data=( )" to specify the rest of the packet data,<br />
because the packet structure is unknown.<br />
expected_pid pid string Host Generation Only. Use this as the PID key for<br />
packets which are expected to be sent by the device. In<br />
IntelliFrame mode, the generator waits until this PID has<br />
completed before sending the next generated packet or<br />
bus condition. The key should be assigned to a valid<br />
packet identifier string per the USB specification:<br />
'DATA0', 'DATA1', 'ACK', 'NAK', 'STALL', 'NYET',<br />
'DATA2', or 'MDATA'. The generator engine waits<br />
forever until this "expected_pid" appears, so the user may<br />
have to hand edit the file to achieve the desired results.<br />
For example, if a NAK comes where the "expected_pid"<br />
was a DATA1, the user should edit the .utg file to move<br />
the "pid=IN" command to later in the file by inserting<br />
some "frame=AUTO idle=TO_EOF" pairs before it. This<br />
allows time for the device to be ready for the IN.<br />
If "RETRY=TRUE" for this address/endpoint, the NAKs<br />
are ignored and the SOF's are generated automatically<br />
until the expected PID occurs.<br />
device_pid pid string Use this as the first key of most packets sent by a device.<br />
The key should be assigned to a valid packet identifier<br />
string per the USB specification: 'DATA0', 'DATA1',<br />
'ACK', 'NAK', 'STALL', 'NYET', 'DATA2', or 'MDATA'.<br />
Normally, the "device_pid=" statement is NOT present in<br />
a Host Generation .utg file, because the device responses<br />
are intended to come from real devices. By default, Host<br />
Generation files exported from Trace Files do NOT<br />
include "device_pid=" statements.<br />
Warning: If you specify "PID=0xNN", you must use<br />
"raw_data=( )" to specify the rest of the packet data,<br />
because the packet structure is unknown.<br />
168
<strong>LeCroy</strong> <strong>USBTracer</strong>/<strong>Trainer</strong> User <strong>Manual</strong><br />
SW Version 2.20<br />
Key Code Format Description<br />
frame<br />
11 bits<br />
or<br />
’AUTO’<br />
’KEEP_ALIVE’<br />
Creates a start of frame packet and generates a SOF PID<br />
as expected. The key should be assigned a value of the<br />
frame number, 'AUTO', or 'KEEP_ALIVE'. The string<br />
'AUTO' instructs the generator to increment the frame<br />
number automatically. The string 'KEEP_ALIVE'<br />
instructs the analyzer to generate a low-speed EOP in<br />
place of a SOF packet for traffic on a low-speed branch<br />
("file_speed=LOW").<br />
For Device Emulation, this statement is ignored by the<br />
Device Emulator, but serves to organize the .utg file in a<br />
more readable manner.<br />
empty_frame integer Host Generation Only. This key creates a sequence of<br />
start of frame packets with "idle=TO_EOF" values for the<br />
idle time. This results in N empty frames, where N is the<br />
integer value specified.<br />
If the branch speed is LOW, the frames contain only the<br />
keep-alive standalone EOP's. This key makes for an<br />
easier to manage .utg file by eliminating the need for<br />
many lines of "frame=AUTO idle=TO_EOF" statements.<br />
Usage:<br />
empty_frames=23 ; insert 23 empty frames here<br />
host_exp_pid PID Device Emulation Only. Defines the PID that is<br />
expected to be received from the Host. The Device<br />
Emulator waits until this PID has completed before<br />
sending the next generated packet. The key should be<br />
assigned to a valid packet identifier string per the USB<br />
specification: 'SETUP', 'IN', 'OUT', 'DATA0', 'DATA1',<br />
'ACK', 'PING', 'DATA2', or 'MDATA'. 'PRE' and 'PING'<br />
are for Hubs only, and are not supported. Each memory<br />
segment waits forever until it receives the expected PID<br />
to it's address/endpoint, so the user may have to hand edit<br />
the file to achieve the desired results. Each endpoint<br />
memory segment acts independently.<br />
Bus Condition Keys<br />
reset<br />
se0<br />
suspend<br />
positive<br />
integer<br />
or<br />
’LS_EOP’<br />
positive integer<br />
<strong>LeCroy</strong> <strong>USBTracer</strong>/<strong>Trainer</strong> User <strong>Manual</strong><br />
SW Version 2.20<br />
Key Code Format Description<br />
resume<br />
positive<br />
integer<br />
Host Generation Only. Indicates the number of<br />
microseconds of K driven onto the bus. Assign a positive<br />
integer to this key. For a proper resume sequence, this<br />
should be followed by the condition<br />
"reset=LS_EOP speed=LOW".<br />
wait_resume HERE Host Generation Only. Place this immediately before a<br />
"resume=" statement to implement a device resume,<br />
also known as Remote Wakeup. This causes the host to<br />
wait for the device to issue the Resume (K) condition<br />
before the Host proceeds with its own Resume signalling.<br />
This statement MUST be followed by the<br />
"resume= statement".<br />
chirp ’HERE’ Used to create a chirp sequence for a High Speed<br />
generation.<br />
Usage: chirp=HERE<br />
wait_vbus ’VALID’ Device Emulation Only. Wait for VBus to go Hi.<br />
termination ’HERE’ Device Emulation Only. Set terminations now.<br />
Keys for Packet Fields<br />
speed ’LOW’ Used to cause a low speed packet on a full speed branch.<br />
The only legal value is "speed=LOW".<br />
addr 7 bits (0-127) Assign a value for the address field.<br />
endp 4 bits (0-15) Assign a value for the endpoint number field.<br />
hub_addr 7 bits (0-127) Host Generation Only. Assign a value for the<br />
hub_address field of a SPLIT packet.<br />
port 7 bits (0-127) Host Generation Only. Assign a value for port field of a<br />
SPLIT packet.<br />
data (AB CD) Assign data bytes for the data field. Use the following<br />
syntax:<br />
data=(12 34 56 78 90 AB CD EF DC 13 40 78 11 CA 70<br />
65).<br />
You can wrap bytes of the data field to the next line. The<br />
bytes are in the order they come across the bus, and the<br />
bits within the bytes are in MSB to LSB order. Maximum<br />
number of bytes allowed is 1049.<br />
crc<br />
5 bits (0x0-0x1F)<br />
or<br />
16 bits<br />
(0x0-0xFFFF)<br />
Assign a value for the crc field. The default value is the<br />
correct crc calculated for the packet.<br />
s 0 or 1 Host Generation Only. Assign a value for the s (High<br />
Speed SPLIT Start/Speed) field.<br />
sc 0 or 1 Host Generation Only. Assign a value for the sc (High<br />
Speed SPLIT Start/Complete) field.<br />
e 0 or 1 Host Generation Only. Assign a value for the e (High<br />
Speed SPLIT End) field.<br />
et 0-3 Host Generation Only. Assign a value for the et (High<br />
Speed SPLIT Endpoint Type) field.<br />
0-Control, 1-Isoch, 2-bulk, 3-Interrupt<br />
170
<strong>LeCroy</strong> <strong>USBTracer</strong>/<strong>Trainer</strong> User <strong>Manual</strong><br />
SW Version 2.20<br />
Key Code Format Description<br />
eop positive integer Assign a positive integer for the length of the end of<br />
packet (EOP). The default value is the correct length<br />
(2 bits of SE0, 1 bit of J). The value is reflected by<br />
bits of SE0 plus one bit of J.<br />
hi_eop (AB CD) Hex Used to generate a high speed EOP pattern. The bytes are<br />
in the order they come across the bus, and the bits within<br />
the bytes are in LSB to MSB order. Maximum number of<br />
bytes allowed is 13.<br />
idle<br />
positive integer<br />
or<br />
’TO_EOP’<br />
Defines the length of idle after the current packet. Assign<br />
a positive integer or string to this key. The positive<br />
integer indicates the number of full-speed or low-speed<br />
bit times. The default value is around 4 bits for Classic<br />
speeds, and around 150 bits for High speeds.<br />
When this keyword is assigned a string 'TO_EOF',<br />
USB Chief automatically calculates the amount of idle<br />
remaining in the frame. When handshaking with a device,<br />
you can use this keyword to add idle where you anticipate<br />
a packet being returned from the device.<br />
The "idle=" key is always associated with the proceeding<br />
packet or bus condition, so you should not put file control<br />
keys between the packet or bus condition statement and<br />
the "idle=" statement.<br />
marker ’string’ Assign a string in quotation marks to be put in the marker<br />
for the defined packet.<br />
raw_data (aa bb) Use to send a non-modulo 8 number of bits in a classic<br />
speed 'raw_data' packet. It is only valid in conjunction<br />
with the 'raw_data' statement. Normally, every bit of the<br />
array defined in a "raw_data=(xx yy)" type of statement<br />
would be sent. However, particularly in the case where<br />
"bit_stuff=off", you need more control over the number<br />
of bits to be output on the bus. By adding the statement<br />
"raw_data_bits = 11", only the first 11 bits of the defined<br />
bytes are sent.<br />
For the following case,<br />
raw_data=(8F F0) raw_data_bits=13<br />
the output bitstream would be:<br />
1111 0001 0000 1<br />
(Each byte is described in MSB to LSB format, but is<br />
output on the wire in LSB to MSB format.)<br />
171
<strong>LeCroy</strong> <strong>USBTracer</strong>/<strong>Trainer</strong> User <strong>Manual</strong><br />
SW Version 2.20<br />
Key Code Format Description<br />
raw_data_bits integer Use to send a non-modulo 8 number of bits in a classic<br />
speed 'raw_data' packet. It is only valid in conjunction<br />
with the 'raw_data' statement. Normally, every bit of the<br />
array defined in a "raw_data=(xx yy)" type of statement<br />
would be sent. However, particularly in the case where<br />
"bit_stuff=off", you need more control over the number<br />
of bits to be output on the bus. By adding the statement<br />
"raw_data_bits = 11", only the first 11 bits of the defined<br />
bytes are sent. For the following case,<br />
raw_data=(8F F0) raw_data_bits=13<br />
the output bitstream would be:<br />
1111 0001 0000 1<br />
(Each byte is described in MSB to LSB format, but is<br />
output on the wire in LSB to MSB format.)<br />
bit_stuff<br />
sync<br />
’OFF’<br />
’ON’<br />
integer<br />
1-40<br />
retry<br />
'TRUE'<br />
ping_on_retry<br />
'FALSE'<br />
ping_on_nak<br />
retry_next_frame<br />
Keys for Class Decoding<br />
Assign the string OFF to disable bit stuffing within the<br />
current packet. The default value is ON.<br />
Assign an integer from 1 to 40 to represent the sync field.<br />
The integer is the number of zeros transmitted before the<br />
one.<br />
For Low and Full Speed files, the default value is 7 to<br />
give a sync of '00000001'.<br />
For High Speed files, the default value is 31 resulting in a<br />
sync of '00000000000000000000000000000001'.<br />
Host Generation Only. These four keys may be applied<br />
to individual packets, to override the behavior in a given<br />
instance. Normally, they are used in the 'config_endpoint'<br />
statement. See their descriptions in the Endpoint<br />
Configuration section earlier.<br />
These keys are populated into the .utg. script file automatically whenever the menu command<br />
File > Export to .utg file is run. These keys do not need to be edited.<br />
sd_prod<br />
sd_vend<br />
sd_bm_req_type<br />
sd_interface<br />
sd_host_id<br />
sd_class_code<br />
sd_subclass<br />
sd_protocol<br />
sd_end_sd<br />
172
<strong>LeCroy</strong> <strong>USBTracer</strong>/<strong>Trainer</strong> User <strong>Manual</strong><br />
SW Version 2.20<br />
How to Contact <strong>LeCroy</strong><br />
Type of Service<br />
Contact<br />
Call for technical support… US and Canada: 1 (800) 909-2282<br />
Worldwide: 1 (408) 727-6600<br />
Fax your questions… Worldwide: 1 (408) 727-6622<br />
Write a letter…<br />
<strong>LeCroy</strong> Customer Support<br />
3385 Scott Blvd.<br />
Santa Clara, CA 95054<br />
Send e-mail…<br />
support@catc.com<br />
Visit <strong>LeCroy</strong>’s web site…<br />
http://www.lecroy.com/<br />
Limited Hardware Warranty<br />
So long as you or your authorized representative ("you"<br />
or "your"), fully complete and return the registration card<br />
provided with the applicable hardware product or<br />
peripheral hardware products (each a "Product") within<br />
fifteen days of the date of receipt from <strong>LeCroy</strong> or one of its authorized<br />
representatives, <strong>LeCroy</strong> warrants that the Product will be free from defects in<br />
materials and workmanship for a period of three years (the "Warranty Period"). You<br />
may also complete your registration form via the internet by visiting<br />
http://www.catc.com/support/register/. The Warranty Period commences on the<br />
earlier of the date of delivery by <strong>LeCroy</strong> of a Product to a common carrier for<br />
shipment to you or to <strong>LeCroy</strong>'s authorized representative from whom you purchase<br />
the Product.<br />
What this Warranty Does Not Cover<br />
This warranty does not cover damage due to external causes including accident,<br />
damage during shipment after delivery to a common carrier by <strong>LeCroy</strong>, abuse,<br />
misuse, problems with electrical power, including power surges and outages,<br />
servicing not authorized by <strong>LeCroy</strong>, usage or operation not in accordance with<br />
Product instructions, failure to perform required preventive maintenance, software<br />
related problems (whether or not provided by <strong>LeCroy</strong>), problems caused by use of<br />
accessories, parts or components not supplied by <strong>LeCroy</strong>, Products that have been<br />
modified or altered by someone other than <strong>LeCroy</strong>, Products with missing or altered<br />
service tags or serial numbers, and Products for which <strong>LeCroy</strong> has not received<br />
payment in full.<br />
173
<strong>LeCroy</strong> <strong>USBTracer</strong>/<strong>Trainer</strong> User <strong>Manual</strong><br />
SW Version 2.20<br />
Coverage During Warranty Period<br />
During the Warranty Period, <strong>LeCroy</strong> or its authorized representatives will repair or<br />
replace Products, at <strong>LeCroy</strong>'s sole discretion, covered under this limited warranty<br />
that are returned directly to <strong>LeCroy</strong>'s facility or through <strong>LeCroy</strong>'s authorized<br />
representatives.<br />
How to Obtain Warranty Service<br />
To request warranty service, you must complete and return the registration card or<br />
register via the internet within the fifteen day period described above and report<br />
your covered warranty claim by contacting <strong>LeCroy</strong> Technical Support or its<br />
authorized representative.<br />
You can reach <strong>LeCroy</strong> Technical Support at 800-909-7112 or via email at<br />
support@catc.com. You may also refer to the <strong>LeCroy</strong> website at<br />
http://www.lecroy.com for more information on how to contact an authorized<br />
representative in your region. If warranty service is required, <strong>LeCroy</strong> or its<br />
authorized representative will issue a Return Material Authorization Number. You<br />
must ship the Product back to <strong>LeCroy</strong> or its authorized representative, in its original<br />
or equivalent packaging, prepay shipping charges, and insure the shipment or<br />
accept the risk of loss or damage during shipment. <strong>LeCroy</strong> must receive the Product<br />
prior to expiration of the Warranty Period for the repair(s) to be covered. <strong>LeCroy</strong> or<br />
its authorized representative will thereafter ship the repaired or replacement<br />
Product to you freight prepaid by <strong>LeCroy</strong> if you are located in the continental<br />
United States. Shipments made outside the continental United States will be sent<br />
freight collect.<br />
Please remove any peripheral accessories or parts before you ship the Product.<br />
<strong>LeCroy</strong> does not accept liability for lost or damaged peripheral accessories, data or<br />
software.<br />
<strong>LeCroy</strong> owns all parts removed from Products it repairs. <strong>LeCroy</strong> may use new<br />
and/or reconditioned parts, at its sole discretion, made by various manufacturers in<br />
performing warranty repairs. If <strong>LeCroy</strong> repairs or replaces a Product, the Warranty<br />
Period for the Product is not extended.<br />
If <strong>LeCroy</strong> evaluates and determines there is "no trouble found" in any Product<br />
returned or that the returned Product is not eligible for warranty coverage, <strong>LeCroy</strong><br />
will inform you of its determination. If you thereafter request <strong>LeCroy</strong> to repair the<br />
Product, such labor and service shall be performed under the terms and conditions<br />
of <strong>LeCroy</strong>'s then current repair policy. If you chose not to have the Product repaired<br />
by <strong>LeCroy</strong>, you agree to pay <strong>LeCroy</strong> for the cost to return the Product to you and<br />
that <strong>LeCroy</strong> may require payment in advance of shipment.<br />
174
<strong>LeCroy</strong> <strong>USBTracer</strong>/<strong>Trainer</strong> User <strong>Manual</strong><br />
SW Version 2.20<br />
General Provisions<br />
THIS LIMITED WARRANTY GIVES YOU SPECIFIC LEGAL RIGHTS. YOU<br />
MAY HAVE ADDITIONAL RIGHTS THAT VARY BY JURISDICTION.<br />
LECROY'S RESPONSIBILITY FOR DEFECTS IN MATERIALS AND<br />
WORKMANSHIP IS LIMITED TO REPAIR AND REPLACEMENT AS SET<br />
FORTH IN THIS LIMITED WARRANTY STATEMENT. EXCEPT AS<br />
EXPRESSLY STATED IN THIS WARRANTY STATEMENT, LECROY<br />
DISCLAIMS ALL EXPRESS AND IMPLIED WARRANTIES FOR ANY<br />
PRODUCT INCLUDING, BUT NOT LIMITED TO, ANY IMPLIED<br />
WARRANTIES OF AND CONDITIONS OF MERCHANTABILITY AND<br />
FITNESS FOR A PARTICULAR PURPOSE, AND ANY WARRANTIES THAT<br />
MAY ARISE FROM ANY COURSE OF DEALING, COURSE OF<br />
PERFORMANCE OR TRADE USAGE. SOME JURISDICTIONS MAY NOT<br />
ALLOW LIMITATIONS ON HOW LONG AN IMPLIED WARRANTY LASTS,<br />
SO THE PRECEDING LIMITATION MAY NOT APPLY TO YOU.<br />
LECROY DOES NOT ACCEPT LIABILITY BEYOND THE REMEDIES SET<br />
FORTH IN THIS LIMITED WARRANTY STATEMENT OR FOR INCIDENTAL<br />
OR CONSEQUENTIAL DAMAGES INCLUDING, WITHOUT LIMITATION,<br />
ANY LIABILITY FOR THIRD PARTY CLAIMS AGAINST YOU FOR<br />
DAMAGES, PRODUCTS NOT BEING AVAILABLE FOR USE, OR FOR LOST<br />
DATA OR SOFTWARE. LECROY'S LIABILITY TO YOU MAY NOT EXCEED<br />
THE AMOUNT YOU PAID FOR THE PRODUCT THAT IS THE SUBJECT OF<br />
A CLAIM. SOME JURISDICTIONS DO NOT ALLOW THE EXCLUSION OR<br />
LIMITATION OF INCIDENTAL OR CONSEQUENTIAL DAMAGES, SO THE<br />
PRECEDING EXCLUSION OR LIMITATION MAY NOT APPLY TO YOU.<br />
The limited warranty on a Product may be transferred for the remaining term if the<br />
then current owner transfers ownership of the Product and notifies <strong>LeCroy</strong> of the<br />
transfer. You may notify <strong>LeCroy</strong> of the transfer by writing to Technical Support at<br />
<strong>LeCroy</strong>, 3385 Scott Blvd., Santa Clara, CA 95054 USA or by email at:<br />
support@catc.com. Please include the transferring owner's name and address, the<br />
name and address of the new owner, the date of transfer, and the Product serial<br />
number.<br />
175
<strong>LeCroy</strong> <strong>USBTracer</strong>/<strong>Trainer</strong> User <strong>Manual</strong><br />
SW Version 2.20<br />
176
<strong>LeCroy</strong> <strong>USBTracer</strong>/<strong>Trainer</strong> User <strong>Manual</strong><br />
SW Version 2.20<br />
Index<br />
Symbols<br />
.dec files 112<br />
.dsc files 111<br />
.rbf files 32<br />
.req files 111<br />
.usb files 43<br />
.utg file 36<br />
.utg files 151<br />
.vcd file 36<br />
Numerics<br />
2-stage SOF Hiding option 83<br />
5-volt pin 22<br />
A<br />
About <strong>USBTracer</strong><br />
command 27<br />
window 27<br />
AC<br />
connector module 20<br />
power source 21<br />
Accurate Time Management 6<br />
action<br />
buttons 69<br />
actions<br />
buttons 73<br />
events 70<br />
linking to events 70<br />
recording options 69<br />
window 69<br />
Addr & Endp search criteria 133<br />
Addr checkbox 65<br />
Addr field 113<br />
alert<br />
beep 51<br />
All Start of Frame packets option 61<br />
Allow any Toggle value after Bus Reset<br />
option 82<br />
Analyzer<br />
bus 1<br />
command 31<br />
resetting 33<br />
setup 24<br />
traffic 1<br />
Analyzer Setup window 30<br />
Analyzer Speed options 55<br />
application<br />
installation 25<br />
startup 35<br />
Application startup 26<br />
architecture<br />
network 2<br />
audio.req file 111<br />
automatic<br />
updates 29<br />
Auto-Merge Trace files 51<br />
B<br />
Babble End Violation checkbox 65<br />
Babble Start Violation checkbox 65<br />
Bad Data Toggle checkbox 65<br />
Bar option 145<br />
Beep When Trigger Occurs option 51<br />
Bit Stuffing checkbox 65<br />
Bit-by-Bit window 63<br />
bits 93<br />
Bitstream mode 159<br />
Bitstream vs. Intelliframe 159<br />
blue dot 74<br />
Blue Dot Menu 75<br />
bluetooth.req file 111<br />
Breakout Board 22<br />
Buffer Size box 51<br />
Bulk/Int Transfer field 115<br />
177
<strong>LeCroy</strong> <strong>USBTracer</strong>/<strong>Trainer</strong> User <strong>Manual</strong><br />
SW Version 2.20<br />
bus<br />
analyzer 1<br />
condition 163<br />
condition keys 169<br />
usage 83<br />
Bus Conditions 134<br />
Bus Conditions event group 64<br />
Bus Conditions shortcuts 47<br />
bus data<br />
recording 76<br />
Bus Usage option 150<br />
Bus Utilization<br />
buttons 144<br />
report 143<br />
Bus Utilization option 83<br />
BusEngine 8<br />
manual updating 31<br />
technology 8<br />
update 28<br />
buttons<br />
action 73<br />
bus utilization 144<br />
navigator 108<br />
real-time statistics 148<br />
Script Editor 155<br />
tool bar descriptions 40<br />
Bytes box 51<br />
C<br />
cable<br />
connector 22<br />
Cables 24<br />
CATC Trace<br />
recording 16<br />
set marker 92<br />
Change Counter Value command 72<br />
Channel<br />
search 135<br />
channel<br />
trigger/filter 51<br />
Check Syntax command 36<br />
Chirp Reset Length option 57<br />
chirps<br />
hiding 97<br />
class decoding keys 172<br />
class definition files 111<br />
Class Request<br />
decode 126<br />
Class request, decode 126<br />
Class/Vendor decoding 113<br />
Class/Vendor Decoding field 113<br />
Class/Vendor Decoding Groups menu<br />
114<br />
Class/Vendor Endpoint Decoding<br />
field 115<br />
menu 116<br />
Class/Vendor endpoint RPipes decoding<br />
119, 122<br />
classes 111<br />
Classic LED 20<br />
Clear Marker command 93<br />
clock 56<br />
rate 5<br />
selection 58<br />
Collapse This USB Transfer command<br />
105<br />
colors<br />
Display Options 84<br />
comments<br />
editing 138<br />
communication.req file 111<br />
Compare Endpoint Data command 36<br />
compatibility<br />
host 10<br />
components<br />
physical 4<br />
system 19<br />
Computer connection 24<br />
Configuration Name option 83<br />
connecting<br />
actions and events 70<br />
cables 14, 24<br />
counters to events 70<br />
events to actions 70<br />
178
<strong>LeCroy</strong> <strong>USBTracer</strong>/<strong>Trainer</strong> User <strong>Manual</strong><br />
SW Version 2.20<br />
connector<br />
cable 22<br />
Data In/Out 22<br />
DB-25 2, 21<br />
descriptions 23<br />
module 20<br />
connectors 9<br />
context-sensitive help 35<br />
Control Transfer 123<br />
Control Transfer field 123<br />
convert.usb file 35<br />
counter 6<br />
counters 69<br />
connect to events 70<br />
events 70<br />
setting multiple conditions 72<br />
counting 7, 8<br />
restarting 73<br />
CRC checkbox 65<br />
creating<br />
generation file 160<br />
Customize<br />
command 39<br />
dialog box 39<br />
D<br />
Data Block<br />
viewing 96<br />
Data Block dialog box 96<br />
data connectors<br />
pin descriptions 23<br />
data fields<br />
collapse 94<br />
expand 94<br />
pop-up menus 95<br />
Data In/Out connector 22<br />
data length<br />
event groups 67<br />
search for 133<br />
Data Length event group 67<br />
Data option 36, 83<br />
Data Packet Count option 150<br />
Data Pattern event group 62<br />
Data Payload Throughput option 150<br />
data.usb file 43<br />
DB-25 connector 2, 21<br />
Decode<br />
decoding options 113<br />
decode<br />
class request 126<br />
endpoint 115, 127<br />
endpoint DWA RPipes 122<br />
endpoint RPipes 119<br />
general options for requests 123<br />
hub status 127<br />
layout 128<br />
protocol-specific fields 105<br />
request recipient 113<br />
Request rRPipe 118, 120<br />
requests 123, 125<br />
standard request 125<br />
vendor requests 126<br />
Decode ... Request command 126<br />
Decode as ... Endp command 127<br />
Decode Standard Request command<br />
125<br />
decoded transactions, viewing 100<br />
decoded transfers 104<br />
decoder files 112<br />
decoding<br />
assigning 113<br />
refresh 123<br />
Default to IntelliFrame Mode optrion<br />
56<br />
defining packet fields 164<br />
Delay Time 161<br />
Delay Time option 57<br />
description 1<br />
detailed installation 19<br />
device<br />
emulation 159, 160<br />
Device Emulation mode 161<br />
Device Emulation Mode option 56<br />
Device Requests 123<br />
Device Requests event group 61<br />
179
<strong>LeCroy</strong> <strong>USBTracer</strong>/<strong>Trainer</strong> User <strong>Manual</strong><br />
SW Version 2.20<br />
Device Resumes option 56, 161<br />
Device Wire Adapter Segment View<br />
107<br />
Device Wire Adapter Transfer View<br />
108<br />
devices<br />
hiding 97<br />
diagnostics 21<br />
direction<br />
search 137<br />
Direction field 115<br />
Disable External Trigger Output option<br />
75<br />
Disable Generator Memory option 56<br />
display 10<br />
configuration name 83<br />
format 17<br />
graphs 149<br />
options 5<br />
windows 36<br />
Display Options<br />
Color/Format/Hiding tab 84<br />
factory settings 83<br />
General 82<br />
level hiding 88<br />
loading 89<br />
saving 89<br />
values 83<br />
window 81<br />
Divide By field 58<br />
dot<br />
blue 74<br />
DWA RPipes<br />
endpoints 122<br />
E<br />
Edit as Text command 154<br />
Edit button 63<br />
Edit Comment command 138<br />
Edit comment for trace file window 138<br />
Edit Marker Comment<br />
command 93<br />
window 92<br />
editing<br />
comment 138<br />
data patterns 63<br />
generation file 154<br />
marker 93<br />
electrical<br />
fuse 20<br />
power switch 20<br />
source 21<br />
Electrically Programmable Logic Device<br />
8<br />
Electronically Programmable Logic<br />
Device 28<br />
e-mail 173<br />
empty frame 65<br />
Emulated Device’s Hex Address option<br />
57<br />
emulation 159, 160<br />
Enable External Trigger option 75<br />
Enable External Trigger Output option<br />
75<br />
Enable Outlining command 155<br />
Enable Tips option 82<br />
Endp checkbox 65<br />
Endp field 115<br />
endpoint<br />
configuration keys 165<br />
decoding 115<br />
Endpoint RPipes<br />
dialog box 119, 122<br />
tab 119, 122<br />
Endpoints<br />
tab 115<br />
endpoints<br />
decoding 127<br />
DWA RPipes 122<br />
RPipes 119<br />
Endpoints dialog box 115<br />
environmental conditions 9<br />
EOF offset box 65<br />
180
<strong>LeCroy</strong> <strong>USBTracer</strong>/<strong>Trainer</strong> User <strong>Manual</strong><br />
SW Version 2.20<br />
EOP checkbox 65<br />
EPLD 8, 28<br />
error<br />
detection 7<br />
error log 156<br />
Error Report option 83<br />
Error Summary report 140<br />
errors 83<br />
event groups 64<br />
searching for 132<br />
summary 140<br />
types 65<br />
Errors event group 64<br />
Errors option 109<br />
Event Groups dialog box 59<br />
Event Trigger recording 50<br />
events 7<br />
actions 70<br />
connecting to counters 70<br />
connection to actions 70<br />
counters 70<br />
groups 59<br />
linking 72<br />
Recording Options 59<br />
triggering 73<br />
Events Group box 137<br />
Events window 69<br />
Excessive Empty Frame Detection<br />
checkbox 65<br />
Exclusion search 137<br />
Expand Packet Data Fields by default<br />
option 82<br />
Expand Script-Based Decoded Info by<br />
default option 82<br />
Expand This USB Transfer command<br />
105<br />
Expand Transaction menu 100<br />
Export command 36, 151<br />
Export to Generator Text window 153<br />
Extern Data7 - Data0 In event group 68<br />
external<br />
external output signals 74<br />
input signals 66<br />
interface signals 51<br />
External Input Signals event group 66<br />
External Interface Breakout Board 22<br />
external interface connector 21<br />
external ports 21<br />
External Trigger Form option 75<br />
external trigger output<br />
enable 74<br />
F<br />
F1 help 35<br />
fax 173<br />
features 3<br />
trace 17, 91<br />
fields<br />
expanding 94<br />
Fields option 83<br />
file<br />
generation format 162<br />
File Control Keys 164<br />
File Export menu 153<br />
File Information report 139<br />
File menu 36<br />
files<br />
.dec 112<br />
.dsc 111<br />
.rbf 32<br />
.req 111<br />
.utg 151<br />
editing comment for trace 138<br />
File Control Keys 164<br />
file information 139<br />
generation loading 156<br />
information 139<br />
loading generation 156<br />
script 111<br />
tabs 156<br />
trace filename 53<br />
traffic generation 151<br />
181
<strong>LeCroy</strong> <strong>USBTracer</strong>/<strong>Trainer</strong> User <strong>Manual</strong><br />
SW Version 2.20<br />
Files of Type field 157<br />
Filter In action button 73<br />
Filter Out action button 69, 73<br />
Filter Polarity menu 74<br />
filtering 7, 73<br />
events 59<br />
hardware 1<br />
Find<br />
command 136<br />
utility 136<br />
Find Next command 137<br />
firmware<br />
automatic updates 29<br />
manual updates 33<br />
manual updating 33<br />
update 28<br />
first recording 14<br />
Fit to Graph Area option 149<br />
fonts<br />
changing 83<br />
Fonts and Colors options 146<br />
Fonts option 83<br />
format<br />
display 17<br />
idisplay options 86<br />
fractional clock rate 5<br />
Frame Number field 61<br />
Frame Patterns event group 61<br />
Frame-Length checkbox 65<br />
Full Speed<br />
indicator 20<br />
fuse 20<br />
G<br />
General tab<br />
Display Options 82<br />
Recording Options 50<br />
Generate menu 37<br />
generating<br />
traffic 5<br />
generation<br />
file loading 156<br />
formats 162<br />
mode 159<br />
options 161<br />
repeating 160<br />
running 161<br />
session 160<br />
starting 159<br />
generation file<br />
creating 160<br />
editing 154<br />
loading 156<br />
repeat 160<br />
generation script file 160<br />
generator<br />
modules 20<br />
Generator Text File 160<br />
Generator/Analyzer Clocking Overrides<br />
option 56<br />
glass fuse 20<br />
Go to<br />
drop-down menu 131<br />
Marker search 130<br />
Packet/Transaction/Transfer...<br />
search 129<br />
Trigger search 129<br />
Go to search 131<br />
Graph Areas button 149<br />
Graph Areas menu 146<br />
graphical display 5<br />
graphs<br />
displaying multiple 149<br />
Graph Areas menu 146<br />
green LED 20<br />
Grid Lines option 145<br />
Grid on Top option 145<br />
ground pins 22<br />
182
<strong>LeCroy</strong> <strong>USBTracer</strong>/<strong>Trainer</strong> User <strong>Manual</strong><br />
SW Version 2.20<br />
H<br />
hard disk 10<br />
hardware<br />
filtering 1<br />
requirements 10<br />
help<br />
context-sensitive 35<br />
Help menu 38<br />
Hi Speed<br />
recordings 55<br />
Hid .dec file 112<br />
hid.req file 111<br />
Hide option 149<br />
hiding<br />
chirps 97<br />
devices 97<br />
display options 87<br />
levels 88<br />
NAKs 97<br />
SOF 83<br />
SOF packets 97<br />
toolbars 39<br />
Hierarchy Lines option 82<br />
Hi-Speed<br />
indicator 20<br />
Hi-Speed traffic 5<br />
HNP 135<br />
host<br />
compatibility 10<br />
Host field 113<br />
Host Negotiation Protocol 135<br />
Host option 135<br />
Host Wire Adapter Segment View 106<br />
Host Wire Adapter Transfer View 107<br />
hosts<br />
Host Negotiation Protocol 135<br />
with a B plug 135<br />
with an A plug 135<br />
hot keys 46<br />
HS LED 20<br />
HS_Hub_Sample.utg file 152<br />
hub.req file 111<br />
HWA address field 118<br />
I<br />
Import command 36<br />
IN chedckbox 65<br />
Incl Reset checkbox 65<br />
Include statement 156<br />
indicators 10<br />
UPAS 20<br />
Input Counter Value dialog box 72<br />
input signals<br />
external 66<br />
Install Software command 25<br />
installation 25<br />
basic 13<br />
detailed 19<br />
installed unit 19<br />
IntelliFrame<br />
button 159<br />
mode 56, 159<br />
Intelliframe LED 20<br />
Intersection search 137<br />
K<br />
Keep Across Recordings checkbox 114<br />
keyboard<br />
shortcuts 46<br />
keys<br />
bus condition 169<br />
class decoding 172<br />
endpoint configuration 165<br />
file control 164<br />
packet fields 170<br />
packet starting 168<br />
support 164<br />
Keys for packet fields 172<br />
L<br />
layout 128<br />
Actions window 69<br />
Layout command 128<br />
LEDs 10, 19, 20<br />
left module slot 20<br />
183
<strong>LeCroy</strong> <strong>USBTracer</strong>/<strong>Trainer</strong> User <strong>Manual</strong><br />
SW Version 2.20<br />
letter 173<br />
line numbers 155<br />
Link utilization 150<br />
linking<br />
events 72<br />
List Values option 156<br />
LOA checkbox 65<br />
Load command 53, 76, 89<br />
log<br />
error 156<br />
Low Speed<br />
indicator 20<br />
LV TTL output and input signals 22<br />
M<br />
Main<br />
screen 26<br />
manual<br />
updates 33<br />
<strong>Manual</strong> Trigger button 20<br />
<strong>Manual</strong> Trigger recording 50<br />
Map DWA RPipe to Class/Vendor Decoding<br />
command 120<br />
Map Endpoint to Class/Vendor Decoding<br />
command 115<br />
markers<br />
clearing 93<br />
defining 92<br />
editing 93<br />
setting 92<br />
Mask field 63<br />
Mass Storage .dec file 112<br />
Match field 63<br />
memory 10<br />
generator 56<br />
requirements 51<br />
menus 36<br />
graph areas 146<br />
pop-up 82<br />
pull-down 36<br />
real-time statistics 149<br />
view settings 145<br />
Merge Trace Files command 36, 78<br />
merging<br />
trace files 77<br />
Misc tab<br />
recording options 54<br />
mode<br />
Bitstream 159<br />
collapsed 82<br />
device emulation 161<br />
expanded 82<br />
generation 159<br />
Repeat 158<br />
traffic generation 159<br />
modes<br />
Devoce Emulation 56<br />
IntelliFrame 56<br />
modules<br />
generator 20<br />
monitoring statistics 147<br />
N<br />
NAKs<br />
hiding 97<br />
name of Recording Options settings 52<br />
navigation 83<br />
shortcuts 46<br />
tools 45<br />
Navigation Bar checkbox 108<br />
navigator 108<br />
Navigator bar 108<br />
Navigator option 83<br />
network 2<br />
No Decoding option 114<br />
None option 145<br />
184
<strong>LeCroy</strong> <strong>USBTracer</strong>/<strong>Trainer</strong> User <strong>Manual</strong><br />
SW Version 2.20<br />
O<br />
On the Go, searching 135<br />
opt files 89<br />
options<br />
display 5<br />
recording 4<br />
search 129<br />
options file 83<br />
Options Name field 52<br />
orange LED 20<br />
Orient Horizontally option 145<br />
Orient Vertically option 145<br />
OTG shortcuts 47<br />
OUT checkbox 65<br />
output signals<br />
external 74<br />
overview<br />
software 35<br />
P<br />
package 9<br />
Packet # field 92<br />
packet fields keys 170<br />
Packet Identifiers event group 60<br />
Packet label 94<br />
Packet menu 92<br />
packet starting keys 168<br />
Packet View 98<br />
packets<br />
defining fields 164<br />
definition 163<br />
display level 83<br />
hiding SOF 97<br />
packet identifiers 60<br />
packet starting keys 168<br />
searching for IDs 131<br />
too late 65<br />
view 17<br />
Packets to .CSV option 36<br />
Packets to Device Emulation Traffic<br />
Generation Text File option 36<br />
Packets to Host Traffic Generator Text<br />
File option 36<br />
Packets to Text (Generator Text File<br />
Format command 153<br />
Packets to Text option 36<br />
Packing List 19<br />
Partial Upload 44<br />
Partial Upload button 44<br />
PC connection 24<br />
PC requirements 24<br />
percentages, post triggering 52<br />
physical components 4<br />
physical memory 51<br />
Pid checkbox 65<br />
PID shortcuts 46<br />
pin-outs 23<br />
descriptions 23<br />
pins 22<br />
Plug-and-Play instructions 25<br />
pop-up menu<br />
Script Editor 155<br />
pop-up menus 82<br />
data field 95<br />
pop-up tool tips 97<br />
ports 21<br />
position of trigger 52<br />
post-triggering percentages 52<br />
power 21<br />
indicator 20<br />
on/off switch 20<br />
socket 20<br />
source 21<br />
switch 20<br />
power requirements 9<br />
Pre/Post Trigger option 109<br />
printer.req file 111<br />
probing 9<br />
product<br />
description 1<br />
program<br />
installation 25<br />
startup 14, 35<br />
Progress Indicator 42<br />
Properties dialog box 149<br />
185
<strong>LeCroy</strong> <strong>USBTracer</strong>/<strong>Trainer</strong> User <strong>Manual</strong><br />
SW Version 2.20<br />
protocol<br />
analyzer 1<br />
violations 7<br />
protocol-specific fields, decode 105<br />
prototype rework area 23<br />
PTP .dec file 112<br />
pull-down menus 36<br />
pulse<br />
toggle 75<br />
Pulse High signals 75<br />
Pulse Low signals 75<br />
PWR LED 20<br />
R<br />
raw bits 93<br />
viewing 93<br />
Raw Bits View 94<br />
Readme.txt file 27<br />
Real-Time Statistics<br />
buttons 148<br />
Real-time Statistics<br />
pop-up menu 149<br />
window 147<br />
Real-Time Statistics option 83<br />
REC LED 20<br />
Recent Ranges option 109<br />
Recipient field 113<br />
Record menu 37<br />
recording<br />
activity 44<br />
bus data 76<br />
first 14<br />
LED 20<br />
options 4<br />
progress 42<br />
rules 8<br />
snapshot 50<br />
status 43<br />
type 50<br />
USB traffic 26<br />
Recording Options<br />
actions 69<br />
command 49<br />
dialog box 49<br />
events 59<br />
General 50<br />
loading 53<br />
Misc page 54<br />
name 52<br />
options name 52<br />
recording 76<br />
saving 76<br />
Recording Progress Indicator 42<br />
Recording Type box 50<br />
refresh 123<br />
Refresh Decoding for this Trace File<br />
command 123<br />
Remote Wakeup 57<br />
Repeat<br />
menu 158<br />
mode 158<br />
Repeating a Generation Session 160<br />
Report menu 37, 138<br />
reports 138<br />
Request DWA RPipes<br />
tab 121<br />
Request Recipient and Endpoints dialog<br />
box 113<br />
Request RPipes 118, 120<br />
dialog box 118, 121<br />
tab 118<br />
request.lst file 111<br />
requests 111, 123<br />
requirements<br />
power 9<br />
Requirements for PC 24<br />
Reset All button 40<br />
resetting<br />
Analyzer 33<br />
Toolbar 39<br />
Restart action button 69, 73<br />
restarting<br />
counting 73<br />
186
<strong>LeCroy</strong> <strong>USBTracer</strong>/<strong>Trainer</strong> User <strong>Manual</strong><br />
SW Version 2.20<br />
Restore Factory Presets button 83<br />
Restore Factory Presets option 83<br />
Resume<br />
settings 161<br />
signal 56<br />
time 56, 57<br />
Resume Time option 57<br />
revisions<br />
firmware 27<br />
software 27<br />
rework area 23<br />
Right click cell context menu option 82<br />
right module slot 20<br />
RPipe field 118, 121<br />
RPipes 118, 120<br />
endpoints 119<br />
rules<br />
recording 8<br />
S<br />
save<br />
Display Options 89<br />
recording options 76<br />
trace files 53<br />
Save as Default command 76<br />
Save External Interface Signals option<br />
51<br />
Script Decoder<br />
files 112<br />
<strong>Manual</strong> 112<br />
Script Decoding language 112<br />
Script Edito<br />
utility 154<br />
Script Editor<br />
buttons 155<br />
pop-up menu 155<br />
toolbar 154<br />
window 154<br />
script files 111<br />
Scripts directory 112<br />
search<br />
complex 136<br />
Direction 137<br />
direction 137<br />
Exclusion 137<br />
feature 129<br />
Intersection 137<br />
menu 37, 129<br />
Origin 137<br />
status 45<br />
Union 137<br />
Select engine file to download window<br />
32<br />
Select firmware file to download window<br />
33<br />
self-diagnosis 21<br />
sequencing 8<br />
serial number 27<br />
Session Request Protocol 135<br />
set<br />
marker in trace 92<br />
Set Marker command 92<br />
Set Range near Packet number option<br />
109<br />
Set Range to Whole Trace option 109<br />
setting<br />
generation options 161<br />
settings<br />
Resume 161<br />
SETUP<br />
field 123<br />
transaction 123<br />
setup 24<br />
system 21<br />
Setup menu 37<br />
Setup.exe file 28<br />
Short Byte checkbox 65<br />
shortcuts 46<br />
Show Line Numbers command 155<br />
Show Markers option 145<br />
Show Plumb Line option 145<br />
Show Raw Bits command 94<br />
Show Tooltips command 155<br />
187
<strong>LeCroy</strong> <strong>USBTracer</strong>/<strong>Trainer</strong> User <strong>Manual</strong><br />
SW Version 2.20<br />
Show Values option 156<br />
signal<br />
descriptions 23<br />
signals<br />
external input 66<br />
external output 74<br />
slot<br />
left module 20<br />
right module 20<br />
Slow Clock checkbox 58<br />
Slow Clock command 56<br />
slow clock rate 5<br />
Smart Card .dec file 112<br />
Snapshot recording 50<br />
SOF Hiding 83<br />
SOF packets<br />
hiding 97<br />
software<br />
installation 14, 25<br />
release 28<br />
required 10<br />
updates 28<br />
updating 28<br />
specifications 9<br />
speed 5<br />
Split Transaction View 101<br />
split transactions<br />
event groups 68<br />
Splits event group 68<br />
SRP 135<br />
Standard .dec file 112<br />
standard.req file 111<br />
Start Recording command 76<br />
Start/Stop button 20<br />
starting 14, 35<br />
software 26, 35<br />
traffic generation 159<br />
statistics 83<br />
monitoring 147<br />
Statistics Accumulation option 150<br />
status<br />
indicator 20<br />
Status bar 41<br />
Status LED 20<br />
Status option 145<br />
Still Image .dec file 112<br />
Stop Recording command 77<br />
stopping<br />
traffic generation 160<br />
summary<br />
error 140<br />
traffic 142<br />
support 173<br />
support keys 164<br />
Support page 28<br />
suspend 57<br />
switches 9<br />
system<br />
components 19<br />
setup 21<br />
T<br />
tabs<br />
file 156<br />
technical support 173<br />
testing 21<br />
Tile Horizontally option 145<br />
Tile Vertically option 145<br />
time<br />
delay 57<br />
resume 57<br />
Time-out Violation checkbox 65<br />
timer 6<br />
Timestamp At The Beginning option 82<br />
Timestamp field 82<br />
timestamps 6<br />
timing 83<br />
Timing Calculations report 141<br />
Timing Calculator 141<br />
Timing Calculator option 83<br />
toggle<br />
pulse signals 75<br />
reset 82<br />
Toggle pulse signals 75<br />
toggle violation 65<br />
188
<strong>LeCroy</strong> <strong>USBTracer</strong>/<strong>Trainer</strong> User <strong>Manual</strong><br />
SW Version 2.20<br />
Token Patterns event group 60<br />
Toolbar 39<br />
button descriptions 40<br />
command 39<br />
icons 40<br />
resetting 39<br />
tab 40<br />
Tooltip option 145<br />
tooltips 35, 82, 97, 155, 156<br />
trace<br />
auto-merge 51<br />
first recording 14, 16<br />
Navigator 108<br />
reading 91<br />
set marker in 92<br />
shortcuts 46<br />
view features 17, 91<br />
viewing level 83<br />
Trace File Name & Path button 53<br />
trace files<br />
auto-merge 51<br />
edit comment 138<br />
filename 53<br />
merging 77<br />
Trace Viewer 35<br />
Trace Viewer mode 26<br />
Trace Viewing Level option 83<br />
traffic<br />
display 5<br />
generation 5<br />
recording 26<br />
summary 142<br />
traffic generation<br />
file format 162<br />
files 151<br />
modes 159<br />
options 161<br />
repeating 160<br />
running 161<br />
starting 159<br />
stopping 160<br />
USB<strong>Trainer</strong> 151<br />
Traffic Generation Start/Stop button<br />
160<br />
Traffic Summary option 83<br />
Traffic Summary report 142<br />
Transaction View 98<br />
transactions<br />
decoded 100<br />
decoding protocols 105<br />
event groups 66<br />
expanded/collapsed 100<br />
split view 101<br />
Transactions event group 66<br />
Transfer View 102<br />
transfers<br />
decode protocols 105<br />
decoded 104<br />
expanded/collapsed 104<br />
tree 155<br />
TRG LED 20<br />
trigger<br />
LED 20<br />
Trigger action button 69, 73<br />
Trigger Position slider 52<br />
Trigger/Filter Channel option 51<br />
triggering 7<br />
events 73<br />
triggers<br />
Event 50<br />
events 59<br />
<strong>Manual</strong> 50<br />
manual 20<br />
Trigger/Filter Channel 51<br />
using errors for 65<br />
Truncate Data Fields option 51<br />
TTL output and input signals 22<br />
Turn-around time 65<br />
type B connector 21<br />
Type field 113<br />
Types of Traffic option 109<br />
189
<strong>LeCroy</strong> <strong>USBTracer</strong>/<strong>Trainer</strong> User <strong>Manual</strong><br />
SW Version 2.20<br />
U<br />
Undo Zoom option 149<br />
Union search 137<br />
Universal Protocol Analyzer System 2<br />
Universal Serial Bus Specification 3,<br />
126<br />
UPAS 2<br />
Upas_usb2_1A_1G-be.rbf file 32<br />
Upas_Usb2_2A_1G_be.rbf file 32<br />
Upas_Usb2_2A_be.rbf file 32<br />
update<br />
automatic 29<br />
BusEngine 28, 29<br />
firmware 28, 29<br />
manual 31, 33<br />
Update BusEngine command 32<br />
Update Firmware command 33<br />
updates<br />
software 28<br />
updating 27<br />
automatic 29<br />
BusEngine manual 31<br />
firmware manual 33<br />
software 28<br />
UPLD LED 20<br />
upload<br />
LED 20<br />
partial 44<br />
USB<br />
architecture 2<br />
recording traffic 26<br />
USB Device Request menu 123<br />
USB Device Requests 123<br />
USB Implementers Forum 3, 126<br />
USB On-The-Go option 56<br />
USB Tracer Generation Files option<br />
157<br />
USB type B connector 21<br />
USB-IF 3, 126<br />
<strong>USBTracer</strong><br />
main window 14<br />
USB<strong>Trainer</strong><br />
traffic generation 151<br />
Use Address in .utg file option 57, 161<br />
User-Defined Find Events screen 136<br />
V<br />
vendor definition files 111<br />
vendor.req file 111<br />
versions 27<br />
Video .dec file 112<br />
View<br />
menu 38<br />
options 39<br />
view<br />
data block 96<br />
decoded transactions 100<br />
decoded transfers 104<br />
packet 98<br />
raw bits 93<br />
split transaction 101<br />
transaction 98<br />
transfer 102<br />
Wire Adapter Segment 106, 107<br />
Wire Adapter Transfer 107, 108<br />
View ... Fields Dialog Layout dialog<br />
box 128<br />
View Data Block command 96<br />
View Fields for ... Class Requests text<br />
box 126<br />
View Fields for ... Endp text box 127<br />
View Fields for Standard Request text<br />
box 125<br />
View Options<br />
button 155<br />
menu 155<br />
View Settings button 145<br />
Viewing Level 83<br />
Virtual .dec file 112<br />
voltages 21<br />
190
<strong>LeCroy</strong> <strong>USBTracer</strong>/<strong>Trainer</strong> User <strong>Manual</strong><br />
SW Version 2.20<br />
W<br />
warranty<br />
coverage 174<br />
limited 173<br />
period 173<br />
provisions 175<br />
service 174<br />
transfer 175<br />
website 28, 173<br />
weight 9<br />
window<br />
options 36<br />
window layout<br />
actions 69<br />
Window menu 38<br />
Wire Adapter .dec file 112<br />
Wrap command 45<br />
Wrap option 82<br />
Wrap.utg file 160<br />
wrap=here line 160<br />
wrapping lines 82<br />
Y<br />
Y Scale Type option 149<br />
Z<br />
Zip files 28<br />
Zoom in command 45<br />
Zoom label 94<br />
Zoom Level option 82<br />
Zoom out command 45<br />
191
<strong>LeCroy</strong> <strong>USBTracer</strong>/<strong>Trainer</strong> User <strong>Manual</strong><br />
SW Version 2.20<br />
192