Statistics on Race and the Criminal Justice System - 2005 - Statewatch
Statistics on Race and the Criminal Justice System - 2005 - Statewatch
Statistics on Race and the Criminal Justice System - 2005 - Statewatch

Create successful ePaper yourself
Turn your PDF publications into a flip-book with our unique Google optimized e-Paper software.
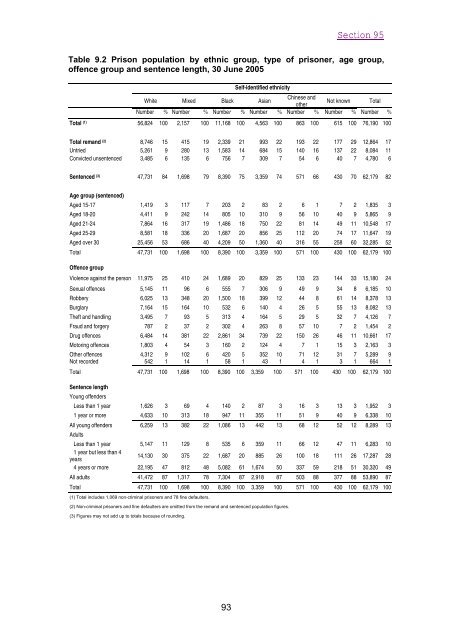
Secti<strong>on</strong> 95<br />
Table 9.2 Pris<strong>on</strong> populati<strong>on</strong> by ethnic group, type of pris<strong>on</strong>er, age group,<br />
offence group <strong>and</strong> sentence length, 30 June <strong>2005</strong><br />
Self-identified ethnicity<br />
Chinese <strong>and</strong><br />
White Mixed Black Asian<br />
Not known Total<br />
o<strong>the</strong>r<br />
Number % Number % Number % Number % Number % Number % Number %<br />
Total (1) 56,824 100 2,157 100 11,168 100 4,563 100 863 100 615 100 76,190 100<br />
Total rem<strong>and</strong> (2) 8,746 15 415 19 2,339 21 993 22 193 22 177 29 12,864 17<br />
Untried 5,261 9 280 13 1,583 14 684 15 140 16 137 22 8,084 11<br />
C<strong>on</strong>victed unsentenced 3,485 6 135 6 756 7 309 7 54 6 40 7 4,780 6<br />
Sentenced (3) 47,731 84 1,698 79 8,390 75 3,359 74 571 66 430 70 62,179 82<br />
Age group (sentenced)<br />
Aged 15-17 1,419 3 117 7 203 2 83 2 6 1 7 2 1,835 3<br />
Aged 18-20 4,411 9 242 14 805 10 310 9 56 10 40 9 5,865 9<br />
Aged 21-24 7,864 16 317 19 1,486 18 750 22 81 14 49 11 10,548 17<br />
Aged 25-29 8,581 18 336 20 1,687 20 856 25 112 20 74 17 11,647 19<br />
Aged over 30 25,456 53 686 40 4,209 50 1,360 40 316 55 258 60 32,285 52<br />
Total 47,731 100 1,698 100 8,390 100 3,359 100 571 100 430 100 62,179 100<br />
Offence group<br />
Violence against <strong>the</strong> pers<strong>on</strong> 11,975 25 410 24 1,689 20 829 25 133 23 144 33 15,180 24<br />
Sexual offences 5,145 11 96 6 555 7 306 9 49 9 34 8 6,185 10<br />
Robbery 6,025 13 348 20 1,500 18 399 12 44 8 61 14 8,378 13<br />
Burglary 7,164 15 164 10 532 6 140 4 26 5 55 13 8,082 13<br />
Theft <strong>and</strong> h<strong>and</strong>ling 3,495 7 93 5 313 4 164 5 29 5 32 7 4,126 7<br />
Fraud <strong>and</strong> forgery 787 2 37 2 302 4 263 8 57 10 7 2 1,454 2<br />
Drug offences 6,484 14 381 22 2,861 34 739 22 150 26 46 11 10,661 17<br />
Motoring offences 1,803 4 54 3 160 2 124 4 7 1 15 3 2,163 3<br />
O<strong>the</strong>r offences 4,312 9 102 6 420 5 352 10 71 12 31 7 5,289 9<br />
Not recorded 542 1 14 1 58 1 43 1 4 1 3 1 664 1<br />
Total 47,731 100 1,698 100 8,390 100 3,359 100 571 100 430 100 62,179 100<br />
Sentence length<br />
Young offenders<br />
Less than 1 year 1,626 3 69 4 140 2 87 3 16 3 13 3 1,952 3<br />
1 year or more 4,633 10 313 18 947 11 355 11 51 9 40 9 6,338 10<br />
All young offenders 6,259 13 382 22 1,086 13 442 13 68 12 52 12 8,289 13<br />
Adults<br />
Less than 1 year 5,147 11 129 8 535 6 359 11 66 12 47 11 6,283 10<br />
1 year but less than 4<br />
years<br />
14,130 30 375 22 1,687 20 885 26 100 18 111 26 17,287 28<br />
4 years or more 22,195 47 812 48 5,082 61 1,674 50 337 59 218 51 30,320 49<br />
All adults 41,472 87 1,317 78 7,304 87 2,918 87 503 88 377 88 53,890 87<br />
Total 47,731 100 1,698 100 8,390 100 3,359 100 571 100 430 100 62,179 100<br />
(1) Total includes 1,069 n<strong>on</strong>-criminal pris<strong>on</strong>ers <strong>and</strong> 78 fine defaulters.<br />
(2) N<strong>on</strong>-criminal pris<strong>on</strong>ers <strong>and</strong> fine defaulters are omitted from <strong>the</strong> rem<strong>and</strong> <strong>and</strong> sentenced populati<strong>on</strong> figures.<br />
(3) Figures may not add up to totals because of rounding.<br />
93