Statistics on Race and the Criminal Justice System - 2005 - Statewatch
Statistics on Race and the Criminal Justice System - 2005 - Statewatch
Statistics on Race and the Criminal Justice System - 2005 - Statewatch

You also want an ePaper? Increase the reach of your titles
YUMPU automatically turns print PDFs into web optimized ePapers that Google loves.
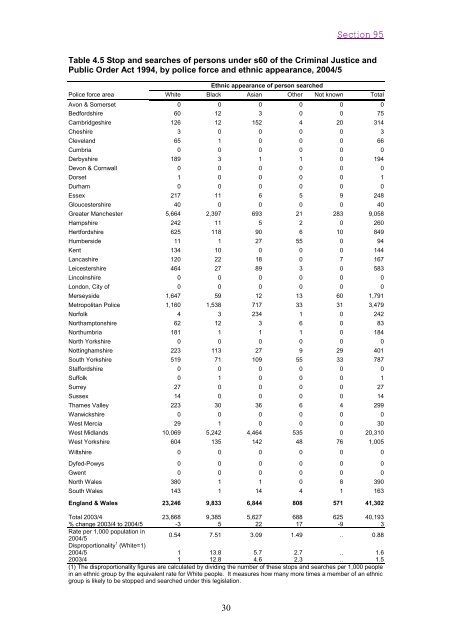
Secti<strong>on</strong> 95<br />
Table 4.5 Stop <strong>and</strong> searches of pers<strong>on</strong>s under s60 of <strong>the</strong> <strong>Criminal</strong> <strong>Justice</strong> <strong>and</strong><br />
Public Order Act 1994, by police force <strong>and</strong> ethnic appearance, 2004/5<br />
Ethnic appearance of pers<strong>on</strong> searched<br />
Police force area White Black Asian O<strong>the</strong>r Not known Total<br />
Av<strong>on</strong> & Somerset 0 0 0 0 0 0<br />
Bedfordshire 60 12 3 0 0 75<br />
Cambridgeshire 126 12 152 4 20 314<br />
Cheshire 3 0 0 0 0 3<br />
Clevel<strong>and</strong> 65 1 0 0 0 66<br />
Cumbria 0 0 0 0 0 0<br />
Derbyshire 189 3 1 1 0 194<br />
Dev<strong>on</strong> & Cornwall 0 0 0 0 0 0<br />
Dorset 1 0 0 0 0 1<br />
Durham 0 0 0 0 0 0<br />
Essex 217 11 6 5 9 248<br />
Gloucestershire 40 0 0 0 0 40<br />
Greater Manchester 5,664 2,397 693 21 283 9,058<br />
Hampshire 242 11 5 2 0 260<br />
Hertfordshire 625 118 90 6 10 849<br />
Humberside 11 1 27 55 0 94<br />
Kent 134 10 0 0 0 144<br />
Lancashire 120 22 18 0 7 167<br />
Leicestershire 464 27 89 3 0 583<br />
Lincolnshire 0 0 0 0 0 0<br />
L<strong>on</strong>d<strong>on</strong>, City of 0 0 0 0 0 0<br />
Merseyside 1,647 59 12 13 60 1,791<br />
Metropolitan Police 1,160 1,538 717 33 31 3,479<br />
Norfolk 4 3 234 1 0 242<br />
Northampt<strong>on</strong>shire 62 12 3 6 0 83<br />
Northumbria 181 1 1 1 0 184<br />
North Yorkshire 0 0 0 0 0 0<br />
Nottinghamshire 223 113 27 9 29 401<br />
South Yorkshire 519 71 109 55 33 787<br />
Staffordshire 0 0 0 0 0 0<br />
Suffolk 0 1 0 0 0 1<br />
Surrey 27 0 0 0 0 27<br />
Sussex 14 0 0 0 0 14<br />
Thames Valley 223 30 36 6 4 299<br />
Warwickshire 0 0 0 0 0 0<br />
West Mercia 29 1 0 0 0 30<br />
West Midl<strong>and</strong>s 10,069 5,242 4,464 535 0 20,310<br />
West Yorkshire 604 135 142 48 76 1,005<br />
Wiltshire 0 0 0 0 0 0<br />
Dyfed-Powys 0 0 0 0 0 0<br />
Gwent 0 0 0 0 0 0<br />
North Wales 380 1 1 0 8 390<br />
South Wales 143 1 14 4 1 163<br />
Engl<strong>and</strong> & Wales 23,246 9,833 6,844 808 571 41,302<br />
Total 2003/4 23,868 9,385 5,627 688 625 40,193<br />
% change 2003/4 to 2004/5 -3 5 22 17 -9 3<br />
Rate per 1,000 populati<strong>on</strong> in<br />
2004/5<br />
0.54 7.51 3.09 1.49 .. 0.88<br />
Disproporti<strong>on</strong>ality 1 (White=1)<br />
2004/5 1 13.8 5.7 2.7 .. 1.6<br />
2003/4 1 12.8 4.6 2.3 .. 1.5<br />
(1) The disproporti<strong>on</strong>ality figures are calculated by dividing <strong>the</strong> number of <strong>the</strong>se stops <strong>and</strong> searches per 1,000 people<br />
in an ethnic group by <strong>the</strong> equivalent rate for White people. It measures how many more times a member of an ethnic<br />
group is likely to be stopped <strong>and</strong> searched under this legislati<strong>on</strong>.<br />
30