M87 at metre wavelengths
M87 at metre wavelengths
M87 at metre wavelengths

Create successful ePaper yourself
Turn your PDF publications into a flip-book with our unique Google optimized e-Paper software.
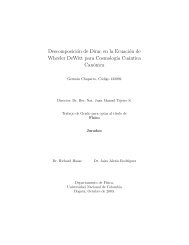
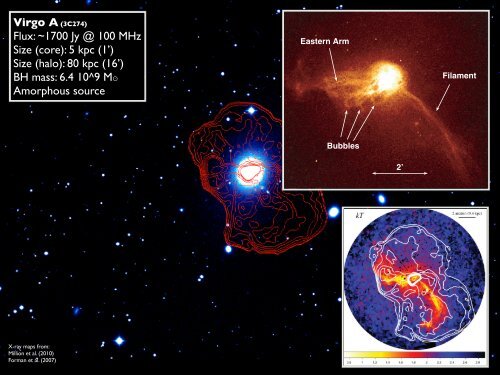
Virgo A (3C274)<br />
Flux: ~1700 Jy @ 100 MHz<br />
Size (core): 5 kpc (1’)<br />
Size (halo): 80 kpc (16’)<br />
BH mass: 6.4 10^9 M<br />
Amorphous source<br />
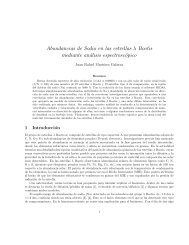
2054 E. T. Million et al.<br />
Fig. 2a<br />
Fig. 2b<br />
fig. 2afig. 2b<br />
Fig. 2.—Images of the seven ACIS-I pointings after background subtraction and ‘‘fl<strong>at</strong> fielding’’ in the energy band 0.5Y1.0 keV with 1 pixel ¼ 3 00 <strong>at</strong> two different<br />
scales. (a) The very prominent eastern and southwestern arms (see also Fig. 5, where these are labeled in both the X-ray and radio images). (b)Amoredetailedviewofthe<br />
tracery of filaments th<strong>at</strong> suggests the similarity between the structures in the eastern and southwestern arms. The long southwestern arm appears to be composed of several<br />
intertwined filaments (see loc<strong>at</strong>ion indic<strong>at</strong>ed by the label ‘‘Filament’’). The eastern arm can be interpreted as a series of bubbles (several labeled inrightpanel)<strong>at</strong>different<br />
evolutionary stages as they rise in the <strong>at</strong>mosphere of <strong>M87</strong>. The filamentary structures are very soft and are not apparent <strong>at</strong> energies above 2 keV (e.g., see Fig. 7).<br />
X-ray maps from:<br />
Million et al. (2010)<br />
Forman et al. (2007)<br />
For the 1.2Y2.5 keV band, Figure 1 (upper solid curve)shows<br />
th<strong>at</strong> the count r<strong>at</strong>e for a unit volume of unit density is independent<br />
of gas temper<strong>at</strong>ure, for gas temper<strong>at</strong>ures above about 1 keV.<br />
If we express the count r<strong>at</strong>e as<br />
Z<br />
C / (T ) dl;<br />
ð1Þ<br />
n 2 e<br />
where n e is the electron density, (T ) is the volume emissivity of<br />
the gas convolved with the Chandra response, and l is the p<strong>at</strong>h<br />
length along the line of sight, the independence of the1.2Y2.5 keV<br />
‘‘density’’ image (actually the square of the density integr<strong>at</strong>ed<br />
along the line of sight).<br />
The properties of the 3.5Y7.5 keV band can be determined<br />
by rewriting equ<strong>at</strong>ion (1) using the ideal gas law, p / n e T,to<br />
elimin<strong>at</strong>e the gas density. We find<br />
Z<br />
C / p 2 (T ) T 2 dl:<br />
ð2Þ<br />
The lower dashed curve in Figure 1 is (T )/T 2 for a unit<br />
density and unit volume of gas. For gas temper<strong>at</strong>ures from 1 to