Extended Abstract - AMS supported meetings
Extended Abstract - AMS supported meetings
Extended Abstract - AMS supported meetings

You also want an ePaper? Increase the reach of your titles
YUMPU automatically turns print PDFs into web optimized ePapers that Google loves.
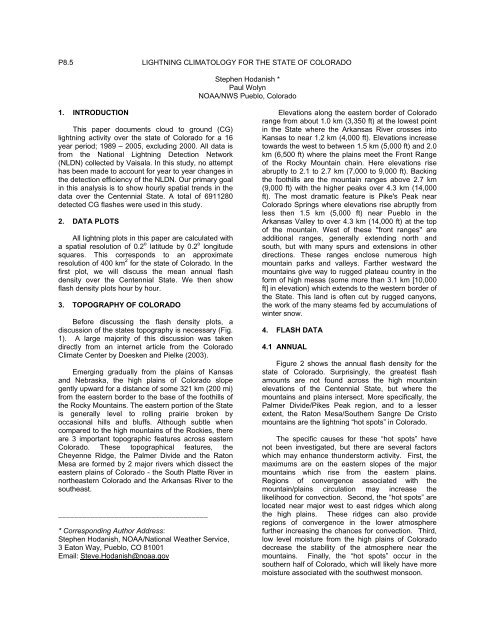
P8.5 LIGHTNING CLIMATOLOGY FOR THE STATE OF COLORADO<br />
Stephen Hodanish *<br />
Paul Wolyn<br />
NOAA/NWS Pueblo, Colorado<br />
1. INTRODUCTION<br />
This paper documents cloud to ground (CG)<br />
lightning activity over the state of Colorado for a 16<br />
year period; 1989 – 2005, excluding 2000. All data is<br />
from the National Lightning Detection Network<br />
(NLDN) collected by Vaisala. In this study, no attempt<br />
has been made to account for year to year changes in<br />
the detection efficiency of the NLDN. Our primary goal<br />
in this analysis is to show hourly spatial trends in the<br />
data over the Centennial State. A total of 6911280<br />
detected CG flashes were used in this study.<br />
2. DATA PLOTS<br />
All lightning plots in this paper are calculated with<br />
a spatial resolution of 0.2 o latitude by 0.2 o longitude<br />
squares. This corresponds to an approximate<br />
resolution of 400 km 2 for the state of Colorado. In the<br />
first plot, we will discuss the mean annual flash<br />
density over the Centennial State. We then show<br />
flash density plots hour by hour.<br />
3. TOPOGRAPHY OF COLORADO<br />
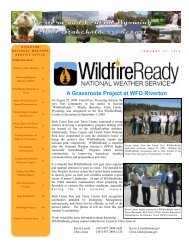
Before discussing the flash density plots, a<br />
discussion of the states topography is necessary (Fig.<br />
1). A large majority of this discussion was taken<br />
directly from an internet article from the Colorado<br />
Climate Center by Doesken and Pielke (2003).<br />
Emerging gradually from the plains of Kansas<br />
and Nebraska, the high plains of Colorado slope<br />
gently upward for a distance of some 321 km (200 mi)<br />
from the eastern border to the base of the foothills of<br />
the Rocky Mountains. The eastern portion of the State<br />
is generally level to rolling prairie broken by<br />
occasional hills and bluffs. Although subtle when<br />
compared to the high mountains of the Rockies, there<br />
are 3 important topographic features across eastern<br />
Colorado. These topographical features, the<br />
Cheyenne Ridge, the Palmer Divide and the Raton<br />
Mesa are formed by 2 major rivers which dissect the<br />
eastern plains of Colorado - the South Platte River in<br />
northeastern Colorado and the Arkansas River to the<br />
southeast.<br />
_____________________________________<br />
* Corresponding Author Address:<br />
Stephen Hodanish, NOAA/National Weather Service,<br />
3 Eaton Way, Pueblo, CO 81001<br />
Email: Steve.Hodanish@noaa.gov<br />
Elevations along the eastern border of Colorado<br />
range from about 1.0 km (3,350 ft) at the lowest point<br />
in the State where the Arkansas River crosses into<br />
Kansas to near 1.2 km (4,000 ft). Elevations increase<br />
towards the west to between 1.5 km (5,000 ft) and 2.0<br />
km (6,500 ft) where the plains meet the Front Range<br />
of the Rocky Mountain chain. Here elevations rise<br />
abruptly to 2.1 to 2.7 km (7,000 to 9,000 ft). Backing<br />
the foothills are the mountain ranges above 2.7 km<br />
(9,000 ft) with the higher peaks over 4.3 km (14,000<br />
ft). The most dramatic feature is Pike's Peak near<br />
Colorado Springs where elevations rise abruptly from<br />
less then 1.5 km (5,000 ft) near Pueblo in the<br />
Arkansas Valley to over 4.3 km (14,000 ft) at the top<br />
of the mountain. West of these "front ranges" are<br />
additional ranges, generally extending north and<br />
south, but with many spurs and extensions in other<br />
directions. These ranges enclose numerous high<br />
mountain parks and valleys. Farther westward the<br />
mountains give way to rugged plateau country in the<br />
form of high mesas (some more than 3.1 km [10,000<br />
ft] in elevation) which extends to the western border of<br />
the State. This land is often cut by rugged canyons,<br />
the work of the many steams fed by accumulations of<br />
winter snow.<br />
4. FLASH DATA<br />
4.1 ANNUAL<br />
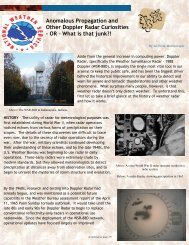
Figure 2 shows the annual flash density for the<br />
state of Colorado. Surprisingly, the greatest flash<br />
amounts are not found across the high mountain<br />
elevations of the Centennial State, but where the<br />
mountains and plains intersect. More specifically, the<br />
Palmer Divide/Pikes Peak region, and to a lesser<br />
extent, the Raton Mesa/Southern Sangre De Cristo<br />
mountains are the lightning “hot spots” in Colorado.<br />
The specific causes for these “hot spots” have<br />
not been investigated, but there are several factors<br />
which may enhance thunderstorm activity. First, the<br />
maximums are on the eastern slopes of the major<br />
mountains which rise from the eastern plains.<br />
Regions of convergence associated with the<br />
mountain/plains circulation may increase the<br />
likelihood for convection. Second, the “hot spots” are<br />
located near major west to east ridges which along<br />
the high plains. These ridges can also provide<br />
regions of convergence in the lower atmosphere<br />
further increasing the chances for convection. Third,<br />
low level moisture from the high plains of Colorado<br />
decrease the stability of the atmosphere near the<br />
mountains. Finally, the “hot spots” occur in the<br />
southern half of Colorado, which will likely have more<br />
moisture associated with the southwest monsoon.
Figure 1. Topographic map of Colorado. Mountain<br />
ranges and place names discussed in text are shown.<br />
Elevation in kFt.<br />
The least amount of CG activity over the<br />
Centennial State is found over the San Luis Valley.<br />
This large broad valley, with an average elevation of<br />
around 2.3 km (7500 ft), is surrounded on 3 sides by<br />
the San Juan Mountain range to the west and<br />
northwest, and the Sangre De Cristo Mountains to the<br />
northeast and east. The lack of lightning activity in this<br />
valley is due primarily to the lack of low level moisture<br />
due to the blocking of the surrounding mountain<br />
ranges. Not surprisingly, the San Luis Valley is also<br />
one of the driest locations in the state of Colorado.<br />
Another noticeable minimum, this time on the<br />
plains, lies in an area bounded by Denver, to Ft<br />
Collins, to Greeley and back to Denver. This minimum<br />
in activity is likely due to a well known meteorological<br />
phenomenon called the Denver Convergence Vorticity<br />
Zone (DCVZ) which forms when synoptic low level<br />
southeasterly flow forms over the plains of Colorado.<br />
This convergence zone typically extends from roughly<br />
Denver to Greeley, and is a favored initiation area for<br />
thunderstorms (See Szoke et al, 2006 this volume).<br />
Once storms develop along this convergence zone,<br />
the prevailing flow carries the convection off in a<br />
general easterly direction. This in turn leaves a void in<br />
CG activity back to the west of the convergence zone.<br />
Although the circulation of the DCVZ leaves a<br />
minimum in CG activity north of Denver, it likely<br />
enhances the lightning activity south of the Denver.<br />
Surface flow to the west of the DCVZ is from a<br />
northerly component. This northerly flow passes the<br />
Denver area and then begins to go upslope over the<br />
north facing side of the Palmer Divide/Pikes Peak<br />
region.<br />
As mentioned in section 3, three areas of higher<br />
terrain extend east-west across the eastern plains;<br />
Figure 2. The mean annual flash density for the State of<br />
Colorado. Nearly 7 million flashes, from 1989 through<br />
2005 (excluding 2000), were processed to produce this<br />
map. No correction for detection efficiency has been<br />
applied.<br />
the Raton Mesa, the Palmer Divide and the Cheyenne<br />
Ridge. From the above discussion, we know that the<br />
Palmer Divide and Raton Mesa are lightning hotspots,<br />
but the Cheyenne Ridge has noticeably less lightning<br />
activity. There are possibly 3 reasons for this. First,<br />
the elevation of the Cheyenne Ridge is not as high as<br />
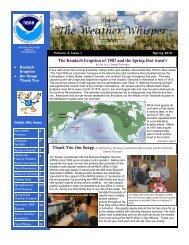
the other two ridges. Second, less moisture reaches<br />
this region as compared to the other ridges. We<br />
believe this is due to less monsoon moisture reaching<br />
the northern parts of the State (Fig 3). Third, the<br />
circulation of the DCVZ may play a role in the lesser<br />
amount of CG activity over the southern sections of<br />
the Cheyenne Ridge. It should be noted that, although<br />
not shown, there is not a maximum of lightning activity<br />
on the north side of the Cheyenne Ridge in Wyoming.<br />
Of all of the interior mountains (mountains not<br />
adjacent to the plains) in Colorado, the broad San<br />
Juan range shows the most CG activity. This<br />
maximum is believed to be caused by low to mid level<br />
moisture advecting in from Mexico associated with the<br />
Summer Southwest Monsoon (Watson et. al. 1993).<br />
Over Western Colorado, a minimum in lightning<br />
activity can be seen along the major river valleys,<br />
including the Colorado and Gunnison River Valleys. A<br />
minimum in CG activity is also noted across<br />
Northwest Colorado, and extreme Southwest<br />
Colorado.<br />
One of the highest mountain ranges in Colorado,<br />
the Sawatch Range, has the least amount of CG<br />
activity. This range, located in the center of the State,<br />
has numerous 4.0 – 4.3 km (13 - 14 kft) mountains<br />
along its’ flank. The minimum in CG activity over
San Juan Mountains in Southwest Colorado and the<br />
Grand Mesa region in west central Colorado.<br />
During the 18 UTC (Noon MDT) time frame, the<br />
CG activity continues to increase with the high<br />
mountain regions showing the most significant<br />
increases. Flash rates exceeding 0.6 flashes km -2 are<br />
noted once again just east of the spine of the<br />
southern Sangre De Cristo range west of Trinidad, the<br />
Front Range west of Denver and over the San Juan<br />
Mountains. Other areas, such as the Pikes Peak<br />
region, the Grand Mesa, the Roan Mesa and Flat<br />
Tops Mountain region, CG activity increases to 0.4<br />
flashes km -2 . Over the plains, the San Luis Valley and<br />
Northwest Colorado, flash rates remain quite low, with<br />
values below 0.2 flashes km -2<br />
Figure 3. Thirty year average (1971-2000) precipitation<br />
(mm) for Colorado for the months of June, July and<br />
August. Figure composed from Prism Data from Oregon<br />
State University (http://www.prismclimate.org).<br />
this range is due to the lack of lower level moisture<br />
due to the blocking influence of surrounding mountain<br />
ranges.<br />
4.2 HOURLY CG DATA<br />
One of the primary objectives of this study was to<br />
analyze the hour by hour variability in CG flash data<br />
over Colorado. This was done to 1.) Observe when<br />
and where initiation in lightning activity occurs over<br />
the state, and 2.) To observe the spatial changes as<br />
the day progresses. Due to limited space, not all<br />
hourly plots are shown (All hourly plots are shown in<br />
the accompanying poster).<br />
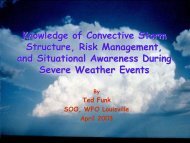
Starting at 12 UTC (6 am MDT; Figure 4) hourly<br />
plot, very little lightning is occurring over the state.<br />
Flash rates are typically less than 0.1 flashes km -2 .<br />
The absolute minimum occurs over a north-south<br />
region of the central part of the state, where, in quite a<br />
few locations, no lightning has been recorded in the<br />
17 year period. The largest flash values at this hour<br />
occur in the western and eastern part of the state.<br />
No significant changes in the hourly plots occur<br />
between 13 and 16 UTC (7 am to 11 am MDT).<br />
Climatologically, 14 UTC (8 am MDT) is the minimum<br />
in CG activity across the State (Table 1).<br />
Noticeable changes occur during the 17 UTC (11<br />
am MDT) time frame as increases of 0.2 to 0.3<br />
flashes km -2 are observed over sections of the<br />
mountains. One maximum is noted west of Denver,<br />
just to the east of Mt Evans. Another maximum is<br />
located west of Trinidad just east of the southern<br />
Sangre de Cristo Mountains. It is of interest that these<br />
two maximums are not occurring directly over the<br />
highest peaks, but just to the immediate east. Other<br />
noticeable maximums at this hour are noted over the<br />
After 19 UTC (1 pm MDT), the highest flash<br />
rates, with some areas exceeding 0.7 flashes km -2 ,<br />
are noted over the Pikes Peak region and the<br />
southern Sangre De Cristo range. Increasing flash<br />
rates are also noted over the San Juan Mountains,<br />
the Front Range, the Roan Plateau and Flat Top<br />
Mountain region. Flash rates are also beginning to<br />
increase over the lower elevations of the Palmer<br />
Divide as the activity begins to “push off” the higher<br />
terrain.<br />
After 20 UTC (2 pm MDT), values increase<br />
statewide with most of the activity once again over the<br />
Pikes Peak/Palmer Divide region and southern<br />
Sangre De Cristo/Raton Mesa region. Flash rates are<br />
at the highest values over the southern Sangre De<br />
Cristo/Raton Mesa region with values in excess of 1.0<br />
flash km -2 . Lightning activity continues to push onto<br />
the plains over the Cheyenne Ridge, Palmer Divide<br />
and Raton Mesa.<br />
During the 21 UTC (3 pm MDT) time frame, peak<br />
flash rates over the mountains of the southern Sangre<br />
De Cristo/Raton Mesa region decrease although the<br />
overall lightning activity over the greater Raton Mesa<br />
region increases. Activity over the greater Pikes<br />
Peak/Palmer Divide region continues to blossom with<br />
flash rates exceeding 1.0 flash km -2 . Lightning over<br />
the San Juan Mountain region shows a noticeable<br />
shift off the mountains towards the west and<br />
southwest. Values over the remainder of the<br />
mountains and higher terrain of Colorado remain<br />
steady, with maximum values around 0.2 to 0.3<br />
flashes km -2 .<br />
Flash rates during the 22 UTC (4 pm MDT) time<br />
frame have reached a peak statewide (See Table 1).<br />
On a regional scale, flash rates are at a maximum<br />
over the Pikes Peak/Palmer Divide area with values<br />
exceeding 1.1 flashes km -2 . Overall, on the plains, CG<br />
activity continues to increase and advance eastward.<br />
As CG activity over the plains is increasing, it is<br />
gradually decreasing over the interior mountains.<br />
Lightning activity in the San Juan mountain region
continues to push towards the south and west over<br />
the lower terrain of far southwest Colorado.<br />
After 23 UTC (5 pm MDT), the maximum lighting<br />
activity continues over Palmer Divide and Raton Mesa<br />
and extends eastward out onto the plains. Flash rates<br />
in excess of 1.0 flash km -2 are still noted over the<br />
plains. Flash rate values continue to decrease over<br />
the remainder of the state, especially over the interior<br />
mountain regions. The only noticeable maximum west<br />
of the Continental Divide is across far Southwest<br />
Colorado.<br />
After 00 UTC (6 pm MDT), flash rates continue to<br />
decrease statewide. The plains continues to show the<br />
maximum in activity. However, flash rates are now<br />
below 1.0 flash km -2 over this region.<br />
From 01 UTC (7 pm MDT) through the 11 UTC (6<br />
am MDT), lightning activity gradually decreases<br />
across the State. At 01 UTC, the highest flash rates<br />
are over the plains and adjacent mountains. A small<br />
secondary maximum is also noted over far Southwest<br />
Colorado. Over the remainder of the interior mountain<br />
areas, flash rates are typically below 0.3 flashes km -2 .<br />
By 04 UTC, flash rates in the mountains are generally<br />
below 0.1 flashes km -2 . Over the plains, flash rates<br />
continue to decrease with the highest values (0.3<br />
flashes km -2 ) noted over the far eastern plains.<br />
By 06 UTC (Midnight MDT), flash rates are<br />
generally below 0.1 flashes km -2 statewide. Many<br />
areas of the interior mountains show no lightning<br />
activity at all. Through the remainder of the early<br />
morning hours the activity continues to slowly<br />
decrease.<br />
5 DISCUSSION<br />
This study analyzed the CG activity over the<br />
State of Colorado over a 16 year period. The mean<br />
annual flash density map showed most of the CG<br />
activity occurs over the Pikes Peak/Palmer Divide<br />
region and across the east facing slopes of the<br />
Southern Sangre De Cristo mountain range/Raton<br />
Mesa region.<br />
Minimum in CG activity was found over the San<br />
Luis Valley. Somewhat surprisingly, a minimum in<br />
activity was noted north of Denver to Ft Collins and<br />
across the northern sections of the Front Range.<br />
Minimum in activity was also noted over one of the<br />
highest mountain ranges in Colorado, the Sawatch<br />
Range.<br />
Of interest, initial lightning “hotspots” were not<br />
found directly over the higher mountain peaks, but<br />
just to the east of the higher peaks.<br />
As found by Lo´pez and Holle (1986), lightning<br />
begins to increase over the higher terrain of Colorado<br />
around 17 UTC (11 am MDT).<br />
The overall minimum in activity occurs over the<br />
State during 14 UTC (8 am MDT), the maximum<br />
occurs around 22 UTC (4 pm MDT).<br />
The hourly plots show that the lightning activity<br />
which develop along the mountains adjacent to the<br />
plains moves east as the afternoon progresses. Over<br />
the San Juan mountain region, the activity moves in a<br />
general southwest direction during this same time<br />
period.<br />
6 ACKNOWLEDGMENTS<br />
The Authors would like thank Bill Fortune (MIC<br />
NWS Pueblo CO) for his support, and Irv Watson<br />
(SOO NWS Tallahassee FL). Precipitation data was<br />
supplied by the Prism Group, Copyright 2006, Oregon<br />
State University, http://www.prismclimate.org. The<br />
Prism data was downloaded 10 August 2006.<br />
7 REFERENCES<br />
Doesken, N. J., and R. A. Pielke, 2003: Climate of<br />
Colorado. Internet document:<br />
http://ccc.atmos.colostate.edu/climateofcolorado.php<br />
López, R. E., and R. L. Holle, 1986: Diurnal and<br />
spatial variability of lightning activity in northeastern<br />
Colorado and central Florida during the summer.<br />
Mon. Wea. Rev., 114, 1288–1312.<br />
Szoke, J., D. Barjenbruch and R. Glancy, 2006: The<br />
Denver Cyclone and tornadoes 25 years later: the<br />
continued challenge of predicting non-supercell<br />
tornadoes. <strong>AMS</strong> 26 Severe Local Storms Conf., St<br />
Louis, MO (this volume).<br />
Watson, A. I., R. L. Holle, and R. E. López, 1993:<br />
Cloud-to-ground lightning and upper-air patterns<br />
during bursts and breaks in the Southwest Monsoon.<br />
Mon. Wea. Rev., 122, 726–1739.
Table 1. Average number of CG flashes by hour for each month over the state of Colorado. Average (AVE/DAY) flashes per<br />
day for each month are also shown (bottom). “TOTAL” values are total number of flashes for those months and hours used<br />
in this study. The maximum hourly CG activity occurs at 22 UTC while the minimum occurs at 14 UTC. August has the<br />
highest flash values followed closely by July. As mentioned in the text, this study does not account for the year to year changes<br />
in the detection efficiencies of the NLDN, so the values in this table are higher than shown.<br />
HR<br />
(UTC) JAN FEB MAR APR MAY JUN JUL AUG SEP OCT NOV DEC TOTAL<br />
12 0.1 0.1 0.3 1.6 5.0 9.6 5.6 19.8 13.0 3.9 0.1 0 28929<br />
13 0 0.1 0.3 1.4 4.8 9.1 3.8 16.6 13.6 2.9 0.1 0 25740<br />
14 0 0 0.3 1.3 5.1 6.7 3.6 12.9 14.4 3.0 0.1 0 23202<br />
15 0 0 0.1 1.6 5.7 6.8 3.3 12.9 14.5 4.3 0.1 0 24028<br />
16 0 0 0.1 2.5 11.0 14.1 8.2 14.9 14.9 4.4 0.1 0 34369<br />
17 0 0 0.4 4.8 27.7 46.0 39.3 45.3 24.9 5.6 0.4 0 95172<br />
18 0 0.1 1.3 10.3 60.7 114.4 130.8 138.5 54.9 8.2 0.5 0 254907<br />
19 0 0.3 2.9 16.4 97.2 187.3 272.9 272.4 96.3 12.8 0.9 0 471058<br />
20 0 0.5 4.7 21.8 132.4 239.4 396.1 377.4 137.2 15.5 0.9 0 651235<br />
21 0 0.7 5.2 25.5 146.6 286.5 479.3 464.3 150.3 20.9 0.9 0.1 776372<br />
22 0 0.6 5.8 25.7 151.7 300.9 523.0 521.2 165.9 22.9 0.9 0.1 844535<br />
23 0.1 0.6 5.4 22.2 136.2 298.8 505.0 521.5 154.9 21.7 1.0 0 819420<br />
00 0.1 0.3 3.8 21.2 105.7 278.0 433.5 486.5 146.3 25.7 0.7 0.1 737734<br />
01 0 0.2 2.3 17.5 87.8 223.9 358.1 388.4 112.6 21.8 0.7 0.1 596101<br />
02 0.1 0.1 1.4 11.5 66.9 166.7 279.5 286.9 87.9 20.2 1.0 0 453139<br />
03 0 0.1 0.9 8.4 51.4 117.3 198.2 195.4 66.7 13.3 0.9 0.1 320595<br />
04 0.1 0.1 0.8 7.3 34.8 84.0 144.3 134.0 51.1 11.3 0.6 0 229965<br />
05 0.1 0.1 0.6 7.2 22.3 64.7 91.1 91.4 37.4 10.9 0.4 0 160044<br />
06 0.1 0 0.6 5.4 15.7 51.7 59.9 65.1 26.4 7.4 0.1 0 114023<br />
07 0.4 0 0.4 3.1 11.4 39.3 36.1 48.4 19.5 5.6 0.2 0 80556<br />
08 0.1 0 0.4 2.3 8.4 27.9 26.3 35.7 15.6 5.8 0.2 0 60158<br />
09 0.1 0 0.6 2.0 5.6 19.5 16.2 27.5 14.2 4.4 0.1 0 44211<br />
10 0.1 0 0.5 1.7 5.1 15.7 12.1 19.9 12.4 4.3 0.2 0 35158<br />
11 0 0.1 0.2 1.8 4.2 12.8 8.6 18.5 11.8 4.4 0.2 0 30629<br />
Ave/<br />
day 1.4 4.0 39.3 224.5 1203.4 2621.1 4034.8 4215.4 1456.7 261.2 11.3 0.5<br />
Total 806 1913 19404 107757 596772 1258117 2001217 2090775 699250 129616 5384 269 6911280<br />
Figure 4. Hourly flash density maps for the state of Colorado for 12, 16 and 17 UTC.<br />
Figure 4 (continued on next page). Hourly flash density maps for the state of Colorado for 18, 19, 20, 21, 22, 23, 00, 01, 02<br />
03, 06 and 09 UTC.