Biochemical Engineering Journal Forward engineering of synthetic ...
Biochemical Engineering Journal Forward engineering of synthetic ...
Biochemical Engineering Journal Forward engineering of synthetic ...

Create successful ePaper yourself
Turn your PDF publications into a flip-book with our unique Google optimized e-Paper software.
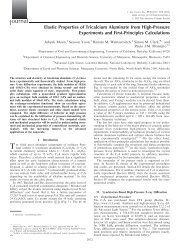
<strong>Biochemical</strong> <strong>Engineering</strong> <strong>Journal</strong> 47 (2009) 38–47<br />
Contents lists available at ScienceDirect<br />
<strong>Biochemical</strong> <strong>Engineering</strong> <strong>Journal</strong><br />
journal homepage: www.elsevier.com/locate/bej<br />
<strong>Forward</strong> <strong>engineering</strong> <strong>of</strong> <strong>synthetic</strong> bio-logical AND gates<br />
Kavita Iyer Ramalingam 1 , Jonathan R. Tomshine 1 , Jennifer A. Maynard 2 , Yiannis N. Kaznessis ∗<br />
Department <strong>of</strong> Chemical <strong>Engineering</strong> & Materials Science, University <strong>of</strong> Minnesota, 421 Washington Ave SE, Minneapolis, MN 55455, United States<br />
article<br />
info<br />
abstract<br />
Article history:<br />
Received 7 April 2009<br />
Received in revised form 22 June 2009<br />
Accepted 25 June 2009<br />
Keywords:<br />
Logical AND gate<br />
Multiscale models<br />
Biocomputing<br />
Stochastic simulations<br />
Synthetic biology<br />
Gene regulatory networks<br />
Computer-aided design<br />
The field <strong>of</strong> <strong>synthetic</strong> biology has produced genetic circuits capable <strong>of</strong> emulating functional paradigms<br />
seen in digital electronic circuits. Examples are bistable switches, oscillators, and logic gates. The present<br />
work combines detailed mechanistic-kinetic models and stochastic simulation techniques as well as the<br />
techniques <strong>of</strong> in vivo molecular biology to study the potential <strong>of</strong> a <strong>synthetic</strong>, single promoter AND gate.<br />
This device is composed <strong>of</strong> elements <strong>of</strong> the tet, lac, and -phage promoters and is responsive to the<br />
commonly used inducers IPTG and aTc, producing GFP as an output signal. The quantitative behavior <strong>of</strong><br />
the AND gate phenotype is studied both in numero and in vivo as a function <strong>of</strong> promoter topology. The<br />
model is constructed from kinetic data obtained from the literature and yields clearly defined ON/OFF<br />
logical behavior at realistic inducer concentrations. These behaviors are matched with observed in vivo<br />
data obtained through fluorescence-activated cell sorting. The effect <strong>of</strong> incomplete repression by weaker<br />
LacI repressor is also investigated and quantified. The simulation results, coupled with in vivo data, not<br />
only identify important design degrees <strong>of</strong> freedom, but also provide parameters that can be used to guide<br />
future <strong>synthetic</strong> designs using these common regulatory elements.<br />
© 2009 Elsevier B.V. All rights reserved.<br />
1. Introduction<br />
A plethora <strong>of</strong> <strong>synthetic</strong> gene regulatory networks has been<br />
created by arranging naturally occurring regulatory proteins to<br />
produce novel biological phenotypic functions [1–4]. To date, the<br />
network paradigms that have been most thoroughly studied are<br />
the bistable switch [5–8], the oscillator [7,9], and various logic gates<br />
[10–17].<br />
In this work we combine multiscale models with <strong>synthetic</strong><br />
bio<strong>engineering</strong> experiments to design, build, and characterize a<br />
high-fidelity logical AND gate in bacteria. A reductionist modeling<br />
approach is pursued. We adopt the molecular biology dogma<br />
that there are universal molecular mechanisms underlying the<br />
emergence <strong>of</strong> phenotypes. Consequently, we represent all gene<br />
expression molecular level events with reactions, including all the<br />
biomolecular interactions involved in transcription, translation,<br />
regulation and induction. This way, we relate each model reaction<br />
toarealin vivo reaction event and any biological system can be<br />
modeled by a network <strong>of</strong> reactions.<br />
Because biological interactions regularly occur away from the<br />
thermodynamic limit, the simulations <strong>of</strong> reaction networks we con-<br />
∗ Corresponding author. Tel.: +1 612 624 4197; fax: +1 612 626 7246.<br />
E-mail address: yiannis@cems.umn.edu (Y.N. Kaznessis).<br />
1 These authors contributed equally to this work.<br />
2 Current address: Department <strong>of</strong> Chemical <strong>Engineering</strong>, University <strong>of</strong> Texas,<br />
Austin, United States.<br />
duct are stochastic, i.e., they generate probability distributions <strong>of</strong><br />
molecular concentration. These distributions are directly comparable<br />
to experimentally observed variation. Detailed models then<br />
provide the opportunity to gain molecular level insight [18–22].<br />
Experimentally, we constructed an in vivo <strong>synthetic</strong>-hybrid system<br />
consisting <strong>of</strong> multiple operators within a single promoter. The<br />
operator sequences employed are derived from three unrelated natural<br />
regulatory elements: the tetracycline (tet), lactose (lac) and<br />
-phage operons arranged logically within a single transcriptional<br />
unit. Specifically, we built six single promoter regulatory motifs by<br />
shuffling tet and lac operator sites (T and L, respectively) in and<br />
around the P L (-phage): LLT, LTL, TLL, TLT, TTL and LTT (Fig. 1;<br />
detailed sequence information is available in supplement). The promoters<br />
drive expression <strong>of</strong> green fluorescent protein (GFP). The<br />
regulatory architecture is designed such that each operator’s position<br />
efficiently interferes with RNA polymerase (RNAp) promoter<br />
binding while causing the least perturbance to promoter function<br />
[23]. To study the logical gate fidelity among the designed variants,<br />
the <strong>synthetic</strong> promoter sequences were incorporated in the<br />
reporter vector pGLOW to direct the transcription <strong>of</strong> GFP. We engineer<br />
the system in an Escherichia Coli strain that constitutively<br />
expresses lactose repressor (LacI) and tetracycline repressor (TetR)<br />
proteins.<br />
The output fluorescence is then dependent on the input <strong>of</strong><br />
two small molecule inducers, anhydrotetracycline (aTc) and isopropyl--thiogalactoside<br />
(IPTG). IPTG and aTc interact with LacI and<br />
TetR, respectively, which then free the operator sites for RNAp to<br />
bind and initiate transcription. The simplicity <strong>of</strong> these designs is<br />
1369-703X/$ – see front matter © 2009 Elsevier B.V. All rights reserved.<br />
doi:10.1016/j.bej.2009.06.014
K.I. Ramalingam et al. / <strong>Biochemical</strong> <strong>Engineering</strong> <strong>Journal</strong> 47 (2009) 38–47 39<br />
Functional <strong>synthetic</strong> modules <strong>of</strong> six designed promoters were<br />
constructed using standard molecular biology techniques. They<br />
were designed using naturally existing, well-characterized genetic<br />
elements from Tet, Lac and -phage operons differing in relative<br />
positions within the transcriptional unit (Fig. 1; details in<br />
Supplementary material). The architecture was based on the modular<br />
system <strong>of</strong> Lutz and Bujard [24,26] however differing in the<br />
individual elements used (sequences <strong>of</strong> lac and tet operators and -<br />
phage promoter). All promoter/operator sequences, transcriptional<br />
start site and the ribosome binding sites are obtained from published<br />
sequences [24]. Two overlapping <strong>synthetic</strong> oligonucleotides<br />
(∼110 bp each) corresponding to the sequence <strong>of</strong> each <strong>synthetic</strong>hybrid<br />
promoter were assembled using polymerase chain reaction<br />
(PCR) amplification with outside primers corresponding to the terminal<br />
20 bp <strong>of</strong> each larger oligonucleotide. After gel purification,<br />
each promoter variant was introduced in the pGLOW-TOPO plasmid<br />
(Invitrogen, Carlsbad, CA) upstream <strong>of</strong> Cycle 3 GFP for use in in<br />
vivo promoter activity assays. Integrity <strong>of</strong> the promoter sequences<br />
was confirmed by DNA sequencing and visual verification <strong>of</strong> constitutive<br />
GFP expression in Top 10 cells (lacI − , tetR − ). Subsequently,<br />
plasmids were transformed into DH5Pro (lacI + , tetR + ) to assess<br />
promoter function in the presence <strong>of</strong> repressors.<br />
2.2. In vivo promoter activity studies<br />
E. coli strain DH5Pro was used for all in vivo promoter activity<br />
assays in the presence <strong>of</strong> IPTG and aTc inducers. A promoter-less<br />
pGLOW variant (containing a non-functional DNA fragment) served<br />
as a negative control. Overnight cultures were inoculated 1:100 into<br />
fresh LB medium containing 200 g/mL ampicillin and 50 g/mL<br />
spectinomycin. Inducer concentrations varied from 0 to 2 mM <strong>of</strong><br />
IPTG and 0 to 200 ng/mL aTc, resulting in a matrix <strong>of</strong> 36 different<br />
inducer pair combinations, each <strong>of</strong> which was monitored for GFP<br />
output over a 24-h period. Specifically, cultures were maintained at<br />
37 ◦ C with shaking (250 rpm). At 3, 6 and 9 h time points samples<br />
were taken and the cells diluted 1:10 to restrict growth to logarithmic<br />
phase and retain constant cellular parameters (e.g., 70 levels).<br />
Samples were monitored for growth state by OD 600 .<br />
2.3. GFP quantification using flow cytometry<br />
Fig. 1. Schematic representation <strong>of</strong> the <strong>synthetic</strong> bio-logical AND gates. Promoter<br />
sequence data is available in supplement.<br />
highlighted by the minimal number <strong>of</strong> regulatory components<br />
required to achieve high-fidelity, robust AND gate functionality.<br />
Prior studies served as a prelude to the construction <strong>of</strong> “TLT”<br />
first [24], in which a single lacO is inserted between −35 and −10<br />
hexamers, reportedly the most effective operator position. More<br />
recently, Cox et al. [25] presented a powerful, combinatorial method<br />
for quickly generating single promoter motifs with a wide variety<br />
<strong>of</strong> logical gate phenotypic behavior. The methods presented herein<br />
represent a different design philosophy, though some <strong>of</strong> the same<br />
promoter designs are ultimately reached. Rather than construct and<br />
screen a large library <strong>of</strong> putative promoters, we are guided by models<br />
to rationally construct a small number <strong>of</strong> promoters in a targeted<br />
fashion. Importantly, the modeling approach is general enough that<br />
it is in principle applicable to any gene regulatory network, and this<br />
work serves to validate the approach.<br />
2. Methods and models<br />
2.1. Promoter and plasmid construction, strains<br />
In vivo GFP fluorescence was measured using a Becton Dickinson<br />
FACS Calibur flow cytometer equipped with a 488 nm argon<br />
laser and a 515–545 nm emission filter (FL1) at low flow rate.<br />
Samples were fixed with paraformaldehyde (PFA) to halt GFP production<br />
and degradation after harvesting at each time point. One<br />
milliliter <strong>of</strong> cell culture was centrifuged to collect the cells, fixed<br />
for 15–30 min in 4% paraformaldehyde (PFA) and re-suspended in<br />
phosphate buffered saline (PBS). For each sample, 100,000 gated<br />
events were collected and analyzed using Cellquest s<strong>of</strong>tware (BD<br />
Biosciences). GFP fluorescence detected by the FL1 channel was<br />
represented as the mean fluorescence versus the normalized population<br />
distribution after subtraction <strong>of</strong> background fluorescence.<br />
Background fluorescence was determined using two sets <strong>of</strong> controls.<br />
First, from non-induced cells harboring functional pGLOW<br />
plasmids and second, from induced cells maintaining a pGLOW<br />
variant with a non-functional promoter sequence. Each <strong>of</strong> the six<br />
<strong>synthetic</strong>-hybrid promoter variants was characterized under identical<br />
experimental conditions for comparison <strong>of</strong> promoter activity<br />
and AND logic gate behavior.<br />
2.4. Kinetic models and parameters<br />
The set <strong>of</strong> reactions modeling the LTT logical AND gate <strong>synthetic</strong><br />
circuit is presented as an example in Table 2. The novelty <strong>of</strong> the<br />
approach lays with the detailed incorporation <strong>of</strong> all biomolecular<br />
interactions describing all <strong>of</strong> the known interaction events in<br />
the transcription, translation, repression, and induction processes.<br />
This reductionist approach results in large, complex reaction networks<br />
that are difficult to simulate. However, although the resulting
40 K.I. Ramalingam et al. / <strong>Biochemical</strong> <strong>Engineering</strong> <strong>Journal</strong> 47 (2009) 38–47<br />
Table 1<br />
Kinetic constants obtained for RNAp displacing<br />
operator-bound LacI in each <strong>of</strong> the 3 promoters<br />
containing 2 tetO sites (reactions 2 and 3 <strong>of</strong> Table 2).<br />
System k (L mol −1 s −1 )<br />
LTT 6.23 × 10 5<br />
TLT 4.54 × 10 5<br />
TTL 1.09 × 10 5<br />
models are challenging to solve, the approach is general enough<br />
to be applicable to a wide variety <strong>of</strong> <strong>synthetic</strong> gene network constructs,<br />
such as oscillators, bistable switches, tetracycline-inducible<br />
networks among others [19,21,27,28].<br />
More than sixty reactions comprise the network <strong>of</strong> components<br />
used to simulate the AND gates. Many reactions are reversible, and<br />
these are represented as pairs <strong>of</strong> irreversible reactions. All reactions<br />
are modeled as initially occurring in a well mixed volume <strong>of</strong> 10 −15 L<br />
which represents a cell, and each cell is assumed to contain one copy<br />
<strong>of</strong> the simulated plasmid. That is, the cell contains one “molecule”<br />
<strong>of</strong> each DNA species. Cell growth is handled by allowing the reaction<br />
volume to double over a period <strong>of</strong> time (60 min) followed by<br />
an instantaneous halving <strong>of</strong> volume to represent cytokinesis, thus<br />
matching the log phase growth maintained in the in vivo work.<br />
Each <strong>of</strong> the 60–70 reactions demands at least one kinetic parameter,<br />
and in some cases (particularly transcriptional or translational<br />
elongation modeled as gamma-distributed random processes), two<br />
parameters. These kinetic parameters can be obtained from literature<br />
directly or reasonably inferred from published thermodynamic<br />
data [29–35]. Indeed, one <strong>of</strong> the reasons the tetracycline and lactose<br />
operon systems were chosen is that they are exceptionally<br />
well studied, and the kinetic and thermodynamic data necessary<br />
to populate Table 2 are available in the literature.<br />
Initially, in the first round <strong>of</strong> modeling before we conducted any<br />
experiments we did not account for the leakiness <strong>of</strong> the promoters.<br />
The simulations revealed a high-fidelity AND gate for all six<br />
promoters. Indeed, in the absence <strong>of</strong> leakiness all the promoters<br />
with double-tetO (TTL, TLT, LLT) had the exact same behavior. So<br />
did the three promoters with double-lacO. Insupplementary text<br />
we present results <strong>of</strong> the simulations with the reaction network<br />
without leakiness.<br />
After we conducted the experiments it became clear that leakiness<br />
<strong>of</strong> the promoters as a function <strong>of</strong> the position <strong>of</strong> the lactose<br />
operator(s) relative to the −35 and −10 sequences <strong>of</strong> the promoter<br />
(promoter topology) is a critical model parameter. It also became<br />
quickly clear that it is unavailable in literature sources. Without<br />
additional kinetic information, the behavior <strong>of</strong> the models would<br />
depend only on the number <strong>of</strong> lacO or tetO sites present. That is, all<br />
promoters containing two lacO sites and one tetO site would be considered<br />
equivalent, regardless <strong>of</strong> topology, as the initial simulation<br />
results suggested. Although the leakiness <strong>of</strong> promoters with lacO<br />
has been discussed in the literature [24,26], there was no existing<br />
information available to quantify the differences between designs<br />
<strong>of</strong> equivalent composition (number and type <strong>of</strong> operator sites) but<br />
differing topology.<br />
To address this issue, two reactions were added in each model,<br />
reactions 2 and 3 <strong>of</strong> Table 2, to capture the finite probability <strong>of</strong><br />
RNAp binding the promoter and initiating transcription by displacing<br />
a bound LacI repressor protein from the promoter (“leakiness”).<br />
As these two reactions essentially represent the same event, they<br />
are constrained to have the same kinetic parameter. This parameter<br />
was then used to fit the model results to the experimental measurements,<br />
producing values for the kinetic constants <strong>of</strong> these reactions<br />
as explained in supplement and listed in Table 1.<br />
It should also be noted that, while the kinetic constants for reactions<br />
2 and 3 (as well as the levels <strong>of</strong> LacI and TetR expressed<br />
by the DH5Pro cells in use) were fit to experimental data afterthe-fact<br />
and thus not available a priori, the rest <strong>of</strong> the model was<br />
constructed before experimental work began. While the absence<br />
<strong>of</strong> these parameters led to some quantitative error in this initial<br />
round <strong>of</strong> modeling (see supplementary text), the general viability<br />
<strong>of</strong> the proposed system was verified in advance <strong>of</strong> any lab work—a<br />
significant benefit <strong>of</strong> “model-driven designs”.<br />
Finally, we should note again that although the model is complex,<br />
the approach to build it is not. Indeed we have pursued the<br />
same modeling approach in all <strong>of</strong> our previous work and recently<br />
we presented and made publicly available a s<strong>of</strong>tware tool that codifies<br />
this approach so that a user can generate complex reaction<br />
networks <strong>of</strong> arbitrary <strong>synthetic</strong> gene network constructs by only<br />
entering interacting components and defining regulatory relations<br />
[36,37]. With the tool, we are also making available all the files for<br />
the AND gate reaction network.<br />
2.5. Algorithms and simulations<br />
The numerical simulations are carried out using the multiscale<br />
simulation algorithm developed in our group [18,20,28,37,38]<br />
rather than by simply solving a system <strong>of</strong> ordinary differential equations.<br />
This is necessitated by the inherently stochastic nature <strong>of</strong><br />
biomolecular interactions [39], the small size <strong>of</strong> a bacterium, and<br />
the dilute nature <strong>of</strong> some <strong>of</strong> the reactants. Indeed, promoter and<br />
operator sites may be present in quantities as small as one copy<br />
per cell, rendering continuous-deterministic models distinctly false<br />
(see Supplementary material for further discussion and a presentation<br />
<strong>of</strong> the discrete nature <strong>of</strong> reactions used to model the AND<br />
gates).<br />
Furthermore, the kinetic constants span twenty orders <strong>of</strong><br />
magnitude, resulting in a model that is stiff to propagate in<br />
time. Thus, while there is the need to simulate parts <strong>of</strong> the<br />
network discretely and stochastically, simulating with a simple<br />
kinetic Monte Carlo algorithm would be computationally<br />
intractable. The algorithm developed in our group, dynamically<br />
determines appropriate stochastic-discrete, stochastic-continuous<br />
and deterministic-continuous modeling regimes for each molecular<br />
species and each reaction and uses the appropriate modeling<br />
formalism to numerically propagate the system forward in time.<br />
While computationally efficient, it is also accurate—never generating<br />
negative species populations.<br />
A disadvantage <strong>of</strong> stochastic simulations is that an ensemble<br />
<strong>of</strong> simulations must be conducted for meaningful results to be<br />
obtained. In the present case, 1000 trajectories are generated for<br />
each aTc/IPTG pair <strong>of</strong> concentrations (a grid <strong>of</strong> 36 pairs), resulting<br />
in 36,000 simulations for each <strong>of</strong> the six reaction networks.<br />
On the other hand, the time-dependent probability distribution <strong>of</strong><br />
species-numbers can only be adequately sampled with stochastic<br />
simulations, providing phenotypic distributions (as in Figs. 2 and 4)<br />
that are directly comparable to experimentally observed variability.<br />
3. Results<br />
We have simulated and experimentally constructed six different<br />
promoters in E. coli combining tetracycline (T) and lactose (L)<br />
operators in the three positions around the promoter −35 and −10<br />
positions (TTL, TLT, LTT, LLT, LTL, TLL). We induced them, both in silico<br />
and in vivo, with 36 different concentrations <strong>of</strong> IPTG and aTc inducers.<br />
We tested their behavior and evaluated whether they behave<br />
like an AND gate, turning on the expression <strong>of</strong> GFP downstream if<br />
both IPTG and aTc are present in the culture.<br />
In terms <strong>of</strong> simulation results, the stochasticity <strong>of</strong> all biomolecular<br />
interactions comprising the <strong>synthetic</strong> bio-logical gate, as<br />
detailed in Section 2, results in probability distributions <strong>of</strong> GFP
K.I. Ramalingam et al. / <strong>Biochemical</strong> <strong>Engineering</strong> <strong>Journal</strong> 47 (2009) 38–47 41<br />
Fig. 2. The stochastic kinetic models pursued in this study generate not only mean steady-state values <strong>of</strong> GFP expression level, but ensembles <strong>of</strong> trials—“virtual cells” exhibiting<br />
varied levels <strong>of</strong> GFP expression. Moreover, these evolve dynamically in time. Histograms for the LTT (a) and TTL (b) systems plot GFP levels versus time for the case <strong>of</strong> 100 ng/mL<br />
aTc and 1 mM IPTG. The colors <strong>of</strong> the heat map are assigned based on the log (base-e) <strong>of</strong> the number <strong>of</strong> cells per bin (plus one, to avoid taking the log <strong>of</strong> zero). Lines showing<br />
the mean value (white) and a one standard deviation interval (black dashed) are also included.<br />
concentrations. Fig. 2 depicts the results <strong>of</strong> two simulated systems,<br />
the LTT (a) and TTL (b) promoters, in the form <strong>of</strong> a histogram<br />
<strong>of</strong> GFP levels at different time points for the case <strong>of</strong> the highest<br />
inducer levels investigated (6 × 10 6 molecules/cell or 1 mM IPTG<br />
and 259 molecules/cell or 200 ng/mL <strong>of</strong> aTc). The steady-state GFP<br />
expression is at its highest at these inducer concentrations, compared<br />
to all 36 different concentration pairs used. Superimposed on<br />
the histograms are lines representing the mean and a one standard<br />
deviation interval. This figure shows that the distribution <strong>of</strong> states<br />
does not change significantly between 6 and 9 h, indicating that a<br />
steady-state has been achieved. This is the case for all six systems<br />
simulated, under all inducer concentrations.<br />
Using flow cytometry, probability distributions are measured<br />
experimentally for all six promoters in all 36 inducer pair concentrations<br />
at 3, 6, and 9 h post-induction. A compilation <strong>of</strong> both<br />
experimental and simulation results at 6 h post-induction are provided<br />
in Fig. 3 in the form <strong>of</strong> mean GFP level. The color-coded,<br />
two-dimensional surfaces are constructed from the 36 mean GFP<br />
levels at the different IPTG and aTc inducer concentrations. For<br />
example, Fig. 4 presents the model-generated distributions calculated<br />
for the TTL system at a fixed time point (6 h post-induction) at<br />
various inducer concentrations. Using the mean value <strong>of</strong> each distribution,<br />
corresponding to different aTc–IPTG concentrations, we<br />
construct the three-dimensional plots <strong>of</strong> GFP as a function <strong>of</strong> aTc<br />
and IPTG.<br />
More specifically, to compare the simulation with the experimental<br />
results we determine the average number <strong>of</strong> GFP molecules<br />
per cell at 6 h, averaging over 1000 simulation trajectories, and the<br />
average fluorescence strength at 6 h, averaging over 100,000 cytometry<br />
measurements. The third column <strong>of</strong> Fig. 3 depicts the square <strong>of</strong><br />
the difference between the experimental and simulation values <strong>of</strong><br />
mean GFP per cell as evaluated at each point in the aTc–IPTG plane.<br />
Note that only one system containing one tetO site and two lacO<br />
sites is displayed, since the behavior <strong>of</strong> all three (LLT, LTL, TLL) was<br />
identical (more in Section 4).<br />
As discussed in detail in Section 2, a first round <strong>of</strong> simulations,<br />
which did not take into account promoter leakiness, showed that<br />
we could expect an AND gate behavior from the promoters we<br />
constructed. The results from these simulations, however, did not<br />
differentiate between the different topologies. In other words, the<br />
simulations <strong>of</strong> TTL, TLT, and LTT systems gave identical results. So<br />
did the simulations <strong>of</strong> LLT, LTL, and TLL systems.<br />
In order to ultimately obtain the observed match between simulations<br />
and experiment for each promoter design, the operator<br />
position dependent leakiness had to be taken into account in the<br />
models. Two more reactions were added in the models and the lacO<br />
leakiness reactions (reactions 2 and 3 <strong>of</strong> Table 2) were fit to experimental<br />
data. The values <strong>of</strong> the kinetic constants for the leakiness<br />
reactions are shown in Table 1.<br />
Fig. 5 depicts detailed histograms <strong>of</strong> experimental flow cytometry<br />
data for selected systems (TTL, LTT, and LTL) and induction<br />
conditions, also 6 h post-induction. The simulation data are also<br />
analyzed in terms <strong>of</strong> the fraction <strong>of</strong> cells in an ON or OFF state (where<br />
“ON” is defined as greater than 50 molecules <strong>of</strong> GFP—that is, 5% <strong>of</strong><br />
the maximum GFP expression level observed under any conditions:<br />
1015 molecules <strong>of</strong> GFP observed for an LTT promoter design with<br />
2 mM IPTG and 100 ng/mL <strong>of</strong> aTc) in Fig. 6.<br />
Since the model is detailed, with each simulated reaction step<br />
corresponding to a real biochemical reaction, a sensitivity analysis<br />
can be undertaken. While there has been no attempt made to<br />
exhaustively analyze the response <strong>of</strong> the model to all 60–70 parameters,<br />
selected analyses are presented in Fig. 7 (GFP expression<br />
versus repressor generation rates in a fully induced state) and 8<br />
(GFP expression versus leaky initiation rate in the presence <strong>of</strong> aTc,<br />
both with and without IPTG).<br />
4. Discussion<br />
Let us first focus on the experimental results (first column <strong>of</strong><br />
Fig. 3). A high-fidelity bio-logical AND gate will have high GFP<br />
expression levels only at high concentrations <strong>of</strong> both aTc and IPTG. It<br />
is clear that none <strong>of</strong> the designed bio-logical gates is <strong>of</strong> perfect, digital<br />
fidelity. In the double-tetO systems (promoters containing two<br />
tetO sites and one lacO site: LTT, TLT, and TTL) there is always a GFP<br />
signal for non-zero aTc concentrations, even without IPTG present.<br />
This is clearly the result <strong>of</strong> leakiness <strong>of</strong> promoters containing the<br />
lactose operator.<br />
Nonetheless, despite the imperfect AND gate phenotype, the<br />
double-tetO systems exhibit varying degrees <strong>of</strong> AND gate functionality<br />
with no GFP expressed in the absence <strong>of</strong> inducers and high GFP<br />
levels in response to high inducer concentrations. There is a monotonic<br />
increase <strong>of</strong> output signal with inducer concentrations at low<br />
aTc and IPTG levels. The output signal strength reaches a plateau<br />
past low IPTG and aTC levels. Increasing the concentration beyond<br />
0.1–1 mM IPTG does not result in significantly stronger fluorescence<br />
signals. In prior reports, the lacO 1 location within a promoter<br />
sequence has been found to significantly impact promoter repressibility,<br />
with a centrally placed lacO 1 in the core promoter region
42 K.I. Ramalingam et al. / <strong>Biochemical</strong> <strong>Engineering</strong> <strong>Journal</strong> 47 (2009) 38–47<br />
Fig. 3. The x and y axes form a grid <strong>of</strong> 36 pairs <strong>of</strong> inducer concentrations. The concentrations tested were 0, 1, 10, 50, 100, and 200 ng/mL for aTC and 0, 0.001, 0.002, 0.005,<br />
0.010, 0.100, and 1.000 mM for IPTG (all experimental histograms in Supplementary material). The third column <strong>of</strong> heat maps shows the square <strong>of</strong> the difference between<br />
the experiments and the simulations. These four pairs <strong>of</strong> pr<strong>of</strong>iles depict the modeled (left) and observed (center) behavior <strong>of</strong> four promoter designs: (a) LTT, (b) TLT, (c) TTL,<br />
and (d) LTL. Only one representative promoter with 2-Lac operator elements is depicted, as none <strong>of</strong> the 2-Lac designs induces to a significant degree. In all cases, with both<br />
experiment and simulation, behavior is depicted 6 h after induction. The plotted model values are the means <strong>of</strong> 1000 independent stochastic kinetic simulations, whereas<br />
experimental values are the means <strong>of</strong> 100,000 FACS observations.
K.I. Ramalingam et al. / <strong>Biochemical</strong> <strong>Engineering</strong> <strong>Journal</strong> 47 (2009) 38–47 43<br />
Fig. 4. Model histograms: Conditions are ±100 ng/mL aTc and ±1 mM IPTG, e.g., ± refers to 100 ng/mL aTc and 1 mM IPTG. Here, the pr<strong>of</strong>ile <strong>of</strong> the TTL system (a) is examined<br />
in detail at four points as marked by the colored rings. Each <strong>of</strong> the four points circled by a colored ring in (a) corresponds to the identically colored histogram plot as depicted<br />
in panel (b). These histograms can be compared to the experimental FACS histograms obtained for the TTL system in Fig. 5a (the induction levels are identical). The histograms<br />
produced by the models, however, are free from the noise (dust, dead cell debris, etc.) present in the experimental data at low fluorescence values. This type <strong>of</strong> comparison<br />
would be impossible using simplified or differential equation models.<br />
Table 2<br />
The complete network <strong>of</strong> reactions in a <strong>synthetic</strong> logical AND gate model. As an example the reactions <strong>of</strong> the LTT system are shown. Source numbers correspond to the<br />
following references: (1) [30], (2) [31], (3) [34], (4) [35], (5) [33], (6) [32], (7) [29].<br />
Number General transcription and translation reactions k Source Number TetR repression, 2nd Tet operator k Source<br />
1 RNAp + lacP + lacO 1 + tetO 1 + tetO 2 → RNAp:lacP 1.00E+07 3 33 tetR2 + tetO 2 → tetR2:tetO 2 10000000 2 a<br />
2 (See below) 34 tetR2:tetO 2 → tetR2 + tetO 2 0.001 2 a<br />
3 (See below) 35 tetR2:aTc + tetO 2 → tetR2:tetO 2:aTc 10000000 6 a<br />
4 RNAp:lacP → RNAp:lacP a 0.01 4 36 tetR2:tetO 2:aTc → tetR2:aTc + tetO 2 1 6 a,b<br />
5 RNAp:lacP → RNAp + lacP + lacO 1 + tetO 1 + tetO 2 1 3 37 tetR2:aTc2 + tetO 2 → tetR2:tetO 2:aTc2 10000000 6 a<br />
6 RNAp:lacP a → lacP + lacO 1 + tetO 1 + tetO 2 + RNAp:DNAc 30 5 38 tetR2:tetO 2:aTc2 → tetR2:aTc2 + tetO 2 100000 6 a,b<br />
7 RNAp:DNAgfp → RNAp + gfp mRNA 30 5 d 39 tetR2:tetO 2 +aTc→ tetR2:tetO 2:aTc 10000000 6 a<br />
8 gfp mRNA + rib → rib:gfp mRNA 100000 e 40 tetR2:tetO 2:aTc → tetR2:tetO 2 + aTc 0.001 6 a<br />
9 rib:gfp mRNA → rib:gfp mRNA 1 + gfp mRNA 33 5 41 tetR2:tetO 2:aTc + aTc → tetR2:tetO 2:aTc2 10000000 6 a<br />
10 rib:gfp mRNA 1 → rib + gfp 33 5 d 42 tetR2:tetO 2:aTc2 → tetR2:tetO 2:aTc + aTc 0.001 6 a<br />
Lad repression at lac operator<br />
Nonspecific DNA interactions<br />
11 lacl4 + lacO 1 → lacl4:lacO 1 2E + 09 1 43 Iacl4 + nsDNA → lacl4:nsDNA 1000 7 a<br />
12 lacl4:lacO 1 → lacl4 + lacO 1 4.00E−04 1 44 lacl4:nsDNA → Iacl4 + nsDNA 0.0041667 7 a<br />
13 Iacl4 + IPTG → lacl4:IPTG 4.60E+06 1 45 lacl4:IPTG + nsDNA → lad4:IPTG:nsDNA 1000 7 a<br />
14 lacl4:IPTG → Iacl4 + IPTG 0.2 1 46 lacl4:IPTG:nsDNA → lacl4:IPTG + nsDNA 0.0041667 7 a<br />
15 lacl4:lacO 1 + IPTG → lacl4:lacO 1:IPTG 1.00E+06 1 47 tetR2 + nsDNA → tetR2:nsDNA 1000 7 a<br />
16 lacl4:lacO 1:IPTG → lacl4:lacO 1 + IPTG 0.8 1 48 tetR2:nsDNA → tetR2 + nsDNA 3.2409 7 a<br />
17 lacl4:IPTG + lacO 1 → lacl4:lacO 1:IPTG 2E+09 1 49 tetR2:aTc + nsDNA → tetR2:aTc:nsDNA 1000 7 a<br />
18 lacl4:lacO 1:IPTG → lacl4:IPTG + lacO 1 0.4 1 50 tetR2:aTc:nsDNA → tetR2:aTc + nsDNA 3.2409 7 a<br />
TetR repression, 1st Tet operator<br />
Degradation and dilution reactions<br />
19 tetR2+aTc→ tetR2:aTc 100000000 6 a 51 →tetR2 1.00E−11 f<br />
20 tetR2:aTc → tetR2 + aTc 0.001 6 a 52 tetR2→ 2.89E−04 f<br />
21 tetR2:aTc + aTc → tetR2:aTc2 100000000 6 a 53 tetR2:aTc → aTc 2.89E−04 f<br />
22 tetR2:aTc2 → tetR2:aTc + aTc 0.001 6 a 54 tetR2:aTc2 → 2aTc 2.89E−04 f<br />
23 tetR2 + tetO 1 → tetR2:tetO 1 100000000 2 a 55 →Iacl4 1.00E−09 f<br />
24 t6lR2:tetO 1 → tetR2 + tetO 1 0.001 2 a 56 Iacl4→ 2.89E−04 f<br />
25 tetR2:aTc + tetO 1 → tetR2tetO 1:aTc 100000000 6 a 57 lacl4:IPTG → IPTG 2.89E−04 f<br />
26 te1R2:tetO 1:aTc → tetR2:aTc + tetO 1 1 6 a,b 58 gfp mRNA → 1.16E−03 e<br />
27 tetR2:aTc2 + tet01 → tetR2:tetO 1:aTc2 100000000 6 a 59 gfp→ 3.21E−05 c<br />
28 tetR2:tetO 1:aTc2 → tetR2:aTc2 + tetO 1 100000 6 a,b 60 lacl4:nsDNA → nsDNA 1.93E−04 g<br />
29 tetR2:tetO 1 +aTc→ tetR2tetO 1:aTc 100000000 6 a 61 lacl4:IPTG:nsDNA → nsDNA + IPTG 1.93E−04 g<br />
30 tetR2:tetO 1:aTc → tetR2:tetO 1 + aTc 0.001 6 a 62 tetR2:aTc:nsDNA + nsDNA + aTc 1.93E−04 g<br />
31 tetR2:tetO 1:aTc + aTc → tetR2:tetO 1:aTc2 100000000 6 a 63 tetR2:nsDNA → nsDNA 1.93E−04 g<br />
32 tetR2:tetO 1:aTc2 → tetR2tetO 1:aTc + aTc 0.001 6 a<br />
Lad/lacO leakiness reactions<br />
2 RNAp + lacP + lacl4:lacO 1 + tetO 1 + tetO 2 → RNAp:<br />
lacP + Iacl4<br />
3 RNAp + lacP + lacl4:lacO 1:IPTG + tetO 1 + tetO 2 → RNAp:<br />
lacP + lacl4:IPTG<br />
6.23E+05<br />
6.23E+05<br />
f<br />
f<br />
a The indicated reference provides affinity data, so the forward rate is assumed and the reverse rate is calculated to match the data.<br />
b The affinities at the two distinct levels <strong>of</strong> aTc induction (a single aTc molecule or two aTc molecules bound to TetR) are estimated, based on a single literature value.<br />
c This value is based on a 6-h half-life. Effectively, this species does not degrade chemically—rather, the rate <strong>of</strong> dilution through cell growth is much greater than the<br />
degradation rate.<br />
d This reaction time is gamma-distributed, based on the indicated 1st order constant occurring at each step over a span <strong>of</strong> 600 nucleotides (200 amino acids).<br />
e This value has been adjusted to give ∼20 polypeptides per mRNA transcript.<br />
f These parameters are fit to experimental data obtained in this study—they are not obtained from previously published sources.<br />
g This “degradation” rate matches the rate <strong>of</strong> dilution due to cell growth. It is intended to represent dilution <strong>of</strong> DNA-bound species during DNA replication and cell growth.
44 K.I. Ramalingam et al. / <strong>Biochemical</strong> <strong>Engineering</strong> <strong>Journal</strong> 47 (2009) 38–47<br />
Fig. 5. Experimental histograms: Conditions are ±100 ng/mL aTc and ±1 mM IPTG, e.g., ± refers to 100 ng/mL aTc and 1 mM IPTG. Panel (a) depicts a TTL promoter design<br />
which behaves as a true AND gate. With no inducer, or with aTc or IPTG alone (even at fairly high levels), a singe un-induced population is observed with minimal leakiness.<br />
Only when aTc and IPTG are both present are the cells induced. Panel (b) depicts an LTT promoter design, where the single lac operator site has been moved upstream <strong>of</strong> the<br />
−35 sequence. In this case, LacI is no longer able to entirely suppress transcription and an intermediate level <strong>of</strong> induction (leakiness) occurs at conditions <strong>of</strong> high aTc but no<br />
IPTG. The addition <strong>of</strong> IPTG fully induces the system at a higher level than that <strong>of</strong> the TTL system. The promoter examined in panel (c) is <strong>of</strong> an LTL design, where lac operator<br />
sites have been placed both upstream <strong>of</strong> the −35 sequence and downstream <strong>of</strong> the −10. In this case, even high levels <strong>of</strong> IPTG are unable to induce the system, regardless <strong>of</strong><br />
aTc concentration. Models suggest that this design may become feasible if the cells’ intrinsic rate <strong>of</strong> constitutive LacI synthesis (and hence steady-state LacI concentration)<br />
were lowered. All data is obtained 6 h after induction.<br />
<strong>of</strong>fering the best repression [24]. This trend agrees with the LTT and<br />
TLT systems under investigation, with the latter expressing tighter<br />
control. However with TTL, lacO 1 positioned downstream <strong>of</strong> −10<br />
hexamer provided greater repression than either the TLT or LTT systems,<br />
an interesting deviation from the observations <strong>of</strong> Lanzer and<br />
Bujard [24].<br />
The promoters remained tightly repressed under the following<br />
conditions: 0–1 mM IPTG and no aTc and 0–10 ng/mL aTc and no<br />
IPTG, defining the <strong>of</strong>f limit <strong>of</strong> the switch. Induction was observed<br />
only above 10 ng/mL aTc concentrations, indicating the system’s<br />
transition from an AND gate to single input switch.<br />
Interestingly, the fidelity <strong>of</strong> the AND gate appears to improve<br />
by moving lacO downstream in the promoter. Although the maximum<br />
amount <strong>of</strong> GFP expressed under full induction (the plateau<br />
regions) is lower as lacO is moved downstream in the promoter,<br />
the leakiness effect on the fidelity <strong>of</strong> the AND gate appears to be<br />
attenuated—a trend that is also observed in the model (Fig. 8). To<br />
better understand this effect, the TTL and LTT promoters were investigated<br />
under identical in vivo experimental conditions, producing<br />
the qualitatively different histograms in panels (a) and (b) <strong>of</strong> Fig. 5.<br />
Under conditions <strong>of</strong> increasing aTc concentration and IPTG absent,<br />
downstream positioning <strong>of</strong> lacO in TTL conferred an order <strong>of</strong> magnitude<br />
tighter control, yielding the best AND gate switch among<br />
the systems investigated. Thus lacO–repressor complex seems to<br />
be performing well at maintaining the regulatable gene circuit in a<br />
repressed state under high aTc concentrations (up to 100 ng/mL),<br />
a condition corresponding to free tetO 2 or increased probability<br />
for recruitment <strong>of</strong> RNAp to initiate transcription. Consequently TTL<br />
displayed an enhanced aTc induction threshold concentration comparedtoLTTorTLT.<br />
The fuzziness <strong>of</strong> the AND gate can also be viewed in terms <strong>of</strong><br />
phenotypic diversity in response to inducers. Phenotypic variation<br />
as a result <strong>of</strong> point mutation or altered connectivity in <strong>synthetic</strong><br />
circuits has been observed [10–12,16,40]. This study indicates that<br />
variability in logic behavior can be attained through permutations<br />
<strong>of</strong> operator position within a transcriptional unit.<br />
The double-lacO systems, on the other hand, express almost no<br />
appreciable GFP levels even at the highest inducer concentrations.<br />
This can be explained by relatively high concentrations <strong>of</strong> LacI constitutively<br />
expressed in the E. coli strain DH5Pro. Given the high<br />
levels <strong>of</strong> LacI present, even under conditions <strong>of</strong> strong induction,<br />
most lacO sites remain bound by repressor. For instance, the simulations<br />
<strong>of</strong> the LTT system – the most active promoter – show that<br />
under conditions <strong>of</strong> strong induction (6 h after the addition <strong>of</strong> 1 mM<br />
IPTG), the single lacO site is only free in 6.8% <strong>of</strong> the cells in the 1000-<br />
cell ensemble. In the rest <strong>of</strong> the cells it is occupied (0.1% <strong>of</strong> the cells<br />
Fig. 6. The surfaces represent the fraction <strong>of</strong> simulated cells that are in an OFF state at 6 h post-induction. Panel (a) is an LTT system, while panel (b) is the TTL system. Here, a<br />
cell is described as “ON” if it is expressing greater than 50 molecules <strong>of</strong> GFP per cell. This threshold is arbitrarily set at 5% <strong>of</strong> the absolute maximum GFP expression observed<br />
under any conditions. The “OFF” state is defined as 1 − “ON”. While these panels bear a resemblance to their mean value counterparts in Fig. 3, it should be noted that even<br />
with the more active LTT promoter, not all cells are predicted to induce. Indeed, the lower activity <strong>of</strong> the TTL design is manifested in a very significant fraction <strong>of</strong> cells that are<br />
OFF, expressing very low levels <strong>of</strong> GFP, even in the fully induced plateau region.
K.I. Ramalingam et al. / <strong>Biochemical</strong> <strong>Engineering</strong> <strong>Journal</strong> 47 (2009) 38–47 45<br />
Fig. 7. The heat map depicts the simulated effect <strong>of</strong> varying the constitutive expression<br />
rates <strong>of</strong> LacI and TetR on GFP expression levels under conditions <strong>of</strong> full induction<br />
(1 mM IPTG, 100 mg/mL aTc) in a hypothetical double-tetO system that is free <strong>of</strong><br />
leaky expression. At higher levels <strong>of</strong> repressor expression (upper-right), cellular<br />
concentrations are high enough that even these “full” inducer concentrations are<br />
insufficient to free the operator sites and allow transcription. The tighter binding<br />
<strong>of</strong> TetR to its operator site, and the fact that there are two such sites, produces the<br />
steeper gradient along the horizontal axis, as compared to the vertical axis. The red<br />
circle at the top <strong>of</strong> the figure shows the rates employed in the rest <strong>of</strong> the simulations.<br />
These parameters were chosen with the aid <strong>of</strong> similar plots evaluated for doublelacO<br />
systems and zero induction conditions (not shown). (For interpretation <strong>of</strong> the<br />
references to color in this figure legend, the reader is referred to the web version <strong>of</strong><br />
the article.)<br />
by LacI alone, 88.3% by LacI:IPTG complex, 4.7% by RNAp closed<br />
complex, and 0.1% by RNAp open complex). Nevertheless, these 6.8%<br />
<strong>of</strong> cells are sufficient to produce the observed GFP output.<br />
The addition <strong>of</strong> a second lacO site (in place <strong>of</strong> a tetO) might<br />
be expected to yield a further 93.2% reduction in the number<br />
<strong>of</strong> promoters with both lacO sitesfree–atotal<strong>of</strong>0.5% <strong>of</strong> cells<br />
(0.0682 = 0.0046) – and this is precisely what is observed. The simulations<br />
for the LTL system show that, under the same conditions<br />
mentioned above, both lacO sites are simultaneously free in only 5<br />
Fig. 8. A sensitivity analysis <strong>of</strong> the effect <strong>of</strong> increasing LacI/lacO “leakiness,” whereby<br />
RNAp binds to the promoter, displacing lacO-bound LacI. At lower leakiness rates,<br />
the fully induced (+aTc/+IPTG) level <strong>of</strong> GFP expression is lower, but leaky expression<br />
(+aTc/−IPTG) is proportionally lower still. The system is evaluated at 6 h postinduction<br />
with 100 mM aTc and (if present) 1 mM IPTG. The three vertical red lines<br />
indicate the observed experimental values listed in Table 1, with the least active<br />
(and least leaky) TTL design at left, the most active (and most leaky) LTT design at<br />
right, and TLT in the center. (For interpretation <strong>of</strong> the references to color in this figure<br />
legend, the reader is referred to the web version <strong>of</strong> the article.)<br />
cells <strong>of</strong> the 1000-cell ensemble, or 0.5% <strong>of</strong> cells (one lacO site was<br />
free in 10.9% <strong>of</strong> cells, and neither site was free in 88.6% <strong>of</strong> cells).<br />
Furthermore, the leakiness reactions employed in the model<br />
(reactions 2 and 3 <strong>of</strong> Table 2) allow RNAp to dislodge only one<br />
lacO-bound LacI molecule. Therefore, in the case <strong>of</strong> the double-tetO<br />
systems, all cells are subject to some form <strong>of</strong> transcription initiation<br />
at all times—either normal initiation at a LacI-free promoter<br />
or leaky initiation at a promoter containing its maximum <strong>of</strong> one<br />
bound LacI. The double-lacO systems, on the other hand, possess<br />
states at which initiation is strictly forbidden—namely the state in<br />
which neither operator is free (which accounts for 88.6% <strong>of</strong> cells<br />
in the LTL system, as discussed above). While these double-lacO<br />
designs may still be induced by adding sufficient IPTG, the levels<br />
required are beyond the range that can be employed in the in vivo<br />
work.<br />
Fig. 3 demonstrates that the model captures the experimentally<br />
observed <strong>synthetic</strong> phenotypes. The fit <strong>of</strong> the simulated dynamic<br />
behavior <strong>of</strong> a complex network with more than 60 reactions modeled<br />
stochastically to experimental flow cytometry measurements<br />
is remarkable. The agreement between experimental and simulation<br />
results is quantified in the third column <strong>of</strong> Fig. 3, where the<br />
square <strong>of</strong> the difference between mean observed and simulated<br />
GFP expression is presented. The fit between experimental and simulation<br />
results is worst at conditions <strong>of</strong> low but non-zero aTc and<br />
non-zero IPTG. In this region, the simulations induce more slowly<br />
with increasing aTc than do the experimental results, most likely<br />
due to an inaccuracy in the parameters governing aTc induction.<br />
This is not entirely unexpected, as the kinetic parameters governing<br />
aTc induction are not as well documented as those governing<br />
IPTG induction.<br />
It should also be emphasized that aside from the variation in<br />
the kinetic parameters <strong>of</strong> reactions 2 and 3 <strong>of</strong> Table 2, the models<br />
depicted in Fig. 3 are identical in every other respect. This indicates<br />
that, given a model <strong>of</strong> more than 60 individual reactions, the model<br />
parameter that should depend on promoter configuration is indeed<br />
sufficient to account for the observed variability among the promoter<br />
designs. Since these rates were unavailable in the literature,<br />
they were fit by minimizing the sum-<strong>of</strong>-squares <strong>of</strong> relative expression<br />
levels at 3 conditions: no induction, high aTc/no IPTG, and high<br />
aTc/high IPTG. Shifting lacO 1 location within the hybrid tet–lac promoter<br />
changes the values <strong>of</strong> the kinetic constant for reactions 2 and<br />
3, decreasing these k values with more favorable lacO 1 placement<br />
and consequently improved repression under no IPTG and high aTc<br />
conditions.<br />
The data generated in this study, both simulated and experimentally<br />
observed, ultimately consist <strong>of</strong> quantifications <strong>of</strong> the behavior<br />
<strong>of</strong> individual cells. Although the most straightforward analysis<br />
involves the computation <strong>of</strong> mean values <strong>of</strong> cell fluorescence or GFP<br />
expression level, there is also considerable information contained<br />
in the distributions <strong>of</strong> cell behavior—information that cannot be<br />
obtained through an ordinary differential equation simulation.<br />
For instance, <strong>of</strong> the 6 systems simulated, the highest GFP expression<br />
level <strong>of</strong> any cell at 6 h post-induction was 1015 molecules <strong>of</strong><br />
GFP (for an LTT promoter design with 2 mM IPTG and 100 ng/mL <strong>of</strong><br />
aTc). At the other extreme, zero induction at 6 h, greater than 95%<br />
<strong>of</strong> cells had exactly zero GFP expression for all 6 systems tested. If<br />
one arbitrarily defines the minimum “ON” state to be ∼5% <strong>of</strong> the<br />
absolute maximum GFP expression level – 50 molecules per cell,<br />
with “OFF” = 1 − “ON” – then one can analyze the percentage <strong>of</strong> cells<br />
falling on either side <strong>of</strong> that threshold. This can help determine the<br />
noise-induced states <strong>of</strong> the AND gates.<br />
Even with the most active promoter design, LTT, the model predicts<br />
that only 85% <strong>of</strong> cells are “ON” (>50 molecules <strong>of</strong> GFP) at<br />
conditions <strong>of</strong> 1 mM IPTG and 100 ng/mL <strong>of</strong> aTc at 6 h post-induction,<br />
with 95% <strong>of</strong> cells expressing between 20 and 296 molecules <strong>of</strong> GFP.<br />
On the other hand, the TTL design – the least active <strong>of</strong> the functional
46 K.I. Ramalingam et al. / <strong>Biochemical</strong> <strong>Engineering</strong> <strong>Journal</strong> 47 (2009) 38–47<br />
AND gates – gave only 43% <strong>of</strong> cells in an “OFF” state (at identical conditions)<br />
with 95% <strong>of</strong> cells expressing between 6 and 217 molecules<br />
<strong>of</strong> GFP. Full plots for the simulated fraction <strong>of</strong> cells in an OFF state<br />
at all induction conditions are provided in Fig. 6. One can further<br />
understand the nature <strong>of</strong> the distributions with histograms, as is<br />
done in Figs. 2 and 4 (simulation) or Fig. 5 (experiment).<br />
As with the simulation data, the experimental data can also be<br />
viewed as individual cellular measurements. When one applies the<br />
same criterion for a cell being “ON” – i.e., reaching 5% <strong>of</strong> the absolute<br />
maximum observed fluorescence level at 6 h post-induction – the<br />
results are somewhat different. The real cells, unlike the simulated<br />
ones, tend to induce more uniformly, with 97% <strong>of</strong> LTT systems “ON”<br />
at conditions <strong>of</strong> 1 mM IPTG and 100 ng/mL <strong>of</strong> aTc. As with the simulation,<br />
TTL is less active and fewer cells meet the “ON” criterion –<br />
91% – though this is still a much higher value than the simulations<br />
predict. Therefore, while the model may be able to capture many <strong>of</strong><br />
the relevant trends between promoter designs and provide a quantitative<br />
prediction <strong>of</strong> mean values, there remains work to be done<br />
in predicting the higher moments <strong>of</strong> the distributions.<br />
The mechanistically detailed nature <strong>of</strong> the model employed in<br />
this work also provides the opportunity to investigate the effect <strong>of</strong><br />
changes in kinetic parameters that correspond to those <strong>of</strong> real biochemical<br />
reactions. The generation rates <strong>of</strong> LacI and TetR will be<br />
strain dependent so it may useful to understand how these rates<br />
would affect the behavior <strong>of</strong> the system. We vary the LacI and TetR<br />
concentrations and determine GFP expression levels. Fig. 7 shows<br />
one <strong>of</strong> the resulting sets <strong>of</strong> simulations: a fully induced doubletetO<br />
design—in this case with k 2 and k 3 set to zero. As expected,<br />
GFP expression is low at higher repressor generation rates (upperright)<br />
but high at lower rates (lower-left). The gradient is also much<br />
steeper with increasing TetR than with increasing LacI, reflecting<br />
the tighter binding <strong>of</strong> TetR and the presence <strong>of</strong> two tetO operator<br />
sites rather than one lacO site. The red circle at the top <strong>of</strong> the figure<br />
indicates the rates employed for all other simulations in this study.<br />
These parameters were chosen with the aid <strong>of</strong> similar plots evaluated<br />
for double-lacO systems and zero induction conditions (data<br />
not shown).<br />
The level <strong>of</strong> GFP expression is depicted in Fig. 8 as a function<br />
<strong>of</strong> the leaky transcription initiation rate (at high aTc values), with<br />
lower k 2 and k 3 (i.e., k leak ) values producing gates that express less<br />
GFP overall, but where the amount <strong>of</strong> leaky expression is proportionally<br />
low compared to the level <strong>of</strong> fully induced expression. This<br />
trend correlates with in vivo observation as discussed previously. As<br />
the rate <strong>of</strong> leaky initiation increases, the amount <strong>of</strong> GFP expressed<br />
ceases to have a strong dependence on the presence or absence <strong>of</strong><br />
IPTG, as one might expect. At suitably low and commonly employed<br />
aTc concentrations (example 10 ng/mL), however, all three systems<br />
display AND gate functionality. Interestingly, similar leakiness reactions<br />
were not necessary for the tetracycline operator sites. That<br />
is, the probability <strong>of</strong> RNAp binding and transcribing DNA that is<br />
already bound by TetR is negligible, though this probability is further<br />
reduced by the presence <strong>of</strong> two TetR sites in each <strong>of</strong> the three<br />
functional gates.<br />
While all three double-tetO <strong>synthetic</strong> circuits can be considered<br />
AND gates over some range <strong>of</strong> inducer concentrations, we observe<br />
that knowledge <strong>of</strong> operator placement in the promoter is critical for<br />
optimal AND gate behavior. Since the three promoters represent all<br />
possible placements <strong>of</strong> a single lacO within a three-operator hybrid<br />
promoter, and rates <strong>of</strong> kinetic leakiness have been obtained in each<br />
case, these results foster meaningful predictions for subsequent<br />
work.<br />
In summary, we show how the integration <strong>of</strong> computational<br />
and experimental molecular biology can rationalize the synthesis<br />
<strong>of</strong> novel biological functionalities. We have constructed a biological<br />
AND gate from a simple, <strong>synthetic</strong>-hybrid promoter module.<br />
From a biological perspective, experimental results identify an<br />
effective lacO 1 position where improved repression results due<br />
to weak interaction between RNAp and operator-bound repressor.<br />
We propose that this interaction plays a vital role in transcriptional<br />
regulation as supported by the matching between models<br />
and experiments over a wide range <strong>of</strong> induction conditions, having<br />
taken into account the inherently stochastic behavior <strong>of</strong> the<br />
systems. Reactions 2 and 3 and their kinetic constants quantify this<br />
biological behavior for the first time and should prove useful in constructing<br />
further stochastic kinetic models that involve repression<br />
by LacI.<br />
The models created to study this system predict the system’s<br />
feasibility, quantify the effect <strong>of</strong> operator placement and provide<br />
an understanding <strong>of</strong> the improved AND gate function demonstrated<br />
by TTL. Certainly, there is not one single, direct method <strong>of</strong> conducting<br />
simulations that precisely outlines future experimental designs.<br />
Instead, there is an intimate interplay between simulations and<br />
experiments, where information flows back and forth between both<br />
computational attempts and experimental ones. In this work, the<br />
first models constructed did not include promoter topology dependent<br />
leakiness. Nevertheless, they were useful in demonstrating<br />
that the designs were promising and would likely work as planned.<br />
After the first set <strong>of</strong> experiments, it became clear that reactions<br />
2 and 3 were required, and that different values for the kinetic<br />
parameters would lead to correlation with the designed promoters.<br />
What was gained was insight into the mechanism <strong>of</strong> leakiness<br />
and a model that quantitatively captures it. It is not clear how this<br />
biological insight would be captured with an a posteriori modeling<br />
effort, where minimal models are built to fit observed experimental<br />
data.<br />
In conclusion, we believe that this approach <strong>of</strong> designing and<br />
tailoring logical regulation <strong>of</strong> gene expression can be potentially<br />
extended beyond transcriptional regulation to include other modular<br />
genetic elements, search for more complex network behaviors<br />
and assist in the forward <strong>engineering</strong> <strong>of</strong> other biological circuits.<br />
Acknowledgements<br />
This work was supported by a grant from the National Science<br />
Foundation (BES-0425882, CBET-0425882 and CBET-0644792) and<br />
the University <strong>of</strong> Minnesota Biotechnology Institute. Computational<br />
support from the Minnesota Supercomputing Institute (MSI)<br />
is gratefully acknowledged. This work was also supported by the<br />
National Computational Science Alliance under TG-MCA04N033. In<br />
addition, we would like to thank Jin Cui Tomshine for her preparation<br />
<strong>of</strong> the schematic diagrams in Fig. 1.<br />
Appendix A. Supplementary data<br />
Supplementary data associated with this article can be found, in<br />
the online version, at doi:10.1016/j.bej.2009.06.014.<br />
References<br />
[1] J. Hasty, D. McMillen, J.J. Collins, Engineered gene circuits, Nature 420 (2002)<br />
224–230.<br />
[2] R. McDaniel, R. Weiss, Advances in <strong>synthetic</strong> biology: on the path from prototypes<br />
to applications, Curr. Opin. Biotechnol. 16 (2005) 476–483.<br />
[3] D. Sprinzak, M.B. Elowitz, Reconstruction <strong>of</strong> genetic circuits, Nature 438 (2005)<br />
443–448.<br />
[4] D.A. Drubin, J.C. Way, P.A. Silver, Designing biological systems, Genes Dev. 21<br />
(2007) 242–254.<br />
[5] A. Becskei, L. Serrano, <strong>Engineering</strong> stability in gene networks by autoregulation,<br />
Nature 405 (2000) 590–593.<br />
[6] T.S. Gardner, C.R. Cantor, J.J. Collins, Construction <strong>of</strong> a genetic toggle switch in<br />
Escherichia coli, Nature 403 (2000) 339–342.<br />
[7] M.R. Atkinson, M.A. Savageau, J.T. Myers, A.J. Ninfa, Development <strong>of</strong> genetic<br />
circuitry exhibiting toggle switch or oscillatory behavior in Escherichia coli, Cell<br />
113 (2003) 597–607.
K.I. Ramalingam et al. / <strong>Biochemical</strong> <strong>Engineering</strong> <strong>Journal</strong> 47 (2009) 38–47 47<br />
[8] B.P. Kramer, A.U. Viretta, M. Daoud-El-Baba, D. Aubel, W. Weber, M. Fussenegger,<br />
An engineered epigenetic transgene switch in mammalian cells, Nat. Biotechnol.<br />
22 (2004) 867–870.<br />
[9] M.B. Elowitz, S. Leibler, A <strong>synthetic</strong> oscillatory network <strong>of</strong> transcriptional regulators,<br />
Nature 403 (2000) 335–338.<br />
[10] C.C. Guet, M.B. Elowitz, W. Hsing, S. Leibler, Combinatorial synthesis <strong>of</strong> genetic<br />
networks, Science 296 (2002) 1466–1470.<br />
[11] Y. Yokobayashi, R. Weiss, F.H. Arnold, Directed evolution <strong>of</strong> a genetic circuit,<br />
Proc. Natl. Acad. Sci. USA 99 (2002) 16587–16591.<br />
[12] Y. Setty, A.E. Mayo, M.G. Surette, U. Alon, Detailed map <strong>of</strong> a cis-regulatory input<br />
function, Proc. Natl. Acad. Sci. USA 100 (2003) 7702–7707.<br />
[13] H. Kobayashi, M. Kaern, M. Araki, K. Chung, T.S. Gardner, C.R. Cantor, J.J. Collins,<br />
Programmable cells: interfacing natural and engineered gene networks, Proc.<br />
Natl. Acad. Sci. USA 101 (2004) 8414–8419.<br />
[14] B.P. Kramer, C. Fischer, M. Fussenegger, BioLogic gates enable logical transcription<br />
control in mammalian cells, Biotechnol. Bioeng. 87 (2004) 478–484.<br />
[15] O. Rackham, J.W. Chin, Cellular logic with orthogonal ribosomes, J. Am. Chem.<br />
Soc. 127 (2005) 17584–17585.<br />
[16] A.E. Mayo, Y. Setty, S. Shavit, A. Zaslaver, U. Alon, Plasticity <strong>of</strong> the cis-regulatory<br />
input function <strong>of</strong> a gene, PLoS Biol. 4 (2006) e45.<br />
[17] J.C. Anderson, C.A. Voigt, A.P. Arkin, Environmental signal integration by a modular<br />
AND gate, Mol. Syst. Biol. 3 (2007) 133.<br />
[18] H. Salis, Y. Kaznessis, Accurate hybrid stochastic simulation <strong>of</strong> a system <strong>of</strong> coupled<br />
chemical or biochemical reactions, J. Chem. Phys. 122 (2005) 54103.<br />
[19] L. Tuttle, H. Salis, J. Tomshine, Y.N. Kaznessis, Model-driven designs <strong>of</strong> an oscillating<br />
gene network, Biophys. J. 89 (6) (2005) 3873–3883.<br />
[20] H. Salis, V. Sotiropoulos, Y.N. Kaznessis, Multiscale Hy3S: hybrid stochastic simulation<br />
for supercomputers, BMC Bioinform. 7 (2006) 93.<br />
[21] J. Tomshine, Y.N. Kaznessis, Optimization <strong>of</strong> a stochastically simulated gene<br />
network model via simulated annealing, Biophys. J. 91 (2006) 3196–3205.<br />
[22] V. Sotiropoulos, Y.N. Kaznessis, An adaptive time step scheme for a system <strong>of</strong><br />
stochastic differential equations with multiple multiplicative noise: chemical<br />
Langevin equation, a pro<strong>of</strong> <strong>of</strong> concept, J. Chem. Phys. 128 (2008) 014103.<br />
[23] M.C. O’Neill, Escherichia coli promoters, J. Biol. Chem. 264 (1989) 5522–<br />
5530.<br />
[24] M. Lanzer, H. Bujard, Promoters largely determine the efficiency <strong>of</strong> repressor<br />
action, Proc. Natl. Acad. Sci. USA 85 (1988) 8973–8977.<br />
[25] R.S. Cox, M.G. Surette, M.B. Elowitz, Programming gene expression with combinatorial<br />
promoters, Mol. Syst. Biol. 3 (2007) 145.<br />
[26] R. Lutz, H. Bujard, Independent and tight regulation <strong>of</strong> transcriptional units in<br />
Escherichia coli via the LacR/O, the TetR/O and AraC/I1-I2 regulatory elements,<br />
Nucleic Acids Res. 25 (1997) 1203–1210.<br />
[27] H. Salis, Y.N. Kaznessis, Computer-aided design <strong>of</strong> modular protein devices:<br />
Boolean AND gene activation, Phys. Biol. 3 (2006) 295–310.<br />
[28] V. Sotiropoulos, Y.N. Kaznessis, Synthetic tetracycline-inducible regulatory networks:<br />
computer-aided design <strong>of</strong> dynamic phenotypes, BMC Syst. Biol. 1 (2007)<br />
7.<br />
[29] A. Revzin, P.H. von Hippel, Direct measurement <strong>of</strong> association constants for the<br />
binding <strong>of</strong> Escherichia coli lac repressor to non-operator DNA, Biochemistry 16<br />
(1977) 4769–4776.<br />
[30] M. Dunaway, J.S. Olson, J.M. Rosenberg, O.B. Kallai, R.E. Dickerson, K.S.<br />
Matthews, Kinetic studies <strong>of</strong> inducer binding to lac repressor.operator complex,<br />
J. Biol. Chem. 255 (1980) 10115–10119.<br />
[31] T. Lederer, M. Takahashi, W. Hillen, Thermodynamic analysis <strong>of</strong> tetracyclinemediated<br />
induction <strong>of</strong> Tet repressor by a quantitative methylation protection<br />
assay, Anal. Biochem. 232 (1995) 190–196.<br />
[32] T. Lederer, M. Kintrup, M. Takahashi, P.E. Sum, G.A. Ellestad, W. Hillen, Tetracycline<br />
analogs affecting binding to Tn10-Encoded Tet repressor trigger the same<br />
mechanism <strong>of</strong> induction, Biochemistry 35 (1996) 7439–7446.<br />
[33] A. Arkin, J. Ross, H.H. McAdams, Stochastic kinetic analysis <strong>of</strong> developmental<br />
pathway bifurcation in phage lambda-infected Escherichia coli cells, Genetics<br />
149 (1998) 1633–1648.<br />
[34] P.L. deHaseth, M.L. Zupancic, M.T. Record Jr., RNA polymerase-promoter interactions:<br />
the comings and goings <strong>of</strong> RNA polymerase, J. Bacteriol. 180 (1998)<br />
3019–3025.<br />
[35] M. Raffaelle, E.I. Kanin, J. Vogt, R.R. Burgess, A.Z. Ansari, Holoenzyme switching<br />
and stochastic release <strong>of</strong> sigma factors from RNA polymerase in vivo, Mol. Cell.<br />
20 (2005) 357–366.<br />
[36] Y.N. Kaznessis, Models for <strong>synthetic</strong> biology, BMC Syst. Biol. 1 (2007) 47.<br />
[37] A.D. Hill, J.R. Tomshine, E.M. Weeding, V. Sotiropoulos, Y.N. Kaznessis, SynBioSS:<br />
the <strong>synthetic</strong> biology modeling suite, Bioinformatics 24 (2008) 2551–2553.<br />
[38] H. Salis, Y. Kaznessis, Numerical simulation <strong>of</strong> stochastic gene circuits, Comput.<br />
Chem. Eng. 29 (2005) 577–588.<br />
[39] M.B. Elowitz, A.J. Levine, E.D. Siggia, P.S. Swain, Stochastic gene expression in a<br />
single cell, Science 297 (2002) 1183–1186.<br />
[40] H. Alper, C. Fischer, E. Nevoigt, G. Stephanopoulos, Tuning genetic control<br />
through promoter <strong>engineering</strong>, Proc. Natl. Acad. Sci. USA 102 (2005)<br />
12678–12683.