Dynamic properties in aluminum filled PMMA
Dynamic properties in aluminum filled PMMA
Dynamic properties in aluminum filled PMMA

Create successful ePaper yourself
Turn your PDF publications into a flip-book with our unique Google optimized e-Paper software.
1496 S. Cerveny et al./Polymer 40 (1999) 1495–1500<br />
stirred and mixed well. The solution was cast <strong>in</strong> a mold. The<br />
specimen was put <strong>in</strong>to a dry<strong>in</strong>g chamber <strong>in</strong> order to make<br />
the solvent evaporation slow enough to avoid the bubbles<br />
from appear<strong>in</strong>g <strong>in</strong> the material [9]. The dimension of the<br />
composite sheet was 120 mm 120 mm 4mm.<br />
Samples with volume fractions of filler (f) of 0, 0.03,<br />
0.10, 0.15, 0.20 and 0.30 were prepared.<br />
In order to characterize the molecular weight distribution<br />
of the matrix and the commercial <strong>PMMA</strong> used <strong>in</strong> the fabrication,<br />
gel permeation chromatograms (GPC) of <strong>PMMA</strong><br />
were obta<strong>in</strong>ed by us<strong>in</strong>g a Shimadzu L-6A liquid chromatogram<br />
system with a RID-6A refractive <strong>in</strong>dex detector and a<br />
Shimpack GPC 802-803-804-805-807 as the columns at<br />
303 K. THF was used as the eluate. The measured values<br />
of number and weight average molecular weight were M n ¼<br />
809.900 g mol ¹1 , M w ¼ 2.212.613 g mol ¹1 , and M n ¼<br />
576.700 g mol ¹1 , M w ¼ 1.591.500 g mol ¹1 for the commercial<br />
and fabricated <strong>PMMA</strong> respectively.<br />
NMR measurement on the commercial and fabricated<br />
<strong>PMMA</strong> were made. The 1 H spectra of the samples was<br />
recorded on a Bruker AC-200 spectrometer us<strong>in</strong>g ca. 7%<br />
(w/v) solution <strong>in</strong> chloroform at 300 K.<br />
The distribution of particles and the agglomeration size<br />
were determ<strong>in</strong>ed by us<strong>in</strong>g a scann<strong>in</strong>g electron microscope<br />
Philips type PW 6700/01.<br />
2.2. Mechanical tests<br />
The <strong>in</strong>ternal friction, IF, and shear storage modulus, G,<br />
were measured with an automated damped torsion pendulum<br />
<strong>in</strong> Ar atmosphere at 40 Torr between 200 and 375 K<br />
with a temperature ramp of 0.4 K m<strong>in</strong> ¹1 . This pendulum is<br />
completely <strong>in</strong>strumented both <strong>in</strong> its control and data acquisition<br />
systems, and it is commanded by a PC-AT [10]. The<br />
maximum shear stra<strong>in</strong> <strong>in</strong> the dynamic measurements was<br />
always less than 10 ¹5 , thus ensur<strong>in</strong>g l<strong>in</strong>ear viscoelastic<br />
behavior. Samples were cut <strong>in</strong>to strips of 40 mm 3mm<br />
from the central part of the composite sheet. The f<strong>in</strong>al thickness<br />
was obta<strong>in</strong>ed (2 mm) by polish<strong>in</strong>g with alum<strong>in</strong>a powder.<br />
The dimensions of the samples were accord<strong>in</strong>g to<br />
ASTM D 4065.<br />
3. Results<br />
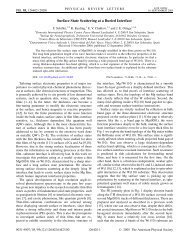
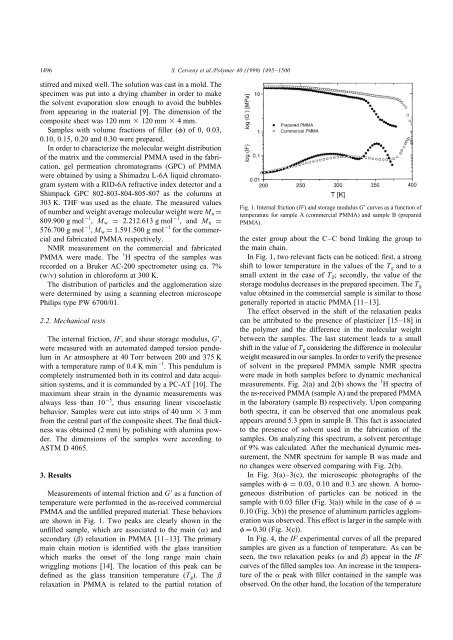
Measurements of <strong>in</strong>ternal friction and G as a function of<br />
temperature were performed <strong>in</strong> the as-received commercial<br />
<strong>PMMA</strong> and the un<strong>filled</strong> prepared material. These behaviors<br />
are shown <strong>in</strong> Fig. 1. Two peaks are clearly shown <strong>in</strong> the<br />
un<strong>filled</strong> sample, which are associated to the ma<strong>in</strong> (a) and<br />
secondary (b) relaxation <strong>in</strong> <strong>PMMA</strong> [11–13]. The primary<br />
ma<strong>in</strong> cha<strong>in</strong> motion is identified with the glass transition<br />
which marks the onset of the long range ma<strong>in</strong> cha<strong>in</strong><br />
wriggl<strong>in</strong>g motions [14]. The location of this peak can be<br />
def<strong>in</strong>ed as the glass transition temperature (T g ). The b<br />
relaxation <strong>in</strong> <strong>PMMA</strong> is related to the partial rotation of<br />
Fig. 1. Internal friction (IF) and storage modulus G curves as a function of<br />
temperature for sample A (commercial <strong>PMMA</strong>) and sample B (prepared<br />
<strong>PMMA</strong>).<br />
the ester group about the C–C bond l<strong>in</strong>k<strong>in</strong>g the group to<br />
the ma<strong>in</strong> cha<strong>in</strong>.<br />
In Fig. 1, two relevant facts can be noticed: first, a strong<br />
shift to lower temperature <strong>in</strong> the values of the T g and to a<br />
small extent <strong>in</strong> the case of T b ; secondly, the value of the<br />
storage modulus decreases <strong>in</strong> the prepared specimen. The T g<br />
value obta<strong>in</strong>ed <strong>in</strong> the commercial sample is similar to those<br />
generally reported <strong>in</strong> atactic <strong>PMMA</strong> [11–13].<br />
The effect observed <strong>in</strong> the shift of the relaxation peaks<br />
can be attributed to the presence of plasticizer [15–18] <strong>in</strong><br />
the polymer and the difference <strong>in</strong> the molecular weight<br />
between the samples. The last statement leads to a small<br />
shift <strong>in</strong> the value of T g consider<strong>in</strong>g the difference <strong>in</strong> molecular<br />
weight measured <strong>in</strong> our samples. In order to verify the presence<br />
of solvent <strong>in</strong> the prepared <strong>PMMA</strong> sample NMR spectra<br />
were made <strong>in</strong> both samples before to dynamic mechanical<br />
measurements. Fig. 2(a) and 2(b) shows the 1 H spectra of<br />
the as-received <strong>PMMA</strong> (sample A) and the prepared <strong>PMMA</strong><br />
<strong>in</strong> the laboratory (sample B) respectively. Upon compar<strong>in</strong>g<br />
both spectra, it can be observed that one anomalous peak<br />
appears around 5.3 ppm <strong>in</strong> sample B. This fact is associated<br />
to the presence of solvent used <strong>in</strong> the fabrication of the<br />
samples. On analyz<strong>in</strong>g this spectrum, a solvent percentage<br />
of 9% was calculated. After the mechanical dynamic measurement,<br />
the NMR spectrum for sample B was made and<br />
no changes were observed compar<strong>in</strong>g with Fig. 2(b).<br />
In Fig. 3(a)–3(c), the microscopic photographs of the<br />
samples with f ¼ 0.03, 0.10 and 0.3 are shown. A homogeneous<br />
distribution of particles can be noticed <strong>in</strong> the<br />
sample with 0.03 filler (Fig. 3(a)) while <strong>in</strong> the case of f ¼<br />
0.10 (Fig. 3(b)) the presence of alum<strong>in</strong>um particles agglomeration<br />
was observed. This effect is larger <strong>in</strong> the sample with<br />
f ¼ 0:30 (Fig. 3(c)).<br />
In Fig. 4, the IF experimental curves of all the prepared<br />
samples are given as a function of temperature. As can be<br />
seen, the two relaxation peaks (a and b) appear <strong>in</strong> the IF<br />
curves of the <strong>filled</strong> samples too. An <strong>in</strong>crease <strong>in</strong> the temperature<br />
of the a peak with filler conta<strong>in</strong>ed <strong>in</strong> the sample was<br />
observed. On the other hand, the location of the temperature