Dynamic properties in aluminum filled PMMA
Dynamic properties in aluminum filled PMMA
Dynamic properties in aluminum filled PMMA

You also want an ePaper? Increase the reach of your titles
YUMPU automatically turns print PDFs into web optimized ePapers that Google loves.
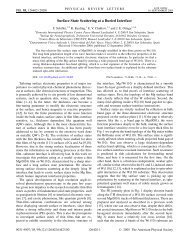
Polymer 40 (1999) 1495–1500<br />
<strong>Dynamic</strong> <strong>properties</strong> <strong>in</strong> alum<strong>in</strong>um <strong>filled</strong> <strong>PMMA</strong><br />
S. Cerveny a, *, S.N. Goyanes a , A.J. Marzocca a , G.H. Rubiolo a,b<br />
a Departamento de Física, FCEN, University of Buenos Aires, Cdad. Universitaria, Pab. I, 1428 Buenos Aires, Argent<strong>in</strong>a<br />
b Departamento de Materiales, CNEA, Av. del Libertador 8250, 1424 Buenos Aires, Argent<strong>in</strong>a<br />
Received 17 October 1997; revised 24 April 1998; accepted 7 May 1998<br />
Abstract<br />
The dynamic mechanical <strong>properties</strong> of polymethyl methacrylate re<strong>in</strong>forced with different amounts of alum<strong>in</strong>um filler were <strong>in</strong>vestigated.<br />
The <strong>in</strong>ternal friction and the shear storage modulus were measured with an automated damped torsional pendulum <strong>in</strong> the temperature range<br />
between 200 and 375 K <strong>in</strong> an argon atmosphere. An <strong>in</strong>crease <strong>in</strong> the glass transition temperature occurred at higher filler contents. The amount<br />
of filler <strong>in</strong> the matrix seems to modify the b relaxation of the composite. The dynamic modulus <strong>in</strong>creases with the alum<strong>in</strong>um percentages for<br />
low filler content. These results were expla<strong>in</strong>ed <strong>in</strong> terms of a model presented <strong>in</strong> the literature for the elastic modulus. 1998 Elsevier<br />
Science Ltd. All rights reserved.<br />
Keywords: <strong>Dynamic</strong> mechanical <strong>properties</strong>; Filled <strong>PMMA</strong>; Ma<strong>in</strong> and secondary relaxation<br />
1. Introduction<br />
In recent years, the conductive polymer field has<br />
<strong>in</strong>creased. One of the methods used to atta<strong>in</strong> these materials<br />
is add<strong>in</strong>g rather large amounts of a conductive filler <strong>in</strong> a<br />
polymer matrix [1,2]. This k<strong>in</strong>d of material was prepared<br />
by Yang and Schruben [2] who <strong>in</strong>vestigated several metal<br />
<strong>filled</strong> composites made of polymethyl methacrylate<br />
(<strong>PMMA</strong>) with alum<strong>in</strong>um and nickel powder.<br />
Besides the importance from the po<strong>in</strong>t of view of electrical<br />
<strong>properties</strong>, it is <strong>in</strong>terest<strong>in</strong>g to analyze this class of<br />
material <strong>in</strong> terms of its dynamic mechanical <strong>properties</strong>. As<br />
it is known, the mechanical <strong>properties</strong> depended on the type,<br />
concentration, size, and shape of the filler. Other important<br />
factors that affect the mechanical behavior of <strong>filled</strong> systems<br />
are the strength of the adhesive bond between different<br />
phases, the type of dispersion and the k<strong>in</strong>d of agglomeration.<br />
Several researchers studied different mechanical <strong>properties</strong><br />
of metal filler composite but the <strong>in</strong>terest was focused<br />
ma<strong>in</strong>ly on tensile <strong>properties</strong> [3–6]. Us<strong>in</strong>g a method analogous<br />
to the theory of the dependence of Young’s modulus of<br />
the composites with the filler content [4,7,8], a relationship<br />
for the dynamic modulus can be given as<br />
G c<br />
G ¼ (1 þ kf) (1)<br />
p<br />
* Correspond<strong>in</strong>g author. Tel: 782-1007; Fax: 782-7647; E-mail:<br />
lpmuba@df.uba.ar<br />
where G c and G p are the dynamic modulus of the composite<br />
and the polymer matrix respectively, f is the volume fraction<br />
of filler and k is an adhesion factor. k ¼ 2.5 represents<br />
perfect adhesion between the filler and the polymer matrix<br />
while k ¼ 1 <strong>in</strong>dicates a weak adhesion [4]. G* is calculated<br />
as G ¼<br />
p<br />
G 2 þ G 2 with G and G the shear storage and<br />
shear loss modulus, respectively. The loss tangent or <strong>in</strong>ternal<br />
friction is def<strong>in</strong>ed as the ratio between G and G, i.e.<br />
IF ¼ tand ¼ G<br />
(2)<br />
G<br />
The objective of this paper is to study the dynamic <strong>properties</strong><br />
of a composite made of <strong>PMMA</strong> with several contents of<br />
alum<strong>in</strong>um powder and to analyze its associated relaxation <strong>in</strong><br />
the range of temperatures between 200 and 375 K.<br />
2. Experimental procedure<br />
2.1. Materials<br />
The material used <strong>in</strong> this <strong>in</strong>vestigation was <strong>PMMA</strong> as a<br />
matrix and alum<strong>in</strong>um powder of a mean diameter between<br />
10 mm and 40 mm. Alum<strong>in</strong>um powder was pre-dried <strong>in</strong>to<br />
vacuum chamber at 393 K dur<strong>in</strong>g 1 h before <strong>in</strong>corporation<br />
<strong>in</strong>to <strong>PMMA</strong> matrix. Test samples were prepared by dissolv<strong>in</strong>g<br />
the polymer us<strong>in</strong>g 350 ml of methylene chloride as a<br />
solvent for each 70 g of solid <strong>PMMA</strong>. Then, certa<strong>in</strong><br />
amounts of alum<strong>in</strong>um powder were added to the solution,<br />
0032-3861/98/$ - see front matter 1998 Elsevier Science Ltd. All rights reserved.<br />
PII: S0032-3861(98)00361-9
1496 S. Cerveny et al./Polymer 40 (1999) 1495–1500<br />
stirred and mixed well. The solution was cast <strong>in</strong> a mold. The<br />
specimen was put <strong>in</strong>to a dry<strong>in</strong>g chamber <strong>in</strong> order to make<br />
the solvent evaporation slow enough to avoid the bubbles<br />
from appear<strong>in</strong>g <strong>in</strong> the material [9]. The dimension of the<br />
composite sheet was 120 mm 120 mm 4mm.<br />
Samples with volume fractions of filler (f) of 0, 0.03,<br />
0.10, 0.15, 0.20 and 0.30 were prepared.<br />
In order to characterize the molecular weight distribution<br />
of the matrix and the commercial <strong>PMMA</strong> used <strong>in</strong> the fabrication,<br />
gel permeation chromatograms (GPC) of <strong>PMMA</strong><br />
were obta<strong>in</strong>ed by us<strong>in</strong>g a Shimadzu L-6A liquid chromatogram<br />
system with a RID-6A refractive <strong>in</strong>dex detector and a<br />
Shimpack GPC 802-803-804-805-807 as the columns at<br />
303 K. THF was used as the eluate. The measured values<br />
of number and weight average molecular weight were M n ¼<br />
809.900 g mol ¹1 , M w ¼ 2.212.613 g mol ¹1 , and M n ¼<br />
576.700 g mol ¹1 , M w ¼ 1.591.500 g mol ¹1 for the commercial<br />
and fabricated <strong>PMMA</strong> respectively.<br />
NMR measurement on the commercial and fabricated<br />
<strong>PMMA</strong> were made. The 1 H spectra of the samples was<br />
recorded on a Bruker AC-200 spectrometer us<strong>in</strong>g ca. 7%<br />
(w/v) solution <strong>in</strong> chloroform at 300 K.<br />
The distribution of particles and the agglomeration size<br />
were determ<strong>in</strong>ed by us<strong>in</strong>g a scann<strong>in</strong>g electron microscope<br />
Philips type PW 6700/01.<br />
2.2. Mechanical tests<br />
The <strong>in</strong>ternal friction, IF, and shear storage modulus, G,<br />
were measured with an automated damped torsion pendulum<br />
<strong>in</strong> Ar atmosphere at 40 Torr between 200 and 375 K<br />
with a temperature ramp of 0.4 K m<strong>in</strong> ¹1 . This pendulum is<br />
completely <strong>in</strong>strumented both <strong>in</strong> its control and data acquisition<br />
systems, and it is commanded by a PC-AT [10]. The<br />
maximum shear stra<strong>in</strong> <strong>in</strong> the dynamic measurements was<br />
always less than 10 ¹5 , thus ensur<strong>in</strong>g l<strong>in</strong>ear viscoelastic<br />
behavior. Samples were cut <strong>in</strong>to strips of 40 mm 3mm<br />
from the central part of the composite sheet. The f<strong>in</strong>al thickness<br />
was obta<strong>in</strong>ed (2 mm) by polish<strong>in</strong>g with alum<strong>in</strong>a powder.<br />
The dimensions of the samples were accord<strong>in</strong>g to<br />
ASTM D 4065.<br />
3. Results<br />
Measurements of <strong>in</strong>ternal friction and G as a function of<br />
temperature were performed <strong>in</strong> the as-received commercial<br />
<strong>PMMA</strong> and the un<strong>filled</strong> prepared material. These behaviors<br />
are shown <strong>in</strong> Fig. 1. Two peaks are clearly shown <strong>in</strong> the<br />
un<strong>filled</strong> sample, which are associated to the ma<strong>in</strong> (a) and<br />
secondary (b) relaxation <strong>in</strong> <strong>PMMA</strong> [11–13]. The primary<br />
ma<strong>in</strong> cha<strong>in</strong> motion is identified with the glass transition<br />
which marks the onset of the long range ma<strong>in</strong> cha<strong>in</strong><br />
wriggl<strong>in</strong>g motions [14]. The location of this peak can be<br />
def<strong>in</strong>ed as the glass transition temperature (T g ). The b<br />
relaxation <strong>in</strong> <strong>PMMA</strong> is related to the partial rotation of<br />
Fig. 1. Internal friction (IF) and storage modulus G curves as a function of<br />
temperature for sample A (commercial <strong>PMMA</strong>) and sample B (prepared<br />
<strong>PMMA</strong>).<br />
the ester group about the C–C bond l<strong>in</strong>k<strong>in</strong>g the group to<br />
the ma<strong>in</strong> cha<strong>in</strong>.<br />
In Fig. 1, two relevant facts can be noticed: first, a strong<br />
shift to lower temperature <strong>in</strong> the values of the T g and to a<br />
small extent <strong>in</strong> the case of T b ; secondly, the value of the<br />
storage modulus decreases <strong>in</strong> the prepared specimen. The T g<br />
value obta<strong>in</strong>ed <strong>in</strong> the commercial sample is similar to those<br />
generally reported <strong>in</strong> atactic <strong>PMMA</strong> [11–13].<br />
The effect observed <strong>in</strong> the shift of the relaxation peaks<br />
can be attributed to the presence of plasticizer [15–18] <strong>in</strong><br />
the polymer and the difference <strong>in</strong> the molecular weight<br />
between the samples. The last statement leads to a small<br />
shift <strong>in</strong> the value of T g consider<strong>in</strong>g the difference <strong>in</strong> molecular<br />
weight measured <strong>in</strong> our samples. In order to verify the presence<br />
of solvent <strong>in</strong> the prepared <strong>PMMA</strong> sample NMR spectra<br />
were made <strong>in</strong> both samples before to dynamic mechanical<br />
measurements. Fig. 2(a) and 2(b) shows the 1 H spectra of<br />
the as-received <strong>PMMA</strong> (sample A) and the prepared <strong>PMMA</strong><br />
<strong>in</strong> the laboratory (sample B) respectively. Upon compar<strong>in</strong>g<br />
both spectra, it can be observed that one anomalous peak<br />
appears around 5.3 ppm <strong>in</strong> sample B. This fact is associated<br />
to the presence of solvent used <strong>in</strong> the fabrication of the<br />
samples. On analyz<strong>in</strong>g this spectrum, a solvent percentage<br />
of 9% was calculated. After the mechanical dynamic measurement,<br />
the NMR spectrum for sample B was made and<br />
no changes were observed compar<strong>in</strong>g with Fig. 2(b).<br />
In Fig. 3(a)–3(c), the microscopic photographs of the<br />
samples with f ¼ 0.03, 0.10 and 0.3 are shown. A homogeneous<br />
distribution of particles can be noticed <strong>in</strong> the<br />
sample with 0.03 filler (Fig. 3(a)) while <strong>in</strong> the case of f ¼<br />
0.10 (Fig. 3(b)) the presence of alum<strong>in</strong>um particles agglomeration<br />
was observed. This effect is larger <strong>in</strong> the sample with<br />
f ¼ 0:30 (Fig. 3(c)).<br />
In Fig. 4, the IF experimental curves of all the prepared<br />
samples are given as a function of temperature. As can be<br />
seen, the two relaxation peaks (a and b) appear <strong>in</strong> the IF<br />
curves of the <strong>filled</strong> samples too. An <strong>in</strong>crease <strong>in</strong> the temperature<br />
of the a peak with filler conta<strong>in</strong>ed <strong>in</strong> the sample was<br />
observed. On the other hand, the location of the temperature
S. Cerveny et al./Polymer 40 (1999) 1499–1500<br />
1497<br />
Fig. 2. 1 H spectra of <strong>PMMA</strong> at 300 K: (a) commercial, (b) fabricated.<br />
of the b peak (T b ) <strong>in</strong> all the analyzed samples seemed to<br />
rema<strong>in</strong> at the same temperature, <strong>in</strong>dependent of the percentage<br />
of filler <strong>in</strong> the composite.<br />
Fig. 5 shows the dependence of G* with volume fraction<br />
of filler at three different temperatures. It is <strong>in</strong>terest<strong>in</strong>g to<br />
note that the behavior of G* is similar <strong>in</strong> every case.<br />
Furthermore, an <strong>in</strong>crease <strong>in</strong> the value of G* can be noted<br />
to reach a maximum value at f ¼ 0.15 after which this value<br />
drops.<br />
4. Discussion<br />
The curves of Fig. 4 can be adjusted by the contribution of<br />
two Gaussian curves. Then it is easy to obta<strong>in</strong> the temperature<br />
of each peak. The T g and T b values are shown <strong>in</strong> Table 1,<br />
where it can be appreciated that the T g value <strong>in</strong>creases with<br />
the percentage of alum<strong>in</strong>um powder. This result is <strong>in</strong><br />
good agreement with those usually reported <strong>in</strong> the literature<br />
[19–21] for particle–polymer matrix compounds.
1498 S. Cerveny et al./Polymer 40 (1999) 1495–1500<br />
Fig. 2. cont<strong>in</strong>ued<br />
An <strong>in</strong>terest<strong>in</strong>g po<strong>in</strong>t to be discussed refers to the filler<br />
percentage dependence of the b relaxation temperature. In<br />
Table 1 it can be seen that T b is not related to f. Accord<strong>in</strong>g<br />
to Heijboer [13], the location of the b maximum <strong>in</strong> <strong>PMMA</strong><br />
is determ<strong>in</strong>ed by the local <strong>in</strong>tramolecular barrier. The fact<br />
that this temperature does not change with the alum<strong>in</strong>um<br />
percentage leads us to the idea that the <strong>in</strong>tramolecular barrier<br />
could not be affected by the filler. However it must be<br />
mentioned that modifications <strong>in</strong> the <strong>in</strong>tensity of the b peak<br />
can be observed <strong>in</strong> Fig. 4.<br />
As is known, the b relaxation <strong>in</strong> <strong>PMMA</strong> is associated with<br />
the partial rotation of the ester group (COOCH 3 ) about the<br />
C–C bond l<strong>in</strong>k<strong>in</strong>g of the ma<strong>in</strong> cha<strong>in</strong> [13], and the <strong>in</strong>tensity<br />
of this relaxation depends on the number of lateral groups<br />
for which the rotation is possible.<br />
The <strong>in</strong>tensity of the b relaxation, I b , is <strong>in</strong>fluenced by the a
S. Cerveny et al./Polymer 40 (1999) 1499–1500<br />
1499<br />
Fig. 4. Internal friction (IF) curves obta<strong>in</strong>ed from the free oscillation test.<br />
Curves are shifted along the y axis by 0.1 per each level of f, beg<strong>in</strong>n<strong>in</strong>g at<br />
f ¼ 0.<br />
decrease <strong>in</strong> the contribution of this <strong>in</strong>tensity to the IF of<br />
the compound at higher volume fraction of filler.<br />
We believe that the decrease <strong>in</strong> the <strong>in</strong>tensity of the b<br />
relaxation at higher level of filler is due to the change <strong>in</strong><br />
the polymer volume fraction <strong>in</strong>stead of a physical bond<strong>in</strong>g<br />
<strong>in</strong>teraction between the ester group and the Al filler surface.<br />
The dependence of the dynamic modulus with f, shown<br />
<strong>in</strong> Fig. 5, is very close to that measured by Tavman [4] <strong>in</strong> a<br />
composite of polyethylene <strong>filled</strong> with alum<strong>in</strong>um powder.<br />
This author observed a change <strong>in</strong> the behavior of the<br />
Young’s modulus for a 0.15 volume fraction of alum<strong>in</strong>um.<br />
Our results, for low volume fraction of alum<strong>in</strong>um<br />
particles (up to about 0.15), can be fit by E<strong>in</strong>ste<strong>in</strong>’s equation<br />
consider<strong>in</strong>g k ¼ 1.54. This value is an <strong>in</strong>termediate<br />
Fig. 3. Scann<strong>in</strong>g electron micrographs of alum<strong>in</strong>um filler composite for<br />
three different volume fraction of filler. (a) f ¼ 0.03, (b) f ¼ 0.10 (c)<br />
f ¼ 0:3. Magnification, 100 . Scale bar, 100 mm.<br />
transition and the IF background. Then, <strong>in</strong> order to obta<strong>in</strong><br />
the value of I b it is necessary to subtract the two effects<br />
mentioned previously. Therefore, the I b value was determ<strong>in</strong>ed<br />
as the <strong>in</strong>tegrate of the curve result<strong>in</strong>g from the subtraction<br />
of a basel<strong>in</strong>e to the measured IF curve. This<br />
basel<strong>in</strong>e was taken between the beg<strong>in</strong>n<strong>in</strong>g of b and a transitions.<br />
The <strong>in</strong>tensity of b relaxation is shown as a function of<br />
the filler volume fraction <strong>in</strong> Fig. 6. There is an evident<br />
Fig. 5. Dependence of G with the volume fraction of filler at three different<br />
temperatures.
1500 S. Cerveny et al./Polymer 40 (1999) 1495–1500<br />
not modified <strong>in</strong> the range of filler content used <strong>in</strong> our<br />
experiences. However, the <strong>in</strong>tensity of the b relaxation<br />
shows an important fall as the filler content <strong>in</strong>creases.<br />
F<strong>in</strong>ally, the dynamic modulus <strong>in</strong>creases up to 0.15<br />
volume content of alum<strong>in</strong>um particles. An estimation of<br />
the matrix filler adhesion level coefficient was calculated<br />
us<strong>in</strong>g E<strong>in</strong>ste<strong>in</strong>’s equation.<br />
Acknowledgements<br />
This work was supported by the University of Buenos<br />
Aires, Argent<strong>in</strong>a, UBACYT EX-286 and EX-296.<br />
Fig. 6. Dependence of the <strong>in</strong>tensity of the IF at the b peak with the volume<br />
fraction of filler normalized to the <strong>in</strong>tensity for the un<strong>filled</strong> sample (I b0 ).<br />
Table 1<br />
Variation of T g and T b with the volume fraction of filler, f<br />
f T g (K) T b (K)<br />
0 352.5 291.0<br />
0.03 352.5 292.0<br />
0.10 352.2 291.0<br />
0.15 354.9 293.7<br />
0.20 357.0 290.1<br />
0.30 358.6 290.1<br />
condition between perfect adhesion, k ¼ 2.5, and weak<br />
adhesion k ¼ 1.<br />
F<strong>in</strong>ally, it is <strong>in</strong>terest<strong>in</strong>g to note that, for f 0.15,<br />
E<strong>in</strong>ste<strong>in</strong>’s model does not fit our results. In this situation,<br />
the particles beg<strong>in</strong> to form aggregates <strong>in</strong> the composite. This<br />
was revealed by the microscopic studies (Fig. 3). The bond<br />
between the filler particles is not as strong as that between<br />
the matrix and the particles. By the application of a shear<br />
stress, voids can be formed which expla<strong>in</strong>s the decrease of<br />
the dynamic modulus of high particle content.<br />
5. Conclusions<br />
In this paper, dynamic mechanical <strong>properties</strong> of <strong>PMMA</strong><br />
<strong>filled</strong> with alum<strong>in</strong>um powder were studied. An <strong>in</strong>crease <strong>in</strong><br />
the value of T g was obta<strong>in</strong>ed for volume fraction of filler<br />
higher than 0.15. The behavior of the b peak temperature is<br />
References<br />
[1] Agari Y, Uno T. J Appl Polym Sci 1986;32:5705.<br />
[2] Yang L, Schruben DL. Polym Eng Sci 1994;34(14):1109.<br />
[3] Ak<strong>in</strong>-Oktem G, T<strong>in</strong>cer T. J Appl Polym Sci 1995;55:1093.<br />
[4] Tavman IH. J Appl Polym Sci 1996;62:2161.<br />
[5] Maiti SN, Mahapatro PK. Polym Compos 1992;13:47.<br />
[6] Bazhenov S. Polym Eng Sci 1995;35(10):813.<br />
[7] E<strong>in</strong>ste<strong>in</strong> A. Ann Phys 1906;19:289.<br />
[8] Theocaris PS, Sideridis E. J Appl Polym Sci 1984;29:2997.<br />
[9] König P, Marconi JD, Goyanes SN, Marzocca AJ, Rubiolo GH.<br />
Proceed<strong>in</strong>gs of the Fifth Lat<strong>in</strong> American and Third Ibero American<br />
Polymer Symposium, 1996:1, 348.<br />
[10] Matteo CL, Gonzalez JJ, Tischler JG, Marzocca AJ. Kaut Gummi<br />
Kunstst 1995;48:166.<br />
[11] Muzeau E, Vigier G, Vassoille R, Perez. J Polymer 1995;36(3):611.<br />
[12] Goyanes SN, Benites GM, Gonzalez JJ, Rubiolo GH, Marzocca AJ.<br />
Polymer Test<strong>in</strong>g 1997;16:7.<br />
[13] Heijboer J. In: Meier DJ, editor. Molecular basis of transitions and<br />
relaxation. London: Gordon and Breach, 1978:75.<br />
[14] Allen G. In: DJ Meier, editor. Molecular basis of transitions and<br />
relaxation. London: Gordon and Breach, 1978:1.<br />
[15] Gedde UW. Polymer physics, chapter 5. London: Chapman and Hall,<br />
1995.<br />
[16] Nielsen LE. Mechanical <strong>properties</strong> of polymers, chapter 7. New York:<br />
Van Nostrand Re<strong>in</strong>hold, New York, 1962.<br />
[17] Billmeyer FW Jr. Textbook of polymer science, chapter 17. New<br />
York: Wiley, 1984.<br />
[18] Ward IM. Mechanical <strong>properties</strong> of solid polymers, chapter 8. New<br />
York: Wiley, 1990.<br />
[19] Povolo F, Marzocca AJ, Goyanes SN. Polymer 1992;33:2709.<br />
[20] Ferry JD. Viscoelastic <strong>properties</strong> of polymer, chapter 12. New York:<br />
Wiley, 1980.<br />
[21] Nielsen LE. Appl Polym Symposia 1969;12:249.