UMG 511
UMG 511
UMG 511

Create successful ePaper yourself
Turn your PDF publications into a flip-book with our unique Google optimized e-Paper software.
▼<br />
<strong>UMG</strong> <strong>511</strong> und <strong>UMG</strong> 604<br />
Grid visualisation software<br />
The data gained from various measurement points must be collected, saved, visualised and made available. The GridVis software contained<br />
in the <strong>UMG</strong> 605 package allows<br />
<br />
<br />
<br />
<br />
Parameterisation and programming of <strong>UMG</strong> measurement devices<br />
Visualisation of the measurement values with topological view<br />
Automatic download of the measurement data<br />
Jasic programming<br />
<br />
<br />
<br />
<br />
Data management<br />
Online analysis tools<br />
Analysis tools for historic data<br />
Transient-, event-, flagbrowser<br />
Visualisation, topological view<br />
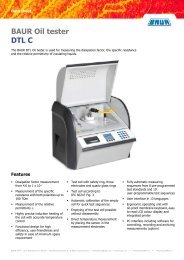
GridVis allows an individually adaptable visualisation of online data. The topological view provides a rapid overview of energy distribution<br />
with the possibility of localising power faults by comparing the individual measurement points and by offering the possibility to monitor the<br />
defined tolerances at a glance.<br />
Customer specific solutions can be quickly and simply implemented through uploading of graphic documents (standard formats such as JPG)<br />
with circuit diagrams, production lines or construction plans and incorporating the respective measurement units by drag and drop into their<br />
actual locations. Limit value excesses (e.g. THD-U is too high) and the status of inputs and outputs can also be displayed.<br />
Online values and analysis<br />
of historic data<br />
With the graphic line writer function, GridVis enables<br />
rapid online presentation of the selected measurement values.<br />
In this function, the graph is continuously expanded<br />
with new measurement values. For example, load profiles<br />
can be presented through the analysis of historic data in<br />
order to produce exact consumption analysis for optimised<br />
electricity supply contracts. Fault analysis through the comparison<br />
of various parameters can also be achieved with a<br />
few mouse clicks.<br />
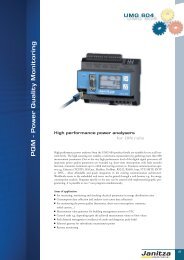
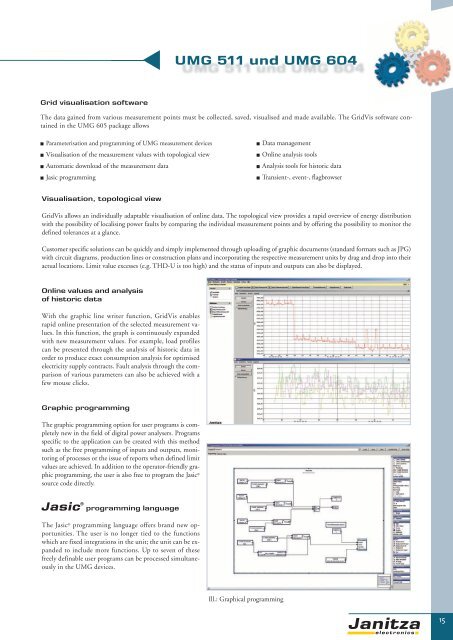
Graphic programming<br />
The graphic programming option for user programs is completely<br />
new in the field of digital power analysers. Programs<br />
specific to the application can be created with this method<br />
such as the free programming of inputs and outputs, monitoring<br />
of processes or the issue of reports when defined limit<br />
values are achieved. In addition to the operator-friendly graphic<br />
programming, the user is also free to program the Jasic ®<br />
source code directly.<br />
programming language<br />
The Jasic ® programming language offers brand new opportunities.<br />
The user is no longer tied to the functions<br />
which are fixed integrations in the unit; the unit can be expanded<br />
to include more functions. Up to seven of these<br />
freely definable user programs can be processed simultaneously<br />
in the <strong>UMG</strong> devices.<br />
Ill.: Graphical programming<br />
15