Voltage Smoothing: Characterizing and ... - Harvard University
Voltage Smoothing: Characterizing and ... - Harvard University
Voltage Smoothing: Characterizing and ... - Harvard University

You also want an ePaper? Increase the reach of your titles
YUMPU automatically turns print PDFs into web optimized ePapers that Google loves.
Core 0<br />
(Prog X)<br />
Core 1<br />
(Prog Y)<br />
Run 1<br />
Run 2<br />
60s<br />
Time (s)<br />
Running Phase A B C D<br />
Run N<br />
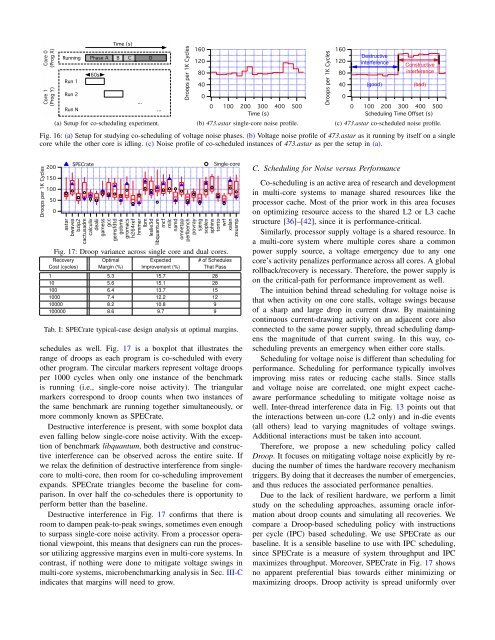
(a) Setup for co-scheduling experiment.<br />
...<br />
...<br />
��������������������<br />
���<br />
���<br />
��<br />
��<br />
�<br />
�<br />
���<br />
���<br />
���<br />
���<br />
���<br />
��������<br />
(b) 473.astar single-core noise profile.<br />
��������������������<br />
���<br />
���<br />
��<br />
��<br />
�<br />
�<br />
�����������<br />
������������<br />
���<br />
���<br />
���<br />
������������<br />
������������<br />
������ �����<br />
���<br />
��������������������������<br />
���<br />
(c) 473.astar co-scheduled noise profile.<br />
Fig. 16: (a) Setup for studying co-scheduling of voltage noise phases. (b) <strong>Voltage</strong> noise profile of 473.astar as it running by itself on a single<br />
core while the other core is idling. (c) Noise profile of co-scheduled instances of 473.astar as per the setup in (a).<br />
��������������������<br />
���<br />
���<br />
���<br />
��<br />
�<br />
�������� ������������<br />
�����<br />
������<br />
�����<br />
���������<br />
��������<br />
������<br />
������<br />
���<br />
��������<br />
�����<br />
�������<br />
�������<br />
Fig. 17: Droop variance across single core <strong>and</strong> dual cores.<br />
Recovery Optimal Expected # of Schedules<br />
Cost (cycles) Margin (%) Improvement (%) That Pass<br />
1 5.3 15.7 28<br />
10 5.6 15.1 28<br />
100 6.4 13.7 15<br />
1000 7.4 12.2 12<br />
10000 8.2 10.8 9<br />
100000 8.6 9.7 9<br />
Tab. I: SPECrate typical-case design analysis at optimal margins.<br />
schedules as well. Fig. 17 is a boxplot that illustrates the<br />
range of droops as each program is co-scheduled with every<br />
other program. The circular markers represent voltage droops<br />
per 1000 cycles when only one instance of the benchmark<br />
is running (i.e., single-core noise activity). The triangular<br />
markers correspond to droop counts when two instances of<br />
the same benchmark are running together simultaneously, or<br />
more commonly known as SPECrate.<br />
Destructive interference is present, with some boxplot data<br />
even falling below single-core noise activity. With the exception<br />
of benchmark libquantum, both destructive <strong>and</strong> constructive<br />
interference can be observed across the entire suite. If<br />
we relax the definition of destructive interference from singlecore<br />
to multi-core, then room for co-scheduling improvement<br />
exp<strong>and</strong>s. SPECrate triangles become the baseline for comparison.<br />
In over half the co-schedules there is opportunity to<br />
perform better than the baseline.<br />
Destructive interference in Fig. 17 confirms that there is<br />
room to dampen peak-to-peak swings, sometimes even enough<br />
to surpass single-core noise activity. From a processor operational<br />
viewpoint, this means that designers can run the processor<br />
utilizing aggressive margins even in multi-core systems. In<br />
contrast, if nothing were done to mitigate voltage swings in<br />
multi-core systems, microbenchmarking analysis in Sec. III-C<br />
indicates that margins will need to grow.<br />
�����<br />
���<br />
��������<br />
����������<br />
���<br />
����<br />
����<br />
�������<br />
���������<br />
������<br />
�����<br />
������<br />
������<br />
�����<br />
���<br />
�����<br />
������<br />
C. Scheduling for Noise versus Performance<br />
Co-scheduling is an active area of research <strong>and</strong> development<br />
in multi-core systems to manage shared resources like the<br />
processor cache. Most of the prior work in this area focuses<br />
on optimizing resource access to the shared L2 or L3 cache<br />
structure [36]–[42], since it is performance-critical.<br />
Similarly, processor supply voltage is a shared resource. In<br />
a multi-core system where multiple cores share a common<br />
power supply source, a voltage emergency due to any one<br />
core’s activity penalizes performance across all cores. A global<br />
rollback/recovery is necessary. Therefore, the power supply is<br />
on the critical-path for performance improvement as well.<br />
The intuition behind thread scheduling for voltage noise is<br />
that when activity on one core stalls, voltage swings because<br />
of a sharp <strong>and</strong> large drop in current draw. By maintaining<br />
continuous current-drawing activity on an adjacent core also<br />
connected to the same power supply, thread scheduling dampens<br />
the magnitude of that current swing. In this way, coscheduling<br />
prevents an emergency when either core stalls.<br />
Scheduling for voltage noise is different than scheduling for<br />
performance. Scheduling for performance typically involves<br />
improving miss rates or reducing cache stalls. Since stalls<br />
<strong>and</strong> voltage noise are correlated, one might expect cacheaware<br />
performance scheduling to mitigate voltage noise as<br />
well. Inter-thread interference data in Fig. 13 points out that<br />
the interactions between un-core (L2 only) <strong>and</strong> in-die events<br />
(all others) lead to varying magnitudes of voltage swings.<br />
Additional interactions must be taken into account.<br />
Therefore, we propose a new scheduling policy called<br />
Droop. It focuses on mitigating voltage noise explicitly by reducing<br />
the number of times the hardware recovery mechanism<br />
triggers. By doing that it decreases the number of emergencies,<br />
<strong>and</strong> thus reduces the associated performance penalties.<br />
Due to the lack of resilient hardware, we perform a limit<br />
study on the scheduling approaches, assuming oracle information<br />
about droop counts <strong>and</strong> simulating all recoveries. We<br />
compare a Droop-based scheduling policy with instructions<br />
per cycle (IPC) based scheduling. We use SPECrate as our<br />
baseline. It is a sensible baseline to use with IPC scheduling,<br />
since SPECrate is a measure of system throughput <strong>and</strong> IPC<br />
maximizes throughput. Moreover, SPECrate in Fig. 17 shows<br />
no apparent preferential bias towards either minimizing or<br />
maximizing droops. Droop activity is spread uniformly over