Voltage Smoothing: Characterizing and ... - Harvard University
Voltage Smoothing: Characterizing and ... - Harvard University
Voltage Smoothing: Characterizing and ... - Harvard University

You also want an ePaper? Increase the reach of your titles
YUMPU automatically turns print PDFs into web optimized ePapers that Google loves.
��������������������<br />
���<br />
��<br />
��<br />
�<br />
�<br />
���<br />
���<br />
��������<br />
(a) 482.sphinx<br />
����<br />
����<br />
�������������������<br />
���<br />
��<br />
��<br />
�<br />
�<br />
���<br />
��������<br />
(b) 416.gamess<br />
���<br />
��������������������<br />
���<br />
��<br />
��<br />
�<br />
�<br />
���<br />
���<br />
����<br />
��������<br />
(c) 465.tonto<br />
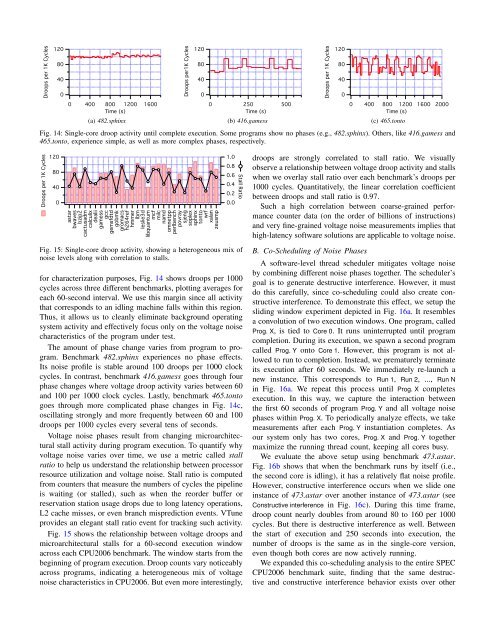
Fig. 14: Single-core droop activity until complete execution. Some programs show no phases (e.g., 482.sphinx). Others, like 416.gamess <strong>and</strong><br />
465.tonto, experience simple, as well as more complex phases, respectively.<br />
��������������������<br />
���<br />
��<br />
��<br />
�<br />
�����<br />
������<br />
�����<br />
���������<br />
��������<br />
������<br />
������<br />
���<br />
��������<br />
�����<br />
�������<br />
�������<br />
�����<br />
���<br />
Fig. 15: Single-core droop activity, showing a heterogeneous mix of<br />
noise levels along with correlation to stalls.<br />
for characterization purposes, Fig. 14 shows droops per 1000<br />
cycles across three different benchmarks, plotting averages for<br />
each 60-second interval. We use this margin since all activity<br />
that corresponds to an idling machine falls within this region.<br />
Thus, it allows us to cleanly eliminate background operating<br />
system activity <strong>and</strong> effectively focus only on the voltage noise<br />
characteristics of the program under test.<br />
The amount of phase change varies from program to program.<br />
Benchmark 482.sphinx experiences no phase effects.<br />
Its noise profile is stable around 100 droops per 1000 clock<br />
cycles. In contrast, benchmark 416.gamess goes through four<br />
phase changes where voltage droop activity varies between 60<br />
<strong>and</strong> 100 per 1000 clock cycles. Lastly, benchmark 465.tonto<br />
goes through more complicated phase changes in Fig. 14c,<br />
oscillating strongly <strong>and</strong> more frequently between 60 <strong>and</strong> 100<br />
droops per 1000 cycles every several tens of seconds.<br />
<strong>Voltage</strong> noise phases result from changing microarchitectural<br />
stall activity during program execution. To quantify why<br />
voltage noise varies over time, we use a metric called stall<br />
ratio to help us underst<strong>and</strong> the relationship between processor<br />
resource utilization <strong>and</strong> voltage noise. Stall ratio is computed<br />
from counters that measure the numbers of cycles the pipeline<br />
is waiting (or stalled), such as when the reorder buffer or<br />
reservation station usage drops due to long latency operations,<br />
L2 cache misses, or even branch misprediction events. VTune<br />
provides an elegant stall ratio event for tracking such activity.<br />
Fig. 15 shows the relationship between voltage droops <strong>and</strong><br />
microarchitectural stalls for a 60-second execution window<br />
across each CPU2006 benchmark. The window starts from the<br />
beginning of program execution. Droop counts vary noticeably<br />
across programs, indicating a heterogeneous mix of voltage<br />
noise characteristics in CPU2006. But even more interestingly,<br />
��������<br />
����������<br />
���<br />
����<br />
����<br />
�������<br />
���������<br />
������<br />
�����<br />
������<br />
������<br />
�����<br />
���<br />
�����<br />
������<br />
���<br />
���<br />
���<br />
���<br />
���<br />
���<br />
������������<br />
����<br />
����<br />
droops are strongly correlated to stall ratio. We visually<br />
observe a relationship between voltage droop activity <strong>and</strong> stalls<br />
when we overlay stall ratio over each benchmark’s droops per<br />
1000 cycles. Quantitatively, the linear correlation coefficient<br />
between droops <strong>and</strong> stall ratio is 0.97.<br />
Such a high correlation between coarse-grained performance<br />
counter data (on the order of billions of instructions)<br />
<strong>and</strong> very fine-grained voltage noise measurements implies that<br />
high-latency software solutions are applicable to voltage noise.<br />
B. Co-Scheduling of Noise Phases<br />
A software-level thread scheduler mitigates voltage noise<br />
by combining different noise phases together. The scheduler’s<br />
goal is to generate destructive interference. However, it must<br />
do this carefully, since co-scheduling could also create constructive<br />
interference. To demonstrate this effect, we setup the<br />
sliding window experiment depicted in Fig. 16a. It resembles<br />
a convolution of two execution windows. One program, called<br />
Prog. X, is tied to Core 0. It runs uninterrupted until program<br />
completion. During its execution, we spawn a second program<br />
called Prog. Y onto Core 1. However, this program is not allowed<br />
to run to completion. Instead, we prematurely terminate<br />
its execution after 60 seconds. We immediately re-launch a<br />
new instance. This corresponds to Run 1, Run 2, ..., Run N<br />
in Fig. 16a. We repeat this process until Prog. X completes<br />
execution. In this way, we capture the interaction between<br />
the first 60 seconds of program Prog. Y <strong>and</strong> all voltage noise<br />
phases within Prog. X. To periodically analyze effects, we take<br />
measurements after each Prog. Y instantiation completes. As<br />
our system only has two cores, Prog. X <strong>and</strong> Prog. Y together<br />
maximize the running thread count, keeping all cores busy.<br />
We evaluate the above setup using benchmark 473.astar.<br />
Fig. 16b shows that when the benchmark runs by itself (i.e.,<br />
the second core is idling), it has a relatively flat noise profile.<br />
However, constructive interference occurs when we slide one<br />
instance of 473.astar over another instance of 473.astar (see<br />
Constructive interference in Fig. 16c). During this time frame,<br />
droop count nearly doubles from around 80 to 160 per 1000<br />
cycles. But there is destructive interference as well. Between<br />
the start of execution <strong>and</strong> 250 seconds into execution, the<br />
number of droops is the same as in the single-core version,<br />
even though both cores are now actively running.<br />
We exp<strong>and</strong>ed this co-scheduling analysis to the entire SPEC<br />
CPU2006 benchmark suite, finding that the same destructive<br />
<strong>and</strong> constructive interference behavior exists over other