Gear Failure Analysis Involving Grinding Burn - Gear Technology ...
Gear Failure Analysis Involving Grinding Burn - Gear Technology ...
Gear Failure Analysis Involving Grinding Burn - Gear Technology ...

Create successful ePaper yourself
Turn your PDF publications into a flip-book with our unique Google optimized e-Paper software.
Hardness HRC<br />
65<br />
60<br />
55<br />
50<br />
45<br />
40<br />
Hardness vs depth<br />
0 5 10 15 20 25 30 35 40 45<br />
Depth Inches x 1000<br />
Crack location<br />
Flank form measured results<br />
Analytical results with<br />
measurement data<br />
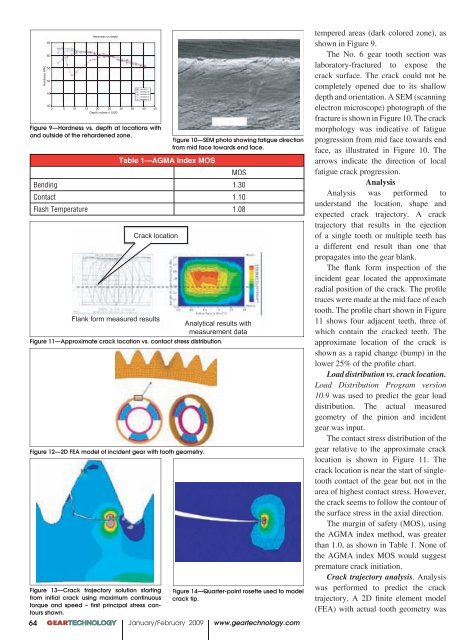
Figure 11—Approximate crack location vs. contact stress distribution.<br />
Figure 12—2D FEA model of incident gear with tooth geometry.<br />
Figure 13—Crack trajectory solution starting<br />
from initial crack using maximum continuous<br />
torque and speed – first principal stress contours<br />
shown.<br />
Table 1—AGMA Index MOS<br />
MOS<br />
Bending 1.30<br />
Contact 1.10<br />
Flash Temperature 1.08<br />
Location 1<br />
Location 2<br />
Location 3<br />
Location 4<br />
Location 5<br />
Figure 9—Hardness vs. depth at locations with<br />
and outside of the rehardened zone.<br />
Figure 10—SEM photo showing fatigue direction<br />
from mid face towards end face.<br />
Figure 14—Quarter-point rosette used to model<br />
crack tip.<br />
00 GEARTECHNOLOGY January/February 2009 www.geartechnology.com<br />
64<br />
tempered areas (dark colored zone), as<br />
shown in Figure 9.<br />
The No. 6 gear tooth section was<br />
laboratory-frac tured to expose the<br />
crack surface. The crack could not be<br />
completely opened due to its shallow<br />
depth and orientation. A SEM (scanning<br />
electron microscope) photograph of the<br />
fracture is shown in Figure 10. The crack<br />
morpholo gy was indicative of fatigue<br />
progression from mid face towards end<br />
face, as illustrated in Figure 10. The<br />
arrows indicate the direction of local<br />
fatigue crack progression.<br />
<strong>Analysis</strong><br />
<strong>Analysis</strong> was performed to<br />
understand the location, shape and<br />
expected crack trajectory. A crack<br />
tra jectory that results in the ejection<br />
of a single tooth or multiple teeth has<br />
a different end result than one that<br />
propagates into the gear blank.<br />
The flank form inspection of the<br />
incident gear lo cated the approximate<br />
radial position of the crack. The profile<br />
traces were made at the mid face of each<br />
tooth. The profile chart shown in Figure<br />
11 shows four ad jacent teeth, three of<br />
which contain the cracked teeth. The<br />
approximate location of the crack is<br />
shown as a rapid change (bump) in the<br />
lower 25% of the profile chart.<br />
Load distribution vs. crack location.<br />
Load Distribution Program version<br />
10.9 was used to predict the gear load<br />
distribution. The actu al measured<br />
geometry of the pinion and incident<br />
gear was input.<br />
The contact stress distribution of the<br />
gear relative to the approximate crack<br />
location is shown in Figure 11. The<br />
crack location is near the start of singletooth<br />
contact of the gear but not in the<br />
area of highest contact stress. However,<br />
the crack seems to follow the contour of<br />
the surface stress in the axial direction.<br />
The margin of safety (MOS), using<br />
the AGMA index method, was greater<br />
than 1.0, as shown in Table 1. None of<br />
the AGMA index MOS would suggest<br />
premature crack initiation.<br />
Crack trajectory analysis. <strong>Analysis</strong><br />
was performed to predict the crack<br />
trajec tory. A 2D finite element model<br />
(FEA) with actual tooth geometry was