

Minimum Flows for the Tampa Bypass Canal, Tampa - Southwest ...
Minimum Flows for the Tampa Bypass Canal, Tampa - Southwest ...
Minimum Flows for the Tampa Bypass Canal, Tampa - Southwest ...

You also want an ePaper? Increase the reach of your titles
YUMPU automatically turns print PDFs into web optimized ePapers that Google loves.
<strong>Minimum</strong> <strong>Flows</strong> <strong>for</strong> <strong>the</strong> <strong>Tampa</strong> <strong>Bypass</strong> <strong>Canal</strong>.<br />
<strong>Tampa</strong>, Fl.<br />
<strong>Southwest</strong> Florida Water Management District<br />
Ecologic Evaluation Section<br />
Draft May 15, 2005<br />
Circa 1913<br />
_________________________________________________________________________________________________
May 15, 2005 Draft<br />
<strong>Minimum</strong> <strong>Flows</strong> <strong>for</strong> <strong>the</strong> <strong>Tampa</strong> <strong>Bypass</strong> <strong>Canal</strong><br />
May 15, 2004 - Draft<br />
Ecologic Evaluation Section<br />
Resource Conservation and Development<br />
Department<br />
<strong>Southwest</strong> Florida Water Management District<br />
Brooksville, Florida 34604-6899<br />
The <strong>Southwest</strong> Florida Water Management District (District) does not<br />
discriminate upon <strong>the</strong> basis of any individual’s disability status. This<br />
non-discriminatory policy involves every aspect of <strong>the</strong> District’s<br />
functions, including one’s access to, participation, employment, or<br />
treatment in its programs and activities. Anyone requiring<br />
accommodation as provided <strong>for</strong> in <strong>the</strong> American with Disabilities Act<br />
should contact (352) 796-7211 or 1-800-423-1476, extension 4215; TDD<br />
ONLY 1-800-231-6103; FAX (352) 754-6749.<br />
_________________________________________________________________________________________________
May 15, 2005 Draft<br />
EXECUTIVE SUMMARY<br />
The <strong>Southwest</strong> Florida Water Management District (District) is mandated by <strong>the</strong><br />
legislature (Section 373.042, Florida Statutes) to protect water resources and ecology<br />
from ‘significant harm’ due to withdrawals. The minimum flow is defined as <strong>the</strong> minimum<br />
amount of water (or water level) that will prohibit significant harm. It is termed <strong>the</strong><br />
minimum flow and level (MFL). This document establishes <strong>the</strong> target goals <strong>for</strong> <strong>the</strong><br />
resources a priori, and describes <strong>the</strong> tools used to evaluate <strong>the</strong> resource response to<br />
inflows.<br />
In accordance with <strong>the</strong> Statutes, <strong>the</strong> MFL is based on best available data. It is not a<br />
restorative, optimal or historical flow, although a baseline flow condition was established<br />
<strong>for</strong> reference. The MFL statutes do not make provisions <strong>for</strong> existing consumptive use<br />
withdrawals and thus it was necessary to correct <strong>for</strong> historical withdrawals/transfers of<br />
TBC flow. In contrast and as provided in <strong>the</strong> law, structural alterations must be<br />
considered in establishing an MFL. The TBC was constructed from <strong>the</strong> Palm River by<br />
<strong>the</strong> Army Corps as part of <strong>the</strong> Four River Basins flood control project, and those<br />
functions take priority over resource protection. The District was <strong>for</strong>med in 1961 by <strong>the</strong><br />
State legislature to be <strong>the</strong> local sponsor of <strong>the</strong> TBC construction project.<br />
The large diversions from <strong>the</strong> Hillsborough River to <strong>the</strong> TBC are <strong>for</strong> flood control. High<br />
flows in <strong>the</strong> TBC causes several undesirable environmental consequences. Infrequent,<br />
but prolonged low salinities cause oyster mortality and establish vertical salinity<br />
stratification. The latter in turn cause hypoxic (low oxygen) conditions that result in<br />
depaupurate benthic communities. In many respects, <strong>the</strong> ecology of <strong>the</strong> TBC is at<br />
higher risk because of high flows than insufficient freshwater flow.<br />
The construction of <strong>the</strong> TBC increased <strong>the</strong> volume of <strong>the</strong> Palm River by more than 10<br />
times. The increased conveyance provides flood control, but also serves as an effective<br />
conduit <strong>for</strong> saline waters from <strong>Tampa</strong> Bay. Historically, a gallon of freshwater runoff into<br />
<strong>the</strong> Palm River would have been 10 times more effective at diluting saltwater because<br />
<strong>the</strong> volume of <strong>the</strong> Palm River was 10 times smaller. Consequently, it follows logically<br />
that both <strong>the</strong> hydrodynamic and empirical models developed <strong>for</strong> <strong>the</strong> TBC predict a<br />
system that is relatively insensitive to freshwater inputs. The freshwater input to TBC<br />
has increased dramatically, yet <strong>the</strong> system remains a relatively high saline system<br />
without a freshwater reach. This is despite <strong>the</strong> addition of an estimated 20 mgd of<br />
ground water caused by a breach of <strong>the</strong> Floridan aquifer during construction and <strong>the</strong><br />
hydraulic connection to <strong>the</strong> Hillsborough River watershed that is 22 times larger than <strong>the</strong><br />
original 28 square mile Palm River watershed. However, much of <strong>the</strong> Hillsborough<br />
discharge is captured <strong>for</strong> water supply, and existing users withdraw an additional<br />
amount from <strong>the</strong> TBC prior to discharge into McKay Bay.<br />
_________________________________________________________________________________________________<br />
Executive Summary<br />
i
May 15, 2005 Draft<br />
At <strong>the</strong> outset of <strong>the</strong> evaluation, several ecological resources believed to be significant to<br />
McKay Bay/TBC were identified <strong>for</strong> evaluation. Those included oysters, birds,<br />
vegetation, benthic macroinvertebrate communities, fish and invertebrates. In <strong>the</strong><br />
absence of clear breaks in resource/inflow relationships, an a priori goal of less than a<br />
fifteen percent loss of resource was established. In addition, a low flow threshold (LFT)<br />
of 30 cfs corresponding to <strong>the</strong> lowest 10 percent of baseline flows was initially chosen<br />
<strong>for</strong> evaluation.<br />
Of <strong>the</strong> resources chosen <strong>for</strong> evaluation, only <strong>the</strong> fish and invertebrate response to inflow<br />
proved useful. The oyster evaluation revealed that even under zero discharge from S-<br />
160, <strong>the</strong> salinity in McKay Bay/TBC remains within optimal limits <strong>for</strong> oysters. In<br />
essence, McKay Bay/TBC will assume <strong>the</strong> salinity of East Bay (which in turn assumes<br />
<strong>the</strong> salinity of Hillsborough Bay etc) that is non-threatening <strong>for</strong> oysters.<br />
The dominant vegetative structures in McKay Bay/TBC are mangroves. Contemporary<br />
research into mangrove ecology subscribes to <strong>the</strong> belief that <strong>the</strong> salinity in <strong>the</strong> water<br />
column is relatively unimportant to <strong>the</strong> health of mangroves. Of far greater importance<br />
is <strong>the</strong> salinity in <strong>the</strong> soil, which mangroves have been shown to regulate.<br />
It was determined that birds were also a poor choice of resource related to inflow partly<br />
because of <strong>the</strong>ir mobility. Successful connections to freshwater inflow will likely be<br />
through qualitative relationships to vegetation or prey abundance.<br />
Useful quantitative relationships between McKay Bay/TBC benthic infauna and<br />
freshwater inflow have yet to be published, although community gradients related to<br />
salinity have been noted. Circumstantial evidence indicates that hypoxia is a major<br />
factor in shaping <strong>the</strong> TBC community, but relationships quantitatively linking abundance,<br />
diversity or o<strong>the</strong>r community metrics with flow were unavailable at <strong>the</strong> time of <strong>the</strong><br />
evaluation. The McKay Bay/TBC literature describing <strong>the</strong> role of salinity in shaping <strong>the</strong><br />
benthic community is conflicting and inconclusive at this time.<br />
The response of fish and invertebrates to varying inflow proved to be a useful tool <strong>for</strong><br />
<strong>the</strong> MFL evaluation. Coupling <strong>the</strong> results of over 2,000 sampling episodes with <strong>the</strong><br />
discharge from S-160 and estimates of ungaged flow below S-160 resulted in<br />
statistically significant (at α =0.05) relationships <strong>for</strong> 34 taxa, although flow alone<br />
accounts <strong>for</strong> only a small fraction of <strong>the</strong> abundance (median r 2 =0.24).<br />
Three taxa were selected because of <strong>the</strong>ir positive response to freshwater and <strong>the</strong>ir<br />
significance to <strong>the</strong> regional ecology (bay anchovy and mysid shrimp) or <strong>the</strong>ir<br />
commercial value (pink shrimp). The abundance of each taxon was estimated <strong>for</strong> <strong>the</strong><br />
median baseline flow condition (Flow at S-160 that would have occurred between 1983<br />
and 2003 if no diversions or withdrawals had occurred <strong>for</strong> water supply reasons) and <strong>for</strong><br />
a series of hypo<strong>the</strong>tical reduced flow scenarios. The daily median of <strong>the</strong> 20-year flow<br />
was evaluated in order to allow <strong>for</strong> <strong>the</strong> natural variation in flow, recognizing that <strong>the</strong>re<br />
_________________________________________________________________________________________________<br />
Executive Summary<br />
ii
May 15, 2005 Draft<br />
are constraints to <strong>the</strong> extent that a regulated system designed primarily <strong>for</strong> flood-control<br />
can mimic natural conditions.<br />
The percentage change in abundance relative to <strong>the</strong> daily median baseline flow (97 cfs)<br />
indicates that an average fifteen percent reduction will occur in <strong>the</strong>se three taxa when<br />
S-160 flows are reduced to approximately 65 cfs. Greater losses occur with fur<strong>the</strong>r<br />
reductions in median flow.<br />
An infinite combination of low flow thresholds and percentage withdrawals will result in a<br />
median flow of 65 cfs. At lower withdrawal rates, a zero cfs LFT produces <strong>the</strong> same<br />
median flow and thus <strong>the</strong> same abundance as a 30 cfs LFT. At higher withdrawal rates<br />
<strong>the</strong> selection of LFT becomes more critical. Two scenarios were selected <strong>for</strong> fur<strong>the</strong>r<br />
evaluation. A combination of 30 cfs LFT and <strong>for</strong>ty percent withdrawal (scenario S-4) and<br />
a 30 cfs LFT with a sixty percent withdrawal (S-5) were fur<strong>the</strong>r evaluated <strong>for</strong> salinity and<br />
dissolved oxygen response.<br />
The difference between scenarios S-4, S-5 and <strong>the</strong> baseline flow (S-2) <strong>for</strong> average<br />
bottom salinity and percent saturation of dissolved oxygen is deemed ecologically<br />
negligible. (Percent saturation is a re-expression of <strong>the</strong> traditional dissolved oxygen<br />
concentration that is normalized <strong>for</strong> salinity and temperature.) Hydrodynamic model<br />
results support <strong>the</strong> empirically derived salinity/flow relationships <strong>for</strong> <strong>the</strong> three flow<br />
scenarios. In <strong>the</strong> areas of ecological concern (e.g. hypoxic conditions), cumulative<br />
distribution plots of both percent saturation and salinity were virtually indistinguishable<br />
between <strong>the</strong> flow scenarios.<br />
The present evaluation was largely framed around relationships between <strong>the</strong><br />
abundance of fish/invertebrates and freshwater inflow. A long-term median flow that<br />
limits resource loss to 15 percent was identified from <strong>the</strong>se relationships. Using<br />
empirical and hydrodynamic models, this median flow was tested <strong>for</strong> effects on salinity<br />
and dissolved oxygen. The report concludes that <strong>the</strong> differences would be negligible.<br />
However, no MFL is recommended at this time because <strong>the</strong> underlying biological<br />
response is only weakly related to inflows and inflow (and thus <strong>the</strong> MFL) accounts <strong>for</strong><br />
less than <strong>the</strong> eighty-five percent of <strong>the</strong> resource response. This, coupled with <strong>the</strong> highly<br />
altered physical conditions and <strong>the</strong> need to retain <strong>the</strong> flood control functions suggest<br />
that maintaining a complete estuarine gradient will be impractical and <strong>the</strong> benefit of<br />
establishing an MFL is questionable.<br />
_________________________________________________________________________________________________<br />
Executive Summary<br />
iii
May 15, 2005 Draft<br />
ac<br />
BOD<br />
CDF<br />
cfs<br />
cms<br />
COB<br />
COT<br />
District<br />
DO<br />
EPCHC or EPC<br />
F.A.C.<br />
F.S.<br />
FDEP<br />
FMRI<br />
FWRI<br />
GIS<br />
ha<br />
HBMP<br />
HIMP<br />
Km<br />
MFLs<br />
mg/l<br />
mgd<br />
NGVD<br />
PBS&J<br />
ppt<br />
PSU<br />
SDI<br />
SJRWMD<br />
TBC<br />
TBEP or TBNEP<br />
TBW<br />
TDS<br />
TKN<br />
TN<br />
TSS<br />
USF<br />
USFWS<br />
USGS<br />
WAR<br />
WCRWSA<br />
Acronyms and Definitions<br />
acres<br />
Biochemical Oxygen Demand<br />
Cumulative Distribution Function<br />
Cubic feet per second<br />
cubic meters per second<br />
Center of Abundance<br />
City of <strong>Tampa</strong><br />
<strong>Southwest</strong> Florida Water Management District<br />
Dissolved oxygen<br />
Environmental Protection Commission of Hillsborough County<br />
Florida Administrative Code<br />
Florida Statutes<br />
Florida Department of Environmental Protection<br />
Florida Marine Research Institute (Presently FWRI)<br />
Florida Fish and Wildlife Research Institute<br />
Geographic In<strong>for</strong>mation Service<br />
hectares<br />
Hydro-Biological Monitoring Plan<br />
Hillsborough Independent Monitoring Program<br />
Kilometer<br />
<strong>Minimum</strong> <strong>Flows</strong> and Levels<br />
Milligrams per liter<br />
Million gallons per day<br />
National Geodetic Vertical Datum<br />
Post, Buckley, Schuh and Jernigan, Inc.<br />
parts per thousand<br />
Pracatical Salinity Units<br />
SDI, Inc.<br />
St. Johns River Water Management District<br />
<strong>Tampa</strong> <strong>Bypass</strong> <strong>Canal</strong><br />
<strong>Tampa</strong> Bay Estuary Program (<strong>Tampa</strong> Bay National Estuary Program)<br />
<strong>Tampa</strong> Bay Water<br />
Total Dissolved Solids<br />
Total Kjehldal Nitrogen<br />
Total Nitrogen<br />
Total Suspended Solids<br />
University of South Florida<br />
United States Fish and Wildlife Service<br />
United States Geological Survey<br />
Water and Air Reseach, Inc<br />
West Coast Regional Water Supply Authority (Presently TBW)<br />
_________________________________________________________________________________________________<br />
Acronyms and Defintions<br />
iv
May 15, 2005 Draft<br />
Conversion Table<br />
Metric to U.S. Customary<br />
Multiply By To Obtain<br />
cubic meters per second (m 3 /s) 35.31 cubic feet per second (cfs)<br />
cubic meters per second (m 3 /s) 23 million gallons per day (mgd)<br />
millimeters (mm) 0.03937 inches (in)<br />
centimeter (cm) 0.3937 inches (in)<br />
meters (m) 3.281 feet (ft)<br />
kilometers (km) 0.6214 statute miles (mi)<br />
square meters (m 2 ) 10.76 square feet (ft 2 )<br />
square kilometers (km 2 ) 0.3861 square miles (mi 2 )<br />
hectares (ha) 2.471 acres<br />
liters (l) 0.2642 gallons<br />
cubic meters (m 3 ) 35.31 cubic feet (ft 3 )<br />
cubic meters (m 3 ) 0.0008110 acre-ft<br />
milligrams (mg) 0.00003527 ounces<br />
grams (g) 0.03527 ounces<br />
kilograms (kg) 2.205 pounds<br />
Celsius degrees ( o C) 1.8*( o C) + 32 Fahrenheit ( o F)<br />
US Customary to Metric<br />
inches (in) 25.40 millimeters (mm)<br />
inches (in) 2.54 centimeter (cm)<br />
feet (ft) 0.3048<br />
statute miles (mi) 1.609<br />
square feet (ft 2 ) 0.0929 square meters (m 2 )<br />
square miles (mi 2 ) 2.590 square kilometers (km 2 )<br />
acres 0.4047 hectares (ha)<br />
gallons (gal) 3.785 liters (l)<br />
cubic feet (ft 3 ) 0.02831 cubic meters (m 3 )<br />
acre-feet 1233.0 cubic meters (m 3 )<br />
Fahrenheit ( o F) 0.5556*( o F-32) Celsius degrees ( o C)<br />
US Customary to US Customary<br />
acre 43560 square feet (ft 2 )<br />
square miles (mi 2 ) 640 acres<br />
cubic feet per second (cfs) 0.646 million gallons per day (mgd)<br />
_________________________________________________________________________________________________<br />
Conversions<br />
v
_________________________________________________________________________________________________<br />
May 15, 2005 Draft<br />
TABLE OF CONTENTS<br />
CHAPTER 1 - PURPOSE OF MINIMUM FLOWS AND LEVELS -BACKGROUND<br />
SETTING FOR THE TAMPA BYPASS CANAL ..........................................................1-1<br />
1.1 Overview ......................................................................................................................... 1-1<br />
1.2 Legislative Direction ...................................................................................................... 1-1<br />
1.3 Water Resource Function.............................................................................................. 1-2<br />
1.4 Geographic definitions................................................................................................... 1-3<br />
1.5 Ecologic Integrity and Significant Harm..................................................................... 1-4<br />
1.6 Components of a <strong>Minimum</strong> Flow and Level ............................................................... 1-4<br />
1.7 Summary of Approach .................................................................................................. 1-4<br />
1.8 <strong>Flows</strong> and Levels ............................................................................................................ 1-7<br />
1.9 Content of Remaining Chapters................................................................................... 1-8<br />
CHAPTER 2<br />
- BASIN DESCRIPTION AND HISTORY............................................2-1<br />
2.1 Geographic Setting......................................................................................................... 2-1<br />
2.2 Regional Rainfall............................................................................................................ 2-1<br />
2.3 Palm River / <strong>Tampa</strong> <strong>Bypass</strong> <strong>Canal</strong> Watershed characteristics.................................2-1<br />
2.4 Construction of TBC...................................................................................................... 2-2<br />
2.5 Hydrology Above S-160................................................................................................. 2-5<br />
2.6 Hydrology Below S-160 ................................................................................................. 2-8<br />
2.7 Existing TBC Water Users............................................................................................ 2-9<br />
2.8 Baseline <strong>Flows</strong> .............................................................................................................. 2-11<br />
2.9 Pertinent reports and Sources of environMental Data ............................................2-14<br />
2.10 <strong>Tampa</strong> Bay National Estuary Program – <strong>Minimum</strong> <strong>Flows</strong> Advisory Group ........2-14<br />
________________________________________________________________________________________________________<br />
TOC<br />
vi
_________________________________________________________________________________________________<br />
May 15, 2005 Draft<br />
2.11 Previous <strong>Minimum</strong> <strong>Flows</strong> and levels report <strong>for</strong> <strong>the</strong> <strong>Tampa</strong> <strong>Bypass</strong> <strong>Canal</strong>............ 2-14<br />
2.12 Peer Review .................................................................................................................. 2-16<br />
2.12.1 Peer Review -Technical Assumptions ...................................................................2-17<br />
2.12.2 Peer Review - Procedures and Analyses................................................................2-17<br />
2.12.3 Peer Review - Evaluate Deficiencies.....................................................................2-18<br />
2.12.4 Peer Review - Summary ........................................................................................ 2-18<br />
2.13 Prior Water Quality Data Collection / Studies..........................................................2-19<br />
2.13.1 Environmental Protection Commission Hillsborough County ..............................2-19<br />
2.13.2 Hydrobiological Study of Lower Hillsborough River and <strong>Tampa</strong> <strong>Bypass</strong> <strong>Canal</strong><br />
(WAR/SDI, 1995).................................................................................................................. 2-19<br />
2.13.3 Hydrobiological Monitoring Program (HBMP) Year 3 Interpretive Report (PBS&J,<br />
2003). 2-21<br />
2.13.4 An Analysis of <strong>the</strong> Effects of Freshwater Inflows on Salinity Distribution,<br />
Dissolved Oxygen Concentrations, and Habitat Characteristics of <strong>the</strong> Hillsborough River and<br />
Palm River/<strong>Tampa</strong> <strong>Bypass</strong> <strong>Canal</strong> (Coastal Environmental, Inc., 1997)................................2-23<br />
2.13.5 McKay Bay TMDL (Burger and Petrus, 2004) .....................................................2-24<br />
2.14 Sources of BIOLOGICAL STUDIES and In<strong>for</strong>mation ...........................................2-24<br />
2.14.1 Hydrobiological Study of Lower Hillsborough River and <strong>Tampa</strong> <strong>Bypass</strong> <strong>Canal</strong><br />
(WAR/SDI, 1995).................................................................................................................. 2-25<br />
2.14.2 Assessment of Potential Impacts on Biological Commmunities of McKay Bay from<br />
Proposed Reductions in Freshwater Inflow from <strong>the</strong> <strong>Tampa</strong> <strong>Bypass</strong> <strong>Canal</strong> (PBS&J, 1998).2-27<br />
2.14.3 Hydrobiological Monitoring Program (HBMP) Year 3 Interpretive Report (PBS&J,<br />
2003). 2-28<br />
2.15 Summary of prior studies............................................................................................ 2-30<br />
2.16 Recent Studies of <strong>the</strong> TBC .......................................................................................... 2-30<br />
2.16.1 Hydrodynamic Model ............................................................................................ 2-31<br />
2.16.2 Oysters ................................................................................................................... 2-31<br />
2.16.3 Benthic Communities............................................................................................. 2-31<br />
2.16.4 Fishes / Invertebrates ............................................................................................. 2-31<br />
2.16.5 Water Quality Database Updates........................................................................... 2-31<br />
2.16.6 Compilation of Background / History....................................................................2-32<br />
2.16.7 Dissolved Oxygen.................................................................................................. 2-32<br />
CHAPTER 3<br />
ECOLOGICAL RESOURCES.............................................................3-1<br />
3.1 Resources ........................................................................................................................ 3-1<br />
3.2 Oyster reefs..................................................................................................................... 3-1<br />
3.2.1 Life history............................................................................................................... 3-1<br />
3.2.2 Distribution, tolerance and survival of adult oysters ...............................................3-3<br />
3.2.3 Management Implications........................................................................................ 3-4<br />
________________________________________________________________________________________________________<br />
TOC<br />
vii
_________________________________________________________________________________________________<br />
May 15, 2005 Draft<br />
3.2.4 Occurrence of Oysters in McKay Bay/TBC ............................................................3-5<br />
3.2.5 TBC Oyster Community and S-160 <strong>Flows</strong>..............................................................3-6<br />
3.3 Vegetation ....................................................................................................................... 3-9<br />
3.4 Birds .............................................................................................................................. 3-12<br />
3.5 Fish and Invertebrates................................................................................................. 3-13<br />
3.5.1 Overview of Fish / Invertebrate Distribution and Abundance in McKay Bay/ Palm<br />
River 3-13<br />
3.5.2 Habitat Preference.................................................................................................. 3-14<br />
3.5.3 Relationship of Abundance to Inflow....................................................................3-16<br />
3.6 Benthos.......................................................................................................................... 3-22<br />
3.6.1 Benthos Characterization Metrics.......................................................................... 3-23<br />
3.6.2 Common Benthic Residents................................................................................... 3-23<br />
3.6.3 Benthos Samples.................................................................................................... 3-24<br />
3.6.4 Benthos Relationship to Abiotic Parameters .........................................................3-24<br />
3.7 Water Quality - Salinity .............................................................................................. 3-24<br />
3.8 Water Quality - Dissolved Oxygen ............................................................................. 3-29<br />
3.8.1 Re-Evaluation of DO / Flow Relationship(s).........................................................3-31<br />
3.9 Hydrodynamic Model.................................................................................................. 3-37<br />
3.9.1 Flow Scenarios....................................................................................................... 3-38<br />
3.9.2 Hydrodynamic Results........................................................................................... 3-39<br />
CHAPTER 4 TECHNICAL APPROACH ..................................................................4-1<br />
4.1 Overview ......................................................................................................................... 4-1<br />
4.2 Goals................................................................................................................................4-1<br />
4.3 Consideration of Existing Uses ..................................................................................... 4-1<br />
4.4 Application of Goals to Resource Response ................................................................ 4-1<br />
4.4.1 Oysters ..................................................................................................................... 4-1<br />
4.4.2 Vegetation (Mangroves) .......................................................................................... 4-2<br />
4.4.3 Fish and Invertebrates.............................................................................................. 4-2<br />
4.4.4 Benthos .................................................................................................................... 4-2<br />
The results of <strong>the</strong> benthos evaluation were inconclusive <strong>for</strong> setting an MFL. In general, <strong>the</strong><br />
TBC benthic community appears to be more responsive to <strong>the</strong> occurrence of hypoxia ra<strong>the</strong>r<br />
than high salinity. Hypoxia is related to high flow more often than low-flow conditions. In <strong>the</strong><br />
absence of fur<strong>the</strong>r work, an MFL could not be evaluated <strong>for</strong> <strong>the</strong> benthic communities. ........4-2<br />
4.4.5 Birds......................................................................................................................... 4-3<br />
________________________________________________________________________________________________________<br />
TOC<br />
viii
_________________________________________________________________________________________________<br />
May 15, 2005 Draft<br />
4.4.6 Changes to Salinity and Dissolved Oxygen.............................................................4-3<br />
CHAPTER 5 RESULTS OF MFL ANALYSIS ..........................................................5-1<br />
5.1 Results ............................................................................................................................. 5-1<br />
________________________________________________________________________________________________________<br />
TOC<br />
ix
_________________________________________________________________________________________________<br />
May 15, 2005 Draft<br />
CHAPTER 1 - PURPOSE OF MINIMUM FLOWS AND LEVELS -<br />
BACKGROUND SETTING FOR THE TAMPA BYPASS CANAL<br />
1.1 OVERVIEW<br />
The <strong>Southwest</strong> Florida Water Management District (SWFWMD) is responsible <strong>for</strong><br />
permitting <strong>the</strong> consumptive use of water within <strong>the</strong> District's boundaries. Within this<br />
context, <strong>the</strong> 1972 Florida statutes (Section 373.042) mandate that <strong>the</strong> District protect<br />
water resources from “significant harm” through <strong>the</strong> establishment of minimum flows<br />
and levels (MFLs) <strong>for</strong> streams and rivers within its boundaries. The District’s purpose in<br />
establishing MFLs is to create hydrologic and ecologic standards against which<br />
permitting or planning decisions can be made regarding water withdrawals, ei<strong>the</strong>r<br />
surface or ground-water. Should an amount of withdrawal requested cause “significant<br />
harm” <strong>the</strong>n a permit cannot be issued. If "significant harm" is found as a result of<br />
existing withdrawals, <strong>the</strong>n a recovery plan must be developed and implemented.<br />
As currently defined by statute, "... <strong>the</strong> minimum flow <strong>for</strong> a given watercourse shall be<br />
<strong>the</strong> limit at which fur<strong>the</strong>r withdrawals would be significantly harmful to <strong>the</strong> water<br />
resources or ecology of <strong>the</strong> area." The legislature has not defined ‘significantly harmful’<br />
although Lowe (1994) proposed that significant harm to natural systems occurs when<br />
anthropogenic effects on hydrology have caused, or are likely to cause one of <strong>the</strong><br />
following <strong>for</strong> a period of five years or more:<br />
1) Local or regional extirpation of one of more native species,<br />
2) . . . . reduction in abundance or reproductive success of a listed . . . species,<br />
3) . . . . reduction in abundance or reproductive success of a keystone species<br />
4) . . . . reduction in abundance or reproductive success of a commercially, or<br />
recreationally significant species, and<br />
5) replacement of <strong>the</strong> dominant flora or fauna with ano<strong>the</strong>r species or group that<br />
becomes significant, or a significant increase occurs in <strong>the</strong> abundance or<br />
productivity or a nuisance, exotic, or uncharacteristic species.<br />
For purposes of <strong>the</strong> MFL evaluation <strong>for</strong> <strong>the</strong> <strong>Tampa</strong> <strong>Bypass</strong> <strong>Canal</strong> (TBC), <strong>the</strong> significant<br />
harm is assumed to occur when <strong>the</strong> abundance of mysid shrimp, bay anchovy<br />
(keystone species) or pink shrimp (commercially significant species) is reduced 15<br />
percent or more.<br />
1.2 LEGISLATIVE DIRECTION<br />
Florida law requires <strong>the</strong> water management districts to establish MFLs <strong>for</strong> surface<br />
waters and aquifers within <strong>the</strong>ir jurisdictions (Section 373.042(1), F.S.). According to<br />
state law, minimum flows and levels are to be established based upon <strong>the</strong> “…best<br />
available in<strong>for</strong>mation…” and shall be developed with consideration of “...changes and<br />
structural alterations to watersheds, surface waters and aquifers and <strong>the</strong> effects such<br />
________________________________________________________________________________________________________<br />
1.0 Purpose of <strong>Minimum</strong> <strong>Flows</strong> and Levels<br />
1-1
_________________________________________________________________________________________________<br />
May 15, 2005 Draft<br />
changes or alterations have had, and <strong>the</strong> constraints such changes or alterations have<br />
placed, on <strong>the</strong> hydrology of <strong>the</strong> affected watershed, surface water, or aquifer... (Section<br />
373.0421, F.S.). While <strong>the</strong> legislature has explicitly identified <strong>the</strong> need to consider<br />
physical changes, existing potable water withdrawals are not to be considered when<br />
developing minimum flows and levels. In essence, during development of an MFL<br />
existing uses will not be ‘grandfa<strong>the</strong>red’ but <strong>the</strong> District is directed to evaluate and<br />
account <strong>for</strong> <strong>the</strong> effects of previous structural alterations on a watercourse when<br />
assessing <strong>the</strong> potential <strong>for</strong> withdrawals to cause significant harm.<br />
Each water management district must also consider, and at its discretion may provide<br />
<strong>for</strong>, <strong>the</strong> protection of non-consumptive uses in <strong>the</strong> establishment of MFLs (Section<br />
373.042, F.S.). In addition, a baseline condition <strong>for</strong> <strong>the</strong> protected resource functions<br />
must be identified through consideration of changes and structural alterations in <strong>the</strong><br />
hydrologic system (Section 373.042(1), F.S.). In <strong>the</strong> case of <strong>the</strong> present evaluation,<br />
<strong>the</strong>re are major physical alterations and several existing consumptive use withdrawals.<br />
Given <strong>the</strong> above definitions, a basic function of minimum flows is to ensure that <strong>the</strong><br />
hydrologic requirements of natural systems associated with lakes, streams, rivers and<br />
estuaries are met and not jeopardized by excessive withdrawals. In turn, establishing<br />
minimum flows is important <strong>for</strong> water supply planning, because it affects how much water<br />
is available <strong>for</strong> withdrawal. Mere adoption of minimum flows does not protect a<br />
waterbody from significant harm nor regulate water availability. It is <strong>the</strong> application of<br />
minimum flows through planning and regulatory mechanisms that ensure <strong>the</strong> hydrologic<br />
requirements of natural systems are met. Intrinsically this identifies <strong>the</strong> amount of water<br />
available <strong>for</strong> o<strong>the</strong>r uses.<br />
As will be fur<strong>the</strong>r developed within this report, <strong>the</strong> primary function of <strong>the</strong> TBC is to<br />
divert floodwaters from Temple Terrace and downtown <strong>Tampa</strong>. The TBC is<br />
fundamentally a stormwater conveyance system engineered to efficiently move large<br />
flood flows. That efficiency comes at <strong>the</strong> expense of shallow bathymetry, shoreline and<br />
vegetation. Much of <strong>the</strong> environmental harm can be traced to excessively high flows<br />
and <strong>the</strong> presence of physical structures, which truncate <strong>the</strong> estuary functions. For <strong>the</strong><br />
TBC MFL determination, <strong>the</strong> flood control function may not be compromised and takes<br />
priority over protection of water resources. By statute, <strong>the</strong> structural alterations<br />
necessary to accomplish flood control must be accepted. While it may be possible to<br />
mitigate some of <strong>the</strong>se impacts through operational changes, <strong>the</strong> statutory MFL<br />
mandate is to determine <strong>the</strong> point at which less water becomes ecologically damaging.<br />
1.3 WATER RESOURCE FUNCTION<br />
Each surface water body or aquifer serves an array of water resource functions. These<br />
functions must be considered when establishing MFLs as a basis <strong>for</strong> defining significant<br />
harm. The term “water resource” is used throughout Chapter 373, F.S. Water resource<br />
functions protected by Chapter 373, F.S. are broad, as illustrated in Section 373.016, F.S.<br />
These functions include flood control, water quality protection, water supply and storage,<br />
fish and wildlife protection, navigation, and recreation.<br />
________________________________________________________________________________________________________<br />
1.0 Purpose of <strong>Minimum</strong> <strong>Flows</strong> and Levels<br />
1-2
_________________________________________________________________________________________________<br />
May 15, 2005 Draft<br />
According to <strong>the</strong> State Water Resources Implementation Rule (Chapter 62-40.473,<br />
Florida Administrative Code) “…consideration shall be given to <strong>the</strong> protection of water<br />
resources, natural seasonal fluctuations in water flows or levels, and environmental<br />
values associated with coastal, estuarine, aquatic and wetlands ecology, including:<br />
1. Recreation in and on <strong>the</strong> water;<br />
2. Fish and wildlife habitats and <strong>the</strong> passage of fish;<br />
3. Estuarine resources;<br />
4. Transfer of detrital material;<br />
5. Maintenance of freshwater storage and supply;<br />
6. Aes<strong>the</strong>tic and scenic attributes;<br />
7. Filtration and absorption of nutrients and o<strong>the</strong>r pollutants;<br />
8. Sediment loads;<br />
9. Water quality; and<br />
10. Navigation.”<br />
<strong>Minimum</strong> flows will also be used <strong>for</strong> long range planning. Since <strong>the</strong> establishment of<br />
minimum flows can potentially restrict <strong>the</strong> allocation of water, <strong>the</strong> setting of minimum<br />
flows will not go unnoticed, or unquestioned. For this reason, <strong>the</strong> science upon which a<br />
minimum flow is based, <strong>the</strong> assumptions made, and <strong>the</strong> policies used to establish an<br />
MFL need to be clearly specified. The District’s policy is to convene an independent<br />
peer review panel to review individual MFLs or to review protocols used to establish<br />
MFLs.<br />
The legislative consideration of structural alterations is particularly important to <strong>the</strong> TBC<br />
minimum flow and level because <strong>the</strong> system has been highly altered with hardened<br />
shorelines and multiple control structures. In addition, <strong>the</strong> presence of <strong>the</strong> control<br />
structure at <strong>the</strong> Hillsborough Reservoir regulates <strong>the</strong> quantity of water diverted into, or<br />
out of <strong>the</strong> TBC. These existing structural modifications also serve to direct <strong>the</strong> technical<br />
approach used to establish an MFL. For example, maintenance of riparian<br />
hydroperiods is an inappropriate criterion <strong>for</strong> this system, but maintenance of a healthy<br />
salinity regime is an appropriate evaluation metric.<br />
1.4 GEOGRAPHIC DEFINITIONS<br />
For purposes of this report, <strong>the</strong> term “TBC MFL” refers to development of a minimum<br />
flow, or flow regime <strong>for</strong> <strong>the</strong> ecological resources between structure S-160 and <strong>the</strong> 22 nd<br />
Street Causeway crossing at <strong>the</strong> sou<strong>the</strong>rn downstream end of McKay Bay. Distances in<br />
river km are measured from <strong>the</strong> Causeway, which by definition is km zero. Structure S-<br />
160 is located at river km 7.4. For analytical reasons, segmentation commences at a<br />
point coinciding with river km –0.2 in order to take advantage of a long-term monitoring<br />
station located just south of <strong>the</strong> Causeway.<br />
“McKay Bay” refers to those waters nor<strong>the</strong>ast of <strong>the</strong> Causeway to <strong>the</strong> confluence of <strong>the</strong><br />
<strong>for</strong>mer Palm River (approximately 2.1 km upstream of <strong>the</strong> Causeway) and “Palm River”<br />
________________________________________________________________________________________________________<br />
1.0 Purpose of <strong>Minimum</strong> <strong>Flows</strong> and Levels<br />
1-3
_________________________________________________________________________________________________<br />
May 15, 2005 Draft<br />
refers to <strong>the</strong> dredged and channelized water body from that point to S-160. The “McKay<br />
Bay/TBC complex” refers to <strong>the</strong> waters included in <strong>the</strong> TBC MFL.<br />
1.5 ECOLOGIC INTEGRITY AND SIGNIFICANT HARM<br />
To justify adoption of a minimum flow <strong>for</strong> purposes of maintaining ecologic integrity, it<br />
will be necessary to demonstrate <strong>the</strong> effects of implementation and compliance with <strong>the</strong><br />
proposed MFLs will have with site-specific in<strong>for</strong>mation. As stated by Richter et al. (1966)<br />
“A goal of ecosystem management is to sustain ecosystem integrity by<br />
protecting native biodiversity and <strong>the</strong> ecological (and evolutionary) processes<br />
that create and maintain that diversity. Faced with <strong>the</strong> complexity inherent in<br />
natural systems even in <strong>the</strong> absence of structural changes, achieving that goal<br />
will require that resource managers explicitly describe desired ecosystem<br />
structure, function, and variability; characterize differences between current and<br />
desired conditions; define ecologically meaningful and measurable indicators<br />
that can mark progress toward ecosystem management and restoration goals;<br />
and incorporate adaptive strategies into resource management plans”.<br />
As described in Florida’s legislative requirement to develop minimum flows, <strong>the</strong><br />
minimum flow is to prevent “significant harm” to <strong>the</strong> state’s water resources. Within <strong>the</strong><br />
context of <strong>the</strong> rule, an MFL is not a restorative, or optimal flow nor is it a return to<br />
historic flow (SWFWMD, 2001). The goal of a minimum flow is not to duplicate a premodification<br />
hydrologic regime, but ra<strong>the</strong>r to establish <strong>the</strong> threshold(s) at which<br />
significant harm occurs. If withdrawals have already significantly harmed <strong>the</strong> resource,<br />
it may be necessary to develop a recovery plan.<br />
1.6 COMPONENTS OF A MINIMUM FLOW AND LEVEL<br />
Beecher (1990) notes that in most statutes, “it is difficult to ei<strong>the</strong>r ascertain legislative<br />
intent or determine if a proposed instream flow regime would satisfy <strong>the</strong> legislative<br />
purpose”. Beecher argues (as cited by Stalnaker et al. 1995) that an instream flow<br />
standard should include <strong>the</strong> following elements:<br />
1) A goal, or goals<br />
2) Identification of <strong>the</strong> resources of interest to be protected;<br />
3) A unit of measure (e.g., flow in cubic feet per second, habitat in usable area,<br />
inundation to a specific elevation <strong>for</strong> a specified duration);<br />
4) A benchmark period.<br />
1.7 SUMMARY OF APPROACH<br />
Several different approaches have been used by <strong>the</strong> District to determine <strong>the</strong> minimum<br />
flow regime <strong>for</strong> rivers. From a biological perspective, a minimum flow regime may be<br />
set with <strong>the</strong> intent of protecting a specific habitat type(s), or <strong>the</strong> MFL may be set on <strong>the</strong><br />
________________________________________________________________________________________________________<br />
1.0 Purpose of <strong>Minimum</strong> <strong>Flows</strong> and Levels<br />
1-4
_________________________________________________________________________________________________<br />
May 15, 2005 Draft<br />
basis of habitat requirements of one or several indicator species. It is anticipated that in<br />
<strong>the</strong> short term (over <strong>the</strong> next several years), minimum flows <strong>for</strong> biologic purposes will<br />
often be set from <strong>the</strong> perspective of protecting particular habitat types (e.g.,<br />
macroinvertebrate habitat), particularly in situations where we do not yet have adequate<br />
data to do o<strong>the</strong>rwise. In contrast and where sufficiently strong direct relationships<br />
between freshwater inflow and biological resources exist, <strong>the</strong> most conservative<br />
relationship will serve to protect <strong>the</strong> resources.<br />
The determination of desirable minimum flows in TBC first involved identification of<br />
resources believed to be significant to <strong>the</strong> water body. In this regard, a rich database<br />
has been assembled through <strong>the</strong> ef<strong>for</strong>ts of Environmental Protection Commission<br />
Hillsborough County (EPCHC), <strong>Tampa</strong> Bay National Estuary Program (now <strong>Tampa</strong> Bay<br />
Estuary Program, TBEP), <strong>Tampa</strong> Bay Water (TBW), City of <strong>Tampa</strong> (COT), SWFWMD<br />
and <strong>the</strong>ir contractors. Much has been written about <strong>the</strong> region and a set of goals was<br />
identified from <strong>the</strong> results of prior studies. Thus, following <strong>the</strong> suggestion of Beecher,<br />
<strong>the</strong> elements of <strong>the</strong> TBC MFL become:<br />
Goals:<br />
1. Maintain appropriate salinity regime <strong>for</strong> maintenance of healthy riparian<br />
vegetation, oyster reefs, benthic infauna communities and fish.<br />
a. Establish and maintain adequate dissolved oxygen levels in support of <strong>the</strong><br />
first goal.<br />
2. Resource(s) Protected : Oysters, fish, invertebrates, riparian vegetation, and<br />
benthos<br />
3. Measurement Unit : Salinity, abundance, diversity, acres<br />
4. Benchmark Period : 1983 – Present<br />
The ‘benchmark’ definition warrants additional clarification. Construction of <strong>the</strong> TBC was<br />
completed (see Chapter 2 <strong>for</strong> construction details) in December 1982. Thus, defining<br />
<strong>the</strong> start of <strong>the</strong> ‘baseline period’ in January 1983 is justifiable. However, significant<br />
withdrawals and diversions of water have occurred during <strong>the</strong> baseline period and <strong>the</strong><br />
measured flows since 1983 do not represent a true baseline flow. For purposes of <strong>the</strong><br />
present evaluation, <strong>the</strong> ‘baseline flow’ represents a reconstructed flow at S-160 derived<br />
by reinstating all water supply diversion/withdrawals, but retaining all of <strong>the</strong> historical<br />
flood-control diversions in <strong>the</strong> flow record.<br />
While <strong>the</strong> proposed approach takes into account several factors, ultimately what<br />
constitutes “significant harm” will be determined by <strong>the</strong> Governing Board of <strong>the</strong><br />
SWFWMD.<br />
Sometimes <strong>the</strong> relationship between flow and <strong>the</strong> protected resource(s) does not exhibit<br />
obvious inflection points that unequivocally identify ‘significant harm’, but ra<strong>the</strong>r exhibit a<br />
continuum of linear degradation. Figure 1-1 illustrates <strong>the</strong> difference <strong>for</strong> a hypo<strong>the</strong>tical<br />
response variable where <strong>the</strong>re is a clear break in <strong>the</strong> non-linear response between 80<br />
and 70 percent of <strong>the</strong> baseline flow. In cases of a linear response, it is necessary to<br />
________________________________________________________________________________________________________<br />
1.0 Purpose of <strong>Minimum</strong> <strong>Flows</strong> and Levels<br />
1-5
_________________________________________________________________________________________________<br />
May 15, 2005 Draft<br />
establish a policy of what constitutes an unacceptable harm. For purposes of <strong>the</strong><br />
present evaluation, a fifteen percent loss of resource from baseline was adopted as <strong>the</strong><br />
acceptable limit. This choice is consistent with <strong>the</strong> District ‘s draft Alafia River MFL<br />
[SWFWMD, 2004] in which a 15% loss of habitat was deemed <strong>the</strong> maximum acceptable<br />
value. Although a fifteen percent loss is recommended as a measure of unacceptable<br />
loss, it is important to note that percentage changes employed <strong>for</strong> o<strong>the</strong>r instream flow<br />
determinations have ranged from ten to thirty-three percent. For example, Dunbar et al.<br />
(1998) in reference to <strong>the</strong> use of a habitat suitability model (PHABSIM) noted “an<br />
alternative approach is to select <strong>the</strong> flow giving 80% habitat exceedance percentile”:<br />
which is equivalent to a twenty percent decrease. Jowette (1993) used a guideline of<br />
one-third loss existing habitat at naturally occurring low flows, but acknowledged that ,<br />
“[n]o methodology exists <strong>for</strong> <strong>the</strong><br />
100<br />
100<br />
Function_plot.grf selection of a percentage loss of<br />
“natural” habitat which would be<br />
considered acceptable”.<br />
Percent of<br />
Baseline Inflow<br />
90<br />
80<br />
70<br />
60<br />
50<br />
Non-Linear Response<br />
Linear Response<br />
1 0.8 0.6 0.4 0.2 0<br />
Fraction of Baseline<br />
Resource Response<br />
90<br />
80<br />
70<br />
60<br />
50<br />
The State of Texas has used similar<br />
targets in establishing MFL <strong>for</strong> <strong>the</strong><br />
Matagorda Bay. Under Texas water<br />
code (Sec. 11.1491) a task <strong>for</strong>ce of <strong>the</strong><br />
Texas Parks and Wildlife Department<br />
and <strong>the</strong> Texas Natural Resource<br />
Conservation Commission are jointly<br />
tasked with <strong>the</strong> responsibility to<br />
determine inflow conditions necessary<br />
<strong>for</strong> bays and estuaries. In establishing<br />
<strong>the</strong> minimum flow <strong>for</strong> Matagorda Bay,<br />
one constraint imposed was that <strong>the</strong><br />
productivity of nine species (from a list<br />
of finfish and shellfish) should be<br />
maintained at eighty percent of<br />
historical average 1 .<br />
In a like manner, a 10 th percentile of <strong>the</strong><br />
Figure 1-1 Examples of Linear and baseline flow record (low-flow<br />
Non-Linear Response Variable threshold, ‘LFT’) was adopted as <strong>the</strong><br />
lowest flow evaluated. That is, only ten<br />
percent of <strong>the</strong> long-term flows will be<br />
lower or equal to this value. For <strong>the</strong> baseline flow, <strong>the</strong> 10<br />
th percentile S-160 value is 30<br />
cfs (19.4 mgd). This choice is based on both District and State of Texas precedents.<br />
The current WUP <strong>for</strong> <strong>the</strong> Peace River is set at <strong>the</strong> 13 th percentile and <strong>the</strong> District’s<br />
Regional Water Supply Plan (SWFWMD, 2001) has chosen <strong>the</strong> 15 th low-flow percentile<br />
as <strong>the</strong> lower limit of evaluation <strong>for</strong> planning purposes.<br />
1 http://www.tpwd.state.tx.us/texaswater/coastal/freshwater/matagorda/matagorda.phtml<br />
________________________________________________________________________________________________________<br />
1.0 Purpose of <strong>Minimum</strong> <strong>Flows</strong> and Levels<br />
1-6
_________________________________________________________________________________________________<br />
May 15, 2005 Draft<br />
In addition, in <strong>the</strong> nationally recognized and peer-reviewed report Freshwater Inflows to<br />
Texas Bays and Estuaries, (Longley, W.L, ed. 1994) <strong>the</strong> staff of <strong>the</strong> Texas Water<br />
Development Board and Texas Parks and Wildlife Department recommended use <strong>the</strong><br />
10 th percentile low-flow threshold <strong>for</strong> evaluation of minimum flow. All Texas estuarine<br />
(Trinity-San Jacinto estuary 2 , Guadalupe 3 , Neuses 4 ) MFL determinations have imposed<br />
a constraint that <strong>the</strong> optimal flows are found between <strong>the</strong> 10 th percentile and <strong>the</strong> 50 th<br />
percentile, effectively setting <strong>the</strong> lowest flow to be evaluated at <strong>the</strong> 10 th percentile.<br />
1.8 FLOWS AND LEVELS<br />
Although somewhat semantical, <strong>the</strong>re is a distinction between flows, levels and volumes<br />
that should be appreciated. All terms apply to <strong>the</strong> setting of “minimum flows” <strong>for</strong> flowing<br />
(lotic) waters. The term “flow” may most legitimately equate to water velocity. A certain<br />
flow or velocity of water may be required to physically move particles heavier than<br />
water. For example, silt and clay are moved by relatively low flows, but progressively<br />
higher flows are required to transport sand, or larger sized sediment downstream. In<br />
estuaries, <strong>the</strong>se seaward flows are met with incoming flood tides that cause a reduction<br />
in net flow, resulting in settling and deposition of sediments. Thus, <strong>the</strong> velocity is an<br />
important factor is determining <strong>the</strong> sediment composition. <strong>Flows</strong> may be important as a<br />
cue <strong>for</strong> some organisms; <strong>for</strong> example, certain fish species search out areas of<br />
freshwater inflow <strong>for</strong> reproduction and may move against flow or into areas of reduced<br />
or low flow to spawn.<br />
Discharge, on <strong>the</strong> o<strong>the</strong>r hand, refers to <strong>the</strong> volume of water moving past a point, and<br />
depending on <strong>the</strong> size of <strong>the</strong> stream (cross sectional area), similar volumes of water can<br />
be moved with quite large differences in <strong>the</strong> rate of flow (velocity). The volume of water<br />
moved through a stream can be particularly important to an estuary. It is <strong>the</strong> volume of<br />
freshwater that mixes with salt water that determines what <strong>the</strong> salinity in a fixed area of<br />
an estuary will be. This is especially important <strong>for</strong> organisms that require a certain<br />
range of salinity. The relative volumes of fresh and marine water determine salinity, not<br />
<strong>the</strong> flow rate per se; <strong>the</strong>re<strong>for</strong>e, volume ra<strong>the</strong>r than flow is <strong>the</strong> important variable to <strong>the</strong>se<br />
biota. As will be fur<strong>the</strong>r discussed, in <strong>the</strong> present case <strong>the</strong> volume of <strong>the</strong> original Palm<br />
River is miniscule in comparison to <strong>the</strong> present dredged system. Thus, inflows<br />
comparable to historical freshwater flows are largely ineffective at diluting <strong>the</strong> large<br />
volumes of saline bay water moving upstream on flood tides.<br />
Establishing a minimum water level is given less focus in estuarine settings because<br />
level is dominated by <strong>the</strong> tidal range. Changes in water level resulting from changes in<br />
freshwater input are generally masked by <strong>the</strong> tides. Thus, <strong>for</strong> <strong>the</strong> present evaluation,<br />
<strong>the</strong> minimum flow determination of <strong>the</strong> TBC MFL is expressed as a rate of freshwater<br />
discharge into <strong>the</strong> estuary.<br />
2 http://www.tpwd.state.tx.us/texaswater/coastal/freshwater/galveston_bay/galveston.phtml<br />
3 http://www.tpwd.state.tx.us/texaswater/coastal/freshwater/guadalupe/guadalupe.phtml<br />
4 http://www.tpwd.state.tx.us/texaswater/coastal/freshwater/nueces/nueces.phtml<br />
________________________________________________________________________________________________________<br />
1.0 Purpose of <strong>Minimum</strong> <strong>Flows</strong> and Levels<br />
1-7
_________________________________________________________________________________________________<br />
May 15, 2005 Draft<br />
1.9 CONTENT OF REMAINING CHAPTERS 5<br />
Chapter One has summarized <strong>the</strong> requirements and rationale <strong>for</strong> developing minimum<br />
flows and levels in general. The remainder of this document considers <strong>the</strong> development<br />
of MFLs specific to <strong>the</strong> <strong>Tampa</strong> <strong>Bypass</strong> <strong>Canal</strong> system in particular. Chapter 2 provides a<br />
Basin Description and <strong>the</strong> History of <strong>the</strong> TBC including an overview of previous attempts<br />
to develop an MFL <strong>for</strong> this system. The hydrology and current water uses are also<br />
discussed in Chapter 2 along with pertinent prior and on-going studies. Studies<br />
commissioned specifically <strong>for</strong> <strong>the</strong> TBC MFL determination by <strong>the</strong> District are briefly<br />
described in Chapter 2.<br />
A discussion of Ecological Resources can be found in Chapter 3, which establishes <strong>the</strong><br />
ecological basis <strong>for</strong> <strong>the</strong> MFL. The Chapter opens with an evaluation of salinity<br />
requirements of oysters, followed by a description of vegetation and birds. Chapter 3<br />
continues with a discussion of <strong>the</strong> use of McKay Bay/TBC by fish and invertebrates (a<br />
key resource of <strong>the</strong> system), followed by an examination of <strong>the</strong> of <strong>the</strong> benthic<br />
community. Water quality (salinity/dissolved oxygen/flow relationships) logically follows<br />
as <strong>the</strong> benthic community of McKay Bay/TBC is largely shaped by periods of hypoxia<br />
(acute low oxygen). Finally, <strong>the</strong> development of a mechanistic hydrodynamic/salinity<br />
model is described at <strong>the</strong> conclusion of Chapter 3. The Technical Approach is<br />
summarized in Chapter 4, followed by a discussion of <strong>the</strong> Recommended TBC MFL in<br />
Chapter 5.<br />
5 With <strong>the</strong> exceptions noted and <strong>for</strong> consistency with o<strong>the</strong>r SWFWMD documents, <strong>the</strong> British system of<br />
measurement units will primarily be used in this report. A table of conversion follows <strong>the</strong> Table of<br />
Contents. River distance is noted in kilometers from <strong>the</strong> mouth and water quality sample depths are<br />
reported in meters.<br />
________________________________________________________________________________________________________<br />
1.0 Purpose of <strong>Minimum</strong> <strong>Flows</strong> and Levels<br />
1-8
May 15, 2005 Draft<br />
CHAPTER 2 - BASIN DESCRIPTION AND HISTORY<br />
2.1 GEOGRAPHIC SETTING<br />
The <strong>Tampa</strong> <strong>Bypass</strong> <strong>Canal</strong> system consists of McKay Bay and a box-cut drainage canal<br />
situated in <strong>the</strong> Nor<strong>the</strong>ast corner of <strong>Tampa</strong> Bay (Figure 2-1). The system consists of<br />
McKay Bay and <strong>the</strong> dredged remnants of <strong>the</strong> Palm River. Dredging activities by <strong>the</strong><br />
Army Corps of Engineers (ACOE) have radically altered <strong>the</strong> physical characteristics.<br />
Prior to 1970, <strong>the</strong> Palm River and Six Mile Creek drained about 40 square miles above<br />
McKay Bay and south/sou<strong>the</strong>ast of <strong>the</strong> Hillsborough River watershed (HDR, 1994).<br />
Originally <strong>the</strong> entire drainage was known as Six Mile Creek (USC&GS, 1879. USDA<br />
Bureau of Soils, 1916), but during <strong>the</strong> 1920’s <strong>the</strong> name “Palm River” was used to<br />
identify <strong>the</strong> lower 2 miles at <strong>the</strong> confluence with McKay Bay (HDR, 1994). The<br />
headwaters were located east of <strong>Tampa</strong> Reservoir (also known as <strong>the</strong> Hillsborough<br />
River Reservoir) where flow originated from Eureka Springs and seepage springs in a<br />
flat, wet prairie called Harney Flats (Menke et al., 1961; Motz, 1975). These springs<br />
provided <strong>the</strong> base flow <strong>for</strong> Six Mile Creek, which flowed southward about 6.8 miles to<br />
join <strong>the</strong> Palm River and <strong>the</strong>n flowed 1.9 mile to McKay Bay. The Palm River and Six<br />
Mile Creek were excavated to <strong>for</strong>m <strong>the</strong> TBC during <strong>the</strong> period 1966 - 1982 in order to<br />
divert Hillsborough River floodwaters to McKay Bay, bypassing <strong>the</strong> cities of Temple<br />
Terrace and <strong>Tampa</strong>.<br />
Historically, <strong>the</strong> Palm River at McKay Bay was approximately 650 feet wide, but<br />
narrowed to 200 feet above Maydell Drive. The width (USGS, 1956) at present day S-<br />
160 was 50 feet and nautical charts indicated a depth of 5.5 feet at McKay Bay and 3.5<br />
feet at 0.5 mile (0.8 km) upstream. The width of <strong>the</strong> Palm River was increased by as<br />
Table 2-1<br />
Upstream Distance of Structures<br />
Place Name<br />
Km<br />
Upstream<br />
22nd St. Causeway 0.0<br />
Palm River Begins 2.1<br />
50th St. 3.2<br />
Power Line / RR 3.6<br />
Maydel Drive 5.0<br />
CrossTown Exprwy 6.7<br />
SR 60 / Adamo 6.9<br />
RR 7.1<br />
S-160 7.5<br />
RR 8.4<br />
Broadway 8.5<br />
US 301 9.9<br />
MLK Drive 10.7<br />
much as twelve times over pre-construction and<br />
deepened. The cross section was increased as<br />
much as 100 times in some areas. Overall, <strong>the</strong><br />
estimated post-construction volume is estimated<br />
to be 13 times greater than pre-development.<br />
Thus, <strong>for</strong> a given volume of freshwater<br />
introduced at this point, it would be<br />
approximately 10 times less effective at dilution<br />
than during pre-construction conditions. Figure<br />
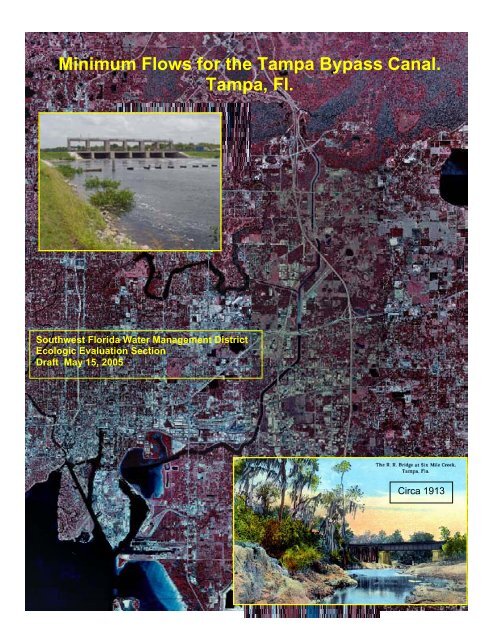
2-2 is a photograph of <strong>the</strong> present (1999) land<br />
use illustrating recognizable landmarks and<br />
Table 2-1 provides distances upstream of <strong>the</strong><br />
22 nd Street Causeway. Figure 2-3 is taken from<br />
a post card (circa 1913) and illustrates a shallow<br />
flood plain with a lightly incised and meandering<br />
riverbed.<br />
_____________________________________________________________________________________________________<br />
____________________________________<br />
2.0 Basin Description & History 2-1
Old <strong>Tampa</strong><br />
Bay<br />
May 15, 2005 Draft<br />
McKay Bay<br />
Drainage<br />
TBC<br />
Drainage<br />
<strong>Tampa</strong> Bay<br />
Hillsborough<br />
Bay<br />
Figure 2-1 Location of McKay Bay / TBC Complex<br />
_________________________________________________________________________________________________________________________________________<br />
2.0 Basin Description & History<br />
2-1
May 15, 2005 Draft<br />
US 301<br />
#<br />
#<br />
#<br />
MLK Drive<br />
Broadway<br />
#<br />
#<br />
RR<br />
50th St.<br />
#<br />
#<br />
Power Line / RR<br />
Maydel Drive<br />
#<br />
#<br />
S-160<br />
#<br />
#<br />
RR<br />
#<br />
SR 60 / Adamo<br />
CrossTown Exprwy<br />
22nd St. Causeway<br />
#<br />
Figure 2-2 Present Land Use and Place Names<br />
_________________________________________________________________________________________________________________________________________<br />
2.0 Basin Description & History<br />
2-2
May 15, 2005 Draft<br />
2.2 REGIONAL<br />
RAINFALL<br />
Average daily<br />
rainfall in <strong>the</strong><br />
Hillsborough/Palm<br />
River basin during<br />
1983-2002 was<br />
estimated by<br />
calculating <strong>the</strong><br />
mean daily rainfall<br />
from a series of<br />
long-term rainfall<br />
gages located<br />
throughout <strong>the</strong><br />
watershed region<br />
(PBS&J, 2003a).<br />
Figure 2-3 Six Mile Creek circa 1913<br />
Analyses of longterm<br />
rainfall<br />
patterns in <strong>the</strong> Hillsborough River watershed show that repeating patterns of sequential<br />
years with lower than average rainfall have occurred throughout <strong>the</strong> historic period of<br />
record (1976-1978, 1989-1991, 1999-2001). Over <strong>the</strong> 20-year period, <strong>the</strong> average<br />
yearly total was 51.6 inches <strong>for</strong> <strong>the</strong> Hillsborough River watershed. The lowest yearly<br />
total occurred in 1984 with 42.9 inches and <strong>the</strong> highest yearly total was observed in<br />
1996 with 70.9 inches of rain over <strong>the</strong> watershed.<br />
Long-term rainfall data shows that high monthly rainfalls commonly occur even during<br />
relatively very dry years. During periodic El Niño events, monthly rainfall totals during <strong>the</strong><br />
typically drier months (from December to March) can be as high as those that are typically<br />
observed during a normal summer wet season. Conversely, years with relatively high total<br />
rainfalls characteristically have a number of months with low total monthly rainfall levels.<br />
Historically, <strong>the</strong> summer wet season has often started as early as late May, resulting in<br />
April being <strong>the</strong> overall driest month of <strong>the</strong> year in terms of rainfall, followed by October<br />
and November.<br />
2.3 PALM RIVER / TAMPA BYPASS CANAL WATERSHED CHARACTERISTICS<br />
The Palm River/<strong>Tampa</strong> <strong>Bypass</strong> <strong>Canal</strong> watershed is located in Hillsborough County, east<br />
of <strong>the</strong> City of Temple Terrace to <strong>the</strong> north and east of <strong>the</strong> COT to <strong>the</strong> south. Interstate 75<br />
passes through <strong>the</strong> watershed in a north-south direction. The Seaboard Coastline<br />
Railroad roughly borders <strong>the</strong> watershed along its south side. The watershed is<br />
approximately 28 square miles, (18,000 acres) in size and is drained by two water bodies:<br />
<strong>the</strong> <strong>Tampa</strong> <strong>Bypass</strong> <strong>Canal</strong> (TBC) and <strong>the</strong> Harney <strong>Canal</strong>. The TBC flows in a north-south<br />
direction while <strong>the</strong> Harney <strong>Canal</strong> flows in an east-west direction in <strong>the</strong> Harney Flats area<br />
from <strong>the</strong> Hillsborough River be<strong>for</strong>e discharging into <strong>the</strong> middle of <strong>the</strong> TBC.<br />
_____________________________________________________________________________________________________<br />
2.0 Basin Description & History<br />
2-1
May 15, 2005 Draft<br />
Land surface elevations range from near sea level to over 100 feet National Geodetic<br />
Vertical Datum (NGVD 1929) in <strong>the</strong> nor<strong>the</strong>astern areas of <strong>the</strong> watershed. The majority of<br />
<strong>the</strong> TBC and <strong>the</strong> Harney <strong>Canal</strong> lie between elevations 0 and 25 feet NGVD. The nor<strong>the</strong>rn<br />
section of <strong>the</strong> TBC, upstream from S-159, is between sand ridges of <strong>the</strong> City of Temple<br />
Terrace and <strong>the</strong> area south of Lake Thonotosassa. The TBC watershed is part of <strong>the</strong><br />
Hillsborough River drainage basin, which lies in <strong>the</strong> Floridian Section of <strong>the</strong> Atlantic<br />
Coastal Plain.<br />
The largest land use in <strong>the</strong> basin is residential at 32.1 percent. This category consists of<br />
low-, medium-, and high-density single-family housing and mobile homes. The second<br />
largest land use is agricultural at 26.3 percent (PBS&J, 2003a). The watershed is<br />
traversed by three major transportation arteries, Interstate 75, Interstate 4, and U.S.<br />
Highway 301, that make <strong>the</strong> TBC watershed a prime area <strong>for</strong> commercial, industrial, and<br />
residential development.<br />
2.4 CONSTRUCTION OF TBC<br />
The present TBC was constructed as an Army Corps of Engineering (ACOE) flood<br />
control project between 1967 and 1983. The Palm River and Six Mile Creek were<br />
excavated to depths of 20 feet, widened to 500 - 630 feet and armored with rip rap to<br />
divert flood waters around Temple Terrace and downtown <strong>Tampa</strong>. The project was one<br />
component of <strong>the</strong> ACOE state-wide Four River Basins drainage project that<br />
commenced following wide-spread flooding in <strong>the</strong> wake of Hurricane Donna in 1960. In<br />
1961, <strong>the</strong> Florida legislature created SWFWMD to be <strong>the</strong> local sponsor of <strong>the</strong> Corps<br />
Four River Basins project.<br />
Under its original concept, <strong>the</strong> project was to consist of an extensive system of flood<br />
storage reservoirs and control facilities extending south from <strong>the</strong> Green Swamp and<br />
encompassing <strong>the</strong> Oklawaha, Withlacoochee, Peace, and Hillsborough River basins.<br />
However, because of ecological and environmental considerations raised during <strong>the</strong><br />
1970’s, <strong>the</strong> local project was condensed to <strong>the</strong> construction of <strong>the</strong> TBC (SWFWMD,<br />
1990). The TBC extends about 14 miles from Cow House Creek in <strong>the</strong> Lower<br />
Hillsborough Flood Detection Area (LHFDA) to McKay Bay at <strong>the</strong> mouth of <strong>the</strong> Palm<br />
River.<br />
Land acquisition along <strong>the</strong> canal right-of-way occupied early phases of <strong>the</strong> project. The<br />
initial phase of construction, begun in mid-1966 and completed in January of 1969,<br />
consisted of enlarging <strong>the</strong> natural channel of <strong>the</strong> Palm River to its confluence with McKay<br />
Bay and constructing S-160 (SWFWMD, 1990). Structure S-160 was completed in 1969<br />
(Table 2-2 and Figure 2-4). Since 1970, channelization has extended Six Mile Creek<br />
west and north to intersect <strong>the</strong> Hillsborough River at two points: <strong>the</strong> confluence of Trout<br />
Creek and near <strong>the</strong> midpoint of <strong>the</strong> <strong>Tampa</strong> Reservoir. Flow at <strong>the</strong> control structures is<br />
regulated by manipulation of vertical lift gates and slide gates (USGS, 1983).<br />
_____________________________________________________________________________________________________<br />
2.0 Basin Description & History<br />
2-2
May 15, 2005 Draft<br />
Figure 2-4 TBC Construction Completion Dates<br />
Structures S-162 and S-159 are primarily used to minimize <strong>the</strong> TBC impact on <strong>the</strong><br />
regional hydrology, particularly in <strong>the</strong> Harney Flats area. The TBC is made up of two<br />
canals; <strong>the</strong> Harney <strong>Canal</strong> (C-136) that runs from <strong>the</strong> <strong>Tampa</strong> Reservoir to join <strong>the</strong> second<br />
and longer canal, C-135, which connects <strong>the</strong> Hillsborough River at Trout Creek to <strong>the</strong><br />
Palm River (SWFWMD, 1999).<br />
The canal is divided into three principal pools: <strong>the</strong> upper, middle, and lower pools. The<br />
TBC pools are separated by flow control structures. Each structure consists of multiple<br />
vertical lift gates that seat on <strong>the</strong> crest of a weir. A collection of overflow weirs is located<br />
at <strong>the</strong> top of each lift gate to control <strong>the</strong> upstream pool stage during low and moderate<br />
flows. TBC bottom widths and elevations range from 400 feet at elevation –21.0 feet<br />
NGVD (1929) near McKay Bay to 200 feet at elevation 16.0 feet NGVD at Cow House<br />
Creek.<br />
_____________________________________________________________________________________________________<br />
2.0 Basin Description & History<br />
2-3
May 15, 2005 Draft<br />
Structure 155, located on <strong>the</strong> Hillsborough River upstream of Fletcher Avenue, and<br />
Structure 163 on Cow House Creek control <strong>the</strong> flow into <strong>the</strong> upper pool. Closing<br />
Structure 155 causes water to back up into <strong>the</strong> LHFDA and flow into <strong>the</strong> TBC upper pool.<br />
Flow can also enter <strong>the</strong> upper pool from Cow House Creek. This flow, controlled by<br />
Structure 163, may back up into <strong>the</strong> LHFDA if Structure 159 is closed. The middle pool<br />
consists of <strong>the</strong> main channel and a reach called <strong>the</strong> Harney <strong>Canal</strong>. Structure 162 controls<br />
flow from <strong>the</strong> middle to <strong>the</strong> lower pool. At <strong>the</strong> downstream end of <strong>the</strong> lower pool,<br />
Structure 160 controls <strong>the</strong> flow into <strong>the</strong> remains of <strong>the</strong> Palm River and finally into McKay<br />
Bay (SWFWMD, 1999).<br />
The Harney <strong>Canal</strong>, at 9,000 feet in length, connects <strong>the</strong> TBC middle pool to <strong>the</strong> COT’s<br />
surface water reservoir on <strong>the</strong> Hillsborough River. Structure 161 is located near <strong>the</strong><br />
confluence of <strong>the</strong> Harney <strong>Canal</strong> and Hillsborough River and controls flow from <strong>the</strong><br />
reservoir during flooding. A pump station is located at S-161, which is used to augment<br />
<strong>the</strong> reservoir <strong>for</strong> <strong>the</strong> COT water supply. Hillsborough River flow can be diverted to <strong>the</strong><br />
upper pool as water supply augmentation <strong>for</strong> <strong>Tampa</strong> Bay Water (TBW) through <strong>the</strong><br />
control structure.<br />
One construction artifact of significance is an elevated sill located where <strong>the</strong> US-41 bridge<br />
(50 TH St.) crosses <strong>the</strong> canal (km 3.2). The ACOE, fearful of undermining <strong>the</strong> bridge<br />
pilings, did not dredge close to <strong>the</strong> bridge leaving a physical sill that acts like a hydraulic<br />
barrier and traps deeper water<br />
upstream.<br />
Table 2-2<br />
Construction History of <strong>the</strong> TBC<br />
Item<br />
ID<br />
Start<br />
Date<br />
Completion<br />
Date<br />
<strong>Canal</strong> 1A May-66 Aug-67<br />
Control Structure S-160 May-67 Jan-69<br />
<strong>Canal</strong> 1B Apr-68 Jul-72<br />
<strong>Canal</strong> 1C & 2 Nov-70 Dec-73<br />
<strong>Canal</strong> 3A Nov-72 Feb-75<br />
<strong>Canal</strong> 3B Feb-75 Jun-77<br />
Control Structure S-162 Apr-75 Mar-77<br />
<strong>Canal</strong> C-136 Jun-75 Apr-77<br />
Control Structure S-161 Jun-75 Nov-77<br />
<strong>Canal</strong> 4A Mar-76 Jan-79<br />
<strong>Canal</strong> 4B Jan-77 Dec-82<br />
Levee L-112 (South) Jan-77 Dec-82<br />
Control Structure S-155 Apr-78 Nov-82<br />
Control Structure S-163 Apr-78 Nov-82<br />
Levee L-112 (North) Apr-78 Nov-82<br />
Control Structure S-159 Middle Mar-79 Aug-81<br />
Control Structure S-159 Lower Mar-79 Aug-81<br />
Control Structure S-159 Upper Jun-79 Nov-82<br />
After Bacelo, 1985<br />
The TBC can carry 12,000 cfs<br />
from <strong>the</strong> LHFDA <strong>for</strong> a combined<br />
total of 16,000 cfs at S-162. The<br />
lower pool, constructed in <strong>the</strong><br />
channels of Six Mile Creek and<br />
Palm River, was designed to<br />
direct a maximum flow of 26,700<br />
cfs. Besides controlling water<br />
levels, S-160 acts as a physical<br />
barrier and prevents <strong>the</strong> upstream<br />
migration of saline water from<br />
McKay Bay.<br />
During construction of <strong>the</strong> TBC, a<br />
breach occurred to <strong>the</strong> underlying<br />
Upper Floridan Aquifer System at<br />
several locations. The breach<br />
resulted in a hydraulic connection<br />
between <strong>the</strong> <strong>Canal</strong> and <strong>the</strong><br />
Floridan Aquifer and an exchange<br />
of water between <strong>the</strong> two systems<br />
_____________________________________________________________________________________________________<br />
2.0 Basin Description & History<br />
2-4
May 15, 2005 Draft<br />
(Geraghty and Miller, Inc., 1982). This was predicted to produce considerable drainage<br />
from <strong>the</strong> aquifer and drawdown over a large area. Because of this, <strong>the</strong> District<br />
suggested, and <strong>the</strong> ACOE approved, <strong>the</strong> inclusion of an additional control structure (S-<br />
162) near <strong>the</strong> S.R. 574A Bridge over <strong>the</strong> TBC. The most severe impacts would have<br />
occurred in <strong>the</strong> Harney Flats – Eureka Springs section, where <strong>the</strong> potentiometric<br />
surface stood 8 to 10 feet above <strong>the</strong> design pool elevation. Whereas structure S-160<br />
alone was intended to maintain a pool elevation of 10 feet above mean sea level, <strong>the</strong><br />
additional structure (S-162) was designed to maintain a 12-15 feet above mean sea<br />
level pool level upstream to S-159 (SWFWMD, 1990).<br />
A digital model-based study by USGS suggested that <strong>the</strong> total area within which <strong>the</strong><br />
drop in <strong>the</strong> potentiometric surface would have been one foot or greater would be<br />
reduced from 48 to 24 square miles as a result of adding S-162 (Motz, 1975).<br />
Subsequently (Knutilla and Corral. 1984) <strong>the</strong> USGS showed that construction of <strong>the</strong><br />
TBC had increased base flow by 1.5 to 2 times pre-construction values in <strong>the</strong> vicinity of<br />
Structure 160.<br />
Construction of <strong>the</strong> TBC affected groundwater inflows and outflows to <strong>the</strong> <strong>Tampa</strong><br />
Reservoir and <strong>the</strong> frequency of zero-discharge days. The breach of <strong>the</strong> Upper Floridan<br />
Aquifer System has increased groundwater inflow to <strong>the</strong> canal by approximately 31 cfs<br />
(20 mgd) (Knutilla and Corral, 1984). However, <strong>the</strong> fraction of this flow that originated in<br />
<strong>the</strong> vicinity of <strong>the</strong> <strong>Tampa</strong> Reservoir has not been quantified. Augmentation of <strong>the</strong><br />
reservoir with water from <strong>the</strong> TBC since <strong>the</strong> mid 1980s has returned some or all of <strong>the</strong><br />
water lost by increased groundwater seepage from <strong>the</strong> reservoir.<br />
The canal system first operated <strong>for</strong> flood control purposes in September 1985, when<br />
Hurricane Elena stalled off <strong>the</strong> central Florida Gulf Coast. A storm in March 1987<br />
marked <strong>the</strong> first time water was diverted from <strong>the</strong> Hillsborough River to <strong>the</strong> TBC system<br />
via <strong>the</strong> Harney <strong>Canal</strong> (C-136) (Water & Air Research, Inc., 1988). The system was<br />
operated twice during 1988 including <strong>the</strong> landfall of Tropical Storm Keith (SWFWMD,<br />
1990). More recently, <strong>the</strong> system was operated at thirty-seven percent capacity during<br />
back-to-back hurricanes in <strong>the</strong> summer of 2004 when 10,000 cfs were discharged<br />
through S –160.<br />
2.5 HYDROLOGY ABOVE S-160<br />
n addition to <strong>the</strong> TBC drainage above S-160, <strong>the</strong>re is an additional 13 square miles of<br />
ungaged drainage to <strong>the</strong> TBC and an additional 33 square miles which drain directly to<br />
McKay Bay as illustrated in Figure 2-5 and summarized in Table 2-3. Of historical and<br />
hydrologic significance is <strong>the</strong> fact that that <strong>the</strong> 28 square mile watershed above S-160 in<br />
1960 is now hydraulically connected to a watershed in excess of 630 square miles<br />
through <strong>the</strong> Harney <strong>Canal</strong> and structure S-161. Prior to construction of <strong>the</strong> TBC, <strong>the</strong><br />
USGS maintained a gage (0231800) on Six Mile Creek at <strong>the</strong> present location of S-160<br />
from 1957 until 1997, but no records exist <strong>for</strong> <strong>the</strong> period October 1974 until November<br />
of 1985.<br />
_____________________________________________________________________________________________________<br />
2.0 Basin Description & History<br />
2-5
May 15, 2005 Draft<br />
UCETA YARD DRAIN<br />
UNNAMED<br />
DITCH<br />
YBOR CITY DRAIN<br />
COW HOUSE CREEK<br />
BELLOWS LAKE<br />
OUTLET<br />
TAMPA BYPASS CANAL<br />
MANGO DRAIN<br />
DELANEY CREEK<br />
BLACK POINT DRAIN<br />
BLACK POINT CHANNEL<br />
Figure 2-5 McKay Bay / TBC<br />
Drainage Basins<br />
From October 1974 to June 1990, <strong>the</strong><br />
USGS estimated flows (0231802) at a<br />
point slightly upstream of S-160 based on<br />
canal stage and gate operation records<br />
provided by <strong>the</strong> District. Since <strong>the</strong>n, <strong>the</strong><br />
District has estimated flow. Uncertainties<br />
exist in <strong>the</strong> estimated flows because <strong>the</strong><br />
weir equations used to calculate flow<br />
have never been field calibrated and<br />
past<br />
structure operations records are poor<br />
(SWFWMD, 1999) and often <strong>the</strong> flow<br />
calculated at <strong>the</strong> upstream site is greater<br />
than at <strong>the</strong> downstream S-160 gage site.<br />
It is also likely that <strong>the</strong> flows measured<br />
this point were affected by various<br />
upstream dredging and de-watering<br />
activities throughout <strong>the</strong> construction<br />
period.<br />
at<br />
In August 2002, TBW assumed <strong>the</strong> responsibility of operating <strong>the</strong> structures on <strong>the</strong> TBC<br />
except <strong>for</strong> flood control events. At <strong>the</strong> same time, TBW reconstructed what is generally<br />
Table 2-3<br />
TBC/McKay Bay Drainage Areas<br />
Sub-Basin<br />
Drainage Receiving<br />
Area (mi 2 ) Water<br />
<strong>Tampa</strong> <strong>Bypass</strong> <strong>Canal</strong> 25.6 TBC<br />
Uceta Yard Drain 2.8 TBC<br />
Bellows Lake Outlet 2.0 TBC<br />
Mango Drain 8.3 TBC<br />
Ybor City Drain 9.7 McKay Bay<br />
Delany Creek 18.4 McKay Bay<br />
Black Point Channel 2.0 McKay Bay<br />
Black Point Drain 1.2 McKay Bay<br />
Unnamed Ditch 2.0 McKay Bay<br />
Hillsborough River @<br />
Reservoir or TBC<br />
630<br />
Fowler Avenue<br />
via Harney <strong>Canal</strong><br />
accepted as <strong>the</strong> best estimate of<br />
S-160 discharges from 1974 to<br />
present. A fundamental<br />
hydrologic question is whe<strong>the</strong>r<br />
McKay Bay is receiving more, or<br />
less freshwater compared to pre-<br />
TBC conditions. On one hand,<br />
<strong>the</strong>re is a potential <strong>for</strong> huge<br />
increases through <strong>the</strong> Harney<br />
<strong>Canal</strong>, but <strong>the</strong>re have also been<br />
significant withdrawals and<br />
diversion to <strong>the</strong> Hillsborough<br />
reservoir.<br />
In order to characterize <strong>the</strong><br />
change in rainfall/runoff<br />
response at S-160, <strong>the</strong> flow<br />
record <strong>for</strong> calendar years 1957 through 2001 was normalized to annual inches of runoff,<br />
(assuming <strong>the</strong> original 28 mi 2 watershed <strong>for</strong> consistency) and compared to similar sized<br />
watersheds in <strong>Tampa</strong> Bay. A list of watersheds used is given in Table 2-4 provides <strong>the</strong><br />
drainage area and period of record. Figure 2-6 compares pre-1983 runoff at S-160 with<br />
post-1983 runoff and with surrounding watersheds. Figure 2-6 indicates that small,<br />
regional watersheds in <strong>the</strong> area averaged 13 inches of streamflow over <strong>the</strong> period of<br />
_____________________________________________________________________________________________________<br />
2.0 Basin Description & History<br />
2-6
May 15, 2005 Draft<br />
record. Six Mile Creek, because<br />
of additional spring flow was<br />
historically larger. However,<br />
since 1983, sixteen of <strong>the</strong> twenty<br />
annual yields at S-160 have<br />
exceeded 30 inches/year and <strong>the</strong><br />
average <strong>for</strong> <strong>the</strong> decade ending in<br />
2001 was 44 inches.<br />
It should be noted that <strong>the</strong>se are<br />
“net” changes at S-160 after<br />
considering <strong>the</strong> increased<br />
groundwater input (~ 15 in/yr) ,<br />
flood contol discharges and <strong>the</strong><br />
diversions/withdrawals <strong>for</strong> water<br />
supply. Never<strong>the</strong>less, <strong>the</strong> results<br />
suggest that on average McKay<br />
Bay is probably receiving twice<br />
as much freshwater as it did<br />
historically and that this water is<br />
delivered through a conveyance<br />
that is approximately 10 times<br />
pre-<br />
[See Section 2.0] larger than<br />
construction. Yet, as will be<br />
subsequently discussed, <strong>the</strong><br />
Annual Runoff (in)<br />
100<br />
10<br />
1<br />
30 40 50 60 70 80 90<br />
Six Mile - Post 1983<br />
Six Mile-Pre 1983<br />
Rocky Creek (14.9"/yr)<br />
Sweetwater (12.1"/Yr)<br />
Trout Creek (12.1"/Yr)<br />
Normalized_inches.grf<br />
Average of Sweetwater, Trout<br />
and Rocky Creek = 13.1 inches<br />
30 40 50 60 70 80 90<br />
Annual Rainfall (in)<br />
(Average COSME and Plant City)<br />
Figure 2-6 Regional Runoff/Rainfall<br />
Relationships (1957-2001)<br />
McKay Bay/Palm River system remains a moderately high-saline environment because<br />
<strong>the</strong> increase in conveyance efficiency works both ways and allows saline water from<br />
<strong>Tampa</strong> Bay to migrate upstream.<br />
The rainfall/runoff comparison includes <strong>the</strong> impact of two extreme rainfall periods. The<br />
1991-2001 decade included an extended 4-year drought with an estimated return interval<br />
in excess of 86 years as well as an El Niño event during 1997-98. Figure 2-7 provides<br />
<strong>the</strong> mean and median annual<br />
discharge along with <strong>the</strong> annual<br />
average rainfall derived from <strong>the</strong><br />
daily average of <strong>the</strong> Plant City<br />
gage (District RNF #259) and<br />
COSME gage (District RNF #<br />
197). While <strong>the</strong>re are presently<br />
gages within <strong>the</strong> watershed,<br />
<strong>the</strong>se are <strong>the</strong> closest long-term<br />
gages (circa 1950-present) and<br />
are approximately equidistant to<br />
<strong>the</strong> watershed.<br />
Table 2-4<br />
Gage Sites Comparable to S-160<br />
Gage Name USGS #<br />
Period of<br />
Record<br />
Drainage<br />
Area (mi 2 )<br />
Six Mile Creek 2301800 1957-1997 28<br />
Rocky Creek 2307000 1953-Present 35<br />
Trout Creek 2303350 1974-Present 23<br />
Sweetwater Creek 2306500 1951-Present 7.4<br />
100<br />
10<br />
1<br />
_____________________________________________________________________________________________________<br />
2.0 Basin Description & History<br />
2-7
May 15, 2005 Draft<br />
1950 1960 1970 1980 1990 2000 2010<br />
Annual Rainfall (Inches)<br />
Discharge (cfs)<br />
40<br />
50<br />
60<br />
70<br />
80<br />
90<br />
600<br />
550<br />
500<br />
450<br />
400<br />
350<br />
300<br />
250<br />
200<br />
150<br />
100<br />
50<br />
0<br />
Mean Discharge<br />
Median Discharge<br />
Rain_Discharge.grf<br />
1950 1960 1970 1980 1990 2000 2010<br />
Figure 2-7 Historical Rainfall and<br />
Discharge <strong>for</strong> S-160<br />
2.6 HYDROLOGY BELOW S-160<br />
Freshwater discharge from <strong>the</strong><br />
watershed above S-160 is controlled<br />
through operation of vertical lift gates<br />
(Figure 2-8). Additional freshwater<br />
enters <strong>the</strong> Palm River/McKay Bay<br />
system as ungaged runoff and<br />
groundwater, and as point source<br />
discharges. Ungaged flows<br />
downstream of S-160 were estimated<br />
by HSW (2004) from rainfall/runoff and<br />
rainfall/baseflow regressions developed<br />
from model results produced by an<br />
integrated groundwater/surface water<br />
model.<br />
Point source discharge data were<br />
obtained as monthly averages from<br />
FDEP (Kevin Petrus, personal communication) and Janicki Environmental Inc. (Keith<br />
Hackett, personal communication). One of <strong>the</strong> discharges is from a domestic<br />
wastewater treatment facility (Faulkenburg Road AWT- FL0040614) operated by<br />
Hillsborough County and discharging an average (1985-2003) of 4.3 cfs (2.8 mgd)<br />
through a submerged discharge just below S-160. The second point source discharge<br />
is an industrial discharge from Trademark Nitrogen Corporation (FL0000647). This<br />
discharge averaged 0.14 cfs (0.09 mgd) <strong>for</strong> <strong>the</strong> same period and enters <strong>the</strong> Palm River<br />
through an unnamed ditch. For comparison, <strong>the</strong> discharge from S-160 averaged 158<br />
cfs (102 mgd) <strong>for</strong> <strong>the</strong> same period.<br />
The relative contribution of each source to<br />
McKay Bay is illustrated in Figure 2-9.<br />
Generally <strong>the</strong> contribution discharges through<br />
S-160 dominates <strong>the</strong> freshwater inputs, but<br />
during <strong>the</strong> drought conditions of 1999-2001 <strong>the</strong><br />
downstream ungaged flow and <strong>the</strong> point<br />
source discharges constituted an average of<br />
sixty- eight percent of <strong>the</strong> total flow.<br />
40<br />
50<br />
60<br />
70<br />
80<br />
90<br />
600<br />
550<br />
500<br />
450<br />
400<br />
350<br />
300<br />
250<br />
200<br />
150<br />
100<br />
50<br />
0<br />
The salinity in McKay Bay / TBC is <strong>the</strong> result of<br />
localized freshwater inflows and <strong>the</strong> salinity of<br />
<strong>the</strong> upper Hillsborough Bay which serves as a<br />
sort of boundary condition <strong>for</strong> TBC. It is<br />
<strong>the</strong>re<strong>for</strong>e in<strong>for</strong>mative to compare <strong>the</strong> relative<br />
contribution of freshwater flows to upper<br />
Figure 2-8 S-160 Lift Gates<br />
_____________________________________________________________________________________________________<br />
2.0 Basin Description & History<br />
2-8
May 15, 2005 Draft<br />
Hillsborough Bay near East Bay.<br />
Hillsborough Bay receives inflow from<br />
<strong>the</strong> Hillsborough River system, Alafia<br />
and <strong>the</strong> McKay Bay/TBC complex.<br />
A first order approximation of flow<br />
from <strong>the</strong> Hillsborough River (USGS,<br />
2004) was developed from reservoir<br />
release records (USGS # 2304500)<br />
plus an estimate of contribution from<br />
below <strong>the</strong> reservoir. A normalized<br />
yield (cfs/mi 2 ) was derived from <strong>the</strong><br />
USGS gage upstream of <strong>the</strong> reservoir<br />
at Morris Bridge Road (USGS<br />
23033330@375 mi<br />
2 ) and applied to<br />
<strong>the</strong> 43 square mile drainage area<br />
below <strong>the</strong> reservoir. (It is recognized<br />
that <strong>the</strong> normalized yield is an<br />
underestimate <strong>for</strong> <strong>the</strong> highly urbanized<br />
areas downstream of <strong>the</strong> reservoir,<br />
but <strong>the</strong> assumption is considered<br />
adequate <strong>for</strong> a gross comparison of<br />
flow contributed to upper Hillsborough<br />
Bay.)<br />
Fraction of Total Discharge<br />
Note - Point Source data limited to 1985 - 2003.<br />
1983<br />
1984<br />
1985<br />
1986<br />
1987<br />
1988<br />
1989<br />
1990<br />
The results are given in Figure 2-10<br />
and indicate that <strong>the</strong> boundary salinity<br />
in upper Hillsborough Bay is affected as much by <strong>the</strong> Hillsborough reservoir discharges<br />
and downstream flow as it is from <strong>the</strong> McKay Bay/TBC complex. On average (1983-<br />
2003) <strong>for</strong>ty-four percent of <strong>the</strong> flow originates in <strong>the</strong> Hillsborough basin and fifty-six<br />
percent from <strong>the</strong> McKay Bay/TBC basin. Discharge from S-160 represents only thirtytwo<br />
percent of all water discharging into upper Hillsborough Bay. Thus, from a resource<br />
management perspective, <strong>the</strong> S-160 discharge / salinity response is less direct because<br />
of <strong>the</strong> o<strong>the</strong>r freshwater sources affecting <strong>the</strong> boundary salinity.<br />
1.0<br />
0.9<br />
0.8<br />
0.7<br />
0.6<br />
0.5<br />
0.4<br />
0.3<br />
0.2<br />
0.1<br />
0.0<br />
Fraction of Discharge to McKay Bay<br />
(1983 - 2003)<br />
S-160<br />
Ungaged Below S-160<br />
Point Sources<br />
Pct_McKay.grf<br />
1991<br />
1992<br />
1993<br />
1994<br />
1995<br />
1996<br />
1997<br />
1998<br />
1999<br />
2000<br />
2001<br />
2002<br />
2003<br />
1983<br />
1984<br />
1985<br />
1986<br />
1987<br />
1988<br />
1989<br />
1990<br />
1991<br />
1992<br />
1993<br />
1994<br />
1995<br />
1996<br />
1997<br />
1998<br />
1999<br />
2000<br />
2001<br />
2002<br />
2003<br />
Figure 2-9 Relative Contribution of<br />
Freshwater to McKay Bay. Annual<br />
Average 1983-2003<br />
1.0<br />
0.9<br />
0.8<br />
0.7<br />
0.6<br />
0.5<br />
0.4<br />
0.3<br />
0.2<br />
0.1<br />
0.0<br />
2.7 EXISTING TBC WATER USERS<br />
Presently <strong>the</strong> COT and TBW are permitted to withdraw water from <strong>the</strong> TBC <strong>for</strong> water<br />
supply. The COT was historically depended on four sources to meet water supply<br />
demands: <strong>the</strong> <strong>Tampa</strong> Reservoir, <strong>the</strong> Morris Bridge well field, <strong>the</strong> TBC, and Sulphur<br />
Springs. The COT’s history of water use begins 1920 with <strong>the</strong> <strong>Tampa</strong> reservoir (an<br />
impoundment of <strong>the</strong> Hillsborough River near present day Rowlett Park). The first full<br />
year of recorded withdrawals from <strong>the</strong> Hillsborough reservoir was 1946 when 23 cfs (15<br />
mgd) were withdrawn. Demand continuously increased and in 1985, <strong>the</strong> COT began to<br />
augment <strong>the</strong> reservoir from <strong>the</strong> TBC via <strong>the</strong> Harney <strong>Canal</strong> (SWFWMD, 1999). For <strong>the</strong><br />
_____________________________________________________________________________________________________<br />
2.0 Basin Description & History<br />
2-9
May 15, 2005 Draft<br />
Fraction of Total Discharge<br />
1.0<br />
0.9<br />
0.8<br />
0.7<br />
0.6<br />
0.5<br />
0.4<br />
0.3<br />
0.2<br />
0.1<br />
0.0<br />
1983<br />
Fraction of Discharge to Hillsborough Bay<br />
(1983 - 2003)<br />
1985<br />
Note - Point Source data limited to 1985 - 2003.<br />
1987<br />
Hillsborough River<br />
Ungaged + Point Source Below S-160<br />
S-160<br />
1989<br />
1991<br />
1983<br />
1984<br />
1985<br />
1986<br />
1987<br />
1988<br />
1989<br />
1990<br />
1991<br />
1992<br />
1993<br />
Date<br />
Pct_Hills.grf<br />
1994<br />
1995<br />
1996<br />
1997<br />
1998<br />
1999<br />
2000<br />
2001<br />
2002<br />
2003<br />
Figure 2-10 Relative<br />
Contribution of Freshwater to<br />
Upper Hillsborough Bay. Annual<br />
Average 1983-2003.<br />
1993<br />
1995<br />
1997<br />
1999<br />
2001<br />
2003<br />
0.0<br />
0.1<br />
0.2<br />
0.3<br />
0.4<br />
0.5<br />
0.6<br />
0.7<br />
0.8<br />
0.9<br />
1.0<br />
period 1985 through 2003, augmentation<br />
from <strong>the</strong> TBC by <strong>the</strong> COT has averaged<br />
12.4 cfs (8.0 mgd), with daily peaks as<br />
high as 70 cfs (45 mgd).<br />
Withdrawals from <strong>the</strong> TBC are regulated by<br />
augmentation schedules that are based on<br />
water levels in <strong>the</strong> <strong>Tampa</strong> Reservoir and<br />
Hillsborough River flows at Morris Bridge<br />
Road. A joint water use permit was issued<br />
to <strong>the</strong> COT and <strong>the</strong> West Coast Regional<br />
Water Supply Authority (WCRWSA, now<br />
<strong>Tampa</strong> Bay Water <strong>for</strong>med in 1998) in 1990<br />
<strong>for</strong> withdrawals from <strong>the</strong> TBC. The permit<br />
established that augmentation from <strong>the</strong> TBC<br />
would not occur until water levels in <strong>the</strong><br />
reservoir recede to 21.0 feet NGVD during<br />
<strong>the</strong> months of March through June, or to<br />
19.0 feet NGVD during <strong>the</strong> months of July<br />
through February. To maintain <strong>the</strong> stability<br />
of Structure 161, withdrawals <strong>for</strong><br />
augmentation would also not be allowed<br />
when water levels in <strong>the</strong> middle pool,<br />
including Harney <strong>Canal</strong>, are below 12.0 feet<br />
NGVD. Augmentation would also not be<br />
allowed when water levels in <strong>the</strong> <strong>Tampa</strong><br />
Reservoir are above 22.5 feet NGVD, which<br />
is full reservoir stage. In addition to <strong>the</strong>se<br />
limitations, provisions required additional “mitigation” augmentation from <strong>the</strong> TBC when<br />
withdrawals from <strong>the</strong> reservoir exceeded 96 cfs (62 mgd) during periods of low flow at <strong>the</strong><br />
Hillsborough River Dam (SWFWMD, 1999).<br />
In 1993, upon request from <strong>the</strong> WCRWSA and <strong>the</strong> COT, <strong>the</strong> District modified <strong>the</strong> joint<br />
water use permit so that augmentation from <strong>the</strong> TBC could occur when water levels in <strong>the</strong><br />
reservoir recede to 21.0 feet<br />
NGVD on a year-round basis.<br />
Also, in response to <strong>the</strong> City and<br />
WCRWSA’s request, <strong>the</strong> permit<br />
was modified so that<br />
augmentation would cease when<br />
water levels in <strong>the</strong> reservoir<br />
recovered to 22.0 feet NGVD<br />
(SWFWMD, 1999).<br />
Table 2-5<br />
<strong>Tampa</strong> Bay Water Permit Limits<br />
TAMPA BYPASS WITHDRAWAL SCHEDULE<br />
S-160 flow Withdrawal Rate<br />
< 7 mgd (11cfs) 0<br />
7 – 35 mgd (11-54 cfs) Excess above 7 mgd<br />
35 – 81 mgd (54-125 cfs) 80% of total flow<br />
> 81 mgd 65 mgd (100cfs)<br />
_____________________________________________________________________________________________________<br />
2.0 Basin Description & History<br />
2-10
May 15, 2005 Draft<br />
In November 1996, <strong>the</strong> District authorized <strong>the</strong> WCRWSA/COT to implement a trial<br />
schedule that would allow augmentation from <strong>the</strong> TBC anytime water levels in <strong>the</strong><br />
reservoir fell below 22.5 feet NGVD. This schedule was <strong>for</strong>mally adopted in <strong>the</strong> water use<br />
permit <strong>for</strong> augmenting <strong>the</strong> reservoir with water from <strong>the</strong> canal. Prior to 1999, <strong>the</strong> TBC<br />
was generally used to augment <strong>the</strong> Hillsborough Reservoir <strong>for</strong> short periods during <strong>the</strong><br />
dry season months of April, May, June, and December (SWFWMD, 1999). Figure 2-11<br />
(reproduced with permission from TBW) illustrates <strong>the</strong> complex nature of <strong>the</strong>se permits.<br />
The current WUP allows TBW to both divert water to <strong>the</strong> TBC from <strong>the</strong> Hillsborough<br />
River and to withdraw water from <strong>the</strong> Middle and Lower pools of <strong>the</strong> TBC (Table 2-5).<br />
Diversion began in August 2002. During <strong>the</strong> period that COT transfers have occurred<br />
(1985 through 2003), TBW has diverted an average of 4.5 cfs (2.9 mgd) to <strong>the</strong> TBC <strong>for</strong><br />
water supply from <strong>the</strong> Hillsborough River above <strong>the</strong> reservoir. Of this water, TBW has<br />
removed an average 2.8 cfs (1.8 mgd) from <strong>the</strong> middle pool and 1 cfs (0.6 mgd) from<br />
<strong>the</strong> lower pool during this period. Not all of <strong>the</strong> water transferred to <strong>the</strong> TBC <strong>for</strong> water<br />
supply has been withdrawn. Thus, <strong>the</strong> observed discharge at S-160 is at times<br />
augmented with water diverted from <strong>the</strong> Hillsborough River and baseline conditions will<br />
reflect a lower discharge than measured. These conditions are illustrated in Table 2-6<br />
which provides a portion of <strong>the</strong> water balance <strong>for</strong> a15-day period in September 2003.<br />
During this period, <strong>the</strong> measured discharge at S-160 was 42 percent augmented with<br />
water from <strong>the</strong> Hillsborough Reservoir.<br />
TBC withdrawals by TBW occur from a pumping station located canal-side near <strong>the</strong> Dr.<br />
Martin Lu<strong>the</strong>r King Jr. Boulevard at S-162. Intakes above and below S-162 terminate at<br />
<strong>the</strong> pump station, allowing withdrawal <strong>for</strong> one or both sides of <strong>the</strong> control structure. The<br />
<strong>Tampa</strong> Bay Water’s WUP application <strong>for</strong> <strong>the</strong> TBC anticipated withdrawing water up to a<br />
maximum of 100 cfs (65 mgd), with withdrawals beginning when <strong>the</strong> flow in <strong>the</strong> TBC is<br />
11 cfs (7 mgd). Because of concerns about <strong>the</strong> effect of reduced freshwater inflow to<br />
<strong>the</strong> <strong>Tampa</strong> Bay system from additional freshwater withdrawals, <strong>the</strong> EPCHC and<br />
Hillsborough County filed <strong>for</strong> arbitration on this project in October 1998. This arbitration<br />
was resolved, which allowed <strong>for</strong> <strong>the</strong> permitting and construction to proceed. The<br />
regional water plant was completed in September 2002.<br />
2.8 BASELINE FLOWS<br />
As described in Chapter 1.6, <strong>for</strong> purposes of <strong>the</strong> present evaluation <strong>the</strong> baseline flow at<br />
S-160 is defined as <strong>the</strong> flow that would have existed between 1983 and 2003 in <strong>the</strong><br />
absence of water supply manipulation. Figure 2-12 presents a cumulative distribution<br />
function of observed flows (S1) at S-160 and <strong>the</strong> flows that would have existed (S2)<br />
without water supply while companion Table 2-7 provides select percentile flows <strong>for</strong><br />
each.<br />
_____________________________________________________________________________________________________<br />
2.0 Basin Description & History<br />
2-11
Figure 3 – 11 (Reproduced with Permission, TBW)<br />
TBC / Hillsborough Reservoir Permitted Withdrawals<br />
_____________________________________________________________________________________________________________________________________________________________________________________________________________________________________________<br />
2.0 Basin Description & History 3-12
May 15, 2005 Draft<br />
Table 2-6<br />
Example of TBC Augmentation from Hillsborough Reservoir (cfs)<br />
Date<br />
S-160<br />
Measured<br />
Lower Pool<br />
Withdrawals<br />
Middle Pool<br />
Withdrawals<br />
Net Diversion<br />
From<br />
Reservoir Into<br />
TBC<br />
Baseline Flow @<br />
S-160 if No<br />
Withdrawals or<br />
Diversions<br />
09/15/03 127.3 0.0 58.0 115.4 69.9<br />
09/16/03 149.0 0.0 47.1 110.3 85.8<br />
09/17/03 120.7 0.0 77.3 102.7 95.3<br />
09/18/03 102.8 21.0 69.7 112.2 81.3<br />
09/19/03 121.6 3.4 83.2 115.0 93.2<br />
09/20/03 152.9 0.0 70.6 112.5 111.0<br />
09/21/03 146.7 0.0 65.8 112.3 100.2<br />
09/22/03 143.8 0.0 48.3 115.1 77.0<br />
09/23/03 127.8 0.0 73.3 115.9 85.2<br />
09/24/03 171.2 0.0 8.5 120.9 58.8<br />
09/25/03 172.2 0.0 49.9 85.4 136.7<br />
09/26/03 158.8 0.0 65.4 107.6 116.6<br />
09/27/03 155.7 0.0 50.5 115.5 90.7<br />
09/28/03 135.8 16.7 57.5 118.3 91.6<br />
09/29/03 167.3 0.0 64.5 82.7 149.2<br />
09/30/03 90.1 28.6 29.5 29.9 118.2<br />
Fraction of Data =1983)<br />
S-160 Without Water Supply<br />
S160_cdf.syc-D<br />
1.0<br />
10.0<br />
100.0<br />
1000.0<br />
(Note- 0.1 cfs Assigned to Zero Values)<br />
CFS<br />
10000.0<br />
Figure 2-12 S-160 <strong>Flows</strong> -<br />
Measured (S1) and Baseline<br />
(S2)<br />
Table 2-7<br />
Percentile <strong>Flows</strong> (cfs) @ S160<br />
S1=Observed, S2= Baseline<br />
Percentile S1 S2<br />
1% 0 0<br />
5% 0 20<br />
10% 0 30<br />
20% 16 45<br />
30% 35 55<br />
40% 54 61<br />
50% 65 72<br />
60% 82 86<br />
70% 103 104<br />
80% 130 130<br />
90% 206 209<br />
95% 386 390<br />
99% 3011 3023<br />
_____________________________________________________________________________________________________<br />
2.0 Basin Description & History<br />
2-13
May 15, 2005 Draft<br />
2.9 PERTINENT REPORTS AND SOURCES OF ENVIRONMENTAL DATA<br />
Throughout <strong>the</strong> years, a number of environmental sampling and reporting ef<strong>for</strong>ts have<br />
included McKay Bay/TBC in <strong>the</strong> larger context of <strong>the</strong> <strong>Tampa</strong> Bay region, or have focused<br />
directly on <strong>the</strong> McKay Bay/ TBC complex. For example, <strong>the</strong> Environmental Protection<br />
Commission Hillsborough County (EPCHC) has sampled water quality at three stations in<br />
McKay Bay/TBC since 1974 but those stations were part of a suite of 154 regularly<br />
sampled ambient stations throughout <strong>the</strong> <strong>Tampa</strong> Bay region. In contrast, PBS&J is<br />
presently engaged in an intense monitoring ef<strong>for</strong>t of <strong>the</strong> TBC that began in 2000 as a<br />
condition of <strong>the</strong> TBW water use permit (WUP). For most reports, agencies have<br />
combined data from o<strong>the</strong>r sources <strong>for</strong> evaluation. This section identifies and summarizes<br />
both <strong>the</strong> sources of environmental data pertinent TBC and <strong>the</strong> major conclusions of prior<br />
reports.<br />
2.10 TAMPA BAY NATIONAL ESTUARY PROGRAM – MINIMUM FLOWS<br />
ADVISORY GROUP<br />
In 1996, <strong>the</strong> District requested that <strong>the</strong> <strong>Tampa</strong> Bay National Estuary Program (now<br />
<strong>Tampa</strong> Bay Estuary Program, TBEP) convene a technical advisory group to provide<br />
suggestions <strong>for</strong> ecological criteria suitable <strong>for</strong> setting minimum flows in <strong>the</strong> lower<br />
Hillsborough and <strong>the</strong> McKay Bay/TBC complex. The group met <strong>for</strong> eight months and<br />
issued <strong>the</strong> following summary statements (TBEP, 1997) pertaining to <strong>the</strong> TBC:<br />
o The salinity gradient should be complete (zero to greater than 18 ppt)<br />
o The number of fish species and abundances are reduced when DO falls below 4<br />
mg/l.<br />
o TBC below structure 160 (S-160) offers minimum opportunity <strong>for</strong> vegetation<br />
under its present condition.<br />
o Maintaining a complete salinity gradient and meeting <strong>the</strong> dissolved oxygen (DO)<br />
criteria/goals may not be feasible using flow management on <strong>the</strong> Palm River/TBC<br />
o Analytical tools used to predict salinity and DO were limited due to <strong>the</strong> lack of<br />
low-flow (1-30 cubic feet per second) data.<br />
o <strong>Minimum</strong> flows on <strong>the</strong> Palm River/TBC should be set based on existing physical<br />
conditions, but should be re-evaluated if habitat restoration (e.g. filling of dredge<br />
hole, littoral zone habitat restoration on public lands) is completed.<br />
2.11 PREVIOUS MINIMUM FLOWS AND LEVELS REPORT FOR THE TAMPA<br />
BYPASS CANAL<br />
In 1996, amendments to <strong>the</strong> MFL (Section 373.042, F.S.) statute required that <strong>the</strong> District<br />
adopt minimum flows and levels <strong>for</strong> Hillsborough, Pasco, and Pinellas County <strong>for</strong> priority<br />
waters that are experiencing or may be expected to experience adverse impacts. In<br />
response to this legislative direction, <strong>the</strong> District established 41 minimum wetland levels,<br />
minimum levels <strong>for</strong> 15 lakes, seawater intrusion aquifer levels, narrative aquifer levels,<br />
and a minimum flow <strong>for</strong> <strong>the</strong> <strong>Tampa</strong> <strong>Bypass</strong> <strong>Canal</strong> (SWFWMD, 1999).<br />
_____________________________________________________________________________________________________<br />
2.0 Basin Description & History<br />
2-14
May 15, 2005 Draft<br />
Section 373.042, F.S., required <strong>the</strong> District to use <strong>the</strong> best available data to set minimum<br />
flows and levels. The legislature required MFLs to be set by October 1, 1997; and<br />
<strong>the</strong>re<strong>for</strong>e, <strong>the</strong>re was a limited time to collect additional in<strong>for</strong>mation. Because of this<br />
deadline, <strong>the</strong> District was constrained to use existing and limited data (SWFWMD, 1999).<br />
The process to develop <strong>the</strong> methods <strong>for</strong> determining minimum flows and levels was an<br />
open public process. Interested parties were invited to participate in <strong>the</strong> developing of<br />
methodologies to determine <strong>the</strong> limit at which significant harm occurs to <strong>the</strong> lakes,<br />
wetlands, surface watercourses, and aquifers. Following this public process, District staff<br />
finalized methodologies and minimum levels and flows <strong>for</strong> approval by <strong>the</strong> Governing<br />
Board. However, effective July 1, 1997, subparagraph 373.042 (1)(a), F.S., was added,<br />
which directed <strong>the</strong> District to consider changes and structural alterations to watersheds,<br />
surface waters, and aquifers and <strong>the</strong> effects of such changes and alterations. At <strong>the</strong><br />
Board’s direction, staff reviewed <strong>the</strong> previous work, additional data, and continued<br />
meetings and workshops with affected parties and held public workshops with <strong>the</strong><br />
Governing Board to ensure that <strong>the</strong> changes to <strong>the</strong> statute had been assimilated into <strong>the</strong><br />
methodologies (SWFWMD, 1999).<br />
On October 28, 1998, <strong>the</strong> Governing Board approved <strong>the</strong> subject minimum flows and<br />
levels. The determination of minimum flows <strong>for</strong> <strong>the</strong> TBC took into consideration <strong>the</strong><br />
extensive changes and structural alterations of <strong>the</strong> system. The width, depth, and volume<br />
of <strong>the</strong> TBC are much greater than <strong>the</strong> previous Six Mile Creek and Palm River that were<br />
excavated to <strong>for</strong>m <strong>the</strong> canal. These physical changes have greatly altered <strong>the</strong><br />
hydrographic, water quality, and ecological characteristics of <strong>the</strong> estuarine resources<br />
associated with <strong>the</strong> <strong>for</strong>mer Palm River. Construction of <strong>the</strong> canal also altered surface<br />
water/groundwater interactions in <strong>the</strong> vicinity as well as <strong>the</strong> quantities of fresh water<br />
contributed from <strong>the</strong> local drainage basin to <strong>the</strong> tidal receiving waters.<br />
Accounting <strong>for</strong> <strong>the</strong>se changes, <strong>the</strong> District evaluated <strong>the</strong> effects of various rates of<br />
freshwater flow from Structure 160 on salinity distributions, water quality and biological<br />
communities in <strong>the</strong> present day Palm River/McKay Bay estuarine system. Because of<br />
unique physical characteristics of <strong>the</strong> <strong>Tampa</strong> <strong>Bypass</strong> <strong>Canal</strong> and its primary use <strong>for</strong> flood<br />
control, <strong>the</strong> District did not evaluate ecological changes that could result from<br />
withdrawals over <strong>the</strong> entire flow range of this system. Instead, <strong>the</strong> District examined<br />
flow releases that should be maintained during dry periods to sustain <strong>the</strong> downstream<br />
estuary. Such regulations would require reductions in water use from <strong>the</strong> canal if <strong>the</strong><br />
minimum flows were not being met. The District concluded (SWFWMD, 1999) that <strong>the</strong><br />
minimum flow at Structure 160 could be zero, stating <strong>the</strong>re was not a logical rate of flow<br />
that should be maintained at Structure 160 and flows at <strong>the</strong> structure can periodically<br />
recede to zero cfs without requiring cutbacks in water use.<br />
The District stated this did not imply that flows at Structure 160 should be maintained at<br />
zero cfs indefinitely, as historical streamflow and water use data from <strong>the</strong> canal<br />
indicated that zero flow at Structure 160 would occur only periodically when <strong>the</strong> canal<br />
was used to augment water supplies in <strong>the</strong> Hillsborough River Reservoir, which was <strong>the</strong><br />
_____________________________________________________________________________________________________<br />
2.0 Basin Description & History<br />
2-15
May 15, 2005 Draft<br />
sole water use from <strong>the</strong> canal at <strong>the</strong> time of <strong>the</strong> 1999 report. Fur<strong>the</strong>rmore, <strong>the</strong> District<br />
stated that language in <strong>the</strong> proposed rule did not mean all waters discharging from <strong>the</strong><br />
<strong>Tampa</strong> <strong>Bypass</strong> <strong>Canal</strong> above zero cfs are automatically available <strong>for</strong> withdrawal, as <strong>the</strong><br />
allocation of water from <strong>the</strong> canal may be subjected to fur<strong>the</strong>r technical analyses and<br />
regulatory restrictions on withdrawal quantities in order to protect natural resources.<br />
The Palm River and McKay Bay system, in <strong>the</strong>ir current configuration, represent <strong>the</strong><br />
"baseline" from which "significant harm" is to be determined. The District concluded that<br />
<strong>the</strong> existing alterations of <strong>the</strong> Palm River resulted in a truncated estuary that is relatively<br />
insensitive to freshwater flow at S-160. Moreover, <strong>the</strong> District concluded that even though<br />
this system has substantial habitat limitations, a minimum flow of zero cubic feet per<br />
second (cfs) would not significantly alter <strong>the</strong> existing habitat quality or biological<br />
communities using that habitat. According to <strong>the</strong> District, a minimum flow of zero cfs<br />
would not result in a significant change from <strong>the</strong> existing baseline conditions in <strong>the</strong> Palm<br />
River/McKay Bay system (SWFWMD, 1999).<br />
2.12 PEER REVIEW<br />
In October 1998, <strong>the</strong> District proposed minimum flows and levels <strong>for</strong> <strong>the</strong> <strong>Tampa</strong> <strong>Bypass</strong><br />
<strong>Canal</strong>. Prior to <strong>for</strong>mal rule adoption of <strong>the</strong> TBC MFL, a peer review was requested by<br />
Hillsborough County, <strong>the</strong> Hillsborough County Environmental Protection Commission,<br />
Pinellas County, <strong>Tampa</strong> Bay Water, and <strong>the</strong> Environmental Confederation of <strong>Southwest</strong><br />
Florida. An independent scientific peer review panel (Panel) assembled, which was<br />
composed of recognized experts in <strong>the</strong> fields of estuarine biology/ecology, groundwater<br />
hydrology, hydrology, hydrogeology, limnology, and wetland biology/ecology (Bedient et<br />
al., 1999).<br />
The Panel was directed to evaluate previous data and <strong>the</strong> methods used by <strong>the</strong> District<br />
<strong>for</strong> proposing each MFL and to determine whe<strong>the</strong>r <strong>the</strong> methodology was scientifically<br />
reasonable by evaluating <strong>the</strong> scientific and technical analyses used by <strong>the</strong> District to<br />
develop <strong>the</strong> MFL (Bedient et al., 1999).<br />
On <strong>the</strong> surface, <strong>the</strong> analyses conducted by <strong>the</strong> District appeared to support this<br />
position. However, <strong>the</strong> Panel did not feel that <strong>the</strong> available data and <strong>the</strong> empirical<br />
approach taken provided an adequate basis <strong>for</strong> setting a <strong>Minimum</strong> Flow of zero at <strong>the</strong><br />
time of <strong>the</strong> decision. The Panel reported that ‘ . . . . <strong>the</strong> most significant discrepancy is<br />
that <strong>the</strong> District assumes that it can set a <strong>Minimum</strong> Flow of zero without giving full<br />
consideration to <strong>the</strong> frequency or duration of zero flow periods’. Thus, <strong>the</strong> panel felt that<br />
<strong>the</strong> <strong>Minimum</strong> Flow <strong>for</strong> <strong>the</strong> TBC was not supported by <strong>the</strong> data (Bedient et al., 1999).<br />
The Panel was charged with specific tasks to determine if <strong>the</strong> data and analyses<br />
conducted by <strong>the</strong> District supported <strong>the</strong> District’s decision. These include: (1)<br />
Summarize methodology used to establish MFL; (2) Evaluate scientific reasonableness;<br />
(3) Evaluate deficiencies; and (4) Evaluate preferred methodologies.<br />
_____________________________________________________________________________________________________<br />
2.0 Basin Description & History<br />
2-16
May 15, 2005 Draft<br />
The Panel concluded that <strong>the</strong> majority of sources, especially those cited and used<br />
directly by <strong>the</strong> District (SWFWMD, 1999) were found to be highly reliable. The<br />
in<strong>for</strong>mation utilized by <strong>the</strong> District <strong>for</strong> calculations, comparisons, and report findings<br />
were generally based on sound methodologies. The Panel also concluded that<br />
sufficient quality assurance assessments were per<strong>for</strong>med on source data and specific<br />
data results were often repeated by independent sources with consistent results<br />
(Bedient et al., 1999).<br />
Based on <strong>the</strong> Panel’s review of <strong>the</strong> available in<strong>for</strong>mation, it appeared that <strong>the</strong> District<br />
had considered most of <strong>the</strong> applicable in<strong>for</strong>mation sources in its analysis. However, <strong>the</strong><br />
“best in<strong>for</strong>mation available” was only as of July 1997, and most of <strong>the</strong> reports made<br />
reference to <strong>the</strong> need <strong>for</strong> a more in-depth analysis to provide a greater number of<br />
sampling points to support <strong>the</strong> conclusions. These studies also had minimal data of<br />
ei<strong>the</strong>r water quality or ecological function based on flows at or near <strong>the</strong> District’s<br />
proposed zero <strong>Minimum</strong> Flow.<br />
2.12.1 Peer Review -Technical Assumptions<br />
The Panel discussed several basic flaws in <strong>the</strong> technical assumptions presented in <strong>the</strong><br />
District’s TBC analysis (SWFWD, 1999). In <strong>the</strong> Panel’s opinion, <strong>the</strong> most significant<br />
discrepancy was that <strong>the</strong> District assumed that it could set a <strong>Minimum</strong> Flow of zero<br />
without giving full consideration to <strong>the</strong> frequency or duration of zero flow periods. The<br />
frequency and duration are critical factors in determining <strong>the</strong> impact of a <strong>Minimum</strong> Flow<br />
on <strong>the</strong> biological resources in <strong>the</strong> Palm River/McKay Bay system. However, <strong>the</strong><br />
proposed <strong>Minimum</strong> Flow provided no constraints on <strong>the</strong> duration or frequency of zero<br />
flow periods (Bedient et al., 1999).<br />
2.12.2 Peer Review – Analysis of Procedures<br />
In <strong>the</strong> technical analysis, <strong>the</strong> District evaluated <strong>the</strong> relationship between rates of<br />
freshwater discharge at S-160 to a number of physical, chemical, and biological<br />
parameters measured in <strong>the</strong> Palm River/McKay Bay system. The Panel described<br />
several major flaws in this analysis. First, <strong>the</strong> data sets were substantially limited and<br />
did not provide an adequate basis <strong>for</strong> <strong>the</strong> conclusions presented in this analysis.<br />
Second, <strong>the</strong> statistics in <strong>the</strong> District’s analysis did not provide a basis <strong>for</strong> accurately<br />
predicting <strong>the</strong> effects of zero flow conditions on <strong>the</strong> water quality or biota of <strong>the</strong> Palm<br />
River/McKay Bay system. Finally, <strong>the</strong> District failed to consider <strong>the</strong> effects of <strong>the</strong><br />
frequency and duration of zero flow periods on <strong>the</strong> water quality or biota on <strong>the</strong> Palm<br />
River/McKay Bay system (Bedient et al., 1999). In essence, while <strong>the</strong> Panel<br />
acknowledged that <strong>the</strong> District had used <strong>the</strong> ‘best available data’. The Panel opined<br />
that <strong>the</strong> best available data was insufficient to support <strong>the</strong> District’s conclusions.<br />
For <strong>the</strong> relationship between flow and DO during <strong>the</strong> WAR/SDI study, <strong>the</strong> regression<br />
analyses confirmed a strong negative correlation between DO levels and temperature.<br />
However, no significant correlations were observed between <strong>the</strong> 14-day average flow at<br />
S-160 and DO at each of <strong>the</strong> downstream stations over <strong>the</strong> 3-year period of study. The<br />
study reported that <strong>the</strong> analyses suggested that DO levels throughout <strong>the</strong> Palm<br />
_____________________________________________________________________________________________________<br />
2.0 Basin Description & History<br />
2-17
May 15, 2005 Draft<br />
River/McKay Bay system were generally insensitive to changes in flow at S-160.<br />
However, <strong>the</strong>se analyses did not directly address <strong>the</strong> potential effects of a zero<br />
minimum flow on <strong>the</strong> DO levels in <strong>the</strong> estuary (Bedient et al., 1999).<br />
The panel felt that Coastal Environmental (1997) regression analysis that was designed<br />
to address <strong>the</strong> zero minimum flow as proposed by <strong>the</strong> District had several factors that<br />
limited its usefulness. First, <strong>the</strong> regression equations that were derived from <strong>the</strong> same<br />
data had <strong>the</strong> same limitations of <strong>the</strong> o<strong>the</strong>r analyses, i.e., temporal resolution. In<br />
addition, spatial resolution was significantly more limited than 0.1-mile intervals as <strong>the</strong><br />
model suggested. Finally, <strong>the</strong> data set only included a few points at <strong>the</strong> critical zero<br />
flow ranges. As with <strong>the</strong> WAR/SDI (1997) study, <strong>the</strong> regression analyses employed<br />
were constrained by <strong>the</strong> quality of <strong>the</strong> data set.<br />
The Coastal Environmental (1997) study also examined regression analysis of<br />
dissolved oxygen and flow. As previously discussed, <strong>the</strong> regression analyses were<br />
based on empirical relationships and were limited by <strong>the</strong> available data. Although <strong>the</strong>se<br />
analyses support <strong>the</strong> District’s conclusion that DO levels in <strong>the</strong> Palm River were<br />
relatively insensitive to variations in discharge from S-160 in <strong>the</strong> 0 to 200-cfs range, <strong>the</strong><br />
limits of <strong>the</strong> data set and <strong>the</strong> regression analyses did not provide a sufficient basis <strong>for</strong><br />
evaluating <strong>the</strong> effects of zero flow in <strong>the</strong> Palm River/McKay Bay system.<br />
2.12.3 Peer Review - Evaluate Deficiencies<br />
The Panel discussed several basic deficiencies in <strong>the</strong> technical approach employed by<br />
<strong>the</strong> District. The most important of <strong>the</strong>se was <strong>the</strong> District’s implicit assumption that it<br />
could set a minimum flow of zero without giving specific consideration to <strong>the</strong> frequency<br />
or duration of zero flow periods. The second deficiency <strong>the</strong> Panel discussed dealt with<br />
<strong>the</strong> adequacy of <strong>the</strong> data employed in <strong>the</strong> District’s analysis. The lack of significant data<br />
in <strong>the</strong> critical zero flow range, and <strong>the</strong> limitations in temporal resolution of this analysis,<br />
significantly limited <strong>the</strong> usefulness of <strong>the</strong> data in evaluating <strong>the</strong> effects of zero flow.<br />
Finally, <strong>the</strong> District’s evaluation of relationships between flow and <strong>the</strong> critical salinity and<br />
DO parameters was empirical and based entirely on regression statistics (Bedient et al.,<br />
1999).<br />
2.12.4 Peer Review - Summary<br />
The Panel recommended that <strong>the</strong> District undertake <strong>the</strong> development of a mechanistic<br />
model that could be used to evaluate and predict <strong>the</strong> effect of various minimum flow<br />
strategies on <strong>the</strong> Palm River/McKay Bay system. Additional data would be required <strong>for</strong><br />
this modeling ef<strong>for</strong>t to improve spatial and temporal resolution in <strong>the</strong> critical zero flow<br />
range. The Panel recommended that <strong>the</strong>se additional modeling and data collections be<br />
undertaken be<strong>for</strong>e any significant increased withdrawals were allowed from <strong>the</strong> TBC<br />
(Bedient et al., 1999). (Section 2.14 describes additional studies conducted by <strong>the</strong><br />
District in response to <strong>the</strong> Peer Review recommendations. )<br />
_____________________________________________________________________________________________________<br />
2.0 Basin Description & History<br />
2-18
May 15, 2005 Draft<br />
2.13 PRIOR WATER QUALITY DATA COLLECTION / STUDIES<br />
The major sources of water quality in<strong>for</strong>mation available are summarized below.<br />
2.13.1 Environmental Protection Commission Hillsborough County<br />
The Environmental Protection Commission Hillsborough County (EPCHC) collects<br />
ambient water quality data at two stations in <strong>the</strong> Palm River and one station in McKay<br />
Bay. Salinity and dissolved oxygen data were were collected at mid-depth from 1974 to<br />
1995, and from surface and bottom water depths from 1987 to 1995 (EPHC, 1995). Since<br />
1996, samples have been collected at mid-depth.<br />
Hypoxia was frequently noted at stations in <strong>the</strong> Palm River, particularly in bottom waters.<br />
<strong>Minimum</strong> DO values of below 0.5 mg/L occurred at all depths at both <strong>the</strong> Palm River<br />
stations. DO values were generally higher in McKay Bay at all sampling depths. Periodic<br />
problems in deeper waters were observed during <strong>the</strong> warmer months.<br />
In July 1998, Hillsborough County Water Resource Team and <strong>the</strong> EPCHC established<br />
and funded an independent water quality and biological monitoring program (EPCHC,<br />
2000) named <strong>the</strong> Hillsborough Independent Monitoring Program (HIMP). The purpose of<br />
<strong>the</strong> HIMP is to monitor <strong>the</strong> Hillsborough River, Alafia River, Palm River, McKay Bay, and<br />
<strong>the</strong> Apollo Beach area and canal system <strong>for</strong> potential environmental changes, which may<br />
be caused by <strong>Tampa</strong> Bay Water's (TBW) new water supply projects scheduled to begin in<br />
2004 and confirm <strong>the</strong> modeling results prepared <strong>for</strong> TBW.<br />
Sample collection <strong>for</strong> <strong>the</strong> County's HIMP began in 1999, and will include three years of<br />
"pre-water withdrawal" sampling and a minimum of three years of "post-water withdrawal"<br />
sampling.<br />
2.13.2 Hydrobiological Study of Lower Hillsborough River and <strong>Tampa</strong> <strong>Bypass</strong><br />
<strong>Canal</strong> (WAR/SDI, 1995)<br />
During 1991 through 1994, Water and Air Research (WAR) conducted water quality and<br />
biological sampling in <strong>the</strong> lower Hillsborough River and <strong>the</strong> TBC in compliance with <strong>the</strong><br />
COT and West Coast Regional Water Supply Authority (WCRWSA) WUP requirement to<br />
conduct a hydrobiological study of <strong>the</strong> Lower Hillsborough River and <strong>the</strong> TBC. As part of<br />
that study, WAR/SDI established eight stations in <strong>the</strong> McKay Bay/TBC complex. This<br />
study and <strong>the</strong> stations established are frequently referred to as <strong>the</strong> “WAR study” and <strong>the</strong><br />
“WAR” stations respectively. During 2001-2003, <strong>the</strong> District returned to <strong>the</strong>se sites to<br />
collect additional water quality. Figure 2-13 illustrates <strong>the</strong> location of <strong>the</strong> pertinent “WAR”<br />
stations along with <strong>the</strong> EPCHC ambient and HIMP water quality stations.<br />
WAR teamed with SDI to evaluate <strong>the</strong> data and completed <strong>the</strong> evaluation in 1995.<br />
Some general findings from <strong>the</strong> WAR/SDI study relevant to <strong>the</strong> determination of minimum<br />
flows are summarized below.<br />
_____________________________________________________________________________________________________<br />
2.0 Basin Description & History<br />
2-19
May 15, 2005 Draft<br />
• The TBC below S-160 (Palm River) had much higher salinity values than <strong>the</strong> lower<br />
Hillsborough River below <strong>the</strong> dam.<br />
• Surface salinities just below S-160 averaged 19.6 parts per thousand (ppt) with a<br />
minimum value of 12.5 ppt.<br />
• Bottom salinities just below S-160 averaged 24.6 ppt with a minimum value of 20.0<br />
ppt.<br />
• Surface dissolved oxygen (DO) values generally increased progressively<br />
downstream in <strong>the</strong> TBC/Palm River system.<br />
• DO concentrations in <strong>the</strong> Palm River/McKay Bay system were not correlated with<br />
freshwater discharge at S-160.<br />
• Pronounced declines in DO concentrations with depth were observed in <strong>the</strong> lower<br />
canal, with mean bottom dissolved oxygen values ranging from 0.7 mg/L to 3.0<br />
mg/L.<br />
• <strong>Minimum</strong> DO values near zero mg/L were recorded at all stations above McKay<br />
Bay.<br />
• Although periodic problems occurred, DO concentrations were generally higher in<br />
McKay Bay because it is shallow and frequently wind mixed.<br />
• Total suspended solids (TSS) values in <strong>the</strong> Palm River/McKay Bay system were<br />
considerably greater than in <strong>the</strong> Lower Hillsborough River. Large phytoplankton<br />
densities in <strong>the</strong> Palm River/McKay Bay system contributed to this difference.<br />
• O<strong>the</strong>r data have shown that high salinity areas in <strong>Tampa</strong> Bay had a higher TSS<br />
values than <strong>the</strong> fresh and low salinity areas of <strong>the</strong> bay’s tributaries. The higher<br />
TSS values in <strong>the</strong> Palm River/McKay Bay system reflected <strong>the</strong> higher salinity and<br />
greater influence of <strong>Tampa</strong> Bay.<br />
• As with TSS, turbidity values were higher in <strong>the</strong> Palm River/McKay Bay system<br />
than in <strong>the</strong> lower Hillsborough River.<br />
• Color was positively correlated with discharge in <strong>the</strong> Palm River.<br />
• Secchi disk values were negatively correlated with discharge.<br />
• Orthophosphorus was negatively corrected with discharge in <strong>the</strong> Palm<br />
River/McKay Bay system.<br />
• Chlorophyll-a concentration was generally higher in <strong>the</strong> Palm River/McKay Bay<br />
system than in <strong>the</strong> Lower Hillsborough River.<br />
• Chlorophyll-a was not correlated with discharge from S-160 at <strong>the</strong> Palm<br />
River/McKay Bay stations.<br />
_____________________________________________________________________________________________________<br />
2.0 Basin Description & History<br />
2-20
May 15, 2005 Draft<br />
Segment 1<br />
#Y<br />
'<br />
#Y<br />
#Y<br />
NW McKay Bay<br />
NE McKay Bay<br />
$<br />
' $<br />
#Y<br />
#Y<br />
$<br />
Segment 3<br />
Segment 2<br />
South McKay Bay<br />
#Y<br />
Segment $ 4<br />
$<br />
'#Y<br />
$<br />
Segment 5<br />
Segment 6<br />
#Y<br />
$<br />
$<br />
$ '<br />
Segment 7<br />
$<br />
'<br />
#Y<br />
EPC HIMP<br />
EPC Ambient<br />
WAR<br />
Figure 2-13 WAR, HIMP, EPCHC Ambient Stations<br />
2.13.3 Hydrobiological Monitoring Program (HBMP) Year 3 Interpretive Report<br />
(PBS&J, 2003a).<br />
<strong>Tampa</strong> Bay Water’s WUP required design and implementation of a Hydrobiological<br />
Monitoring Program (HBMP) <strong>for</strong> both <strong>the</strong> Alafia and <strong>Tampa</strong> <strong>Bypass</strong> <strong>Canal</strong> Water Supply<br />
Projects <strong>Tampa</strong> Bay Water selected PBS&J to design and implement <strong>the</strong> HBMP. TBW<br />
selected PBS&J who designed and implemented a monitoring program in 2000 that<br />
included water quality, fish and invertebrates, benthos, and vegetation. The sampling<br />
design was based on a stratified random selection of stations. In addition to <strong>the</strong> X, Y<br />
stratification, <strong>the</strong> in-situ water quality design specified “deep” (> 2 m) and “shallow “<br />
samples. In addition to <strong>the</strong> monthly in-situ parameters and secchi depth, grab samples<br />
were collected and analyzed <strong>for</strong> chlorophyll-a, Total Organic Carbon (TOC), Dissolved<br />
Organic Carbon (DOC), Total Suspended Solids (TSS), color, and chloride. Continuous<br />
(15-minute capture) recording of surface/bottom conductivity, temperature and DO was<br />
conducted at two stations (Maydell Drive and 22 nd Street Causeway) along with water<br />
level.<br />
_____________________________________________________________________________________________________<br />
2.0 Basin Description & History<br />
2-21
May 15, 2005 Draft<br />
Data sources included in <strong>the</strong> HBMP evaluation included:<br />
• Environmental Protection Commission Hillsborough County – EPCHC<br />
• Florida Marine Research Institute – FMRI<br />
• <strong>Southwest</strong> Florida Water Management District – District<br />
• University of South Florida – USF<br />
• City of <strong>Tampa</strong> (Water and Air Research) – COT (WAR)<br />
• <strong>Tampa</strong> Bay Water HBMP Program (PBS&J and all subcontractors) – HBMP<br />
The results of <strong>the</strong> monitoring ef<strong>for</strong>ts were summarized in 2003 as <strong>the</strong> Hydrobiological<br />
Monitoring Program – Year 3 Interpretive Report. Figure 2-14 provides <strong>the</strong> location of<br />
<strong>the</strong> HBMP water quality monitoring stations.<br />
A summary of some general findings from <strong>the</strong> HBMP study relevant to <strong>the</strong> determination<br />
of minimum flows follows:<br />
• Surface salinities in both McKay Bay and <strong>the</strong> Palm River were much higher than<br />
those typically observed in a natural estuarine system. During characteristically<br />
prolonged periods of low flow, high surface salinities (28-33 ppt) typically extended<br />
from McKay Bay upstream to near Structure S-160. However, surface salinities in<br />
<strong>the</strong> Palm River varied widely during short time periods in response to periodic high<br />
freshwater discharges from S-160.<br />
• During periods characterized by low to moderate flows at S-160, <strong>the</strong>re was usually<br />
a weak longitudinal surface salinity gradient running from higher (20-25 ppt)<br />
concentrations in McKay Bay to somewhat lower levels upstream in <strong>the</strong> Palm River<br />
(15 to 20 ppt). During periods of very high flows at S-160, low (0-5 ppt) surface<br />
salinities typically extended throughout <strong>the</strong> Palm River and McKay Bay.<br />
• During periods of moderate flow at S-160, near-bottom salinities were<br />
characteristically considerably higher than corresponding surface salinities from<br />
near <strong>the</strong> structure downstream through McKay Bay. Consequently, extensive<br />
reaches of both <strong>the</strong> Palm River and McKay Bay were typically characterized by<br />
marked salinity stratification.<br />
• Surface dissolved oxygen concentrations along <strong>the</strong> entire sampling transect from<br />
McKay Bay upstream to Structure S-160 fell below <strong>the</strong> State standard <strong>for</strong> estuarine<br />
waters (4.0 mg/L). However, both <strong>the</strong> frequency and magnitude of low surface<br />
dissolved oxygen concentrations were far greater in <strong>the</strong> Palm River than McKay<br />
Bay.<br />
• Instances of hypoxia (ambient DO less than 2.0 mg/L) or anoxia (less than 0.2<br />
mg/L), were common in <strong>the</strong> surface waters of <strong>the</strong> Palm River, but were extremely<br />
rare in McKay Bay.<br />
• Vertical salinity stratification resulted in hypoxic and even anoxic dissolved oxygen<br />
concentrations in near-bottom waters in both McKay Bay and <strong>the</strong> Palm River. This<br />
was especially true <strong>for</strong> <strong>the</strong> deeper, dredged areas of both McKay Bay and <strong>the</strong><br />
Palm River.<br />
• Intermittent occurrences of supersaturated surface DO concentrations have been<br />
observed in both <strong>the</strong> Palm River and McKay Bay, indicative of dense<br />
_____________________________________________________________________________________________________<br />
2.0 Basin Description & History<br />
2-22
May 15, 2005 Draft<br />
phytoplankton blooms (measured as chlorophyll-a) during periods of low flow<br />
when residence times are high.<br />
Segment 1<br />
'] ']']']']']']<br />
] ']']<br />
']']']<br />
'<br />
']']'] ']']']] ']']']']<br />
'] ']']']<br />
']'] '] ']<br />
']']<br />
']<br />
']<br />
] ']']'<br />
''] ']'] ']']'] ] '] ']<br />
'<br />
']']'] ] '<br />
'] ']']<br />
']]<br />
'] '] '<br />
'] ']<br />
'] '] '] '] ']']']<br />
']<br />
'] '] ']'] ']'] ']<br />
'] ] ' ']']<br />
'] '] ']']<br />
'] ] '] ]<br />
']'] ']'] '] ]<br />
']<br />
']']']<br />
']' ']<br />
']<br />
'] '] ]<br />
']<br />
'] '] ']<br />
']<br />
'<br />
']<br />
]<br />
'] '] ']']<br />
']']<br />
']<br />
']']'] ']'] ']<br />
'] '] ']<br />
']]']']<br />
'] ']<br />
']<br />
']<br />
]<br />
']<br />
'] '<br />
']<br />
'] '] ']'] '] '] ']'] ']']']']']'] '] ']'] ']']<br />
']'] ']']<br />
']']<br />
]'] '] ']<br />
'] '] ']'] ']']'] ']<br />
']']'] '] ']<br />
'] ']']<br />
']<br />
'] ']<br />
'] '] ']<br />
'] ' '] ']<br />
']'] ']<br />
']']<br />
']']']'] ']<br />
']']'] ']']'] ']']<br />
']']<br />
']'] ']<br />
']<br />
']']'] '] ']'] ']']<br />
']'] ']']'] ']'] ']<br />
']<br />
']<br />
']'] ']']<br />
']']']<br />
']']<br />
']']<br />
']']<br />
'] ']<br />
']'] ']'] '<br />
'] ']']']<br />
']']'] ']']<br />
'] ']'] '] '] '] ']']'] ']']']<br />
'] '] NE McKay Bay<br />
'] ']<br />
']<br />
']']']'] ']<br />
']<br />
']']<br />
']']<br />
']<br />
'<br />
'] ']']'] ' ']'] ']']']']<br />
]<br />
'] ']<br />
'] '] ']<br />
']<br />
'] ']<br />
]<br />
']<br />
']']<br />
']'] ']'] '] '] ']<br />
']<br />
'] ']<br />
']<br />
'] ']']<br />
']<br />
']<br />
'] ' ']'] '] '] '] ']<br />
' ']'] '] ']<br />
'] ']<br />
']' '] '] '] ']']<br />
']<br />
'] '] '] ']<br />
'] ']<br />
'] ']'] '] ']'] ']<br />
'] '] ']']<br />
']<br />
'] '] ']']<br />
'] ']'] '] ']<br />
'] '] ']<br />
']']'] '] '] ']<br />
'] '] '] '] ']']'] ']'] '] ']'] '] ']'] ']'] ']'] ']']<br />
'] '] ']<br />
'] '] '] ']'] ']<br />
'] ']']']']<br />
']<br />
']'] ']<br />
''] '] '] '] '] '] ']<br />
'] '] ']<br />
'] ']']<br />
']<br />
']<br />
']<br />
']<br />
']<br />
'] ']<br />
'] '] ']'] ']<br />
'] '] '] ']'] '] ']'] ']<br />
']']<br />
']<br />
']<br />
'] '] ']<br />
] ']'] ']<br />
']'] ']']'] '] ']<br />
']<br />
'] '] ']'] '] '] ']<br />
']']'] ']']<br />
']'] ']']<br />
']<br />
Segment 4 d<br />
d<br />
d<br />
']<br />
']<br />
d<br />
d<br />
d<br />
Segment 5<br />
']<br />
']<br />
']']'] '] '] '] ']<br />
'] '] ']<br />
] ]<br />
'] ''] ']'] '] ' ']']'] ']<br />
']] ']<br />
']<br />
']<br />
']<br />
']'] ']'] ']']'] ']<br />
'] ']'] ']<br />
'] ']']']<br />
'] ']<br />
'<br />
'] ']<br />
' ' ' ] ']'] ']<br />
']']'] ']']<br />
'] ']']<br />
'] ']']] ']<br />
']<br />
'] '] '] d<br />
']<br />
'] '<br />
']<br />
'] '] ']<br />
']<br />
'] '] ']']<br />
']'] ']]<br />
']'] ] ']<br />
']']<br />
]<br />
']']']']<br />
'] '] ']<br />
'] '] ']']']'] ']<br />
']'] '] '] '] '] ']']<br />
']<br />
d d<br />
']<br />
']']<br />
'] ']<br />
'] ']<br />
']']'] '] ']<br />
']'] ']']'] '] '] '] '] '] '] '] ']<br />
'] ]<br />
'] d<br />
']']<br />
]<br />
']<br />
'] ']']<br />
'] ']<br />
']']<br />
'] '] ']<br />
']<br />
'] '] ']<br />
'] '] ']<br />
'] ']'] ']'] ']']<br />
'<br />
']<br />
'']']<br />
'] '] '] '] ']<br />
'] ']<br />
'] '] ']<br />
'] ' '] ']<br />
'] ']<br />
]<br />
' ]<br />
']']<br />
'<br />
'] ']<br />
']<br />
']']<br />
'] '] '] '] ' ']<br />
'']']<br />
']'] '] ] '] ']<br />
'] ']']<br />
']<br />
']']<br />
'] ']'] '] '] '] ']']<br />
']<br />
'] ']']'] '] ']<br />
']<br />
'] ']'] ] ']<br />
']<br />
]<br />
']'] ']<br />
']<br />
'<br />
' '<br />
'] '<br />
]<br />
'] ']'] '] ']<br />
'<br />
']<br />
']<br />
'] ]<br />
']'] ']] '] ']<br />
d d<br />
']<br />
'] '] ']<br />
']<br />
']<br />
']<br />
']']<br />
']']<br />
'] '] ']'] ']<br />
d ']<br />
'] '] '] '] ']<br />
'] ']']']']']<br />
']'] ] '] ]']'] '] ] '] '] ']<br />
']<br />
'] ']<br />
']'] ']<br />
'] ']<br />
]<br />
']<br />
']']']<br />
]'<br />
'] ']<br />
']'] ']'] ]<br />
']<br />
']<br />
']'] '] ']<br />
']<br />
'] ']<br />
']<br />
']']']']<br />
']<br />
]<br />
'] ']']']'] '] ']']'] ']<br />
'] ]' ' ']']<br />
' ']'] '<br />
']<br />
]<br />
'] ]<br />
'] ']<br />
] ']']'] '] ']']']<br />
'] ']'] '] '] ']<br />
']'] ']']']'] ']']']'] '] '] d<br />
NW McKay Bay<br />
Segment 3<br />
Segment 2<br />
South McKay Bay<br />
Segment 6<br />
']<br />
d<br />
']<br />
Segment 7<br />
HBMP-PBS&J<br />
HBMP-USF<br />
HBMP-FMRI<br />
Figure 2-14 Location of All HBMP Stations<br />
2.13.4 An Analysis of <strong>the</strong> Effects of Freshwater Inflows on Salinity<br />
Distribution, Dissolved Oxygen<br />
Concentrations, and Habitat<br />
Characteristics of <strong>the</strong><br />
Hillsborough River and Palm<br />
River/<strong>Tampa</strong> <strong>Bypass</strong> <strong>Canal</strong><br />
(Coastal Environmental, Inc.,<br />
1997).<br />
This study was requested of <strong>the</strong> <strong>Tampa</strong> Bay Estuary Program (TBEP) by <strong>the</strong> District (see<br />
Section 2.3). The purpose was to convene a technical advisory committee that would<br />
provided recommendations of ecological criteria to be used in establishing MFLs <strong>for</strong> TBC<br />
and <strong>the</strong> Hillsborough River. The process required eight months and included an<br />
extensive collection of local, state and federal agencies, thus making <strong>the</strong> conclusions an<br />
excellent consensus of environmental concerns at all bureaucratic levels. The purpose of<br />
<strong>the</strong> study was to investigate <strong>the</strong> relationships between freshwater discharge and water<br />
quality conditions in <strong>the</strong> Hillsborough River and Palm River/<strong>Tampa</strong> <strong>Bypass</strong> <strong>Canal</strong>, and o<br />
develop a management tools based on <strong>the</strong> results to predict salinity and dissolved oxygen<br />
response to changes in freshwater inflows. TBEP contracted with Coastal Environmental<br />
to facilitate <strong>the</strong> process, conduct <strong>the</strong> evaluation and produce <strong>the</strong> management tools. By<br />
agreement of <strong>the</strong> participants, <strong>the</strong> study did not recommend specific minimum flow<br />
targets.<br />
_____________________________________________________________________________________________________<br />
2.0 Basin Description & History<br />
2-23
May 15, 2005 Draft<br />
Coastal Environmental used <strong>the</strong> WAR, and EPHC ambient data along with <strong>the</strong> USGS<br />
continuous recordings <strong>for</strong> <strong>the</strong> evaluation. Regression analysis showed that relatively high<br />
salinity values persist in <strong>the</strong> Palm River at flows less than 100 cfs from S-160. The<br />
results showed <strong>the</strong> response of salinity to flow in <strong>the</strong> Palm River is curvilinear, with<br />
surface salinity being most responsive at low flows. By increasing flow from 0 to 40 cfs,<br />
surface salinities in <strong>the</strong> Palm River were predicted to decrease by 3.2 to 4.4 ppt resulting<br />
in low to mid-twenty ppt salinity. At <strong>the</strong> same flow rate (40 cfs), salinity at 1 meter was<br />
predicted to be in <strong>the</strong> range of 24.2 to 26.5 ppt.<br />
The regression analyses per<strong>for</strong>med on Palm River DO revealed that temperature was<br />
significantly related in all cases, but <strong>the</strong> slope <strong>for</strong> flow was not significantly different from<br />
zero (p
May 15, 2005 Draft<br />
3. The Hydrobiological Monitoring Program (HBMP) <strong>for</strong> both <strong>the</strong> Alafia and <strong>Tampa</strong><br />
<strong>Bypass</strong> <strong>Canal</strong> Water Supply Projects Year 3 Interpretive Report (PBS&J, 2003).<br />
2.14.1 Hillsborough Independent Monitoring Program: Pre-Operational<br />
Characterization of Benthic Habitats in <strong>the</strong> Palm River, McKay Bay, & <strong>the</strong><br />
Little Manatee River – Draft (Grabe et al., 2004)<br />
Hillsborough County began collecting benthic samples in <strong>the</strong> Palm River in 1995 as part<br />
of a larger bay-wide benthic monitoring program intended to define <strong>the</strong> status of <strong>the</strong> bay<br />
and to provide data <strong>for</strong> development of a benthic index <strong>for</strong> <strong>Tampa</strong> Bay. In 1998, TBW<br />
developed a Master Water Plan that included withdrawals from <strong>the</strong> TBC. In response,<br />
Hillsborough County developed <strong>the</strong> HIMP benthic monitoring to collect baseline data.<br />
Figure 2-15 illustrates <strong>the</strong> extent of Hillsborough County’s HIMP sampling in <strong>the</strong> McKay<br />
Bay/TBC complex. The County used a ‘Be<strong>for</strong>e-After-Control-Impact (BACI; Green 1979)<br />
to compare <strong>the</strong> benthos in Palm River/McKay Bay to <strong>the</strong> Little Manatee River (as <strong>the</strong><br />
control site). In addition, relationships between benthic metrics and salinity were<br />
conducted <strong>for</strong> individual areas. The results indicated that <strong>the</strong>re is no statistical relationship<br />
between numbers of taxa present and salinity. Sand habitats in McKay Bay were found to<br />
support a richer and denser assemblage than do <strong>the</strong> mud habitats. The McKay Bay<br />
assemblage was found to be 13% similar (SIMPER analysis) to <strong>the</strong> Palm River. An<br />
equivalent degree of similarity was found between <strong>the</strong> Little Manatee River community<br />
and <strong>the</strong> Palm River community.<br />
2.14.2 Hydrobiological Study of Lower Hillsborough River and <strong>Tampa</strong> <strong>Bypass</strong><br />
<strong>Canal</strong> (WAR/SDI, 1995).<br />
The biological component of <strong>the</strong> WAR/SDI study included an evaluation of benthos, fish,<br />
ichthyoplankton and phytoplankton. Phytoplankton densities were generally higher and<br />
more variable in <strong>the</strong> Palm River/McKay Bay system than in <strong>the</strong> Hillsborough River. The<br />
Bacillariophyaceae (diatoms) were <strong>the</strong> most abundant algal group in McKay Bay. The<br />
highest algal populations were found in <strong>the</strong> freshwater portions of <strong>the</strong> TBC, and<br />
phytoplankton densities at <strong>the</strong> station below S-160 were positively correlated with<br />
discharges.<br />
Many of <strong>the</strong> macroinvertebrate communities sampled in <strong>the</strong> Hillsborough River and<br />
<strong>Tampa</strong> <strong>Bypass</strong> <strong>Canal</strong> systems were indicative of stressed environments with low<br />
dissolved oxygen concentrations. Low values of organism abundance, species richness,<br />
and diversity were common during <strong>the</strong> study, but were most frequent at <strong>the</strong> station<br />
nearest <strong>the</strong> structure. Communities collected from shallow waters at several stations<br />
during <strong>the</strong> second year of study generally had one to three orders of magnitude more<br />
organisms than collections from mid-channel areas, apparently due to <strong>the</strong> higher<br />
dissolved oxygen concentrations in <strong>the</strong> shallower waters.<br />
_____________________________________________________________________________________________________<br />
2.0 Basin Description & History<br />
2-25
May 15, 2005 Draft<br />
Segment 1<br />
Y#<br />
#Y<br />
#Y<br />
#Y &\ &\ #<br />
&\ #Y Y<br />
NE McKay Bay<br />
&\<br />
&\<br />
&\ #<br />
#Y #<br />
&\ &\ Y<br />
#Y Y<br />
#Y #Y<br />
&\ &\<br />
#Y &\&\<br />
&\ Y#<br />
#Y<br />
&\ #<br />
#Y<br />
#Y<br />
&\<br />
#Y<br />
Y<br />
#Y<br />
#Y<br />
# &\<br />
&\ &\<br />
Y<br />
#Y # #Y<br />
&\ &\<br />
Y<br />
#<br />
&\<br />
#<br />
&\<br />
#Y<br />
#Y<br />
#Y Y<br />
#Y #Y<br />
#Y #Y #Y<br />
#Y<br />
Y<br />
#Y &\ #Y<br />
# #<br />
&\ #<br />
&\ &\ &\<br />
#Y<br />
#<br />
#Y<br />
#Y<br />
#<br />
&\ &\<br />
&\<br />
#Y<br />
##Y Y #Y #Y<br />
#<br />
#Y #Y #Y<br />
#Y &\ &\ &\ Y<br />
#Y<br />
#Y Y #Y<br />
Y<br />
#Y #Y # #Y<br />
&\ &\<br />
&\<br />
#Y<br />
#Y<br />
#Y<br />
&\<br />
&\<br />
#Y &\<br />
&\ &\ &\<br />
#Y<br />
&\<br />
&\<br />
&\<br />
#Y<br />
&\<br />
&\<br />
#Y<br />
&\ #<br />
#<br />
#Y<br />
#Y #Y &\<br />
#Y &\<br />
#<br />
# &\ &\ &\<br />
&\ #Y<br />
#Y<br />
&\<br />
#Y<br />
#Y<br />
Y<br />
#Y<br />
#Y<br />
#Y<br />
&\<br />
&\ #Y<br />
#Y #Y Y<br />
Y<br />
Segment<br />
#Y #Y<br />
4 #Y #Y<br />
#Y &\<br />
#Y<br />
#Y<br />
#Y<br />
Y<br />
#Y<br />
#Y<br />
#Y<br />
&\<br />
&\<br />
&\ &\<br />
#Y #Y<br />
#Y<br />
#<br />
&\ \<br />
&\<br />
&\<br />
#Y<br />
#<br />
#Y #Y<br />
# #Y #<br />
Y<br />
##Y<br />
# #Y<br />
#Y<br />
#Y<br />
#<br />
&\<br />
#Y &\<br />
&\<br />
#Y<br />
#Y<br />
#Y<br />
#Y<br />
&\<br />
&\<br />
&\<br />
&\ #Y<br />
##<br />
#Y #Y<br />
# &\<br />
#Y &\<br />
&\ &\ &\<br />
&\<br />
&\<br />
&<br />
&\ &\<br />
# &\ #Y<br />
&\ #Y &\<br />
&\ #Y &\ &\<br />
&\<br />
&\<br />
Y<br />
Y<br />
#Y<br />
#Y<br />
#Y<br />
Y<br />
Y #Y #Y<br />
#Y<br />
#Y<br />
Y #Y<br />
#Y #Y Y #Y &\<br />
#Y<br />
#Y Y &\<br />
&\<br />
&\<br />
&\ &\ &\<br />
&\<br />
#Y<br />
#Y #Y Y<br />
#Y # #Y<br />
#Y #Y #Y<br />
#Y#Y<br />
&\<br />
&\&\ #Y<br />
YY<br />
Y<br />
#Y<br />
#Y Y Y<br />
#Y<br />
#Y<br />
#Y #Y<br />
#Y<br />
#Y<br />
Y<br />
#Y Y<br />
&\<br />
#<br />
# #Y<br />
&\ &\ #Y<br />
&\ &\<br />
#Y & &\ #<br />
&\<br />
&\ #Y #Y<br />
&\<br />
&\<br />
# &\ &\ # \<br />
&\ &\<br />
#<br />
&\<br />
#Y Y<br />
#Y<br />
&\ &\<br />
&\<br />
&\ &\ &\ #Y # #Y<br />
#Y #<br />
#<br />
#Y &\<br />
&\<br />
&\<br />
&\<br />
&\ #Y<br />
#Y<br />
#Y #Y<br />
#Y<br />
#Y #Y #Y<br />
#Y Y<br />
#Y<br />
#Y<br />
#Y<br />
Y<br />
#Y #Y<br />
#Y<br />
#Y #Y<br />
#Y #Y<br />
Segment 5<br />
Y<br />
#Y &\<br />
#Y<br />
#Y<br />
&\<br />
Y<br />
Y<br />
#Y<br />
#Y #Y #Y #Y<br />
#Y<br />
#<br />
&\ &\<br />
&\ &\ &\<br />
&\<br />
#Y<br />
#Y<br />
#Y<br />
#Y Y#Y<br />
Y<br />
#Y<br />
#Y<br />
#Y<br />
Y #Y #Y<br />
#Y &\<br />
&\<br />
#Y &<br />
#Y<br />
##Y<br />
&\<br />
Y<br />
#Y #Y<br />
&\ &\ &\ \#Y<br />
\<br />
&\<br />
#Y #Y #Y<br />
#Y<br />
Y#Y<br />
#Y<br />
&\<br />
&\<br />
#Y<br />
#Y Y#<br />
&\<br />
#Y &\ # Y<br />
&\<br />
&<br />
#Y # &\ #Y #<br />
#<br />
# Y # ##Y<br />
#Y<br />
&\ #Y & #Y<br />
#Y &\<br />
\<br />
\<br />
#Y<br />
Y<br />
Y<br />
#Y<br />
#Y Y<br />
Y<br />
Y<br />
#Y<br />
#Y<br />
&\ &\ \<br />
&\ #Y<br />
#Y \#<br />
#<br />
#<br />
# #Y #<br />
#<br />
#<br />
&\<br />
&\ &<br />
#Y<br />
# & &\ #Y Y Y<br />
&\<br />
#Y Y<br />
&\<br />
#Y # Y<br />
Y<br />
Y<br />
Y<br />
#Y<br />
Y<br />
#Y<br />
# #<br />
#<br />
#<br />
#Y<br />
#Y #Y<br />
Y<br />
Y #Y Y<br />
Y<br />
Y#<br />
#Y Y<br />
&\ \ # #Y<br />
#Y &\<br />
#&<br />
&\<br />
&\<br />
#Y<br />
&\<br />
&\ &\<br />
#Y<br />
Y #Y Y<br />
&\<br />
#Y<br />
# &\<br />
#Y<br />
#Y #Y #Y Y #Y<br />
&\<br />
#Y<br />
#Y<br />
#<br />
#Y<br />
#Y &\ Y &\ &\<br />
##Y<br />
#Y #Y &\<br />
#Y<br />
&\ # Y#<br />
#Y<br />
&\ &\ &\ Y<br />
#Y<br />
#Y<br />
#Y<br />
Y #Y<br />
#Y<br />
#Y<br />
&\<br />
#Y<br />
#Y<br />
#Y #Y<br />
#Y<br />
#Y #Y #Y<br />
# #<br />
&\<br />
\ &\<br />
#Y<br />
#<br />
# &\ & &\ &\ Y Y<br />
Y# Y<br />
Y<br />
#Y<br />
#Y<br />
#Y #Y<br />
#Y<br />
#<br />
&\<br />
#Y # &\ Y#<br />
Y<br />
#Y #Y Y &\<br />
#<br />
#Y Y<br />
&\<br />
&\ # Y#<br />
&\<br />
#Y<br />
# #Y Y<br />
#Y<br />
#Y Y#Y<br />
# #Y<br />
#Y Y<br />
&\ &\<br />
#Y<br />
#Y &\<br />
&\<br />
# &\<br />
#Y<br />
#Y Y<br />
&\<br />
#Y &\ Y#<br />
Y#<br />
#Y<br />
NW McKay Bay<br />
Segment 3<br />
Segment 2<br />
South McKay Bay<br />
Segment 6<br />
Segment 7<br />
#Y<br />
&\<br />
PBS&J HBMP Benthic<br />
TBEP Benthic<br />
Figure 2-15 TBEP/EPCHC HIMP and PBS&J Benthic Stations<br />
Because of <strong>the</strong> much higher salinity values and more subdued response to freshwater<br />
inflows, benthic macroinvertebrates in <strong>the</strong> Palm River/McKay Bay system did not show a<br />
clear response to changes in freshwater inflows when compared to <strong>the</strong> Hillsborough<br />
River. During periods of peak discharge in <strong>the</strong> Hillsborough River, a shift in community<br />
compositions from estuarine species to freshwater species occurred at <strong>the</strong> Hillsborough<br />
dam.<br />
Ichthyoplankton captured in <strong>the</strong> Palm River/McKay Bay system were primarily <strong>the</strong> egg,<br />
larvae, and juvenile stages of marine-derived fishes that tend to spawn in high salinity<br />
waters. These species migrate into lower salinity waters as juveniles and utilize <strong>the</strong>se<br />
estuarine habitats. The abundance of larval stages was lower than expected in <strong>the</strong> Palm<br />
River/McKay Bay system. The reduction may be related to benthic hypoxia, high<br />
salinities, rapid changes in freshwater flow or a combination of factors.<br />
Fishes collected during <strong>the</strong> two-year period were primarily adults and juveniles of smallsized<br />
resident species and <strong>the</strong> juveniles of seasonally abundant migrant species.<br />
Juvenile fish abundance increased progressively downstream in <strong>the</strong> Palm River/McKay<br />
_____________________________________________________________________________________________________<br />
2.0 Basin Description & History<br />
2-26
May 15, 2005 Draft<br />
Bay systems. The TBC/Palm River/McKay Bay system consistently harbored more<br />
individuals and a greater number of taxa than did <strong>the</strong> Lower Hillsborough River.<br />
The juvenile fish populations within <strong>the</strong> study area were clearly influenced by differing<br />
salinity regimes. The Hillsborough River hosted more freshwater and estuarine taxa than<br />
did <strong>the</strong> Palm River/McKay Bay system, which harbored more marine taxa. The<br />
abundances of many taxa reflected responses to salinity regimes.<br />
The transient fish community in <strong>the</strong> system was represented by juveniles of species of<br />
sport or commercial value. All transients were marine species that seasonally entered <strong>the</strong><br />
study sites as young-of-year, using <strong>the</strong>se systems as nursery areas.<br />
2.14.3 Assessment of Potential Impacts on Biological Commmunities of McKay<br />
Bay from Proposed Reductions in Freshwater Inflow from <strong>the</strong> <strong>Tampa</strong><br />
<strong>Bypass</strong> <strong>Canal</strong> (PBS&J, 1998).<br />
PBS&J prepared this report <strong>for</strong> TBW to provide an assessment of <strong>the</strong> potential impacts on<br />
McKay Bay of proposed withdrawals from <strong>the</strong> <strong>Tampa</strong> <strong>Bypass</strong> <strong>Canal</strong>. The withdrawals<br />
from <strong>the</strong> TBC would alter freshwater inflows to McKay Bay and possibly impact natural<br />
communities associated with existing flow and salinity regimes.<br />
This document addresses <strong>the</strong> expected influences of reduced freshwater inflows with<br />
respect to changes in salinity, both temporally and spatially, and with respect to flushing<br />
characteristics of McKay Bay. The major conclusions are as follows:<br />
• The vegetation of McKay Bay is dominated by mangroves and saltmarsh<br />
cordgrass, although small areas of black rushes are located in <strong>the</strong> sou<strong>the</strong>ast<br />
corner of <strong>the</strong> bay, which may be sensitive to changes in salinity.<br />
• The dominant benthic macroinvertebrates in McKay Bay have salinity tolerances<br />
that range from freshwater to estuarine. The fishes of McKay Bay are similar to<br />
those typically found in <strong>the</strong> <strong>Tampa</strong> Bay region in general and <strong>the</strong> Hillsborough Bay<br />
region in particular.<br />
• The proportion of total flushing in McKay Bay due to tidal exchange is 96%<br />
compared with 4% due to freshwater inflows. The residence time in McKay Bay<br />
increases slightly due to <strong>the</strong> proposed freshwater withdrawals, from 1.08 days to<br />
1.10 days.<br />
• Under proposed withdrawals <strong>for</strong> <strong>the</strong> TBC project, predicted changes in salinities<br />
throughout most of <strong>the</strong> year are approximately 1-1.5 ppt; <strong>the</strong> greatest changes in<br />
salinity, 3-4 ppt, occur only during one or two months during <strong>the</strong> wet season. The<br />
resultant salinities in McKay Bay will be approximately 22-24 ppt, or 1-2 ppt greater<br />
than currently existing salinities.<br />
• Comparisons of salinity tolerances and “preferences” of <strong>the</strong> predominant<br />
vegetation, benthos, and fish in McKay Bay to predicted salinity changes indicate<br />
that <strong>the</strong>re will be no significant effect on <strong>the</strong> distribution and abundance of <strong>the</strong>se<br />
critical components of <strong>the</strong> McKay Bay ecosystem. Given <strong>the</strong> lack of impact on<br />
_____________________________________________________________________________________________________<br />
2.0 Basin Description & History<br />
2-27
May 15, 2005 Draft<br />
<strong>the</strong>ir habitat and food sources (fish and benthos), no impact on <strong>the</strong> resident or<br />
migratory bird communities is expected.<br />
2.14.4 Hydrobiological Monitoring Program (HBMP) Year 3 Interpretive Report<br />
(PBS&J, 2003).<br />
The HBMP program required by TBW’s WUP also required collection and analyses of<br />
biological data from <strong>the</strong> McKay Bay/TBC complex. Biological studies during April 2000<br />
through December 2002 included macroinvertebrate, fish, zooplankton, vegetation, and<br />
bird data recorded by <strong>the</strong> HBMP are presented.<br />
Table 2-8 provides a brief description of <strong>the</strong> biological parameters measured and <strong>the</strong><br />
objectives that were established by <strong>the</strong> HBMP. Figure 2-16 provides <strong>the</strong> location of <strong>the</strong><br />
FMRI and USF fish and zooplankton stations.<br />
Data sources used in this study:<br />
• Hillsborough County Environmental Protection Commission– EPCHC<br />
• Florida Marine Research Institute – FMRI<br />
• <strong>Southwest</strong> Florida Water Management District – District<br />
• University of South Florida – USF<br />
• City of <strong>Tampa</strong> (Water and Air Research) – COT (WAR)<br />
• <strong>Tampa</strong> Bay Water HBMP Program (PBS&J and all subcontractors) – HBMP<br />
The frequency, abundance and probability of occurrence of several macroinvertebrate<br />
taxa and orders were described <strong>for</strong> each river kilometer reporting unit. These statistics<br />
serve as good baselines with which to compare future data. Several patterns of<br />
occurrence emerge that may suggest how different taxa might indicate subtle changes in<br />
salinity regimes, patterns of primary productions, or o<strong>the</strong>r factors. These patterns are<br />
discussed below <strong>for</strong> <strong>the</strong> TBC/Palm River, and McKay Bay.<br />
Table 2-8<br />
Biological Components of <strong>the</strong> TBC HBMP<br />
HBMP<br />
Element<br />
Benthic<br />
Invertebrates<br />
Zooplankton<br />
and Larval<br />
Fishes<br />
Adult and<br />
Juvenile<br />
Fishes<br />
Water<br />
Dependent<br />
Birds<br />
Habitat/<br />
Vegetation<br />
Indicators<br />
Objective(s)<br />
Evaluated changes in species composition,<br />
abundance, and/or distribution.<br />
Evaluated changes in species composition,<br />
abundance, and/or distribution.<br />
Evaluated changes in species composition,<br />
abundance, and/or distribution.<br />
Evaluated changes in abundance and<br />
richness over time, and any correlation with<br />
changes in water quality or o<strong>the</strong>r biological<br />
indicators.<br />
Estimated areal extent, relative abundance,<br />
and upstream/downstream shifts of<br />
vegetative communities.<br />
Parameters<br />
Monthly sampling of epifauna, infauna, grain size,<br />
and organic matter in freshwater and estuarine<br />
strata. More intense sampling in wet season and<br />
most likely potential impact areas.<br />
Monthly data were collected by University of<br />
South Florida.<br />
Monthly trawl and seine data were collected by<br />
Florida Marine Research Institute.<br />
Bimonthly surveys were conducted at three<br />
locations: Alafia Banks, ponds near month of<br />
Palm River, and upper McKay Bay.<br />
Annual linear shoreline and wetland polygon<br />
mapping, annual emergent and submerged<br />
aquatic vegetation survey by strata and fixed<br />
stations in <strong>the</strong> Alafia River.<br />
_____________________________________________________________________________________________________<br />
2.0 Basin Description & History<br />
2-28
May 15, 2005 Draft<br />
']<br />
']']<br />
'] '] ]<br />
' ] '<br />
']'] ']'] '] ']']<br />
'] ] ']']<br />
'] ' ']']']'] ]<br />
]]<br />
']']']<br />
']<br />
']<br />
'] ']']'<br />
'] ']']']'] ']'] '] '] '<br />
'] ']']']'] ']'] ]']']<br />
']<br />
']<br />
']<br />
']']'] '] ']<br />
'] '<br />
'] ']] '<br />
']<br />
]<br />
']<br />
']<br />
']']']<br />
] ' ']'] ']<br />
']<br />
' ''] ]'] '] '] ' '] ']<br />
''] ']<br />
']<br />
'] ']'] ']'] ']'] ']<br />
'] '] ']'] '] ']<br />
]<br />
']'] ']']<br />
' '] '] ']<br />
] '] '] ']<br />
'] '] ']']'] '] ']'] ']'] ']<br />
'] ']<br />
]'] ']<br />
']'] '] ']<br />
'] '] '] '] ']']']'] ']']'] ']<br />
'] ']']'] '] '] '] '] '] '] '] '] ']']'] ']'] ']] '] ']'] '] ']'] ']'] ']'] ']']<br />
']'] ']<br />
'] '] '] '] '] ']'] '] '] '] '] ']']']']<br />
'] ]<br />
'] '] '] '] '] '] ']<br />
'] ']']<br />
']<br />
'] '] ']']'] '] ']'] ']<br />
']<br />
']<br />
'] '] ]<br />
'] '] '] ']'] '<br />
'] ']<br />
'] '] '] '] ' '] ']'] '']'] '] '] ']<br />
']']<br />
']<br />
']<br />
'] ']'] '] ']<br />
'] '] ']<br />
']']<br />
']<br />
'] ']<br />
'] ']'] ]']'] '] ']<br />
'] ']'] ']<br />
']']<br />
']'] ']'] ']']'] ']<br />
']<br />
d<br />
']<br />
']']']<br />
']<br />
']'] ']<br />
d<br />
'] ']<br />
d<br />
d<br />
d d<br />
'] ']<br />
'']<br />
']']']<br />
'] '] '] d<br />
']<br />
']<br />
' '] ']<br />
]'] ] ']<br />
]'] ] ']']<br />
']']'] '] ']<br />
']<br />
']<br />
'] ']<br />
']<br />
'] ']'] ']<br />
']<br />
']<br />
']<br />
'] '<br />
']']']<br />
'] '] ']'] ']<br />
] '] ']<br />
']']'] '] '<br />
']<br />
']<br />
'] ']<br />
' '] ']']'] ' ] ']']<br />
'] ']<br />
'] '] ' '] '] ']<br />
d d<br />
']<br />
']<br />
] ']<br />
'] '] ']<br />
'] '] ']'] ']<br />
]']'] ']'] ']'] ' '] ]']<br />
']<br />
']<br />
']<br />
'] ] ']'<br />
'] ']'] '] '] '] '] ']<br />
'] '] '] ']<br />
']<br />
'] '] '] '] ']<br />
'] ']']<br />
'] '<br />
d<br />
']<br />
'] '<br />
']<br />
'] ']<br />
']<br />
']' '] ']'] ']<br />
'] ']'] '] '] '] ]'] ']<br />
'] ']'] '] '] ']<br />
']<br />
d d<br />
'] '] ']<br />
'] ']<br />
']<br />
']'] ']<br />
']'] '] ']'] '] '] '] '] ']<br />
']<br />
'] ']<br />
'] '] ']']<br />
'']<br />
']'] ']<br />
']<br />
'] '] ']'] ']<br />
d ']<br />
'] '] '] '] '] '] '] ']<br />
' ']']'] '] ']']]<br />
'] ']<br />
'] ']<br />
']<br />
']<br />
'] '<br />
]']']'] '<br />
']<br />
']<br />
']<br />
'] '']']<br />
']<br />
']']<br />
']<br />
] ']'] ']']']'] '] ']<br />
'] ']<br />
'] ']]'] ']<br />
']<br />
'] '] '] ]<br />
']'] ']']']']<br />
d<br />
']']']'] '] '] '] '] ']']<br />
Fish and Invertebrates<br />
HBMP-USF<br />
d<br />
']<br />
HBMP-FMRI<br />
Figure 2-16 FMRI and USF Fish / Invertebrate Stations<br />
Within <strong>the</strong> TBC/Palm River, <strong>the</strong> groups of indicator benthic macroinvertebrate taxa are<br />
somewhat different from those in <strong>the</strong> Alafia and Hillsborough Rivers. At approximately 4<br />
miles in length, <strong>the</strong> Palm River is relatively short. The range of <strong>the</strong> most common taxa in<br />
<strong>the</strong> o<strong>the</strong>r two rivers typically extended over a distance of 4 miles or more. As a result,<br />
many more taxa occur in a high percentage of samples in <strong>the</strong> Palm River than <strong>the</strong> o<strong>the</strong>r<br />
rivers.<br />
Also, low levels of oxygen seem to inhibit benthic macroinvertebrate production in <strong>the</strong><br />
upper river kilometers of <strong>the</strong> Palm River. Thus, patterns of invertebrate distribution may<br />
be driven by factors o<strong>the</strong>r than salinity, flow, or primary production. In contrast, <strong>the</strong><br />
temporal extent of benthic macroinvertebrate data in McKay Bay is much longer than that<br />
<strong>for</strong> <strong>the</strong> rivers. The Bay data lend <strong>the</strong>mselves to more traditional analytical techniques<br />
such as statistical and indices of diversity. Various benthic indices, including <strong>the</strong> recently<br />
developed <strong>Tampa</strong> Bay Benthic Salinity Index (Janicki Environmental, 2003) may also be<br />
of value in post-operational analyses.<br />
Zooplankton data collected as part of <strong>the</strong> HBMP include both invertebrate zooplankton<br />
(e.g., crab zoea) and ichthyoplankton (e.g., fish eggs and larvae). Zooplankton sampling<br />
_____________________________________________________________________________________________________<br />
2.0 Basin Description & History<br />
2-29
May 15, 2005 Draft<br />
is conducted monthly in <strong>the</strong> Alafia, Palm, and Hillsborough Rivers, and McKay Bay by Dr.<br />
Ernst Peebles of <strong>the</strong> University of South Florida under contract to PBS&J. Fish sampling<br />
is also conducted monthly in <strong>the</strong> Alafia, Palm, and Hillsborough Rivers, and McKay Bay,<br />
by Florida Marine Research Institute, Fisheries Independent Monitoring (FIM) program,<br />
under contract to PBS&J. Fish data collected as part of <strong>the</strong> HBMP include both juvenile<br />
and adults captured using seine nets and trawl nets.<br />
The two primary measures of spatial distribution <strong>for</strong> fish and zooplankton with respect to<br />
inflow include <strong>the</strong> center of abundance (COA) and abundance weighted salinity (AWS).<br />
The baseline analyses presented in this report show that <strong>the</strong> selected zooplankton and<br />
fish indicator species generally exhibited a high degree of variability in both COA and<br />
AWS over a wide range of freshwater inflows during <strong>the</strong> study period. The results from<br />
this study indicate that <strong>the</strong> selected taxa ei<strong>the</strong>r do not have a strong affinity <strong>for</strong> fixed<br />
habitats or preferred salinity regimes within <strong>the</strong> reporting units, or <strong>the</strong>y lack behavioral<br />
and/or physical capabilities to control <strong>the</strong>ir horizontal position within <strong>the</strong> estuary (PBS&J,<br />
2003).<br />
It is likely that <strong>the</strong> spatial distribution of zooplankton and fish is controlled more by<br />
complex trophic factors such as <strong>the</strong> density and distribution of phytoplankton populations.<br />
Thus while inflow (and resultant salinity) is less directly related to fish and zooplankton,<br />
<strong>the</strong>re may be an indirect relationship through relationships between phytoplankton and<br />
freshwater flows (PBS&J, 2003).<br />
2.15 SUMMARY OF PRIOR STUDIES<br />
Several recurring and important <strong>the</strong>mes are apparent in <strong>the</strong> TBC studies done to date.<br />
First, <strong>the</strong> TBC tends to be a relatively high salinity environment with chronic dissolved<br />
oxygen problems, particularly at depth. The problem is more prevalent upstream than<br />
in McKay Bay. Yet, <strong>the</strong> lack of a statistically significant relationship between flow and<br />
DO suggest that more complex factors are involved. Heavy salinity stratification occurs<br />
during high flow and <strong>the</strong> presence of a ‘sill’ at US 41 greatly reduces mixing at depth.<br />
Phytoplankton blooms are likely to occur during low-flow conditions, while ‘wash-out’ of<br />
phytoplankton is likely to occur during high flows.<br />
Benthic macroinvertebrates do not show a clear quantitative response to changes in<br />
freshwater inflows but do appear to be influenced by hypoxic events. No statistically<br />
significant relationship with inflow could be found.<br />
The spatial distribution of significant fish and zooplankton taxa does not suggest a<br />
preferred salinity regime.<br />
2.16 RECENT STUDIES OF THE TBC<br />
The 1999 Peer Review Panel made specific recommendations to <strong>the</strong> District <strong>for</strong><br />
additional studies to support a zero flow MFL determination <strong>for</strong> <strong>the</strong> TBC. In response to<br />
_____________________________________________________________________________________________________<br />
2.0 Basin Description & History<br />
2-30
May 15, 2005 Draft<br />
those recommendations, <strong>the</strong> DISTRICT conducted, or contracted <strong>for</strong> additional studies<br />
totaling $ 247,000. Each is briefly summarized below.<br />
2.16.1 Hydrodynamic Model<br />
In 2001 and again in 2003, <strong>the</strong> DISTRICT contracted with Dr. Mark Lu<strong>the</strong>r of <strong>the</strong><br />
University of South Florida (USF) to utilize an existing high-resolution 3-dimensional,<br />
hydrodynamic circulation model of <strong>Tampa</strong> Bay to evaluate <strong>the</strong> flow/salinity relationships<br />
<strong>the</strong> Palm River/TBC up to S-160. The model was used to simulate varying flow<br />
scenarios based on <strong>the</strong> 1990-1991 ambient flows and <strong>the</strong> 2001-2003 flows.<br />
A companion purchase order was issued to HSW, Inc to provide estimates of ungaged<br />
flows to USF <strong>for</strong> inclusion in <strong>the</strong> hydrodynamic model.<br />
2.16.2 Oysters<br />
The District contracted with Mote Marine Laboratory (MML) in 2001 to conduct field and<br />
aerial surveys of <strong>the</strong> McKay Bay/TBC complex to locate mollusk communities. Potential<br />
oyster reefs identified from aerial reconnaissance and existing aerial photography were<br />
field-verified and <strong>the</strong> geographic locations identified by global position system (GPS)<br />
were converted to ArcView © geographic in<strong>for</strong>mation system (GIS) database.<br />
In 2004, <strong>the</strong> District issued a Purchase Order to Dr. Aswani Volety of <strong>the</strong> Florida Gulf<br />
Coast University (FGCU) to evaluate <strong>the</strong> health and salinity requirements of oysters in<br />
<strong>the</strong> McKay Bay / TBC complex as well as <strong>the</strong> Alafia River. Field support was furnished<br />
by MML and <strong>the</strong> previously located oyster communities were re-inspected.<br />
2.16.3 Benthic Communities<br />
The District contracted with Dr. Chet Reckinowski of <strong>the</strong> University of Sou<strong>the</strong>rn<br />
Mississippi (USM) in 2001 to compile, standardize and analyze existing data on <strong>the</strong><br />
benthic community in <strong>the</strong> Alafia River and <strong>the</strong> McKay Bay/TBC<br />
2.16.4 Fishes / Invertebrates<br />
The District contracted with Dr. Ernst Peebles of USF to compile and evaluate fish and<br />
invertebrate data collected within <strong>the</strong> TBC complex. The database was compiled from<br />
<strong>the</strong> results of 875 seine deployments, 325 trawl deployments and 768 plankton tows.<br />
2.16.5 Water Quality Database Updates<br />
Janicki Environmental, Inc. (JEI) was awarded a purchase order in 2004 to update<br />
previous water quality databases and regressions <strong>for</strong> both TBC and <strong>the</strong> Alafia River.<br />
In addition to updating <strong>the</strong> water quality databases, JEI re-evaluated salinity/flow<br />
regressions <strong>for</strong> five fixed location stations (frequently referred to as <strong>the</strong> “WAR” stations)<br />
and <strong>for</strong> <strong>the</strong> dataset collected by continuous recorders.<br />
_____________________________________________________________________________________________________<br />
2.0 Basin Description & History<br />
2-31
May 15, 2005 Draft<br />
2.16.6 Compilation of Background / History<br />
The District contracted with Florida Environmental (currently doing business as<br />
Earthbalance Inc.) to compile <strong>the</strong> history of <strong>the</strong> previous TBC MFL ef<strong>for</strong>ts and to<br />
summarize <strong>the</strong> peer review report. Mr. Don Ross (owner) served on <strong>the</strong> original Peer<br />
Review Panel convened by <strong>the</strong> District.<br />
2.16.7 Dissolved Oxygen<br />
Chronically low dissolved oxygen (DO) is a well-known water quality characteristic of<br />
<strong>the</strong> TBC. However, much of <strong>the</strong> literature regarding low DO is anecdotal. The District<br />
contracted with HSW, Inc. to conduct a literature search on ei<strong>the</strong>r <strong>the</strong> sub-lethal effects<br />
of hypoxia or quantified effects of chronically low dissolved oxygen.<br />
_____________________________________________________________________________________________________<br />
2.0 Basin Description & History<br />
2-32
May 15, 2005 Draft<br />
CHAPTER 3 ECOLOGICAL RESOURCES<br />
3.1 RESOURCES<br />
Despite <strong>the</strong> highly altered nature of <strong>the</strong> TBC, certain ecological resources are visually<br />
apparent and o<strong>the</strong>rs may be deduced. For example, <strong>the</strong> presence of shoreline<br />
vegetation, birds and fish are readily apparent at any tide stage and oyster<br />
assemblages and benthic infauna are visible at low tide. For <strong>the</strong> present evaluation,<br />
those resources were chosen <strong>for</strong> evaluation. An evaluation of less obvious parameters<br />
of salinity and dissolved oxygen is also include in this section as <strong>the</strong>se two water quality<br />
parameters have <strong>the</strong> potential to shape <strong>the</strong> biotic communities.<br />
3.2 OYSTER REEFS<br />
The majority of <strong>the</strong> McKay Bay/TBC substrate consists of sand or mud. With <strong>the</strong><br />
exception of <strong>the</strong> nor<strong>the</strong>ast lobe of McKay Bay, <strong>the</strong>re is little emergent vegetation. Thus,<br />
oyster reefs have <strong>the</strong> potential to be a significant habitat within <strong>the</strong> system and because<br />
of this it was decided to make preservation of <strong>the</strong> existing reefs a goal of <strong>the</strong> MFL.<br />
McKay Bay is defined by FDEP as a Class III waterbody that by definition prohibits shell<br />
fish harvesting.<br />
While <strong>the</strong> Eastern oyster Crassostrea virginica is a popular food item, <strong>the</strong> real value of<br />
oyster reefs lie in <strong>the</strong> ecological significance that remains largely under-appreciated and<br />
under-studied (Coen et al. 1999a). Eastern oysters have been identified as a keystone<br />
species because of <strong>the</strong>ir ability to <strong>for</strong>m biogenic reefs (Coen et al 1999a, Coen et al.<br />
1999b. It has been suggested by Lenihan and Peterson (1998) that <strong>the</strong> “Loss of oysters<br />
and oyster reef habitat may have important negative consequences <strong>for</strong> <strong>the</strong><br />
sustainability, economic value, and biodiversity of estuarine ecosystems.” Individual<br />
oysters filter 5 liters of water per hour per gram of dry mass (Newell, 1988), removing<br />
phytoplankton, particulate organic carbon (Newell and Langdon 1986), sediments,<br />
pollutants, and microorganisms from <strong>the</strong> water column. This process results in greater<br />
light penetration immediately downstream, thus promoting <strong>the</strong> growth of submerged<br />
aquatic vegetation. Oysters assimilate <strong>the</strong> bulk of <strong>the</strong> organic matter that <strong>the</strong>y filter; <strong>the</strong><br />
remainder is deposited on <strong>the</strong> bottom where it provides food <strong>for</strong> benthic organisms<br />
(Dame and Patten 1981). Bivalves have also been demonstrated to increase<br />
concentrations of nutrients in <strong>the</strong> sediments making <strong>the</strong>m available to seagrasses<br />
(Peterson and Heck 2001). Fur<strong>the</strong>rmore, oysters reefs have been found to harbor<br />
abundances of decapod crustaceans twice that of adjacent seagrass meadows and<br />
fifteen times that of adjacent marsh-edge habitat (Glancy et al. 2003).<br />
3.2.1 Life history<br />
C. virginica is a dioecious alternate hermaphrodite (Mackie 1984) with an annual<br />
reproductive cycle that results in spawning and external fertilization. Oysters respond to<br />
_____________________________________________________________________________________________________<br />
3.0 Ecological Resources 3-1
May 15, 2005 Draft<br />
chemical stimuli and/or temperature and gametogenesis synchronized such that eggs<br />
and sperm are released concurrently to maximize fertilization success (Thompson et al.<br />
1996). They are protandrous – males first and change into females in subsequent<br />
years. Reproductive season and frequency of reproduction varies widely due to<br />
seasonal changes and latitude. Reproduction is predominantly influenced by<br />
temperature and food availability (Langdon and Newell 1996). The synchronization of<br />
spawning is effected by environmental cues in <strong>the</strong> surrounding water and <strong>the</strong> presence<br />
of gametes that stimulate <strong>the</strong> onset of spawning in adjacent oysters (Thompson et al.<br />
1996).<br />
Salinity is also known to affect gametogenesis, condition index and spawning in oysters.<br />
Gametogenesis was impaired at low salinities (< 5 ppt), while normal gametogenesis<br />
occurred above 7.5 ppt (Loosanoff 1953a, b). Oysters from Texas showed suppressed<br />
gonadal activity at salinities < 6 ppt (Butler 1949). Similar trends were observed in <strong>the</strong><br />
Caloosahatchee river oysters in 2003 when <strong>the</strong> river was significantly fresh water given<br />
<strong>the</strong> regulatory freshwater releases (Volety, unpublished results).<br />
After external fertilization, oyster egg undergoes through a series of larval<br />
trans<strong>for</strong>mations and larval stages. The larval stages are planktotrophic and omnivorous,<br />
grazing on phytoplankton, detritus, and bacteria growing over a 2-3 week period. If<br />
appropriate stimuli occur, <strong>the</strong> oyster larva cements itself to <strong>the</strong> substrate on its left valve<br />
and metamorphoses, after which it is called "spat". Upon cementation, oyster spat (and<br />
ultimately juvenile and adult oyster) depends on <strong>the</strong> surrounding water column and<br />
water currents to bring food over <strong>the</strong> reef and transport waste ad sediment away<br />
(Kennedy 1996). This setting of spat is approximately 14-21 days after fertilization<br />
depending on <strong>the</strong> water temperature and salinity (Carriker 1996). Spat size ranges<br />
between 248 – 400 µm (Carriker 1986).<br />
The gametogenic cycle of eastern oysters (Kennedy and Battle 1964) is similar to o<strong>the</strong>r<br />
marine invertebrates from temperate environments. The precise timing of<br />
gametogenesis varies by latitude and temperature. Oyster gametes ripen earlier in<br />
individuals that inhabit <strong>the</strong> sou<strong>the</strong>rn end of <strong>the</strong> species distribution. This is undoubtedly<br />
influenced by temperature and food availability. In addition, <strong>the</strong> duration of spawning is<br />
latitudinally influenced. Oysters in sou<strong>the</strong>rn areas have a longer spawning period<br />
compared to <strong>the</strong>ir nor<strong>the</strong>rn counterparts. In <strong>the</strong> Gulf Coast and north up to Virginia coast<br />
on <strong>the</strong> east coast of <strong>the</strong> Atlantic, major spawning occurs in <strong>the</strong> spring, with minor<br />
spawning through <strong>the</strong> summer and ano<strong>the</strong>r major spawning in <strong>the</strong> fall (Hayes and<br />
Menzel 1981). In oyster populations from SW Florida, Volety et al (2003) documented<br />
continuous oyster spawning from early spring (March) till late Fall (November). A<br />
combination of shallow environments, warm water temperature and food availability<br />
may account <strong>for</strong> <strong>the</strong> long spawning period. In contrast, in <strong>the</strong> nor<strong>the</strong>rn latitudes, major<br />
spawning is restricted to <strong>the</strong> summer. This could be correlated with both declining<br />
temperatures and phytoplankton availability in <strong>the</strong> face of declining daylight hours. The<br />
fact that sou<strong>the</strong>rn populations of oysters initiate gametogenesis and spawn earlier in <strong>the</strong><br />
_____________________________________________________________________________________________________<br />
3.0 Ecological Resources 3-2
May 15, 2005 Draft<br />
year compared to nor<strong>the</strong>rn ones suggests that water temperature may be <strong>the</strong> most<br />
dominant factor influencing reproduction of oysters.<br />
O<strong>the</strong>r unfavorable conditions such as low salinities may also influence <strong>the</strong><br />
phytoplankton composition and quantity affecting gametogenesis in oysters as<br />
evidenced in <strong>the</strong> Caloosahatchee River in 2003 (Volety et al., unpublished results).<br />
While variations in salinity appear to play a less important role in spawning, low<br />
salinities (< 5 ppt) can inhibit gametogenesis (Butler 1949, Loosanoff 1953a, Volety et<br />
al., unpublished results). In addition, investigations by Volety et al. (2003) revealed that<br />
exposure to salinities < 3 ppt <strong>for</strong> over 1 week are lethal to juvenile oysters from SW<br />
Florida.<br />
These results suggest that larvae and juvenile are more sensitive to salinity<br />
requirements compared to <strong>the</strong> adult oysters, which can tolerate a wide variety of<br />
salinities (Wilson 1969). Salinity is an important and influential factor, limiting <strong>the</strong><br />
distribution of many aquatic animals (Gunter 1961, Wells 1961) and is considered <strong>the</strong><br />
single most important factor affecting oyster populations (Butler 1949). However,<br />
synergistic activities of temperature and salinity are strong and affect virtually every<br />
aspect of metabolic activity including feeding, respiration, utilization of energy reserves,<br />
gonadal development, time of spawning, host-parasite interactions, predation rates,<br />
growth, and distribution (Shumway 1996).<br />
3.2.2 Distribution, tolerance and survival of adult oysters<br />
Adult oysters can tolerate a wide range of salinities ranging from 0 – 42.5 ppt. While <strong>the</strong><br />
normal range of salinity <strong>for</strong> survival varies between 1.2 – 40 ppt, normal species<br />
distribution occurs between 5 – 40 ppt (Ingle and Dawson 1953, Loosanoff 1953a, Wells<br />
1961, Galtsoff 1964, Menzel et al. 1966). Oysters can indefinitely survive at salinities 4-<br />
5 ppt (Loosanoff 1932, Volety et al. 2003). Although <strong>the</strong> optimal salinity range varies<br />
latitudinally and geographically, it is widely accepted that optimal salinity range <strong>for</strong><br />
oysters is between 14 – 28 ppt (Butler 1949, Chanley 1958, Galtsoff 1964), including<br />
those in SW Florida estuaries (Volety et al. 2003). In addition, oysters can survive<br />
salinities as low as 2 ppt <strong>for</strong> a month, or near zero salinity <strong>for</strong> several days when<br />
temperatures are low (Gunter 1953, Volety et al. 2003). Self sustaining populations<br />
occurred when salinities were as low as 0.2 – 3.5 ppt <strong>for</strong> five consecutive months<br />
annually (Butler 1952), including those in <strong>the</strong> upstream Caloosahatchee River and<br />
Faka-Union estuaries in SW Florida that encounter zero salinities <strong>for</strong> several months<br />
when regulatory fresh water releases are made (Volety and Savarese 2001, Savarese<br />
et al. 2003, Volety et al. 2003).<br />
Juvenile oysters less than 1 year old survived salinities of 5 ppt (Chanley 1958, Volety<br />
et al. 2003), however, very little growth is observed below 5 ppt, slow growth observed<br />
at 12 ppt, and normal growth occurred between 12 – 27 ppt (Chanley 1958). Under<br />
laboratory conditions, Volety et al. (2003) observed high mortality (40-75%) of juvenile<br />
oysters exposed to
May 15, 2005 Draft<br />
Butler (1954) described distinct types of oyster reefs at different salinity regimes in <strong>the</strong><br />
Gulf of Mexico estuaries. Reefs near <strong>the</strong> head of an estuary experiencing salinity<br />
ranges of 0 – 15 ppt annually, oyster populations are small, rounded, and sparse given<br />
high annual mortality rates (Butler 1954, Volety et al. 2001, Savarese et al. 2003). Spat<br />
recruitment and growth rates are also low. Where salinities are between 15 – 20 ppt,<br />
populations are dense, reproductive activity high, predator numbers low, and spat<br />
recruitment and growth rates (high or low <strong>for</strong> spat/growth?). Near <strong>the</strong> mouth of a typical<br />
Gulf Coast estuary with a salinity of 25 ppt, growth and reproductive rates are typically<br />
high, however, predation and competition are also high. When <strong>the</strong> estuary opens into<br />
<strong>the</strong> high-salinity Gulf waters, oyster reefs are sparse, spat recruitment and growth are<br />
low, diseases and predators are high, and suitable cultch is lacking. Similar trends are<br />
observed by Volety et al. (2003), Volety and Savarese (2001), and Savarese et al.<br />
(2003).<br />
High salinities also invite various predators such as crabs, starfish, boring sponges,<br />
oyster drills and diseases (see below). For example, oyster drills Thais hemastoma,<br />
Thais lapillus, Urosalpinx cinera, and Eupleura caudata dominate high salinity waters<br />
(Butler 1954, Galtsoff 1964, Manzi 1970, Shumway 1996). In addition, <strong>the</strong> boring<br />
sponge, Cliona spp. and xanthid crabs, stone crabs abound in high salinity waters<br />
(Hopkins 1962, Menzel et al. 1966, MacKenzie 1970). O<strong>the</strong>r species that are tolerant of<br />
low salinities, but pose serious threat to oysters include starfish Asteria <strong>for</strong>besi, whelk<br />
Fasciolaria hunteria (Loosanoff 1945, Wells 1961), flatworm Stylocus ellipticus<br />
(Loosanoff 1956), and blue crab Callinectes sapidus (Menzel et al. 1966).<br />
In addition to <strong>the</strong> direct effects of high salinity and <strong>the</strong> indirect effect of increased<br />
predation, salinity is a controlling factor in <strong>the</strong> diseases caused by <strong>the</strong> protozoan<br />
parasite, Perkinsus marinus. P. marinus has devastated oyster populations in <strong>the</strong><br />
Atlantic (Burreson and Ragone-Calvo 1996), where it is currently <strong>the</strong> primary pathogen<br />
of oysters, as well as in <strong>the</strong> Gulf of Mexico (Soniat 1996). Andrews (1988) estimated<br />
that P. marinus can kill ~80% of <strong>the</strong> oysters in a reef. The distribution and prevalence of<br />
P. marinus is influenced by temperature and salinity with higher values favoring <strong>the</strong><br />
disease organism (Burreson and Ragone-Calvo 1996, Soniat 1996, Chu and Volety<br />
1997, La Peyre et al. 2003). Soniat (1985) observed that <strong>the</strong> weighted incidence of P.<br />
marinus in <strong>the</strong> Gulf of Mexico oysters was explained by <strong>the</strong> interactive effects of<br />
temperature and salinity. In addition, laboratory studies by Volety (1995), and, Chu and<br />
Volety (1997) suggested that salinity to be <strong>the</strong> most important factor influencing <strong>the</strong><br />
disease susceptibility and disease progression of P. marinus in oysters.<br />
Volety and Tolley (2004) have summarized <strong>the</strong> habitat requirements <strong>for</strong> oysters. The<br />
results are provided in Table 3-1.<br />
3.2.3 Management Implications<br />
_____________________________________________________________________________________________________<br />
3.0 Ecological Resources 3-4
May 15, 2005 Draft<br />
Clearly, both high salinity and extended low salinity can be detrimental to oysters. Under<br />
current water management practices, oysters in nearby Caloosahatchee Estuary are not<br />
stressed by low flows (< 300 cfs),<br />
Table 3 –1<br />
Oyster Habitat Requirements<br />
Variable<br />
salinity<br />
temperature<br />
substrate<br />
salinity<br />
temperature<br />
substrate<br />
Value<br />
Larvae<br />
Limits 5 - 35 ppt<br />
Optimal 10 - 30 ppt<br />
Peak 20 - 22 ppt<br />
Settlement Peak 25 - 29 ppt<br />
Optimal 20 - 30 o C<br />
Optimal - shells of live or dead oysters<br />
O<strong>the</strong>r - rocks, wood material, gravel, solid<br />
refuse, calcareous remains of o<strong>the</strong>r<br />
mollusks.<br />
Adult<br />
Normal 10 - 30 ppt<br />
Optimal 10 - 20 ppt<br />
Tolerate 5 - 40 ppt<br />
Optimal 20 - 30 o C<br />
Tolerate 1 - 49 o C<br />
Stop Feeding 6 - 7 o C<br />
Physiological Function Cease 42 o C<br />
O<strong>the</strong>r - rocks, wood material, gravel, solid<br />
refuse, calcareous remains of o<strong>the</strong>r<br />
mollusks.<br />
but are stressed due to high flows<br />
exceeding 3,000 cfs <strong>for</strong> extended<br />
periods (2-4 weeks). In essence,<br />
<strong>the</strong> more important management<br />
issue is to set a maximum flow<br />
ra<strong>the</strong>r than a minimum flow.<br />
However, <strong>the</strong> MFL statute is<br />
explicit in specifying <strong>the</strong> limit at<br />
which . . . . fur<strong>the</strong>r withdrawals<br />
would be significantly harmful.<br />
Clearly, water management<br />
operations can alter salinity<br />
regimes that result in significant<br />
harm to <strong>the</strong> ecology, but <strong>the</strong> cause<br />
is not excessive withdrawals.<br />
In <strong>the</strong> Caloosahatchee estuary,<br />
highly managed releases from<br />
Lake Okeechobee cause low<br />
salinity problems when discharges<br />
exceed 3,000 cfs. Volety and<br />
Tolley (2004) recommended that<br />
minimum and maximum flows from<br />
Lake Okeechobee into <strong>the</strong><br />
Caloosahatchee Estuary be<br />
maintained at 500 and 2,000 cfs respectively, <strong>for</strong> <strong>the</strong> development of oyster reefs.<br />
These flows would result in a salinity regime of between 16 and 28 ppt. They also<br />
recommended that when freshwater releases are necessary, repeated pulsed releases<br />
of < 1 week duration during winter months be made instead of sustained releases of<br />
freshwater during summer or winter months.<br />
3.2.4 Occurrence of Oysters in McKay Bay/TBC<br />
During 2001-2002 MML conducted an aerial and field survey of mollusks in McKay<br />
Bay/TBC complex. Oysters were found on emergent substrate (mangrove roots,<br />
pilings, navigation aids etc.) as well as in patch reef communities in established in open<br />
water over hard level bottom. An estimated 8,100 m 2 in 26 locations were identified by<br />
MML as shown in Figure 3-1 Large populations of mussels were also noted amongst<br />
<strong>the</strong> mangrove root systems.<br />
_____________________________________________________________________________________________________<br />
3.0 Ecological Resources 3-5
May 15, 2005 Draft<br />
Segment 1<br />
#<br />
Segment 4 #<br />
#<br />
#<br />
#<br />
# #<br />
#<br />
# # #<br />
#<br />
#<br />
# #<br />
# # #<br />
#<br />
#<br />
# ## #<br />
#<br />
# # # # #<br />
Segment 5<br />
##<br />
#<br />
# # #<br />
#<br />
# #<br />
# # # # # # # # # # # #<br />
NW McKay Bay<br />
NE McKay Bay<br />
Segment 3<br />
#<br />
# #<br />
#<br />
#<br />
Segment 2<br />
South McKay Bay<br />
Segment 6<br />
#<br />
Segment 7<br />
Oysters<br />
Dense Reef<br />
Intermittent Reef<br />
Patch Reefs<br />
Segments<br />
Figure 3-1 Oyster Communities Identified by Mote Marine Lab<br />
3.2.5 TBC Oyster Community and S-160 <strong>Flows</strong><br />
Of note is <strong>the</strong> fact that oyster reefs are found along<br />
almost <strong>the</strong> entire length of TBC, suggesting that <strong>the</strong><br />
salinity gradient is not limiting. A segmentation<br />
scheme of approximately 1 km (0.6 mile) lengths<br />
running along <strong>the</strong> thalweg was developed <strong>for</strong> <strong>the</strong> TBC<br />
(Figure 3-1) to evaluate whe<strong>the</strong>r a salinity gradient<br />
existed. Observed (1974-2003) salinities were<br />
compiled from all known monitoring programs,<br />
incorporated into a GIS database and assigned to <strong>the</strong><br />
segments. The baseline (flood diversions only, no<br />
water supply withdrawals) S-160 flow <strong>for</strong> 1974 - 2004<br />
was divided into five flow classes based on percentile<br />
rank as shown in Table 3-2.<br />
Table 3-2<br />
S-160 Baseline Flow<br />
Percentile (cfs)<br />
5% 21<br />
10% 30<br />
20% 42<br />
25% 48<br />
30% 52<br />
40% 59<br />
50% 67<br />
60% 78<br />
70% 94<br />
75% 103<br />
80% 117<br />
90% 184<br />
95% 331<br />
_____________________________________________________________________________________________________<br />
3.0 Ecological Resources 3-6
May 15, 2005 Draft<br />
Box and whisker plots 6 of <strong>the</strong> observed salinities (Figure 3-2) were developed <strong>for</strong> each<br />
segment and flow category. Horizontal lines were added at <strong>the</strong> 10 and 30 ppt<br />
corresponding to <strong>the</strong><br />
optimal range <strong>for</strong> larval<br />
oysters and <strong>the</strong> normal<br />
range <strong>for</strong> adult oysters.<br />
The results indicate that<br />
<strong>the</strong> majority of <strong>the</strong> time<br />
(between <strong>the</strong> 25-75 th<br />
percentile box ends)<br />
optimal salinities exist <strong>for</strong><br />
both larval and adult<br />
oysters. Of particular<br />
importance is that even <strong>for</strong><br />
salinities observed at very<br />
Table 3-3.<br />
Extreme Low-<strong>Flows</strong> and Observed Salinities<br />
Baseline Flow S-160<br />
Observed Salinity @ Indicated <strong>Flows</strong><br />
Percentile cfs (
May 15, 2005 Draft<br />
Sample Depth =0 - =42 - =59 - =78 - =117 cfs)<br />
27.0<br />
27.0<br />
27.0<br />
27.0<br />
27.0<br />
COX_SALINITY<br />
22.5<br />
18.0<br />
13.5<br />
9.0<br />
COX_SALINITY<br />
22.5<br />
18.0<br />
13.5<br />
9.0<br />
COX_SALINITY<br />
22.5<br />
18.0<br />
13.5<br />
9.0<br />
COX_SALINITY<br />
22.5<br />
18.0<br />
13.5<br />
9.0<br />
COX_SALINITY<br />
22.5<br />
18.0<br />
13.5<br />
9.0<br />
4.5<br />
4.5<br />
4.5<br />
4.5<br />
4.5<br />
0.0<br />
SAMPLE_DEPTH=2<br />
Seg 1<br />
Seg 2<br />
Seg 3<br />
Seg 4<br />
Seg 5<br />
Seg 6<br />
SEGMENT<br />
Sal_FlowPctl.syc<br />
Seg 7<br />
0.0<br />
SAMPLE_DEPTH>=2<br />
Seg 1<br />
Seg 2<br />
Seg 3<br />
Seg 4<br />
Seg 5<br />
Seg 6<br />
SEGMENT<br />
Sal_FlowPctl.syc<br />
Seg 7<br />
0.0<br />
SAMPLE_DEPTH>=2<br />
Seg 1<br />
Seg 2<br />
Seg 3<br />
Seg 4<br />
Seg 5<br />
Seg 6<br />
SEGMENT<br />
Sal_FlowPctl.syc<br />
Seg 7<br />
Figure 3-2 Salinity by Segment and Flow Class (1983 - 2003) (Horizontal Lines Represent Optimal (10 - 30 ppt) and Peak (15 - 25 ppt) Salinity <strong>for</strong> Oysters<br />
_________________________________________________________________________________________________________________________________________________________________________________________________________________________________________<br />
3.0 Ecological Resources 3-8
May 15, 2005 Draft<br />
In conclusion, <strong>the</strong> salinity<br />
resulting from zero and lowflow<br />
conditions is not<br />
threatening to <strong>the</strong> oyster<br />
community in McKay<br />
Bay/TBC complex. Thus, an<br />
MFL <strong>for</strong> <strong>the</strong> protection of <strong>the</strong><br />
oyster community is not<br />
warranted. However, high<br />
flows are impacting <strong>the</strong> oyster<br />
community and to <strong>the</strong> extent<br />
possible without jeopardizing<br />
<strong>the</strong> flood control function of<br />
<strong>the</strong> TBC, discharge of flows<br />
higher than 2,000 cfs should<br />
be limited to a maximum<br />
duration of two weeks.<br />
S-160 Discharge (cfs)<br />
35<br />
30<br />
25<br />
20<br />
15<br />
10<br />
5<br />
5,0000<br />
4,000<br />
3,000<br />
2,000<br />
1,000<br />
0<br />
Mar-99<br />
Mar-99<br />
Jul-99<br />
Jul-99<br />
Nov-99<br />
Nov-99<br />
Mar-00<br />
Mar-00<br />
Jul-00<br />
Jul-00<br />
Nov-00<br />
Lethal Salinity Begins<br />
Nov-00<br />
Mar-01<br />
Segment 1<br />
(McKay Bay)<br />
Mar-01<br />
Jul-01<br />
Jul-01<br />
Nov-01<br />
Nov-01<br />
Mar-02<br />
Mar-02<br />
Jul-02<br />
Jul-02<br />
Oct-02<br />
Oct-02<br />
Feb-03<br />
Feb-03<br />
Jun-03<br />
Jun-03<br />
Oct-03<br />
Sal_Flow_oyst.grf<br />
Oct-03<br />
35<br />
30<br />
25<br />
20<br />
15<br />
10<br />
5<br />
5,000<br />
4,000<br />
3,000<br />
2,000<br />
1,000<br />
0<br />
Salinity (ppt)<br />
3.3 VEGETATION<br />
Figure 3-3 Modeled Salinity Time Series <strong>for</strong><br />
TBC<br />
Descriptions of vegetation in McKay Bay/Palm River are limited to emergent wetland<br />
species and exotics. There is no known submerged aquatic vegetation (D. Tomasko, E.<br />
Estevez, personal communications) in <strong>the</strong> McKay Bay/TBC complex. A shoreline<br />
survey (WAR, 1993) of <strong>the</strong> Palm River above McKay Bay revealed 11,380 feet (3.4 km)<br />
of natural shoreline including 1,700 feet (0.52 km) of exotics. In relative terms, McKay<br />
Bay/ TBC has more natural shoreline (28 percent) than <strong>the</strong> lower Hillsborough (24<br />
percent). The WAR study was purely descriptive and made no projections about <strong>the</strong><br />
impact of altered fresh-water flows on <strong>the</strong> vegetative community.<br />
As part of <strong>the</strong> TBEP MFL advisory group, Coastal Environmental (1997) made<br />
projections about longitudinal salinity changes resulting from various S-160 flow<br />
reductions. Coastal translated those results into change (Table 3-4) in shoreline length<br />
and area in contact with various salinity ranges. The results indicate that because of<br />
<strong>the</strong> inherently high saline <strong>Tampa</strong> Bay, increased flows below 100 cfs (2.8 m 3 /s) are not<br />
effective at reducing salinity. At 200 cfs (5.7 m 3 /s), 43,500 feet (13.3 km) of shoreline<br />
are reduced from > 20 ppt salinity to 10-20 ppt, but none of <strong>the</strong> shoreline is reduced<br />
below 10 ppt.<br />
____________________________________________________________________________________________________<br />
3.0 Ecological Resources 3-9
May 15, 2005 Draft<br />
Table 3-4<br />
Change in TBC Habitat With Increased Flow<br />
Release (cfs) From S-160<br />
Salinity Range Habitat 0 20 40 100 200<br />
0 - 10 Shoreline ( ft) 0 0 0 0 0<br />
Area ( ac) 0 0 0 0 0<br />
10 - 20 Shoreline (ft) 0 0 0 9,919 43,500<br />
Area ( ac) 0 0 0 52 233<br />
> 20 ppt Shoreline ( ft) 0 0 0 - 9,919 - 43,500<br />
Area ( ac) 0 0 0 - 52 -233<br />
Adapted from Appendix N2 of TBNEP, 1997.<br />
During 2000-2002, PBS&J conducted fall and winter shoreline surveys as part of <strong>the</strong><br />
HBMP <strong>for</strong> TBW. PBS&J (2003) reports a total of 55 hectares (136 acres) of emergent<br />
wetland vegetation surrounding McKay Bay and an additional 6.5 hectares (16 acres)<br />
along <strong>the</strong> Palm River. Five vegetative categories were defined, with <strong>the</strong> mangrove<br />
<strong>for</strong>est <strong>the</strong> overwhelmingly dominant category. Table 3-5 provides an area distribution by<br />
classification and location and Figure 3-4 illustrates <strong>the</strong> extent in 1999 as classified by<br />
Florida Department of Transportation’s Florida Land Use, Land Cover Classification<br />
(FLUCC) codes.<br />
Table 3-5<br />
Emergent Vegetation in McKay Bay / Palm River<br />
McKay Bay Palm River/TBC<br />
Classification FLUCC hectares acres hectares acres<br />
Mangrove Swamp 6120 49.1 121.2 0.3 0.7<br />
Cattail 6412 0.0 0.0<br />
Cordgrass 6421 5.7 14.1 0.1 0.2<br />
Needlerush 6422 0.4 0.9<br />
Mixed Herbaceous wetland 6424 6.3 15.6<br />
At <strong>the</strong> outset of <strong>the</strong> present study, it was intended to compare <strong>the</strong> salinity requirements<br />
of McKay Bay/Palm River to changes in salinity that might result from various reduced<br />
flow scenarios. Earlier work by Carter and o<strong>the</strong>rs (Carter, 1973 as summarized by Lugo<br />
and Snedaker, 1974) suggest that <strong>the</strong>re is a minimum energy expenditure associated<br />
with optimal chloride concentrations (from which salinity may be inferred). Carter found<br />
that an increase in <strong>the</strong> chloride gradient across <strong>the</strong> soil/water interface resulted in a<br />
slow-exponential decrease in <strong>the</strong> ratio of 24-hour respiration (R 24 ) to gross primary<br />
production (GPP). Within <strong>the</strong> range of salinities studied (8-30 ppt), <strong>the</strong> GPP increased<br />
as freshwater became more available, but <strong>the</strong> respiration rates also increased. The<br />
increase in respiration is a measure of <strong>the</strong> amount of energy expended to grow in a high<br />
salinity environment.<br />
____________________________________________________________________________________________________<br />
3.0 Ecological Resources 3-10
May 15, 2005 Draft<br />
Vegetation Types<br />
Mangrove Swamp<br />
Cordgrass<br />
Needlerush<br />
Mixed Herbaceous<br />
Figure 3-4 Emergent Vegetation in McKay Bay and Palm River<br />
However promising <strong>the</strong> relationship of R 24 /GPP to water column salinity initially<br />
appeared, contemporary mangrove research seems to focus more on <strong>the</strong> soil salinity<br />
and de-emphasize <strong>the</strong> importance of water column salinity. For example, <strong>the</strong> mangrove<br />
energy transfer model FORMAN (Chen and Twilley. 1998) of mangrove communities<br />
does not include an input term <strong>for</strong> surface water salinity and <strong>the</strong> growth algorithm<br />
assumes that <strong>the</strong>re is no effect <strong>for</strong> salinities between 0 and 40 ppt. In essence, <strong>the</strong> pore<br />
water salinity is not directly related to water column salinity (R. Twilley, email<br />
communication). The lack of relationship is born out locally as USGS investigation (T.<br />
Jones, personal communication) of <strong>the</strong> mangrove communities in Bullfrog Creek<br />
revealed high soil salinities in <strong>the</strong> presence of low water column salinities. This may be<br />
partially result from <strong>the</strong> fact that mangroves can regulate soil salinity through<br />
transpiration (Passioura, et al. 1992).<br />
____________________________________________________________________________________________________<br />
3.0 Ecological Resources 3-11
May 15, 2005 Draft<br />
PBS&J summarized TBC<br />
vegetation tolerance to salinity<br />
(Table 3-6), but pointed out that <strong>for</strong><br />
mangroves at least, low salinity<br />
water is actually <strong>the</strong> preferred<br />
medium, but high salinity water<br />
excludes competition. Table 3-6<br />
indicates that with <strong>the</strong> exception of<br />
cattail, all taxa present can tolerate<br />
<strong>the</strong> entire salinity range likely to<br />
exist in McKay Bay/Palm River<br />
even in <strong>the</strong> absence of freshwater<br />
inflow from S-160.<br />
Table 3-6<br />
Salinity Range of Existing Vegetation<br />
Salinity (ppt)<br />
Classification Tolerance Optimal<br />
Mangrove, black 0 - > 50 ~ 10<br />
Mangrove, red 0 - 60 10 - 37<br />
Mangrove, white 0 - 90 --<br />
Cattail 0 - 10 0<br />
Cordgrass, marsh hay 0 - 40 5 - 10<br />
Cordgrass, saltmarsh 0 - 50 0 - 10<br />
Needlerush, black 0 - 30 0<br />
PBS&J, 1998<br />
Fur<strong>the</strong>rmore, <strong>the</strong> recent Peace River HBMP Comprehensive Summary (PBS&J, 2004)<br />
calls into question <strong>the</strong> value of emergent vegetation as an indicator of salinity changes.<br />
Beginning in 1976 detailed aerial infrared photography of <strong>the</strong> lower river shoreline was<br />
taken providing 28 years of record. Since 1996 <strong>the</strong> photography has been taken in<br />
corrected, GIS compatible images suitable <strong>for</strong> change analysis. First/last occurrences of<br />
a large number of indicator species has developed biennially since 1976 and in 1979<br />
permanent transects were established at three sites. During <strong>the</strong> monitoring period, an<br />
extended drought occurred producing salinity values far beyond what have been<br />
predicted to occur as a result of withdrawals. Despite <strong>the</strong>se extreme events, little<br />
change could be detected. After evaluating this extensive database and in consideration<br />
of <strong>the</strong> inconclusive nature of <strong>the</strong> results, PBS&J has recommended that <strong>the</strong> first/last<br />
occurrence and <strong>the</strong> transect analyses be discontinued and that <strong>the</strong> aerial GIS based<br />
monitoring be reduced from a two-year schedule to a five-year schedule.<br />
The lack of direct relationship of water column salinity to mangrove (<strong>the</strong> dominant<br />
vegetation present), coupled with <strong>the</strong> relative lack of response observed in <strong>the</strong> Peace<br />
system limits <strong>the</strong> use of vegetation as an indicator and suggests that an MFL goal <strong>for</strong><br />
mangroves is probably not warranted.<br />
3.4 BIRDS<br />
The local population of wading birds in <strong>the</strong> <strong>Tampa</strong> Bay system is arguably <strong>the</strong> largest in<br />
<strong>the</strong> state (Paul and Schnapf, 1996) partly because of <strong>the</strong> decline in <strong>the</strong> Everglades. The<br />
<strong>Tampa</strong> Bay population is one of <strong>the</strong> largest in <strong>the</strong> nation, exceeding 34,000 breeding<br />
pairs of 20-25 species of colonial birds. Despite <strong>the</strong>se impressive numbers, several of<br />
<strong>the</strong> common species including <strong>the</strong> brown pelican, snowy egret, herons (little blue, tricolor,<br />
black-crowned and yellow-crowned), white ibis, snowy plover, laughing gull and<br />
black skimmer are declining in response to loss of habitat or alteration of <strong>for</strong>aging<br />
habitat (PBS&J, 1998).<br />
____________________________________________________________________________________________________<br />
3.0 Ecological Resources 3-12
May 15, 2005 Draft<br />
Despite its small size, McKay Bay is among <strong>the</strong> most important areas <strong>for</strong> birds in Florida<br />
(Paul and Woolfenden, 1985). It has had <strong>the</strong> largest number of individuals and species<br />
<strong>for</strong> over 20 years during <strong>the</strong> Audubon Christmas Bird Count (FDCA, 1995) with over two<br />
hundred species recorded over <strong>the</strong> years (FGFWC, 1994).<br />
Given <strong>the</strong> extensive use of McKay Bay, birds represent a significant resource and if<br />
possible, warrant consideration in <strong>the</strong> development of an MFL. Bird usage was included<br />
in <strong>the</strong> TBW HBMP and PBS&J (2004) has attempted to conduct regular bird counts both<br />
in McKay Bay and at an upland site that is hydrologically isolated from McKay Bay.<br />
Two observation stations were established at <strong>the</strong> McKay Bay site, but <strong>the</strong> mangrove<br />
trees in front of one station grew too tall and obscured <strong>the</strong> view of <strong>the</strong> mud flats. Site<br />
two is undergoing <strong>the</strong> same growth and it is anticipated that this site will be abandoned<br />
in <strong>the</strong> near future. Both sites were too far removed <strong>for</strong> identification to <strong>the</strong> species level.<br />
No interpretation of <strong>the</strong> results was reported by PBS&J.<br />
Like vegetation, it is difficult, if not impossible to quantitatively link bird usage with<br />
changing flows from S-160. If present, impacts resulting from changes in freshwater<br />
flow would be indirect – such as changes in benthic prey, or vegetation. Coupled with<br />
<strong>the</strong> fact that <strong>the</strong> aviary population (resident and migratory) is highly mobile, no fur<strong>the</strong>r<br />
attempt to relate freshwater inflow and number of birds was undertaken.<br />
3.5 FISH AND INVERTEBRATES<br />
Fish and invertebrates are important resources to <strong>Tampa</strong> Bay. TBNEP identified ten<br />
species of fish and invertebrates as potential living resource targets. Several species<br />
concentrate primarily in tributaries during part of <strong>the</strong> year. Some species are important<br />
both <strong>for</strong> commercial (pink shrimp, mullet, crabs, and recreational purposes (snook, trout,<br />
tarpon).<br />
3.5.1 Overview of Fish / Invertebrate Distribution and Abundance in McKay Bay/<br />
Palm River<br />
During <strong>the</strong> construction of <strong>the</strong> TBC, Brown (1971) predicted that estuarine fishes and<br />
invertebrates would be negatively impacted by <strong>the</strong> discharge of floodwaters from S-160.<br />
Soon after <strong>the</strong> completion of <strong>the</strong> construction, Price and Schlueter (1984) conducted a<br />
three-year fish survey in lower McKay Bay and concluded that large releases from S-<br />
160 were responsible <strong>for</strong> <strong>the</strong> reduced abundance of estuarine-dependent fishes<br />
encountered during <strong>the</strong> study. They also suggested that <strong>the</strong> community structure in<br />
McKay Bay might change because of S-160 discharges.<br />
A recent evaluation (Peebles, 2004) commissioned <strong>for</strong> this report evaluated <strong>the</strong> change<br />
in community structure as part of a comprehensive evaluation of <strong>the</strong> use of McKay<br />
Bay/TBC by fish and invertebrates and <strong>the</strong> relationship to freshwater inflows. The<br />
database compiled and evaluated by Peebles consisted of 2,111 samples collected<br />
over a six-year period. Similarities among samples were compared across seasons,<br />
inflow levels, and locations along <strong>the</strong> estuarine gradient. Bray-Curtis dissimilarity was<br />
____________________________________________________________________________________________________<br />
3.0 Ecological Resources 3-13
May 15, 2005 Draft<br />
plotted (multidimensional scaling, MDS) and compared across <strong>the</strong>se factors while<br />
looking at four biological groups: seine catch, trawl catch, ichthyoplankton catch, and<br />
invertebrate plankton catch.<br />
Three types of change in community structure were detected. The first and most<br />
consistent change was seasonal, with ichthyoplankton demonstrating <strong>the</strong> strongest<br />
seasonal change. The second was change in invertebrate plankton composition caused<br />
by washout during high-inflow events. Average densities of small, truly planktonic<br />
organisms such as calanoid copepods tended to decrease during high-inflow months.<br />
The introduction of freshwater organisms was not a large contributor to changes in<br />
community structure during months of high discharge. The third and perhaps most<br />
significant change was in <strong>the</strong> shallow-water fish fauna. There were substantial<br />
differences in <strong>the</strong> compositions of <strong>the</strong> seine catches from McKay Bay and <strong>the</strong> Palm<br />
River, with <strong>the</strong> Palm River yielding more estuarine-dependent and estuarine-resident<br />
species.<br />
When examined at a monthly or annual time step, discharges from S-160 were not<br />
found to cause large-scale changes in community structure within <strong>the</strong> Palm River and<br />
McKay Bay as a whole. However, <strong>the</strong> close association between many estuarinedependent<br />
species and <strong>the</strong> area immediately below S-160 suggests that releases<br />
attract <strong>the</strong>se animals ei<strong>the</strong>r directly or indirectly. The control structure physically<br />
truncates <strong>the</strong> estuary functions and it is unclear if <strong>the</strong> attractiveness of freshwater<br />
releases is beneficial or detrimental to estuarine-dependent species. A study to<br />
compare <strong>the</strong> survival rates in <strong>the</strong> Palm River with those in o<strong>the</strong>r tidal would serve to<br />
answer this question.<br />
The distributions of 25 taxa from <strong>the</strong> plankton-net collections were observed to shift in<br />
response to changes of freshwater inflow (Table 3-7). Most (> 60%) of <strong>the</strong>se were<br />
upstream shifts in response to increasing inflow. The upstream shifts appeared to be<br />
related to two-layered estuarine circulation, in which surface outflow draws lower, saline<br />
water upstream. Planktonic animals, including fish eggs, appeared to be entrained in<br />
landward moving bottom water that transported <strong>the</strong>m from McKay Bay into <strong>the</strong> Palm<br />
River when flow exceeded 100-400 cfs.<br />
3.5.2 Habitat Preference<br />
Ano<strong>the</strong>r objective of Peebles’ study was to determine <strong>the</strong> extent to which <strong>the</strong> Palm<br />
River-McKay Bay area was being used as nursery habitat by estuarine-dependent<br />
fishes and invertebrates, with emphasis on those species that are economically or<br />
ecologically important.<br />
Estuarine-dependent animals are defined as species in which <strong>the</strong> adults, eggs, and<br />
larvae are most abundant in higher salinities while <strong>the</strong> juveniles are most abundant in<br />
relatively lower salinities. The adults of some estuarine-dependent species may also be<br />
common in reduced salinity habitats, but migrate to higher salinities to spawn. The<br />
extent of habitat shift is species-specific and is dependent on <strong>the</strong> lengths of local<br />
____________________________________________________________________________________________________<br />
3.0 Ecological Resources 3-14
May 15, 2005 Draft<br />
Table 3-7<br />
Significant Distribution Responses to Inflow<br />
Description Common Name n b m<br />
cirriped cypris barnacle larvae 19 6.27 -0.957 19 45<br />
estuarine gradients. Estuarine dependence is a matter of degree and may be ei<strong>the</strong>r<br />
subtle or pronounced. For example, <strong>the</strong> young of some coastal marine species are most<br />
abundant at <strong>the</strong> mouths of estuaries, yet <strong>the</strong>y remain in moderately high salinities.<br />
r 2<br />
* 100<br />
Lag<br />
Flow<br />
days<br />
Palaemonetes pugio juveniles daggerblade grass 10 -1.45 1.074 51 1<br />
shrimp<br />
Saphirella spp. copepods 17 -1.62 0.824 31 86<br />
Gobiosoma spp. postflexion larvae gobies 31 1.01 0.540 14 118<br />
Anchoa mitchilli postflexion larvae bay anchovy 31 0.41 0.449 13 52<br />
polychaetes<br />
sand worms, tube 46 1.03 0.445 18 1<br />
worms<br />
decapod mysis shrimp larvae 47 0.11 0.438 30 1<br />
Pseudodiaptomus coronatus copepod 40 0.22 0.406 11 118<br />
Anchoa mitchilli eggs bay anchovy 16 -0.20 0.363 39 6<br />
Parasterope pollex ostracod, seed shrimp 46 0.08 0.325 25 62<br />
chaetognaths, sagittid arrow worms 45 0.97 0.325 12 1<br />
fish eggs, percomorph fish eggs 32 0.10 0.308 16 6<br />
decapod zoeae crab larvae 47 0.78 0.293 18 1<br />
Americamysis stucki<br />
opossum shrimp, 28 0.43 0.276 15 84<br />
mysid<br />
Erichsonella attenuata isopod 18 0.38 0.241 23 65<br />
amphipods, gammaridean amphipods 47 0.89 0.178 12 1<br />
Anchoa mitchilli adults bay anchovy 47 0.68 0.143 10 10<br />
Munna reynoldsi isopod 20 1.66 -0.140 22 65<br />
Oikopleura dioica larvacean 38 2.27 -0.197 10 2<br />
Lironeca sp. parasitic isopod 47 2.73 -0.220 14 21<br />
ostracods, podocopid seed shrimps 29 3.72 -0.517 18 25<br />
Limulus polyphemus larvae horseshoe crab 17 4.51 -0.633 65 3<br />
Mnemiopsis mccradyi<br />
comb jelly,<br />
26 6.54 -0.758 27 1<br />
ctenophore<br />
Chrysaora quinquecirrha sea nettle jellyfish 28 7.32 -0.771 29 14<br />
Leptochela serratorbita shrimp 13 5.64 -0.867 13 14<br />
The selected estuarine-dependent assemblage included12 fishes (bay anchovy,<br />
rainwater killifish, Menidia spp, snook, spotted seatrout, sand seatrout, spot, sou<strong>the</strong>rn<br />
kingfish, red drum, striped mullet, clown goby and hogchoker) and three crustaceans<br />
____________________________________________________________________________________________________<br />
3.0 Ecological Resources 3-15
May 15, 2005 Draft<br />
(pink shrimp, blue crab and<br />
daggerblade grass shrimp).<br />
Most of <strong>the</strong>se species<br />
favored shallow Palm River<br />
waters over shallow McKay<br />
Bay waters, whereas deep<br />
McKay Bay waters were<br />
favored over deep Palm<br />
River waters. Mud was<br />
generally preferred over<br />
sand bottom, with both mud<br />
McKay Bay/Palm River Habitat Preference of<br />
Select Estuarine – Dependent Species<br />
1. Palm River Shallow 1. McKay Deep<br />
2. McKay Shallow 2. Palm River Deep<br />
1. Mud 1. Shrubs / Trees<br />
2. Sand 2.Beaches<br />
3. Rock/Oyster<br />
and sand both being preferred over rocks and oysters. Shorelines with shrubs and trees<br />
ranked highest among shoreline types, with beaches ranked <strong>the</strong> lowest.<br />
In <strong>the</strong> present classification system, only those species with pronounced estuarine<br />
dependence are classified as such. In contrast, estuarine species are permanent<br />
residents. These species spend <strong>the</strong>ir entire life cycle within low-salinity habitats and do<br />
not undergoing predictable migrations to o<strong>the</strong>r habitats.<br />
The distributions of <strong>the</strong> selected species were mapped and <strong>the</strong>n compared with <strong>the</strong><br />
distributions of 18 classes of potential prey types, four types of competitor/predator and<br />
two types of parasite. Pink shrimp and blue crabs were most abundant near <strong>the</strong> mouth<br />
of <strong>the</strong> Palm River, as were juvenile sand seatrout. Cumaceans, crab larvae, <strong>the</strong> crab<br />
Pinnixa sayana, amphipods and mysids are potential prey types that were also<br />
abundant in this area. However, o<strong>the</strong>r primarily benthic and infaunal food resources<br />
were not evaluated and may be relevant to <strong>the</strong> distributions of pink shrimp and blue<br />
crabs.<br />
A second area of fish and invertebrate concentration was along shorelines at <strong>the</strong> upper<br />
end of <strong>the</strong> Palm River (below S-160). This area had relatively high densities of young<br />
bay anchovy, snook, spot, red drum, striped mullet, clown goby and hogchoker. All<br />
except <strong>the</strong> clown goby are estuarine-dependent; <strong>the</strong> clown goby is generally considered<br />
to be an estuarine resident. It is clear that many economically and ecologically important<br />
species are attempting to use <strong>the</strong> Palm River as nursery habitat, despite <strong>the</strong> dramatic<br />
alterations that have been made to its physical habitat, water quality and freshwater<br />
inflow pattern. A possible reason <strong>for</strong> <strong>the</strong> apparent preference <strong>for</strong> <strong>the</strong> upper Palm River is<br />
<strong>the</strong> abundance of certain prey types, such as grass shrimp, juvenile bay anchovies, <strong>the</strong><br />
mysid Americamysis almyra and polychaetes. An alternative explanation is an olfactionbased<br />
attraction to chemical cues that are ei<strong>the</strong>r delivered or created by freshwater<br />
inflows.<br />
3.5.3 Relationship of Abundance to Inflow<br />
Elevated inflows (>100 cfs) moved <strong>the</strong> gelatinous predator Mnemiopsis mccradyi<br />
downstream and reduced its overall number. This ctenophore is an efficient predator of<br />
fish eggs and larvae and competes with larval and juvenile fishes <strong>for</strong> zooplankton prey.<br />
____________________________________________________________________________________________________<br />
3.0 Ecological Resources 3-16
May 15, 2005 Draft<br />
The inflow effects on Mnemiopsis distribution and abundance <strong>the</strong>re<strong>for</strong>e enhance <strong>the</strong><br />
Palm River as nursery habitat. Elevated inflows also tended to push ano<strong>the</strong>r important<br />
fish predator, <strong>the</strong> sea nettle Chrysaora quinquecirrha, out of <strong>the</strong> Palm River and into<br />
McKay Bay, but <strong>the</strong> abundance of this animal tended to increase in conjunction with<br />
downstream displacement.<br />
Where possible, <strong>the</strong> relationship between inflow and abundance was quantified. Both<br />
abundance (number organisms) and flow (cfs) was natural log-trans<strong>for</strong>med prior to<br />
analysis. <strong>Flows</strong> included both releases from S-160 and ungaged flow (HSW, 2004)<br />
estimates below <strong>the</strong> structure. Lag flows (moving averages) were developed <strong>for</strong> 1 to<br />
183 prior days of flow. The lag giving <strong>the</strong> highest correlation coefficient (Figure 3-5)<br />
was <strong>the</strong>n tested <strong>for</strong> significance (p
May 15, 2005 Draft<br />
Figure 3-5 Example Lag Flow / Abundance Regression - Pink Shrimp<br />
____________________________________________________________________________________________________<br />
3.0 Ecological Resources 3-18
May 15, 2005 Draft<br />
Figure 3-6 Example Lag Flow Abundance Regression -<br />
Mysids and Anchovies<br />
____________________________________________________________________________________________________<br />
3.0 Ecological Resources 3-19
May 15, 2005 Draft<br />
Table 3-8<br />
Abundance Regression and Example Calculations <strong>for</strong> 30 cfs LFT and 40%<br />
W ithdrawal Above LFT<br />
Plot<br />
Symbol<br />
Fig. 3-7<br />
Description Common Name n b m<br />
S Parasterope pollex<br />
G Anchoa mitchilli juveniles<br />
E Americamysis almyra<br />
K Anchoa mitchilli adults<br />
X Mnemiopsis mccradyi<br />
Z decapod zoeae<br />
J ostracods, podocopid<br />
3 cirriped nauplius stage<br />
1 cumaceans<br />
Q blenniid preflexion larvae<br />
R decapod mysis<br />
Median Flow, cfs<br />
Baseline Alternative<br />
96.0 65.0<br />
8 Farfantepenaeus duorarum pink shrimp 44 7.486 0.4200 18 60 13,791 11,986 -13.1<br />
P amphipods, caprellid<br />
skeleton shrimps 26 13.067 -0.4920 19 93 42,274 48,974 15.8<br />
T Anchoa mitchilli postflexion larvae bay anchovy 31 15.125 -0.6470 20 55 159,301 198,801 24.8<br />
L Lolliguncula brevis juveniles bay squid 23 10.770 -0.2590 21 17 13,958 15,246 9.2<br />
C Americamysis almyra<br />
opossum shrimp, mysid 44 9.514 0.7450 23 1 408,954 303,051 -25.9<br />
W alphaeid postlarvae<br />
snapping shrimps 31 15.178 -0.6960 23 84 128,623 161,363 25.5<br />
F Anchoa mitchilli juveniles<br />
bay anchovy 41 10.551 0.5290 24 2 436,482 352,435 -19.3<br />
I <strong>for</strong>aminiferans<br />
<strong>for</strong>aminiferans 20 8.300 0.4150 24 18 28,729 25,042 -12.8<br />
H Sphaeroma quadridentata<br />
isopod 23 8.543 0.4250 25 34 39,488 34,127 -13.6<br />
4 Anchoa mitchilli eggs<br />
bay anchovy 16 19.012 -1.1630 25 12 758,349 1,151,838 51.9<br />
U Microgobius spp. postflexion larvae gobies 22 13.902 -0.6600 26 114 41,876 51,578 23.2<br />
5 fish eggs, percomorph<br />
sciaenid eggs (primarily) 32 19.612 -1.6600 26 96 94,349 155,191 64.5<br />
V Eusarsiella zostericola<br />
ostracod, seed shrimp 37 14.130 -0.6920 27 118 44,586 55,685 24.9<br />
A polychaetes<br />
sand worms, tube worms 46 10.8 0.846 30 14 2,646,852 1,966,178 -25.7<br />
Y Squilla empusa larvae<br />
mantis shrimp 22 13.986 -0.7420 30 118 30,143 38,257 26.9<br />
6 Anchoa spp. preflexion larvae anchovies 25 18.746 -1.2850 31 44 280,556 430,619 53.5<br />
2 Evadne tergestina<br />
water flea 15 15.789 -0.9590 32 2 87,011 128,222 47.4<br />
D Chrysaora quinquecirrha<br />
sea nettle 28 9.471 0.7310 35 1 367,445 273,829 -25.5<br />
B Harrieta faxoni<br />
isopod 15 9.871 0.7480 40 2 606,083 447,911 -26.1<br />
M Syngnathus scovelli juveniles gulf pipefish 19 11.561 -0.4120 40 118 13,656 15,589 14.2<br />
N Cynoscion arenarius preflexion larvae<br />
sand seatrout 13 11.515 -0.4330 46 1 13,830 16,462 19.0<br />
O Chasmodes saburrae postflexion larvae<br />
Florida blenny 10 11.640 -0.4540 50 3 13,924 16,669 19.7<br />
0 Chasmodes saburrae flexion larvae Florida blenny 13 13.104 -0.7680 53 21 12,776 16,489 29.1<br />
7 Anchoa spp. flex ion larvae<br />
anchovies 26 18.797 -1.3260 55 49 236,032 368,278 56.0<br />
_______________________________________________________________________________________________________________________________________<br />
Average lo ss of 3 significant taxa = 15%<br />
3.0 Ecological Resources 3-20<br />
r 2<br />
*100<br />
Lag Flow<br />
- days<br />
Number Number % Diff<br />
ostracod, seed shrimp 46 16.738 -0.5950 9 118 977,981 1,183,967 21.1<br />
bay anchovy 41 10.930 0.4330 13 25 439,311 381,500 -13.2<br />
opossum shrimp, mysid 44 9.841 0.6390 14 22 391,956 317,816 -18.9<br />
bay anchovy 47 9.768 0.3550 15 3 90,127 78,300 -13.1<br />
comb jelly, ctenophore 26 17.336 -0.7340 15 64 945,629 1,203,540 27.3<br />
crab larvae 47 22.172 -0.7660 15 94 99,064,631 124,469,615 25.6<br />
ostracods, seed shrimps 29 8.685 0.3680 16 52 35,312 31,163 -11.7<br />
barnacles 31 16.718 -1.0770 16 92 92,359 127,604 38.2<br />
cumaceans 47 19.355 -0.7820 17 15 6,354,474 8,329,427 31.1<br />
blennies 36 12.985 -0.5290 18 22 35,244 41,925 19.0<br />
shrimp larvae 47 18.738 -0.5710 18 118 8,137,757 9,776,100 20.1
May 15, 2005 Draft<br />
0 20 40 60 80 100<br />
280<br />
200<br />
240<br />
160<br />
200<br />
Percent Difference<br />
In Abundance<br />
160<br />
120<br />
80<br />
40<br />
120<br />
80<br />
40<br />
0<br />
0<br />
-40<br />
-40<br />
-80<br />
Fish_Abund.grf<br />
0 20 40 60 80 100<br />
Percent Flow Reduction in S-160<br />
(Above 30 cfs ; 10 th Percentile )<br />
-80<br />
Figure 3-7 Change in Abundance as a Function of Reduced <strong>Flows</strong> -<br />
All Taxa<br />
Three species of special significance were identified. The mysid Americamysis almyra,<br />
juvenile bay anchovy and pink shrimp juveniles increased in abundance after periods of<br />
increased inflow. All three have been observed to have positive inflow-abundance<br />
responses in o<strong>the</strong>r <strong>Southwest</strong> Florida estuaries. The mysid and bay anchovy juveniles<br />
are important prey <strong>for</strong> young estuarine-dependent fishes that use tidal rivers as nursery<br />
habitat, and <strong>the</strong> pink shrimp is an economically important species. Figure 3-8 focuses<br />
on <strong>the</strong>se three taxa and illustrates <strong>the</strong> impact of reduced flows on <strong>the</strong>ir abundance,<br />
while Figure 3-9 illustrates <strong>the</strong> impact of varying <strong>the</strong> low-flow threshold.<br />
___________________________________________________________________________________________________<br />
3.0 Ecological Resources 3-21
Alternate_combos.grf<br />
May 15, 2005 Draft<br />
In general, organisms’<br />
responses to freshwater<br />
inflow into <strong>the</strong> Palm River<br />
and McKay Bay were more<br />
subtle than those observed<br />
in o<strong>the</strong>r estuarine areas of<br />
<strong>Southwest</strong> Florida. The<br />
abundance of mysids and<br />
bay anchovy juveniles in <strong>the</strong><br />
Palm River/McKay Bay<br />
estuarine system changed in<br />
response to inflow, but <strong>the</strong>se<br />
changes in abundances<br />
were <strong>the</strong> lowest observed<br />
among seven estuarine<br />
areas surveyed using<br />
identical methods. While <strong>the</strong><br />
response may not be as<br />
direct as noted elsewhere<br />
and <strong>the</strong> structural alterations<br />
P erc en t Di fferen ce<br />
ce<br />
Abundan<br />
In<br />
0<br />
-10<br />
-20<br />
-30<br />
-40<br />
0 20 40 60 80 100<br />
Significant_Taxa.grf<br />
Organisms of Special Concern<br />
Mysid<br />
Bay Anchovy (juvenile)<br />
Pink Shrimp<br />
0 20 40 60 80 100<br />
Percent Flow Reduction in Baseline S-160<br />
(Above 30 cfs Low Flow Threshold)<br />
0<br />
-10<br />
-20<br />
-30<br />
-40<br />
have been significant,<br />
McKay Bay/Palm River<br />
flow/abundance<br />
relationships indicate that<br />
<strong>the</strong> system is still providing<br />
some semblance of<br />
estuarine functionality.<br />
3.6 BENTHOS<br />
The benthos represent an<br />
important food component,<br />
serving as prey <strong>for</strong> fish and<br />
o<strong>the</strong>r upper trophic -state<br />
components. The<br />
distribution, abundance and<br />
composition of <strong>the</strong> benthic<br />
community is a complex<br />
function affected by<br />
currents, physical and<br />
chemical sediment<br />
characteristics, overlying<br />
water quality and predation.<br />
Soft-bottom sand, sand-<br />
Percent Loss in Abundance (3 - Taxa)<br />
Figure 3-8 Abundance / Inflow Relationship<br />
<strong>for</strong> Three Significant Taxa<br />
60<br />
40<br />
20<br />
0<br />
0 20 40 60 80 100<br />
60<br />
40 cfs fit<br />
30 cfs LFT<br />
11 cfs LFT<br />
0 cfs LFT<br />
0 20 40 60 80 100<br />
Percent Withdrawal Above Cut-Off<br />
Figure 3-9 Effect of LFT on Abundance at<br />
Various Withdrawal Rates<br />
___________________________________________________________________________________________________<br />
3.0 Ecological Resources 3-22<br />
40<br />
20<br />
0
May 15, 2005 Draft<br />
gravel and shell are <strong>the</strong> most common along <strong>the</strong> coasts of Florida. The fauna is<br />
generally dominated by polychaete worms, crustaceans, mollusks and insect larvae<br />
(Livingston, 1991). Because benthic animals have limited mobility <strong>the</strong>y are good<br />
indicators of environmental quality at <strong>the</strong> location in which <strong>the</strong>y are found.<br />
3.6.1 Benthos Characterization Metrics<br />
Both species composition and abundance are important considerations when evaluating<br />
a benthic<br />
community. If <strong>the</strong><br />
number of<br />
species is low, but<br />
<strong>the</strong> abundance is<br />
high it is likely that<br />
some stressor is<br />
impacting <strong>the</strong><br />
community.<br />
Several metrics<br />
are commonly<br />
used to describe Paraprionospic pinnata 5<br />
5 39% 10%<br />
<strong>the</strong> benthic<br />
Steninonereis martini 21 1 20% 23%<br />
community. Ampelisca cf. abdita 11 2 33% 20%<br />
Abundance is a Clyclaspis cf. varians 25 3 18% 12%<br />
Oxyurostylus cf. smithi 18 4 24% 10%<br />
measure of <strong>the</strong><br />
total number of<br />
individuals per unit area (typically #/m 2 ), irrespective of <strong>the</strong> number of different types of<br />
organisms present. In contrast, diversity is a measure of <strong>the</strong> number of different<br />
species present. (Diversity is commonly expressed as <strong>the</strong> Shannon-Weiner index (H’).<br />
A healthy community has high diversity.<br />
A benthic index, patterned on <strong>the</strong> index developed by <strong>the</strong> United State Environmental<br />
Protection Agency (EPA) EMAP <strong>for</strong> <strong>the</strong> Louisianian Province was developed <strong>for</strong> <strong>Tampa</strong><br />
Bay (TBNEP, 1996). The index incorporates overall abundance, <strong>the</strong> Shannon-Weiner<br />
index and <strong>the</strong> abundance of tubificid oligochaetes, capitellid polychaetes, gastropods<br />
and amphipods. The <strong>Tampa</strong> Bay Benthic Index scores <strong>for</strong> benthic sample results from<br />
two stations in <strong>the</strong> un-dredged portion of McKay Bay were 14.8 and 14.4 that compares<br />
favorably with Hillsborough Bay (score of 13.3). In contrast Old <strong>Tampa</strong> Bay, Middle<br />
<strong>Tampa</strong> Bay, Lower <strong>Tampa</strong> Bay, Boca Ceiga Bay, Terra Ceia Bay and <strong>the</strong> Manatee<br />
Rive r all had scores between 18.9 and 20.5.<br />
3.6.2 Common Benthic Residents<br />
Table 3-9<br />
Frequency of Occurrence – McKay Bay<br />
Frequency of Occurrence<br />
Ranking Percent Occurrence<br />
Taxa Shallow Deep Shallow Deep<br />
Capitella capitata 1 40 51% 1%<br />
Glycinde soitaria 2 11 44% 5%<br />
Nemertea sp. 3 17 41% 4%<br />
Amygdalum papyrium 4 37 40% 1%<br />
Data sources specific to McKay Bay/TBC were identified in Chapter 2. In addition to<br />
<strong>the</strong>se, <strong>the</strong> results of a number of studies encompassing <strong>the</strong> greater <strong>Tampa</strong> Bay area<br />
were summarized by PBS&J (1998).<br />
___________________________________________________________________________________________________<br />
3.0 Ecological Resources 3-23
May 15, 2005 Draft<br />
The study conducted by WAR (WAR and SDI, 1995) during 1991 – 1993 identified <strong>the</strong><br />
most abundant McKay Bay organisms as Nereidae sp. and Paraprionospio pinnata<br />
(both polychaetes) and amphipods (Ampelisca abdita). Those results were similar to<br />
<strong>the</strong> frequency of occurrence results developed by PBS&J (2004) during 2000 – 2002 as<br />
part of <strong>the</strong> HBMP study. The HBMP study made a distinction between <strong>the</strong> ‘deep’<br />
stations in dredged canal and <strong>the</strong> ‘shallow’ strata (< 2 m in depth). (WAR stations were<br />
both in McKay Bay in a location equivalent to <strong>the</strong> PBS&J “shallow” strata). Table 3-9<br />
provides <strong>the</strong> ranking <strong>for</strong> <strong>the</strong> five most frequently encountered taxa in each stratum <strong>for</strong><br />
2000 – 2002.<br />
3.6.3 Benthos Samples<br />
Sample locations in McKay Bay/Palm River were presented in Figure 2-15. Grabe et al.<br />
(2004) analyzed Palm River TBEP HIMP results from 1995-1998 and using power<br />
analysis determined that a minimum of 520 samples would be necessary to detect a 20<br />
percent change in mean number of taxa (at a five percent significance level). McKay<br />
Bay samples were less variable, and a power analysis suggested that 80 samples<br />
would be required to detect <strong>the</strong> same level of change.<br />
3.6.4 Benthos Relationship to Abiotic Parameters<br />
Grabe also reported that <strong>the</strong>re was no statistically significant relationship between<br />
salinity and number of taxa <strong>for</strong> ei<strong>the</strong>r <strong>the</strong> Palm River or <strong>for</strong> McKay Bay, although a<br />
significant relationship (at p 2m) showed low densities and low number of taxa. Grabe cites low<br />
DO as common stressor <strong>for</strong> <strong>the</strong> deeper stations.<br />
In contrast to Gabe’s conclusions, but using a combined dataset of WAR results from<br />
McKay Bay/Palm River and <strong>the</strong> Lower Hillsborough river, Rakocinski (2004) reported<br />
that salinity was a significant variable correlating with community structure (followed by<br />
watershed position, season, depth and temporal sequence.)<br />
All researchers who have investigated <strong>the</strong> benthic community in McKay Bay/Palm River<br />
have pointed to chronic hypoxic conditions as a major factor controlling structure and<br />
abundance. Additional ef<strong>for</strong>ts are currently underway to evaluate and quantifiy <strong>the</strong><br />
salinity/benthos relationships <strong>for</strong> all coastal rivers within <strong>the</strong> District.<br />
3.7 WATER QUALITY - SALINITY<br />
In <strong>the</strong> previous TBC MFL, <strong>the</strong> District chose to focus on salinity and DO because <strong>the</strong>se<br />
two parameters are believed to be <strong>the</strong> ‘critical water quality variables affecting <strong>the</strong><br />
abundance and distribution of organisms in <strong>the</strong> Lower Hillsborough River and <strong>the</strong> tidal<br />
reached of <strong>the</strong> <strong>Tampa</strong> <strong>Bypass</strong> <strong>Canal</strong>’ (SWFWMD, 1999). The TBNEP <strong>Minimum</strong> flow<br />
advisory group also deemed <strong>the</strong>se two [TBNEP, 1997) to be <strong>the</strong> most important and <strong>the</strong><br />
___________________________________________________________________________________________________<br />
3.0 Ecological Resources 3-24
May 15, 2005 Draft<br />
subsequent peer review identified (Bedient et al., 1999) <strong>the</strong>se parameters as <strong>the</strong><br />
primary factors affecting habitat quality in <strong>the</strong> McKay Bay/TBC system. Thus, in<br />
accordance with this guidance, <strong>the</strong> present evaluation is focused exclusively on <strong>the</strong>se<br />
two water quality parameters.<br />
Estuarine salinity varies with <strong>the</strong> distance from <strong>the</strong> source of higher saline water and <strong>the</strong><br />
volume and ionic strength of freshwater inflows mixing with <strong>the</strong> saline source. As<br />
previously described (Chapter 3.2), East Bay water serves as <strong>the</strong> source of more saline<br />
water <strong>for</strong> McKay Bay/Palm River. If all of <strong>the</strong> freshwater inputs to McKay Bay/Palm<br />
River were terminated, given sufficient time <strong>for</strong> complete mixing <strong>the</strong> TBC complex would<br />
become isohaline with East Bay. During periods or low to moderate freshwater input at<br />
<strong>the</strong> head of a typical estuary, mixing is nearly complete and <strong>the</strong> salinity varies<br />
longitudinally, but not vertically. In contrast, during periods of high inflows, fresh(er)<br />
water tends to sheet flow at <strong>the</strong> surface over <strong>the</strong> top of more saline water at <strong>the</strong> bottom.<br />
36.0<br />
31.5<br />
27.0<br />
Sal_FlowPctl.syc<br />
36.0<br />
31.5<br />
27.0<br />
Salinity (ppt)<br />
22.5<br />
18.0<br />
13.5<br />
Salinity (ppt)<br />
22.5<br />
18.0<br />
13.5<br />
9.0<br />
9.0<br />
4.5<br />
4.5<br />
0.0<br />
Seg 1<br />
Seg 2<br />
Seg 3<br />
Seg 4<br />
Seg 5<br />
Segment<br />
Seg 6<br />
Seg 7<br />
0.0<br />
Sal_FlowPctl.syc<br />
Seg 1<br />
Seg 2<br />
Seg 3<br />
Seg 4<br />
Seg 5<br />
Segment<br />
Seg 6<br />
Seg 7<br />
Figure 3-10 TBC Salinity 1974 -2003 at < 1 m (left) and > 3 m (right)<br />
The deepening and widening of Palm River that created <strong>the</strong> TBC also created a very<br />
efficient conduit <strong>for</strong> salt water. Figure<br />
3-10 provides a box plot comparison of observed<br />
surface salinity within each segment. Table 3-10 provides May and September quantile<br />
values <strong>for</strong> each segment and portions of McKay Bay. From <strong>the</strong> box plots, it is evident<br />
that very little longitudinal variation exists in <strong>the</strong> Palm River.<br />
Yet, despite <strong>the</strong> lack of longitudinal gradient, strong vertical salinity gradients set up in<br />
response to increased flow. Figure 3-11 depicts a positive relationship between flow at<br />
S-160 and <strong>the</strong> vertical salinity difference within segment 3 (flows>= 5 cfs) <strong>for</strong> <strong>the</strong> period<br />
1991-2003. Figure 3-12 details <strong>the</strong> salinity profiles in Segment 3 when S-160 flows are<br />
___________________________________________________________________________________________________<br />
3.0 Ecological Resources 3-25
May 15, 2005 Draft<br />
Sample Depth (m)<br />
greater than 180 cfs (90 th percentile<br />
observed flow, 1974-2003) and<br />
indicates that a haloclyne develops<br />
approximately 2 meters below <strong>the</strong><br />
surface.<br />
Salinity, as presently estimated from<br />
conductivity, is a gross measure of<br />
ion activity in <strong>the</strong> water. In one<br />
sense, salinity may be considered a<br />
surrogate <strong>for</strong> freshwater inflow but it<br />
also has a more effect on <strong>the</strong><br />
estuarine biota. To survive,<br />
estuarine organism must regulate<br />
<strong>the</strong> osmotic pressure resulting from<br />
changes in salinity. Osmoregulation<br />
consumes energy reserves and in<br />
some taxa (Chapter 3.1.5) lethality<br />
0<br />
1<br />
2<br />
3<br />
4<br />
5<br />
DOSal_Strat_Flow.syc<br />
6<br />
0 6 12 18 24 30<br />
Salinity (ppt)<br />
Figure 3-12 Salinity Profiles :<br />
<strong>Flows</strong> > 180 cfs and Depth > 3 m<br />
(Segment 3)<br />
Salinity (Bottom - Surface, ppt)<br />
30<br />
20<br />
10<br />
0<br />
-10<br />
DOSal_Strat_Flow.syc<br />
10<br />
100<br />
1000<br />
S-160 Discharge (cfs) Observed<br />
Figure 3-11 Salinity Stratification vs<br />
S-160 Flow (Segment 3)<br />
may result when <strong>the</strong> energy expenditure is too<br />
great. Thus, <strong>the</strong> estimation of an estuarine MFL<br />
must consider <strong>the</strong> salinity changes likely to<br />
occur.<br />
For <strong>the</strong> present study, regressions developed by<br />
Janicki Environmental <strong>for</strong> TBW’s HBMP study<br />
were used to estimate <strong>the</strong> salinity response to<br />
flow at S-160. These regressions represent<br />
updated results to <strong>the</strong> regressions used in <strong>the</strong><br />
prior MFL (Coastal Environmental, 1997), which<br />
<strong>the</strong> peer reviewers felt were deficient of low-flow<br />
observations. The original Coastal regressions<br />
were based on <strong>the</strong> WAR/SDI 1991-1993 study<br />
results and validated <strong>the</strong> EPCHC data (1974-<br />
1997) and USGS continuous recordings from<br />
1981-1982 and 1991-1993. The development of<br />
<strong>the</strong> current regressions included observations<br />
from multiple monitoring programs including :<br />
o EPCHC Ambient Water Quality Program (1983-2002)<br />
o EPCHC Independent Monitoring Program (2000 – 2002)<br />
o TBEP Benthic Program (1995-2001)<br />
o TBW HBMP - FWRI Fish and PBS& J Water Quality Components. (2000-2002)<br />
___________________________________________________________________________________________________<br />
3.0 Ecological Resources 3-26
Program results were used to<br />
develop monthly regressions <strong>for</strong><br />
salinity at a) surface, b)1-meter<br />
depth, c)2-meter depth and d)<br />
bottom depth. Separate<br />
regressions were developed <strong>for</strong> <strong>the</strong><br />
Palm River and McKay Bay. The<br />
development of <strong>the</strong> regressions is<br />
documented by Janicki<br />
Environmental in Year 3<br />
Interpretive Report (PBS&J,<br />
2003(b)). A distribution function of<br />
S-160 flows used to develop <strong>the</strong><br />
regressions is given in Figure 3-13<br />
to illustrate <strong>the</strong> difference in flows<br />
available <strong>for</strong> <strong>the</strong> present and prior<br />
regressions. When <strong>the</strong> first<br />
regressions were developed, 20<br />
percent of <strong>the</strong> monitoring day flows were<br />
regressions 20 percent of t<br />
May 15, 2005 Draft<br />
Fraction of Data
1.0<br />
0.9<br />
HBMP_SalComp.syc<br />
May 15, 2005 Draft<br />
1.0<br />
0.9<br />
HBMP_SalComp.syc<br />
Fraction of Data < = Value<br />
0.8<br />
0.7<br />
0.6<br />
0.5<br />
0.4<br />
0.3<br />
0.2<br />
S2 Flow<br />
S4 Flow<br />
Fraction of Data < = Value<br />
0.8<br />
0.7<br />
0.6<br />
0.5<br />
0.4<br />
0.3<br />
0.2<br />
S2 Flow<br />
S4 Flow<br />
0.1<br />
0.1<br />
0.0<br />
0 5 10 15 20 25 30 35<br />
Predicted Salinit y (psu)<br />
0.0<br />
0 5 10 15 20 25 30 35<br />
Predicted Salinity (psu)<br />
Figure 3-14 Palm<br />
River May Surface<br />
Salinities<br />
at Baseline and at Reduc<br />
ed Flow (see text)<br />
Figure 3-15 Palm River<br />
September Surface<br />
Salinities at Baseline and Reduced Flow<br />
(see text)<br />
Table 3-12<br />
Predicted Palm River Salinity Distribution <strong>for</strong> Flow Scenarios S2 and S4.<br />
May<br />
September<br />
Surface<br />
Bottom<br />
Surface<br />
Bottom<br />
5%<br />
10%<br />
20%<br />
30%<br />
40%<br />
50%<br />
60%<br />
70%<br />
80%<br />
90%<br />
95%<br />
S2<br />
18.27 19.03 19.82 20.57 21.28 21.70 22.21 22.69 23.28 24.50 25.31<br />
S4<br />
18.99<br />
19.61<br />
20.51<br />
21.38<br />
21.99<br />
22.29<br />
22.60<br />
23.02<br />
23.68<br />
24.64<br />
25. 49<br />
S2<br />
22.33<br />
22.72<br />
24.82<br />
26.36<br />
26.47<br />
26.51<br />
27.25<br />
28.08<br />
28.58<br />
29.30<br />
30. 24<br />
S4<br />
22.33<br />
22. 72<br />
24. 82<br />
26. 40<br />
26. 50<br />
26. 52<br />
27. 27<br />
28. 12<br />
28. 62<br />
29. 29<br />
30. 24<br />
S2 2. 61<br />
8. 39<br />
13 .89<br />
15 .59<br />
16 .72<br />
17 .18<br />
17 .77<br />
18 .78<br />
19 .39<br />
20 .26<br />
21.80<br />
S4<br />
7.29<br />
10.52<br />
14.81<br />
16.39<br />
17.43<br />
17.85<br />
18.47<br />
19.44<br />
20.05<br />
20.65<br />
21.83 S2<br />
16.54<br />
17.14<br />
20.43<br />
21.73<br />
22.03<br />
22.35<br />
24.32<br />
24.42<br />
25.22<br />
26.32 27.11 S4<br />
17.14<br />
17.14<br />
20.73<br />
21.83<br />
22.23<br />
22.53<br />
24.32<br />
24.42<br />
25.22<br />
26. 32<br />
27.11<br />
___________________________________________________________________________________________________<br />
3.0 Ecological Resources 3-28
May 15, 2005 Draft<br />
3.8 WATER QUALITY - DISSOLVED OXYGEN<br />
Atmospheric oxygen partitions into water and is known as dissolved oxygen, or DO. The<br />
<strong>the</strong>rmodynamic balance is also affected by photosyn<strong>the</strong>sis within <strong>the</strong> water column and<br />
oxidation of both organic and inorganic compounds largely mediated by bacteria. All<br />
members of <strong>the</strong> animal kingdom, including marine vertebrates and invertebrates require<br />
oxygen and all metabolize DO directly from <strong>the</strong> water column. Thus, having an<br />
adequate oxygen supply is critical to <strong>the</strong> health of <strong>the</strong> marine system. Low oxygen<br />
levels between 2 and 0.2 mg/l are termed ‘hypoxic’ and water containing less than 0.2<br />
mg/l are considered ‘anoxic’.<br />
When DO declines to unhealthy levels, motile taxa will leave <strong>the</strong> affected area. But <strong>the</strong><br />
non-motile, largely benthic community responds selectively according to <strong>the</strong> sensitivity<br />
of each taxa to reduced levels. It is widely recognized that poor benthic community<br />
metrics are often accompanied by low ambient DO at <strong>the</strong> time of sampling. WAR/SDI<br />
(1995) attributed depauperate assemblages to hypoxic conditions in <strong>the</strong> Palm River and<br />
Grabe et al. (2004) reported significant DO associations <strong>for</strong> <strong>the</strong> McKay Bay<br />
assemblages. Chronic hypoxia in <strong>the</strong> upper reaches contribute to low abundances.<br />
However, <strong>the</strong> field results do not provide insight on <strong>the</strong> sub-lethal effects of chronically<br />
low DO. The District contracted with HSW, Inc. to conduct a literature search on <strong>the</strong><br />
sub-lethal effects. The results indicated that little research is published about chronic<br />
sub-lethal effects. Laboratory studies included <strong>the</strong> following<br />
o reduced copepod egg production begins at 1.5 mg/l (Marcus, et al. 2003)<br />
o copepod lethality begins around 0.7 mg/l. (ibid.)<br />
o S. benedicti (common estuarine worm) can survive at least two weeks at 1.5 mg/,<br />
but lethality occurs within 55 hours when falls below 0.2 mg/l (Llanso, 1991)<br />
o Atlantic menhaden and spot growth reduction (31-89%) at DO ranging 1.5-2.0<br />
mg/l. (McNatt et al., 2004. Taylor et al.,2002).<br />
o Most fish species are distressed at 2-4 mg/l and mortality begins at
May 15, 2005 Draft<br />
Florida water quality criterion (FAC 62-302) of 4.0 mg/l <strong>for</strong> all segments. As expected,<br />
<strong>the</strong> surface values are higher but <strong>the</strong> median values of upstream segment 7 approaches<br />
4 mg/l.<br />
14<br />
12<br />
10<br />
DO_FlowPctl.syc<br />
14<br />
12<br />
10<br />
DO (mg/l)<br />
8<br />
6<br />
DO (mg/l)<br />
8<br />
6<br />
4<br />
4<br />
2<br />
0<br />
Seg 1<br />
Seg 2<br />
Seg 3<br />
Seg 4<br />
Seg 5<br />
Seg 6<br />
Seg 7<br />
Segment<br />
2<br />
0<br />
DO_FlowPctl.syc<br />
Seg 1<br />
Seg 2<br />
Seg 3<br />
Seg 4<br />
Seg 5<br />
Seg 6<br />
Seg 7<br />
Segment<br />
Sample Depth < 1 meters<br />
Sample Depth > 3 meters<br />
Note – Florida Water Quality Criterion is > 4 mg/l.<br />
Figure 3-16 Dissolved Oxygen 1974-2003<br />
Previous attempts to relate DO to flow have been unsuccessful. Coastal (1997) found<br />
that flow, and lag flow terms had an insignificant (at p
May 15, 2005 Draft<br />
due to sediment oxygen demand (SOD), which consists of both chemical reduction of<br />
sediments and respiration of benthic organisms. Eventually, <strong>the</strong> oxygen content<br />
declines to levels lethal to <strong>the</strong> organisms. SOD kinetics are first-order temperature<br />
dependent, so oxygen levels will decline faster during warm conditions. Dixon et al.<br />
(2003) demonstrated that winter high flows in Charlotte Harbor were much less likely to<br />
produce hypoxic conditions than warm wea<strong>the</strong>r high flows resulting in equivalent salinity<br />
stratification. Most water quality models account <strong>for</strong> this by including a temperature<br />
correction factor <strong>for</strong> SOD (gmO2/m 2 /d) of <strong>the</strong> <strong>for</strong>m SOD T = SOD 20 *1.065 (T-20) ) which<br />
results in an SOD rate increase of 1.8 <strong>for</strong> a 10 o C rise in temperature (Bowie et al., 1985)<br />
which is roughly equivalent to a doubling <strong>for</strong> each ten degree rise. CDM (1998)<br />
calculated that a water column 3 meters deep at 6 mg/l DO would be reduced to<br />
hypoxic conditions in 7 days under typical summer-time conditions in Upper Charlotte<br />
Harbor.<br />
Figure 3-17 illustrates <strong>the</strong> variation of DO with flow class. As previously described<br />
(Figures 3-11 and 3-12), salinity stratification is positively related to flow, but <strong>the</strong> box<br />
plots do not reveal as consistent a relationship with flow.<br />
3.8.1 Re-Evaluation of DO / Flow Relationship(s)<br />
A new evaluation of flow to DO relationship(s) was undertaken in order to take<br />
advantage of <strong>the</strong> extended data set. Similar to previous attempts, flow at S-160 and lag<br />
flows (moving averages of 3, 5, 10, 15, 20, 25,30, 35, 40, 45, 50, 55 and 60 days prior)<br />
were included as independent variables, as well as natural log trans<strong>for</strong>med flow<br />
parameters (0.1 cfs was added to zero flow values). Additional candidate independent<br />
variables were calculated <strong>for</strong> each sampling date and site conditions. Percent DO<br />
saturation (PerSat) was calculated from <strong>the</strong> measured concentration, temperature and<br />
ionic strength. For <strong>the</strong> range of salinity (0-39.8 ppt) and temperature (10-33.9 o C)<br />
observed in <strong>the</strong> combined database, hypoxia begins at a PerSat of approximately 23<br />
percent (range of 18-28 percent). The number of daylight hours was calculated from<br />
each sampling date and site latitude.<br />
Step-wise multi-linear regression was used to determine <strong>the</strong> appropriate independent<br />
parameters <strong>for</strong> each segment and depth. The results are given in Table 3-13, which<br />
provides an adjusted multiple r 2 and standardized coefficients (β weights) <strong>for</strong> each<br />
significant independent term. Auto-correlation of <strong>the</strong> flow terms was of concern and<br />
step-wise selection of terms was used to eliminate some, but not all auto-correlated<br />
terms by maintaining tolerance (1 minus <strong>the</strong> r 2 of independent parameters) values<br />
above 0.1 (Systat, 1998). Thus, while <strong>the</strong> results should be considered with due respect<br />
to <strong>the</strong>se limitations, <strong>the</strong> equations represent <strong>the</strong> best available estimate of DO response<br />
to flow <strong>for</strong> <strong>the</strong> system.<br />
As a rule, <strong>the</strong> surface PerSat is poorly related to flow and with one exception surface<br />
correlation coefficients were generally poor to moderate (r 2 0.5 but does not include a flow term and is based on a relatively<br />
low number of observations (n=30).<br />
___________________________________________________________________________________________________<br />
3.0 Ecological Resources 3-31
May 15, 2005 Draft<br />
Sample < 1 meter<br />
14<br />
12<br />
0-20th Percentile <strong>Flows</strong> (>=0 - =42 - =59 - =78 - =117 cfs)<br />
10<br />
10<br />
10<br />
10<br />
10<br />
DO (mg/l)<br />
8<br />
6<br />
DO (mg/l)<br />
8<br />
6<br />
DO (mg/l)<br />
8<br />
6<br />
DO (mg/l)<br />
8<br />
6<br />
DO (mg/l)<br />
8<br />
6<br />
4<br />
4<br />
4<br />
4<br />
4<br />
2<br />
0<br />
SAMPLE_DEPTH=3<br />
Seg 1<br />
Seg 2<br />
Seg 3<br />
Seg 4<br />
Segment<br />
DO_FlowPctl.syc<br />
Seg 5<br />
Seg 6<br />
Seg 7<br />
2<br />
0<br />
SAMPLE_DEPTH>=3<br />
Seg 1<br />
Seg 2<br />
Seg 3<br />
Seg 4<br />
Segment<br />
DO_FlowPctl.syc<br />
Seg 5<br />
Seg 6<br />
Seg 7<br />
2<br />
0<br />
SAMPLE_DEPTH>=3<br />
Seg 1<br />
Seg 2<br />
Seg 3<br />
Seg 4<br />
Segment<br />
DO_FlowPctl.syc<br />
Seg 5<br />
Seg 6<br />
Seg 7<br />
Figure 3-17 Dissolved Oxygen 1974-2003 at < 1 meter and > 3 meter Depth by Flow Class<br />
_____________________________________________________________________________________________________________________________________________________________________________________________________________________________________________<br />
3.0 Ecological Resources<br />
3-32
Table 3-13 (a)<br />
May 15, 2005 Draft<br />
Regression Summary <strong>for</strong> Surface (
Table 3-13(b)<br />
May 15, 2005 Draft<br />
Regression Summary <strong>for</strong> Deep Bottom (>=3m) Percent Dissolved Oxygen<br />
NW_McK NE_McK S_McK Seg 1 Seg 2 Seg 3 Seg 4 Seg 5 Seg 6 Seg 7<br />
r 2 = 0.630 0.599 0.462 0.608 0.582 0.572<br />
0.537 0.575 0.485<br />
p = 0.013<br />
n/a 0.025 0.000 0.000 0.000 0.000 0.000 0.000 0.000<br />
Standardized Regression Coefficient (beta weights)<br />
Temp -0.422 -0.633 -0.499 -0.678 -0.579 -0.690 -0.564<br />
Day_ Light<br />
-0.205 -0.144<br />
S160<br />
0.318<br />
0.164<br />
3D_Lag<br />
5D_Lag -0.785 -0.278<br />
10D_ Lag<br />
15D_ Lag<br />
-0.323<br />
20D_ Lag<br />
25D_ Lag<br />
0.149<br />
30D_ Lag<br />
35D_ Lag<br />
40D_ Lag<br />
45D_ Lag<br />
-0.219<br />
-0.134<br />
50D_ Lag<br />
55D_ Lag<br />
60D_ Lag 0.553<br />
0.232<br />
0.227<br />
Ln(S160)<br />
Ln(3D)<br />
Ln(5D)<br />
-0.227<br />
Ln(10D)<br />
Ln(15D)<br />
-0.353<br />
Ln(20D) -0.816<br />
-0.546<br />
-0.312<br />
Ln(25D)<br />
-0.143<br />
-0.426<br />
Ln(30D)<br />
Ln(35D)<br />
Ln(40D)<br />
Ln(45D)<br />
Ln(50D) 0.317 -0.226<br />
Ln(55D)<br />
0.267<br />
Ln(60D)<br />
n= 10 3 7 910 568 711 672 696 487 637<br />
DW= 1.071<br />
2. 742 1.396 1.493 1. 218 1.346 1.347 1.282 1.315<br />
Toleran ce
May 15, 2005 Draft<br />
In contrast to <strong>the</strong> surface regressions, most of <strong>the</strong> PerSat regressions <strong>for</strong> deep water<br />
(>=3m) were much stronger with r<br />
2 ranging from 0.46 to 0.63 as shown in Table 3-13(b).<br />
However, <strong>the</strong> McKay Bay segments (highlighted in yellow) are based on a relatively<br />
small number of observations owing to <strong>the</strong> shallow nature of McKay. In addition, <strong>the</strong><br />
same caveats about auto-correlations should be noted <strong>for</strong> <strong>the</strong> bottom results.<br />
The regressions were used to estimate changes in PerSat that would occur under a<br />
reduced flow scenarios, relative to a baseline flow. Lacking a continuous time series of<br />
temperature, a prediction of surface and deep bottom PerSat was developed <strong>for</strong> <strong>the</strong><br />
historical monitoring dates using <strong>the</strong> ambient temperature recorded and <strong>the</strong> daylight<br />
hours appropriate <strong>for</strong> those sample dates. For <strong>the</strong> S1 flow scenario, <strong>the</strong> results are<br />
completely analogous to y-hat results of <strong>the</strong> <strong>for</strong>ward regression expression. For <strong>the</strong><br />
o<strong>the</strong>r two scenarios, only <strong>the</strong> flow (and lag flow) terms were substituted <strong>for</strong> <strong>the</strong> original<br />
observations.<br />
The deep results are illustrated as cumulative distribution functions in Figures 3-18 and<br />
3-19 (results are trimmed to 150 percent saturation). For some segments <strong>the</strong>re is an<br />
overall positive relationship between flow and PerSat, while in o<strong>the</strong>r segments <strong>the</strong><br />
opposite is true. For surface values, this is likely related to chlorophyll and residence<br />
time. During low and moderate flows mixing is more complete, <strong>the</strong> residence time<br />
increases allowing algal blooms to develop and raise <strong>the</strong> DO levels. Higher flows tend<br />
to wash-out <strong>the</strong> blooms and initiate stratification. The higher flows isolate <strong>the</strong> bottom<br />
waters allowing SOD to exert a demand on a shorter water column without atmospheric<br />
recharge. A complete predictive scheme <strong>for</strong> DO will probably require a hydrodynamic<br />
model coupled with a full benthic and eutrophication algorithms. Never<strong>the</strong>less, <strong>the</strong><br />
current regressions do incorporate a wider range of flows than available <strong>for</strong> <strong>the</strong> earlier<br />
ef<strong>for</strong>ts, including long periods of zero flow.<br />
In general, <strong>the</strong>re is little difference in <strong>the</strong> scenarios. The results indicates that <strong>for</strong><br />
segments 1 through 6, <strong>the</strong> reduced flow scenario S4 will result in an increase in PerSat,<br />
with <strong>the</strong> greatest improvements below <strong>the</strong> critical 20-30 percent saturation where<br />
hypoxia begins. The DO response in Segment 7 (immediately below S-160) was<br />
opposite to <strong>the</strong> o<strong>the</strong>rs and declined with declining flows. Table 3-14 compares percent<br />
change (relative to S2) in PerSat <strong>for</strong> deep waters at each segment . The maximum<br />
predicted reduction in PerSat at Segment 7 is ten percent which is within <strong>the</strong> MFL goal<br />
to allow no more than a 15 percent deterioration.<br />
The results of <strong>the</strong> water quality evaluation indicate that stratification commonly occurs in<br />
<strong>the</strong> TBC but that <strong>the</strong> salinity regime is relatively insensitive to flow. The results also<br />
indicate that hypoxic conditions are prevalent, but r 2 values suggest that flow accounts<br />
<strong>for</strong> only about 50 percent of <strong>the</strong> variation. However, using <strong>the</strong> tools identified in this<br />
section flow scenario S4 (30 cfs LFT and 40 percent withdrawal above LFT) will result in<br />
less than a 15 percent degradation of dissolved oxygen.<br />
_____________________________________________________________________________________________________<br />
3.0 Ecological Resources 3-35
May 15, 2005 Draft<br />
1.0<br />
1.0<br />
1.0<br />
0.9<br />
0.9<br />
0.9<br />
0.8<br />
0.8<br />
0.8<br />
Fraction of Data<br />
0.7<br />
0.6<br />
0.5<br />
0.4<br />
0.3<br />
0.2<br />
0.1<br />
Segment 1<br />
S1<br />
S2<br />
S4<br />
S5<br />
Fraction of Data<br />
0.7<br />
0.6<br />
0.5<br />
0.4<br />
0.3<br />
0.2<br />
0.1<br />
Segment 2<br />
S1<br />
S2<br />
S4<br />
S5<br />
Fraction of Data<br />
0.7<br />
0.6<br />
0.5<br />
0.4<br />
0.3<br />
0.2<br />
0.1<br />
Segment 3<br />
S1<br />
S2<br />
S4<br />
S5<br />
0.0<br />
0 50 100 150<br />
Percent DO Saturation, Predicted<br />
0.0<br />
0 50 100 150<br />
Percent DO Saturation, Predicted<br />
0.0<br />
0 50 100 150<br />
Percent DO Saturation, Predicted<br />
Samples >= 3 m<br />
1.0<br />
1. 0<br />
1.0<br />
0.9<br />
0.9<br />
0.9<br />
0.8<br />
0.8<br />
0.8<br />
Fraction of Data<br />
0.7<br />
0.6<br />
0.5<br />
0.4<br />
0.3<br />
0.2<br />
0.1<br />
Segment 4<br />
S1<br />
S2<br />
S4<br />
S5<br />
0.0<br />
0 50 100 150<br />
Percent DO Saturation, Predicted<br />
a<br />
Fraction of Dat<br />
0.7<br />
0.6<br />
0.5<br />
0.4<br />
0.3<br />
0.2<br />
0.1<br />
Segment 5<br />
S1<br />
S2<br />
S4<br />
S5<br />
0.0<br />
0 50 100 150<br />
Pe rcent DO Saturation, Predicted<br />
Fraction of Data<br />
0.7<br />
0.6<br />
0.5<br />
0.4<br />
0.3<br />
0.2<br />
0.1<br />
Segment 6<br />
S1<br />
S2<br />
S4<br />
S5<br />
0.0<br />
0 50 100 150<br />
Percent DO Saturation, Predicted<br />
Figure 3-18 Predicted Percent Saturation <strong>for</strong> Observe d (S1), Baseline (S2) , 40% Withdrawal (S4) and<br />
60% Withdrawal (S5) Scenarios<br />
_____________________________________________________________________________________________________________________________________________<br />
3.0 Ecological Resources<br />
3-36
May 15, 2005 Draft<br />
0.9<br />
3.9 HYDRODYNAMIC MODEL<br />
0.8<br />
Similar to <strong>the</strong> empirical relationships of flow 0.7<br />
and salinity, a hydrodynamic model was<br />
0.6<br />
developed to fur<strong>the</strong>r assess <strong>the</strong> changes in<br />
salinity that might occur with alteration of<br />
0.5<br />
Segment 7<br />
<strong>the</strong> inflows. In 2001, <strong>the</strong> District contracted<br />
0.4<br />
with Dr. Mark Lu<strong>the</strong>r of USF to conduct<br />
S1<br />
0.3<br />
preliminary hydrodynamic modeling of <strong>the</strong><br />
S2<br />
TBC using <strong>the</strong>ir existing bay-wide model.<br />
0.2<br />
S4<br />
S5<br />
The University’s <strong>Tampa</strong> Bay model is<br />
0.1<br />
based on <strong>the</strong> 3-dimensional Princeton<br />
0.0<br />
Ocean Model and consists of 10 layers in<br />
0 50 100 150<br />
Percent DO Saturation, Predicted<br />
Figure 3-19 Predicted Percent DO Saturation <strong>for</strong> Observed (S1),<br />
Baseline (S2), 40% Withdrawal (S4) and 60% Withdrawal (S5)<br />
Scenarios<br />
<strong>the</strong> vertical and 2,244 grids in <strong>the</strong> horizontal (average siz e = 425 ,000 m ). In 2003, <strong>the</strong><br />
District again contracted with USF to develop of regional model (Lu<strong>the</strong>r and Meyers,<br />
2005) by increasing <strong>the</strong> resolution of <strong>the</strong> model grid (average grid size = 44,790 m 2 ) and<br />
<strong>the</strong> number of cells (185) within East Bay, McKay Bay and <strong>the</strong> Palm River. In practice,<br />
boundary conditions are extracted from <strong>the</strong> coarser Bay-wide model <strong>for</strong> <strong>the</strong> regional<br />
model. Both models are driven by high frequency water levels, winds (daily), freshwater<br />
inflows, precipitation, evaporation, temperature and salinity.<br />
Table 3-14<br />
Percent Difference in Predicted PerSat <strong>for</strong> S4 Flow Scenario<br />
Relative to Baseline (S2). (Samples>=3 m)<br />
Data<br />
Fraction of<br />
1.0<br />
2<br />
NW McKay S. McKay Seg 1 Seg 2 Seg 3 Seg 4 Seg 5 Seg 6 Seg 7<br />
Pctl 5 163% 12% 6% 8% 9% 10% 11% 8% -4%<br />
Pctl 10 101% 12% 6% 7% 8% 9% 9% 6% -2%<br />
Pctl 20 68% 12% 5% 6% 7% 9% 5% 5% -5%<br />
Pctl 25 67% 12% 4% 5% 7% 7% 7% 7% -6%<br />
Pctl 30 67% 11% 4% 5% 7% 7% 6% 4% -5%<br />
Pctl 40 63% 10% 3% 4% 4% 5% 5% 5% -10%<br />
Pctl 50 45% 10% 3% 3% 4% 5% 4% 2% -6%<br />
Pctl 60 15% 10% 4% 3% 3% 3% 3% 1% -2%<br />
Pctl 70 3% 8% 5% 3% 3% 3% 1% 1% -1%<br />
Pctl 75 3% 7% 5% 3% 3% 3% 2% 2% -2%<br />
Pctl 80 -1% 6% 4% 3% 2% 3% 2% 1% -3%<br />
Pctl 90 -4% 6% 3% 2% 2% 2% 1% 1% -2%<br />
Pctl 95 -4% 6% 5% 2% 1% 4% 0% 1% -2%<br />
NE McKay - Insufficient Data<br />
________________________________________________________________________________<br />
3.0 Ecological Resources 3-37
May 15, 2005 Draft<br />
3.9.1 Flow Scenarios<br />
Five flow scenarios were provided by <strong>the</strong> District based on ambient conditions in 2001-<br />
2003. The initial flow scenarios were 1) S-1: observed flows from S-160, 2) S-2: a<br />
‘baseline’ flow condition at S-160 of no withdrawals or diversions. The third (S-3) is a<br />
flow condition at S-160 simulating <strong>the</strong><br />
maximum permitted lower pool<br />
REDUCED FLOW SCENARIOS<br />
withdrawal by TBW where S-3 is <strong>the</strong><br />
equivalent of an 80% withdrawal rate<br />
S-160 flow<br />
< 11 cfs<br />
S-3<br />
0<br />
above an 11 cfs cut-off. The two<br />
11 – 54 cfs Excess above 11 cfs<br />
additional S-160 flow scenarios reflect 54 – 125 cfs 80% of total flow<br />
fixed withdrawal percentages above <strong>the</strong> > 125 cfs 100 cfs<br />
a selected low flow threshold of 30 cfs<br />
representing <strong>the</strong> 10 th percentile low-flow<br />
S-160 flow S-4<br />
of baseline scenario S-2. Figure 3-20<br />
illustrates <strong>the</strong> cumulative distribution of<br />
flows <strong>for</strong> each scenario and <strong>the</strong><br />
accompanying Table 3-15 provides a<br />
summary of flows <strong>for</strong> each scenario <strong>for</strong><br />
<strong>the</strong> same time period. Ungaged flow<br />
(runoff and baseflow) below S-160 are<br />
not included in <strong>the</strong> accompanying<br />
figures and tables, but were developed<br />
by HSW, Inc (2004) <strong>for</strong> <strong>the</strong> District and<br />
provided to USF.<br />
Table 3-15<br />
Average Flow (cfs) by Model Period and<br />
Model Days In<br />
Period Period<br />
S-1 S-2 S-3 S-4 S-5<br />
1 195 1 42 11<br />
30 29<br />
2 93 334 339 265 204 137<br />
3 91 55 88 18 54 38<br />
4 151 1 35 11 28 28<br />
5 107 74 64 18 41 33<br />
6 107 767 773 704 464 312<br />
7 151 72 71 16 43 33<br />
8 122 172 135 51 81 55<br />
9 78 54 63 14 39 32<br />
< 30 cfs 0<br />
30 – 50 cfs Excess above 30 cfs<br />
>50 cfs 40% of total flow<br />
S-160 Flow S-5<br />
< 30 cfs 0<br />
30 – 75 cfs Excess above 30 cfs<br />
>75 cfs 60% of total flow<br />
Scenario<br />
Fur<strong>the</strong>r discussion<br />
of <strong>the</strong> flow<br />
scenarios is<br />
warranted because<br />
on <strong>the</strong> short term<br />
evaluations <strong>the</strong><br />
pattern of<br />
estimated<br />
discharge is not<br />
consistent or<br />
straight-<strong>for</strong>ward.<br />
As previously<br />
described, <strong>the</strong>re<br />
are times when<br />
r supply.<br />
more water is transferred from <strong>the</strong> Hillsborough River than is removed <strong>for</strong> wate<br />
Thus, <strong>the</strong> observed discharge may at times be artificially augmented and <strong>the</strong> baseline<br />
flow will actually be less than <strong>the</strong> observed. It should also be emphasized that scenario<br />
S-3 (which is based on TBW’s permit <strong>for</strong> middle and lower pool withdrawals) has an<br />
upper limit which is not included in scenarios S-4 and S-5. Thus, during high flow<br />
________________________________________________________________________________<br />
3.0 Ecological Resources 3-38
May 15, 2005 Draft<br />
periods, while <strong>the</strong> percentage withdrawal of S-4 or S-5 is lower than S-3, <strong>the</strong> total<br />
amount of water removed may actually be greater in <strong>the</strong> S-4/S-5 scenarios due to<br />
withdrawals above 100 cfs. Finally, <strong>the</strong> S-3 withdrawal scenario does not include<br />
diversions by <strong>the</strong> COT. Figures 3-21 and 3-22 illustrate <strong>the</strong> historic diversions<br />
3.9.2 Hydrodynamic Results<br />
The 2001-2003 evaluation period included extended periods of no discharge from S-160<br />
and discharge periods in excess of 4,500 cfs. Nine output periods were identified <strong>for</strong><br />
evalua<br />
tion as illustrated in Figure 3-23. A comparison of modeled results to observed<br />
results at Maydell Drive is given in Figure 3-24.<br />
Figures 3-25 and 3-27 provide a<br />
1.0<br />
description of spatial differences in bottom<br />
salinity <strong>for</strong> a dry period (Figure 3-23) and<br />
0.9<br />
<strong>for</strong> a wet period (Figure 3-24) <strong>for</strong> <strong>the</strong> five<br />
0.8<br />
flow scenarios. Average surface and<br />
S1<br />
0.7<br />
bottom salinity conditions <strong>for</strong> <strong>the</strong> various<br />
S2<br />
flow scenarios are summarized in Table 3- 0.6 S3<br />
S4<br />
16 <strong>for</strong> three points in <strong>the</strong> Palm River – a)<br />
0.5<br />
S5<br />
at <strong>the</strong> confluence of <strong>the</strong> Palm River, b) a<br />
0.4<br />
point located at approximately <strong>the</strong> Maydell<br />
0.3<br />
Drive crossing and c) a point<br />
approximately 400 meters south of S-160 0.2<br />
(See Figure 2-3 <strong>for</strong> geographic reference). 0.1<br />
On average, <strong>the</strong>re is less than a 1.2 ppt<br />
0.0<br />
difference in <strong>the</strong> resultant surface salinity<br />
1.0 10.0 100.0<br />
when compared across <strong>the</strong> five flow<br />
Flow (cfs)<br />
scenarios. The maximum differences<br />
noted were 2.9 ppt and as expected, <strong>the</strong><br />
Figure 3-20 Flow Scenario CDFs<br />
largest differences occurred at <strong>the</strong> highest (2001-2004) [View is trimmed 0.5 -<br />
simulated withdrawal rate (S-3). The 500 cfs]<br />
predicted difference in bottom salinity is<br />
even less, with an average difference of less than 0.9 ppt across flow scenarios<br />
(maximum difference of 2.2 ppt).<br />
Exceedance Probability<br />
During time of low S-160 inflow <strong>the</strong> salinity shows weak vertical stratification throughout<br />
<strong>the</strong> model domain. As <strong>the</strong> flow increases <strong>the</strong> stratification in <strong>the</strong> TBC increases and<br />
spreads into eastern McKay Bay. During periods of extremely high flows, <strong>the</strong><br />
hydrodynamic model predicts 20-30 ppt vertical stratification, roughly analogous to <strong>the</strong><br />
salinity stratification illustrated previously in Figure 3-12.<br />
________________________________________________________________________________<br />
3.0 Ecological Resources 3-39
May 15, 2005 Draft<br />
(mgd)<br />
(mgd)<br />
These periods of stratification are <strong>the</strong><br />
probably <strong>the</strong> most ecologically<br />
significant hydrodynamic events. The<br />
stratification leads to <strong>the</strong> following:<br />
o wash-out of fish and<br />
invertebrates (Chapter 3.4<br />
o low salinities lethal to oysters<br />
(Chapter 3.1)<br />
o set-up hypoxic events that are<br />
lethal to benthos (Chapter 3.7)<br />
Despite <strong>the</strong>se extreme high-flow events,<br />
typical stratification is on <strong>the</strong> order of 3-5<br />
ppt as shown in Table 3-17. These<br />
results are derived from <strong>the</strong> ‘Palm River’<br />
results of Table 3-16(a) and 3-16(b).<br />
Vertically averaged TBC (S-160 to<br />
McKay Bay) pulse residence times<br />
(PRT) were estimated <strong>for</strong> four<br />
representative flow conditions. The<br />
results indicate that residence time is<br />
relatively short (e.g. < 4 days) even<br />
under low flow conditions. For purposes<br />
200<br />
160<br />
120<br />
80<br />
40<br />
0<br />
40<br />
80<br />
120<br />
160<br />
200<br />
01/02<br />
01/02<br />
03/02<br />
TBW_harney.grf<br />
03/02<br />
05/02<br />
05/02<br />
07/02<br />
07/02<br />
09/02<br />
09/02<br />
10/02<br />
10/02<br />
12/02<br />
12/02<br />
02/03<br />
02/03<br />
04/03<br />
Water Transferred INTO<br />
TBC from Hillsborough River<br />
Water Withdrawn<br />
from TBC by TBW<br />
04/03<br />
06/03<br />
06/03<br />
08/03<br />
08/03<br />
10/03<br />
10/03<br />
12/03<br />
12/03<br />
Figure 3-22 TBW Diversions and<br />
Withdrawals from TBC<br />
300<br />
250<br />
200<br />
150<br />
100<br />
50<br />
0<br />
50<br />
100<br />
150<br />
200<br />
250<br />
300<br />
of <strong>the</strong> evaluation, PRT is defined as <strong>the</strong><br />
time <strong>for</strong> 50% of ‘ particle tracers’<br />
introduced as a pulse at <strong>the</strong> head of <strong>the</strong><br />
model (S-160) to be flushed through a<br />
defined length of <strong>the</strong> estuary (in this case,<br />
to <strong>the</strong> confluence of <strong>the</strong> Palm River /<br />
McKay Bay.)<br />
Similar to <strong>the</strong> empirical salinity results<br />
previously described, <strong>the</strong> results derived<br />
from <strong>the</strong> hydrodynamic model also<br />
suggest that <strong>the</strong> TBC is generally<br />
insensitive to changes in flow from S-160.<br />
________________________________________________________________________________<br />
3.0 Ecological Resources 3-40<br />
(mgd)<br />
(mgd)<br />
10000<br />
(mgd)<br />
(cfs)<br />
(cfs)<br />
80<br />
60<br />
40<br />
20<br />
50<br />
40<br />
30<br />
20<br />
10<br />
800<br />
600<br />
400<br />
200<br />
0<br />
12/83<br />
12/83<br />
12/85<br />
12/85<br />
12/87<br />
12/87<br />
12/89<br />
12/89<br />
12/91<br />
12/91<br />
Date<br />
12/93<br />
City of <strong>Tampa</strong> Diversions<br />
From TBC to Reservoir<br />
(Truncated<br />
Display)<br />
12/93<br />
12/95<br />
<strong>Tampa</strong> Bay Water<br />
Withdrawals From TBC<br />
S-160<br />
Discharge<br />
12/95<br />
12/97<br />
12/97<br />
12<br />
12/99<br />
/99<br />
12/01<br />
S160_COT_TBWdisc.grf<br />
12/01<br />
Figure 3-21 TBC Diversions and<br />
Discharges<br />
12<br />
12/03<br />
80 0<br />
/03<br />
140<br />
120<br />
100<br />
80<br />
60<br />
40<br />
20<br />
70<br />
60<br />
50<br />
40<br />
30<br />
20<br />
10<br />
0<br />
1400<br />
1200<br />
1000<br />
800<br />
600<br />
400<br />
200<br />
0<br />
(cfs)<br />
(cfs)<br />
(cfs)
0 cfs<br />
Discharges less than 50<br />
S-160 Observed (cfs)<br />
500<br />
400<br />
300<br />
200<br />
100<br />
6,0000<br />
5,000<br />
4,000<br />
3,000<br />
2,000<br />
1,000<br />
0<br />
0<br />
300<br />
240<br />
180<br />
120<br />
60<br />
600<br />
540<br />
480<br />
420<br />
360<br />
Jan-01<br />
Mar-01<br />
May-01<br />
Jul-01<br />
Sep-01<br />
Nov-01<br />
Jan-02<br />
Mar-02<br />
May-02<br />
Jul-02<br />
Sep-02<br />
Oct-02<br />
Dec-02<br />
Feb-03<br />
Apr-03<br />
Jun-03<br />
Aug-03<br />
Oct-03<br />
Dec-03<br />
Model (Julian) Day<br />
1080<br />
1020<br />
960<br />
900<br />
840<br />
780<br />
720<br />
660<br />
Jan-01<br />
Mar-01<br />
May-01<br />
Jul-01<br />
Sep-01<br />
Nov-01<br />
Jan-02<br />
Mar-02<br />
May-02<br />
Jul-02<br />
Sep-02<br />
Oct-02<br />
Dec-02<br />
Feb-03<br />
Apr-03<br />
Jun-03<br />
Aug-03<br />
May 15, 2005 Draft<br />
Oct-03<br />
Dec-03<br />
06,000<br />
________________________________________________________________________________<br />
3.0 Ecological Resources<br />
3-41<br />
Hydro_Mod.grf<br />
300<br />
200<br />
100<br />
5,000<br />
4,000<br />
3,000<br />
2,000<br />
1,000<br />
Figure 3-23 S-160 Discharge and Model Periods<br />
Evaluated.<br />
[Top graph truncated at 500 cfs <strong>for</strong> legibility.]<br />
500<br />
400<br />
0<br />
Table 3-17<br />
Vertical Salinity Stratification, ppt .<br />
(Derived From Table 10-3)<br />
Average Stratification @ Palm River<br />
(~ 2.1 km Upstream of 22nd St. Causeway)<br />
Bottom - Surface Salinity<br />
Period S-1 S-2 S-3 S-4 S-5<br />
1 2.9 4.4 3.5 4.1 4.2<br />
2 4.2 4.3 4.0 4.3 4.2<br />
3 4.3 5.3 2.9 4.2 3.6<br />
4 2.4 3.7 2.8 3.4 3.4<br />
5 7.4 7.2 6.0 6.7 6.5<br />
6 4.8 4.7 3.5 4.9 5.2<br />
7 2.8 2.8 2.3 2.5 2.5<br />
8 7.9 7.2 5.4 6.2 5.7<br />
9 4.3 4.5 2.8 3.8 3.5<br />
Compare all time periods and flow scenarios :<br />
25th Percentile 3.4 ppt<br />
Median 4.2 ppt<br />
75th Percentile 5.2 ppt
May 15, 2005 Draft<br />
Figure 3-24 Modeled (grey) and Observed (black) Salinity at Maydell<br />
Drive (2001-2003)<br />
___________________________________________________________________________________________________________<br />
3.0 Ecological Resources<br />
3-42
May 15, 2005 Draft<br />
Figure 3-25 Modeled 25-Hour Average Bottom Salinity (Feb 15, 2001)<br />
<strong>for</strong> Five Flow Scenarios<br />
________________________________________________________________________________<br />
3.0 Ecological Resources 3-43
May 15, 2005 Draft<br />
Figure 3-26 Modeled 25-Hour Average Bottom Salinity (Feb 23, 2001)<br />
<strong>for</strong> Five Flow Scenarios<br />
________________________________________________________________________________<br />
3.0 Ecological Resources 3-44
May 15, 2005 Draft<br />
Table 3-16(a)<br />
Average Modeled Surface Salinity <strong>for</strong> Three Locations in Palm River and<br />
Percent Difference with Baseline Flow (S-2). [Maximum Difference Highlighted]<br />
Average Surface Salinity @ Palm River Average Surface Salinity Near Maydel Average Surface Salinity Near S-160<br />
(~ 2.1 km Upstream of 22nd St. Causeway)<br />
(~4.7km Upstream of 22nd St. Causeway)<br />
(~7.1 km Upstream of 22nd St. Causeway)<br />
Period S-1 S-2 S-3 S-4 S-5 Period S-1 S-2 S-3 S-4 S-5 Period S-1 S-2 S-3 S-4 S-5<br />
1 27.8 25.7 26.9 26 25.9 1 27.6 25.5 26.8 25.9 25.8 1 27.0 24.7 26.1 25.1 25.0<br />
2 18.3 18.1 18.9 18.9 19.3 2 15.4 15.1 16.6 16.2 17.0 2 14.7 14.4 16.0 15.5 16.2<br />
3 20.7 19.5 22.4 20.9 21.6 3 20.1 19.0 21.9 20.4 21.1 3 19.6 18.4 21.3 19.8 20.5<br />
4 25.8 24.0 25.2 24.3 24.3 4 25.6 23.8 25.0 24 24.1 4 25.3 23.4 24.6 23.6 23.7<br />
5 20.1 20.3 21.5 20.6 20.9 5 21.5 21.7 22.7 21.9 22.2 5 21.0 21.1 22.2 21.3 21.7<br />
6 13.7 13.8 15.5 14.8 15.5 6 13.7 13.7 15.4 14.6 15.4 6 13.2 13.2 14.9 14.0 14.8<br />
7 18.7 18.7 19.8 19.4 19.5 7 16.8 16.8 18.7 17.8 18.2 7 16.0 16.0 17.9 17.0 17.3<br />
8 14.2 15.0 17.0 16.1 16.8 8 15.6 16.4 18.1 17.3 17.9 8 15.5 16.2 17.8 16.9 17.6<br />
9 20.1 19.9 21.9 20.8 21.1 9 19.7 19.4 21.4 20.3 20.6 9 19.0 18.6 20.7 19.5 19.9<br />
Percent Difference @ Palm River, Surface Percent Difference Near Maydel, Surface Percent Difference Near S-160, Surface<br />
(~ 2.1 km Upstream of 22nd St. Causeway) (~4.7km Upstream of 22nd St. Causeway) (~7.1 km Upstream of 22nd St. Causeway)<br />
= 100 * (Sx-S2) / S2 = 100 * (Sx-S2) / S2 = 100 * (Sx-S2) / S2<br />
Period S-1 S-2 S-3 S-4 S-5 Period S-1 S-2 S-3 S-4 S-5 Period S-1 S-2 S-3 S-4 S-5<br />
1 8% 0% 5% 1% 1% 1 8% 0% 5% 2% 1% 1 9% 0% 6% 2% 1%<br />
2 1% 0% 4% 4% 7% 2 2% 0% 10% 7% 13% 2 2% 0% 11% 8% 13%<br />
3 6% 0% 15% 7% 11% 3 6% 0% 15% 7% 11% 3 7% 0% 16% 8% 11%<br />
4 8% 0% 5% 1% 1% 4 8% 0% 5% 1% 1% 4 8% 0% 5% 1% 1%<br />
5 -1% 0% 6% 1% 3% 5 -1% 0% 5% 1% 2% 5 0% 0% 5% 1% 3%<br />
6 -1% 0% 12% 7% 12% 6 0% 0% 12% 7% 12% 6 0% 0% 13% 6% 12%<br />
7 0% 0% 6% 4% 4% 7 0% 0% 11% 6% 8% 7 0% 0% 12% 6% 8%<br />
8 -5% 0% 13% 7% 12% 8 -5% 0% 10% 5% 9% 8 -4% 0% 10% 4% 9%<br />
9 1% 0% 10% 5% 6% 9 2% 0% 10% 5% 6% 9 2% 0% 11% 5% 7%<br />
_________________________________________________________________________________________________________________<br />
3.0 Ecological Resources<br />
3-45
May 15, 2005 Draft<br />
Table 3-16(b)<br />
Average Modeled Bottom Salinity <strong>for</strong> Three Locations in <strong>the</strong> Palm River and<br />
Percent Difference with Baseline Flow (S-2). [Maximum Difference Highlighted]<br />
Average Bottom Salinity @ Palm River Average Bottom Salinity Near Maydel Average Bottom Salinity Near S-160<br />
(~ 2.1 km Upstream of 22nd St. Causeway) (~4.7km Upstream of 22nd St. Causeway) (~7.1 km Upstream of 22nd St. Causeway)<br />
Period S-1 S-2 S-3 S-4 S-5 Period S-1 S-2 S-3 S-4 S-5 Period S-1 S-2 S-3 S-4 S-5<br />
1 30.7 30.1 30.4 30.1 30.1 1 29.4 28.2 28.8 28.3 28.2 1 28.7 27.4 28.1 27.5 27.5<br />
2 22.5 22.4 22.9 23.2 23.5 2 19.6 19.3 20.5 20.3 20.9 2 18.6 18.4 19.5 19.4 20.1<br />
3 25.0 24.8 25.3 25.1 25.2 3 22.6 22.0 23.6 22.8 23.2 3 21.4 20.8 22.5 21.6 22.1<br />
4 28.2 27.7 28.0 27.7 27.7 4 27.0 26.0 26.7 26.1 26.2 4 26.4 25.3 26.1 25.4 25.6<br />
5 27.5 27.5 27.5 27.3 27.4 5 25.1 25.2 25.6 27.3 27.4 5 24.7 24.7 25.1 24.5 24.8<br />
6 18.5 18.5 19.0 19.7 20.7 6 16.5 16.5 17.6 17.5 18.5 6 15.3 15.3 16.4 16.4 17.4<br />
7 21.5 21.5 22.1 21.9 22.0 7 19.2 19.3 20.4 20 20.2 7 18.5 18.6 19.7 19.2 19.5<br />
8 22.1 22.2 22.4 22.3 22.5 8 19.3 19.7 20.7 20.2 20.7 8 18.9 19.3 20.2 19.7 20.2<br />
9 24.4 24.4 24.7 24.6 24.6 9 22.3 22.1 23.1 22.6 22.8 9 21.1 20.9 22.2 21.5 21.7<br />
Percent Difference @ Palm River, Bottom Percent Difference Near Maydel, Bottom Percent Difference Near S-160, Bottom<br />
(~ 2.1 km Upstream of 22nd St. Causeway) (~4.7km Upstream of 22nd St. Causeway) (~7.1 km Upstream of 22nd St. Causeway)<br />
= 100 * (Sx-S2) / S2 = 100 * (Sx-S2) / S2 = 100 * (Sx-S2) / S2<br />
Period S-1 S-2 S-3 S-4 S-5 Period S-1 S-2 S-3 S-4 S-5 Period S-1 S-2 S-3 S-4 S-5<br />
1 2% 0% 1% 0% 0% 1 4% 0% 2% 0% 0% 1 5% 0% 3% 0% 0%<br />
2 0% 0% 2% 4% 5% 2 2% 0% 6% 5% 8% 2 1% 0% 6% 5% 9%<br />
3 1% 0% 2% 1% 2% 3 3% 0% 7% 4% 5% 3 3% 0% 8% 4% 6%<br />
4 2% 0% 1% 0% 0% 4 4% 0% 3% 0% 1% 4 4% 0% 3% 0% 1%<br />
5 0% 0% 0% -1% 0% 5 0% 0% 2% 8% 9% 5 0% 0% 2% -1% 0%<br />
6 0% 0% 3% 6% 12% 6 0% 0% 7% 6% 12% 6 0% 0% 7% 7% 14%<br />
7 0% 0% 3% 2% 2% 7 -1% 0% 6% 4% 5% 7 -1% 0% 6% 3% 5%<br />
8 0% 0% 1% 0% 1% 8 -2% 0% 5% 3% 5% 8 -2% 0% 5% 2% 5%<br />
9 0% 0% 1% 1% 1% 9 1% 0% 5% 2% 3% 9 1% 0% 6% 3% 4%<br />
_________________________________________________________________________________________________________________<br />
3.0 Ecological Resources<br />
3-46
May 15, 2005 Draft<br />
CHAPTER 4 TECHNICAL APPROACH<br />
4.1 OVERVIEW<br />
Goals <strong>for</strong> <strong>the</strong> TBC MFL were stated in Chapter 1 and <strong>the</strong> ecological resources targeted<br />
<strong>for</strong> protection from significant harm were described in Chapter 3. Where appropriate and<br />
possible, analytical tools that can be applied to relate freshwater inflow and resource<br />
health were developed and described in Chapter 3. Chapter 4 describes <strong>the</strong> results of<br />
applying those empirical and modeling tools to arrive at an MFL.<br />
4.2 GOALS<br />
At <strong>the</strong> outset, five ecological resources and two <strong>for</strong>cing parameters (salinity, DO) were<br />
identified. The goal was to establish an MFL <strong>for</strong> each resource and to chose <strong>the</strong> most<br />
conservative/protective from <strong>the</strong> individual MFLs. If no clear break-point response could<br />
be described, an alternative policy of no more than a 15 percent loss of resource due to<br />
withdrawals was proposed in Chapter 1.<br />
Each resource/parameter was investigated and after review of <strong>the</strong> quantifiable<br />
responses, no break points were obvious. The presumptive 15 percent goal was<br />
applied. This approach is consistent with both on-going District MFL ef<strong>for</strong>ts in o<strong>the</strong>r<br />
water bodies and is similar to <strong>the</strong> approach adopted by o<strong>the</strong>r coastal states.<br />
In addition to <strong>the</strong> loss term, a low flow threshold (LFT) was proposed in Chapter 1. The<br />
proposed value is <strong>the</strong> 10 th percentile low flow <strong>for</strong> <strong>the</strong> baseline evaluation period and<br />
baseline flow. Essentially, <strong>the</strong> LFT goal is that <strong>the</strong> MFL must be found at, or above <strong>the</strong><br />
flows that occur 90 percent of <strong>the</strong> time. The LFT goal <strong>for</strong> discharge from S-160 was<br />
initially set at 30 cfs, although as described later this goal was not supported by <strong>the</strong><br />
technical analysis and was subsequently eliminated from consideration.<br />
4.3 CONSIDERATION OF EXISTING USES<br />
The statutes that authorize and require <strong>the</strong> establishment of MFLs do not provide <strong>for</strong><br />
recognition of existing potable uses of <strong>the</strong> water, although non-consumptive uses may<br />
be considered in <strong>the</strong> determination. In <strong>the</strong> present case, a syn<strong>the</strong>tic baseline flow<br />
record was reconstructed in which all water removed, or added to <strong>the</strong> TBC <strong>for</strong> water<br />
supply was removed from <strong>the</strong> record. Flood flows were retained. The MFL evaluation<br />
was based on this baseline flow record, ra<strong>the</strong>r than <strong>the</strong> observed flows.<br />
4.4 APPLICATION OF GOALS TO RESOURCE RESPONSE<br />
4.4.1 Oysters<br />
Protecting oyster communities from lethal high salinity levels resulting from withdrawals<br />
was initially a concern. The technical approach protecting this resource was a<br />
________________________________________________________________________________<br />
4.0 Technical Approach<br />
4-1
May 15, 2005 Draft<br />
comparison of <strong>the</strong> measured (1974 to present) salinities during low S-160 flows periods.<br />
The results indicated that even during prolonged conditions of zero flow, 75 percent of<br />
<strong>the</strong> recorded salinity values in McKay Bay/Palm River were within <strong>the</strong> optimal zone <strong>for</strong><br />
oysters. The boundary salinity in East Bay, along with o<strong>the</strong>r freshwater inflows into<br />
McKay Bay, East Bay and Hillsborough Bay maintain <strong>the</strong> salinity within acceptable<br />
limits. No MFL is warranted <strong>for</strong> protection of oysters.<br />
4.4.2 Vegetation (Mangroves)<br />
Mangroves are <strong>the</strong> dominant vegetation in McKay Bay/TBC and were targeted <strong>for</strong><br />
evaluation because <strong>the</strong>re was concern that reduced flow and high salinity would be<br />
damaging to this resource. However, current research into mangrove / salinity<br />
relationships indicate that soil salinity is important to mangrove health, but water column<br />
salinity has little effect on mangrove health. Thus, no fur<strong>the</strong>r technical evaluation was<br />
conducted as <strong>the</strong>re appears to be no justification <strong>for</strong> a mangrove MFL.<br />
4.4.3 Fish and Invertebrates<br />
Fish and invertebrate response to inflow was quantitatively documented <strong>for</strong> 34 taxa.<br />
Three taxa significant to <strong>the</strong> region (mysid shrimp, bay anchovy and pink shrimp) were<br />
selected <strong>for</strong> fur<strong>the</strong>r evaluation. Inflow / abundance regressions were selected as <strong>the</strong><br />
evaluation tool and a series of reduced flow scenarios in <strong>the</strong> <strong>for</strong>m of percentage<br />
withdrawal above <strong>the</strong> LFT were defined. Abundance at <strong>the</strong> median flow (1983-2003) of<br />
each scenario was calculated and compared to <strong>the</strong> abundance at <strong>the</strong> baseline flow<br />
conditions. Comparisons were made based on percent loss in abundance.<br />
The flow scenario resulting in a 15 percent abundance loss of <strong>the</strong> three significant taxa<br />
was fur<strong>the</strong>r evaluated <strong>for</strong> sensitivity to <strong>the</strong> LFT by varying <strong>the</strong> assumed LFT and fixing<br />
<strong>the</strong> percentage withdrawal.<br />
In keeping with <strong>the</strong> initial goals, loss of abundance averaged 15 percent at an inflow of<br />
approximately 65 cfs. Any number of combinations of LFTand percentage withdrawals<br />
will produce a median 65 cfs flow. One combination corresponds to a withdrawal of<br />
approximately 40 percent above an LFT of 30 cfs. Table 4-1 provides a tabular <strong>for</strong>m of<br />
<strong>the</strong> data used to derive Figure 3-9. However, fur<strong>the</strong>r analysis (Table 4-2) revealed that<br />
at a <strong>for</strong>ty percent withdrawal rate, <strong>the</strong> abundance is virtually independent of <strong>the</strong> LFT.<br />
Thus, at a <strong>for</strong>ty percent withdrawal rate, an LFT is not necessary to restrict<br />
fish/invertebrate losses to fifteen percent over baseline. More importantly and as shown<br />
in Table 4-2, <strong>the</strong>re are an infinite number of LFT/percent withdrawal scenarios that<br />
result in a fifteen percent loss of abundance, all of which produce an approximately 65-<br />
70 cfs flow.<br />
4.4.4 Benthos<br />
The results of <strong>the</strong> benthos evaluation were inconclusive <strong>for</strong> setting an MFL. In general,<br />
<strong>the</strong> TBC benthic community appears to be more responsive to <strong>the</strong> occurrence of<br />
hypoxia ra<strong>the</strong>r than high salinity. Hypoxia is related to high flow more often than low-<br />
________________________________________________________________________________<br />
4.0 Technical Approach<br />
4-2
May 15, 2005 Draft<br />
flow conditions. In <strong>the</strong> absence of fur<strong>the</strong>r work, an MFL could not be evaluated <strong>for</strong> <strong>the</strong><br />
benthic communities.<br />
Table 4-1<br />
Abundance Loss at Various Withdrawal Rates above 30 cfs.<br />
Low Flow<br />
Cut off (cfs)<br />
Percent Loss Over Baseline<br />
%<br />
Withdrawal<br />
Median<br />
Flow (cfs)<br />
n/a 0 97 0 0 0 0.0<br />
30 26.8 75 12.6 8.7 8.8 10.0<br />
30 39.0 66 18.6 13 13.5 15.0<br />
30 50.5 56 24.6 17.4 18 20.0<br />
30 63.5 46 30.8 21.8 22.4 25.0<br />
Table 4-2<br />
Representative LFT and Withdrawal Rates<br />
Resulting in 15 Percent Loss of Abundance<br />
Low Flow<br />
Cut off (cfs)<br />
%<br />
Withdrawal<br />
Median<br />
Flow (cfs)<br />
Mysid Anchovy Pink Shrimp average<br />
loss<br />
Percent Loss Over Baseline<br />
Mysid Anchovy Pink Shrimp average<br />
loss<br />
n/a 0 97 0 0 0 0.0<br />
0 38.2 66 18.5 13.1 13.4 15.0<br />
10 38.2 66 18.5 13.1 13.4 15.0<br />
30 39.0 66 19.2 13.3 13.9 15.5<br />
40 40.6 65 18.6 12.9 13.5 15.0<br />
50 46.0 64 18.4 12.8 13.8 15.0<br />
60 62.0 69 18.5 12.7 13.7 15.0<br />
4.4.5 Birds<br />
Bird population dynamics appear to be related to both vegetation (as habitat) and <strong>the</strong><br />
benthic community (as prey). In <strong>the</strong> absence of quantitative inflow relationships of<br />
ei<strong>the</strong>r vegetation or benthos, aviary populations cannot be related to potential<br />
withdrawals. Consequently, no MFL was established <strong>for</strong> birds.<br />
4.4.6 Changes to Salinity and Dissolved Oxygen<br />
Salinity and dissolved oxygen, while not ecological resources per se, are important<br />
factors in determining <strong>the</strong> ecological resources. Goals of limiting changes were not<br />
established a priori, but regressions were developed to estimate <strong>the</strong> changes that would<br />
occur if <strong>the</strong> overall MFL was based on limiting fish and invertebrate abundance to a 15<br />
percent change.<br />
________________________________________________________________________________<br />
4.0 Technical Approach<br />
4-3
May 15, 2005 Draft<br />
The salinity/inflow response was evaluated using two separate approaches. Empirical<br />
(regression modeling) and hydrodynamic modeling were used independently to<br />
estimate <strong>the</strong> changes in salinity resulting from various trial reduced flow scenarios. The<br />
hydrodynamic evaluation included simulation of three scenarios and comparison with<br />
<strong>the</strong> response to baseline flows. Percent difference (surface and bottom) from baseline<br />
conditions was calculated <strong>for</strong> three locations spanning <strong>the</strong> Palm River and <strong>for</strong> nine<br />
simulation periods.<br />
The empirical evaluation was restricted to one segment within <strong>the</strong> channelized Palm<br />
River where response is expected to be <strong>the</strong> greatest. Technical comparison was based<br />
on superimposed cumulative distribution functions and tabular results.<br />
Both approaches indicated that <strong>the</strong> TBC salinity is relatively insensitive to changes in<br />
freshwater inflow, probably due to <strong>the</strong> large volume and efficient transport of more<br />
saline water from <strong>Tampa</strong> Bay. The hydrodynamic model results confirmed that<br />
extremely high flows can cause steep vertical stratification (which in turn is related to<br />
hypoxic conditions).<br />
The approach to evaluating DO was similar to <strong>the</strong> empirical evaluation of salinity.<br />
Regression models were developed, tested and applied to estimate changes in <strong>the</strong><br />
percent saturation of dissolved oxygen as a function of freshwater inflow. Surface and<br />
bottom waters were evaluated separately. In general, <strong>the</strong> surface water percent<br />
saturation is only moderately responsive to changes in inflow (r 2 generally less than<br />
0.25). Response of bottom water percent saturation to inflow was usually more<br />
pronounced (r 2 typically >0.5). Changes to bottom DO were evaluated <strong>for</strong> two reduced<br />
flow scenarios and compared to <strong>the</strong> baseline results using a CDF plot. While <strong>the</strong>re were<br />
some notable differences in <strong>the</strong> higher levels of DO, <strong>the</strong> increased frequency of<br />
damaging hypoxic conditions (relative to baseline) was less than 10 percent.<br />
________________________________________________________________________________<br />
4.0 Technical Approach<br />
4-4
May 15, 2005 Draft<br />
CHAPTER 5 RESULTS OF MFL EVALUATION<br />
5.1 RESULTS<br />
Five significant ecological resources (oysters, benthic infauna, birds, vegetation and<br />
fish/invertbrates) found in McKay Bay/TBC were evaluated <strong>for</strong> sensitivity to inflows<br />
and/or salinity. Of those, quantitative relationships with inflow were developed <strong>for</strong><br />
fish/invertebrate abundance and location. Three regionally significant taxa (mysid,<br />
anchovy and pink shrimp) were identified <strong>for</strong> fur<strong>the</strong>r analysis. Statistically significant (at<br />
p
May 15, 2005 Draft<br />
LITERATURE CITED<br />
Abbe, G. R. and D. L. Breitburg. 1992. The influence of oyster toadfish (Opsanus tau)<br />
and crabs (Callinectes sapidus and Xanthidae) on survival of oyster (Crassostrea<br />
virginica) spat in Chesapeake Bay: does spat protection always work? Aquaculture 107:<br />
21−31.<br />
ACT, 2004. Report of Remedial Actions. The Palm River Landfill. <strong>Tampa</strong> ByPass<br />
<strong>Canal</strong>. Prepared <strong>for</strong> SWFWMD by American Compliance Technologies, Inc. April 2,<br />
2004.<br />
Andrews, J. D. 1979. Pelecypoda: Ostreidae. Pages 293-341 in A. C. Giese and J. S.<br />
pearse (eds.) Reproduction of Marine Invertebrates, Volume V. Moluscs: Pelecypods<br />
and Lesser Classes. Academic Press, New York.<br />
Andrews, J. D., and S. M. Ray. 1988. Management strategies to control <strong>the</strong> disease<br />
caused by Perkinus marinus. American Fisheries Society Special Publication. 18: 257-<br />
264.<br />
Bahr, L. M. and R. E. Hillman. 1967. Effects of repeated shell damage on<br />
gametogenesis in <strong>the</strong> American oyster Crassostrea virginica (Gmelin). Proceedings of<br />
<strong>the</strong> National Shellfisheries Association. 57: 59-62.<br />
Baker, S. M. and R. Mann. 1992. Effects of hypoxia and anoxia on larval settlement,<br />
juvenile growth, and juvenile survival of <strong>the</strong> oyster Crassostrea virginica. Biological<br />
Bulletin. 182: 265-269.<br />
Baker, S. M. and R. Mann. 1994. Description of metamorphic phases in <strong>the</strong> oyster<br />
Crassostrea virginica and effects of hypoxia on metamorphosis. Marine Ecology<br />
Progress Series. 104: 91-99.<br />
Baldwin, B. S. 1995. Selective particle ingestion by oyster larvae (Crassostrea virginica)<br />
feeding on natural seston and cultured algae. Marine Biology. 123: 95-105.<br />
Baldwin, B. S. and R. I. E. Newell. 1991. Omnivorous feeding by planktotrophic larvae<br />
of <strong>the</strong> eastern oyster Crassostrea virginica. Marine Ecology Progress Series. 78: 285-<br />
301.<br />
Barber, B. J., S. E. Ford and H. H. Haskin. 1988a. Effects of <strong>the</strong> parasite MSX<br />
(Haplosporidium nelsoni) on oyster (Crassostrea virginica) energy metabolism. I.<br />
Condition index and relative fecundity. Journal of Shellfish Research. 7: 25-31.<br />
Barber, B. J., S. E. Ford and H. H. Haskin. 1988b. Effects of <strong>the</strong> parasite MSX<br />
(Haplosporidium nelsoni) on oyster (Crassostrea virginica) energy metabolism. II.<br />
Tissue biochemical composition. Comparative Biochemistry and Physiology. 91A: 603-<br />
608.<br />
D:\TBC\Report\TBC_MFL.doc Last Save : 5/16/05 3:15 PM<br />
Page 2 / 129
May 15, 2005 Draft<br />
Bayne, B. I. 1976. Aspects of reproduction in bivalve mollusks. Pages 432-448 in M. I.<br />
Wiley (ed.). Estuarine Processes, Volume 1. Academic Press, New York.<br />
Beck , M. W. and M. Odaya. 2001. Ecoregional planning in marine<br />
environments:identifying priority sites <strong>for</strong> conservation in <strong>the</strong> nor<strong>the</strong>rn Gulf of Mexico.<br />
Aquatic Conservation: Marine and Freshwater Ecosystems 11: 235−242.<br />
Beecher, H. 1990. Standards <strong>for</strong> Instream <strong>Flows</strong>. Rivers 1(2):97109.<br />
Bedient, P., M. Brinson, F. Dierberg, S. Gorelick, K. Jenkins, D. Ross, K. Wagner, D.<br />
Stephenson. 1999. Report of <strong>the</strong> Scientific Peer Review Panel on <strong>the</strong> Data, Theories,<br />
and Methodologies Supporting <strong>the</strong> <strong>Minimum</strong> <strong>Flows</strong> and Levels Rule <strong>for</strong> <strong>the</strong> Nor<strong>the</strong>rn<br />
<strong>Tampa</strong> Bay Area, Florida. Report prepared <strong>for</strong> <strong>the</strong> <strong>Southwest</strong> Florida Water<br />
Management District, Environmental Confederation of <strong>Southwest</strong> Florida, Hillsborough<br />
County, and <strong>Tampa</strong> Bay Water.<br />
Benfield, M. C. and D.V. Aldrich. 1991. A laminar-flow choice chamber <strong>for</strong> testing <strong>the</strong><br />
responses of postlarval penaeids to olfactants. Contrib. Mar. Sci. 32, 73-88.<br />
Bigelow, H. B. and W. C. Schroeder. 1953. Fishes of <strong>the</strong> Western North Atlantic, Part<br />
Eight: Sawfishes, guitarfishes, skates, rays and chimaeroids. Memoir Sears Foundation<br />
<strong>for</strong> Marine Research. 514 pp.<br />
Bisker, R. and M. Castagna. 1987. Predation on single spat oysters Crassostrea<br />
virginica (Gmelin) by blue crabs Callinectes sapidus Rathbun and mud crabs Panopeus<br />
herbstii Milne Edwards. Journal of Shellfish Research 6: 37−40.<br />
Bowie, G. L. , W.B. Mills, D.B. Porcella, C.L. Campbell, J.R. Pagenkopf, G.L. Rupp,<br />
K.M. Johnson, P.W. Chan, S.A. Gherini. 1985. Rates, Constants, and Kinetics<br />
Formulations in Surface Water Quality Models (Second Edition). EPA/600/3-85/040.<br />
Breitburg, D. L. 1999. Are three-dimensional structure and healthy oyster populations<br />
<strong>the</strong> keys to an ecologically interesting and important fish community?, p. 239−250. In M.<br />
W. Luckenbach, R. Mann, and J. A. Wesson (eds.), Oyster reef habitat restoration: a<br />
synopsis and syn<strong>the</strong>sis of approaches. Virginia Institute of Marine Science Press,<br />
Gloucester Point, Virginia. 366 p.<br />
Browder, J. A. 1985. Relationship between pink shrimp production on <strong>the</strong> Tortugas<br />
grounds and water flow patterns in <strong>the</strong> Florida Everglades. Bull. Mar. Sci. 37, 839-856.<br />
Brown, L. N. 1971. Environmental statement (biological) regarding <strong>Tampa</strong> <strong>Bypass</strong><br />
<strong>Canal</strong> (C-135), Harney <strong>Canal</strong> (C-136), Lower Hillsborough Flood Detention Area and<br />
levee 112(S). <strong>Southwest</strong> Florida Water Management District, Brooksville, Florida.<br />
D:\TBC\Report\TBC_MFL.doc Last Save : 5/16/05 3:15 PM<br />
Page 3 / 129
May 15, 2005 Draft<br />
Burger, C and K. Petrus. 2004. TMDL Report. Nutrient and Dissolved Oxygen TMDL <strong>for</strong><br />
McKay Bay, WBID 1584B. July 24, 2004 Draft. Florida Department of Environmental<br />
Protection<br />
Burreson, E. M. and L. M. Ragone-Calvo. 1996. Epizootiology of Perkinsus marinus<br />
disease of oysters in Chesapeake Bay with emphasis on data since 1985. Journal of<br />
Shellfish Research 15:17-34.<br />
Butler, P. A. 1949 Gametogenesis in <strong>the</strong> oyster under depressed salinity. Biological<br />
Bulletin. 96: 263-269.<br />
Butler, P. A. 1952. Growth and mortality rates in sibling and unrelated oyster<br />
populations. Proceeding of <strong>the</strong> Gulf and Caribbean Fisheries Institute. 4:71.<br />
Butler, P.A. 1954. Summary of our knowledge of <strong>the</strong> oyster in <strong>the</strong> Gulf of Mexico.<br />
Fishery Bulletin. 55: 479-489.<br />
Carr, W. E. S. and C.A. Adams. 1973. Food habits of juvenile marine fishes occupying<br />
seagrass beds in <strong>the</strong> estuarine zone near Crystal River, Florida. Trans. Amer. Fish.<br />
Soc. 102, 511-540.<br />
Carriker, M. R. 1986. Influence of suspended particles on biology of oyster larvae in<br />
estuaries. American Malacological Bulletin Special Edition. 3: 41-49.<br />
Carriker, M. R., and P. M. Gaffney. 1996. A catalogue of selected species of living<br />
oysters (Ostreacea) of <strong>the</strong> world. Pages 1-18. In V. S. Kennedy, R. I. E. Newell, and A.<br />
F. Eble (eds.), The Eastern Oyster Crassostrea virginica. Maryland Sea Grant College<br />
Publication, College Park, Maryland.<br />
Carriker, M.R. 1951. Ecological observations on <strong>the</strong> distribution of oyster larvae in New<br />
Jersey estuaries. Ecological Monographs. 21:19-38.<br />
Carter, M.R. et al. 1973. Ecosystems Analysis of <strong>the</strong> Big Cypress Swamp and<br />
Estuaries. A<strong>the</strong>ns, Ga. USEPA. Available through NTIS, Springfield, Va.<br />
CDM (Camp Dresser & McKee), 1998. The Study of Seasonal and Spatial Patterns of<br />
Hypoxia in Upper Charlotte Harbor. Prepared <strong>for</strong> <strong>Southwest</strong> Florida Water Management<br />
District.<br />
Chanley, P. E. 1958. Survival of some juvenile bivalves in water of low salinity.<br />
Proceeding of <strong>the</strong> National Shellfish Association. 48: 52-65.<br />
Chen, R. and R.R. Twilley. 1998. A Gap Dynamic Model of Mangrove Forest<br />
Development along Gradients of Soil Salinity and Nutrient Resources. Journal of<br />
Ecology, 86, 7-51.<br />
D:\TBC\Report\TBC_MFL.doc Last Save : 5/16/05 3:15 PM<br />
Page 4 / 129
May 15, 2005 Draft<br />
Cheng, T. C. 1965. Histochemical observations on changes in <strong>the</strong> lipid composition of<br />
<strong>the</strong> American oyster Crassostrea virginica (Gmelin) parasitized by <strong>the</strong> trematode<br />
Bucephalus sp. Journal of Invertebrate Pathology. 7: 398-407.<br />
Cheng, T. C. and R. W. Burton. 1966. Relationships between Bucephalus sp. and<br />
Crassostrea virginica: histopathology and sites of infection. Chesapeake Science. 56:<br />
11-122.<br />
Choi, K-S., D. H. Lewis, E. N. Powell, and S. M. Ray. 1993. Quantitative measurement<br />
of reproductive condition in <strong>the</strong> American oyster Crassostrea virginica (Gmelin), using<br />
an enzyme-linked immunosorbant assay (ELISA). Aquaculture and Fisheries<br />
Management. 24: 299-322.<br />
Chu, F. L. E. and A. K. Volety. 1997. Disease processes of <strong>the</strong> parasite Perkinsus<br />
marinus in eastern oyster Crassostrea virginica: minimum dose <strong>for</strong> infection initiation,<br />
and interaction of temperature, salinity and infective cell dose. Diseases of Aquatic<br />
Organisms 28:61-68.<br />
Clarke, K. R. and Green, R. H. 1988. Statistical design and analysis <strong>for</strong> a 'biological<br />
effects' study. Mar. Ecol. Prog. Ser. 46, 213-226.<br />
Clarke, K. R. and Warwick, R. M. 2001. Change in marine communities: an approach to<br />
statistical analysis and interpretation, 2nd edition. PRIMER-E: Plymouth, UK.<br />
Coastal Environmental, Inc. 1997. An Analysis of <strong>the</strong> Effects of Freshwater Inflows on<br />
Salinity Distributions, Dissolved Oxygen Concentrations, and Habitat Characteristics of<br />
<strong>the</strong> Hillsborough River and Palm River/<strong>Tampa</strong> <strong>Bypass</strong> <strong>Canal</strong>. Report prepared <strong>for</strong> <strong>the</strong><br />
<strong>Tampa</strong> Bay National Estuary Program. St. Petersburg, FL.<br />
Coen, L. D., D. M. Knott, E. L. Wenner, N. H. Hadley, A. H. Ringwood and M. Y. Bobo.<br />
1999a. Intertidal oyster reef studies in South Carolina: design, sampling and<br />
experimental focus <strong>for</strong> evaluating habitat value and function, p. 133−158. In M.W.<br />
Luckenbach, R. Mann, and J. A. Wesson (eds.), Oyster reef habitat restoration: a<br />
synopsis and syn<strong>the</strong>sis of approaches. Virginia Institute of Marine Science Press,<br />
Gloucester Point, Virginia. 366 p.<br />
Coen, L. D., M. W. Luckenbach, and D. L. Breitburg. 1999b. The role of oyster reefs as<br />
essential fish habitat: A review of current knowledge and some new perspectives.<br />
American Fisheries Society Symposium 22: 438−454.<br />
Coon, S. L., W. K. Fitt and D. B. Bonar. 1990a. Competence and delay of<br />
metamorphosis in <strong>the</strong> Pacific oyster Crassostrea gigas. Marine Biology. 106: 379-387.<br />
Courtney, C.M., R. Brown, and D. Heimbuch. 1993. Environmental Monitoring and<br />
Assessment Program Estuaries-West Indian Province: Volume I. Introduction, Methods<br />
and Materials, and Quality Assurance Field and Laboratory Operations Manual <strong>for</strong> a<br />
D:\TBC\Report\TBC_MFL.doc Last Save : 5/16/05 3:15 PM<br />
Page 5 / 129
May 15, 2005 Draft<br />
Synoptic Survey of Benthic Macroinvertebrates of <strong>the</strong> <strong>Tampa</strong> Bay Estuaries. EPCHC,<br />
<strong>Tampa</strong>, FL<br />
Courtney, C.M., S.A. Grabe, D.J. Karlen, R. Brown, and D. Heimbuch. 1995.<br />
Laboratory Operations Manual <strong>for</strong> a Synoptic Survey of Benthic Macroinvertebrates of<br />
<strong>the</strong> <strong>Tampa</strong> Bay Estuaries. EPCHC, <strong>Tampa</strong>, FL.<br />
Cox, C. 1988. Seasonal changes in fecundity of oysters Crassostrea virginica (Gmelin)<br />
from four oyster reefs in <strong>the</strong> James River, Virginia. M. A. <strong>the</strong>sis, College of William and<br />
Mary, Williamsburg, Virginia. 73 pp.<br />
Cox, C., and R. Mann. 1992. Temporal and spatial variations in fecundity of eastern<br />
oysters, Crassostrea virginica (Gmelin 1791) in <strong>the</strong> James River, Virginia. Journal of<br />
Shellfish Research. 11: 49-54.<br />
Crabtree, R. E. and D. P Middaugh. 1982. Oyster shell size and <strong>the</strong> selection of<br />
spawning sites by Chasmodes bosquianus, Hypleurochilus geminatus, Hypsoblennius<br />
ionthas (Pisces, Blenniidae) and Gobiosoma bosci (Pisces, Gobiidae) in two South<br />
Carolina estuaries. Estuaries. 5: 150−155.<br />
Crabtree, R. E., and J. M. Dean. 1982. The structure of two South Carolina estuarine<br />
tide pool fish assemblages. Estuaries. 5: 2−9.<br />
Crisp, D. J. 1967. Chemical factors inducing settlement in Crassostrea virginica<br />
(Gmelin). Journal of Animal Ecology. 36:329-335.<br />
Dame, R. F. and B. C. Patten. 1981. Analysis of energy flows in an intertidal oyster reef.<br />
Marine Ecology Progress Series. 5: 115−124.<br />
Darnell, R. M. 1961. Trophic spectrum of an estuarine community, based on studies of<br />
Lake Pontchartrain, Louisiana. Ecology 42, 553-568.<br />
Davis, H. C., and P. E. Chanley. 1956. Spawning and egg production of oysters and<br />
clams. Proceedings of <strong>the</strong> National Shellfisheries Association. 46: 40-58.<br />
Davis, N. W. and R. E. Hillman. 1971. Effect of artifical shell damage on sex<br />
determination in oysters (abstract). Proceedings of <strong>the</strong> National Shellfish Association.<br />
61:2.<br />
Dixon,L.K., A. Nissanka, J.Perry, and T. Toutant, 2003, Observations on Water Column<br />
Oxygen Demand and Hypoxia in Charlotte Harbor, Florida, 2002-2003. In Proceedings:<br />
Charlotte Harbor Conference, Focus in 2002-2003, October 7-8, 2003. E.D. Estevez,<br />
Ed. Mote Marine Laboratory, Sarasota, FL.<br />
D:\TBC\Report\TBC_MFL.doc Last Save : 5/16/05 3:15 PM<br />
Page 6 / 129
May 15, 2005 Draft<br />
Drinkwater, K. F. 1986. On <strong>the</strong> role of freshwater outflow on coastal marine ecosystems<br />
- a workshop summary. In The Role of Freshwater Outflow in Coastal Marine<br />
Ecosystems. S. Skreslet. (ed.) pp. 429-438. Springer-Verlag: Berlin.<br />
Dunbar, M.J., A. Gustard, M.C. Acreman and C.R. Elliot. 1998. Overseas approaches to<br />
setting River Flow Objectives. Institute of Hydrology. R&D Technical Report W6-161.<br />
Oxon, England. 83 pp.<br />
Ecological Monographs 31: 239−266.<br />
Elston, R. 1979. Economically important larval bivalve diseases and <strong>the</strong>ir control. Riv.<br />
Ital. Poscic. Ittiop. A14 (2): 47-51.<br />
Engle, J. B. 1951. The condition of oysters as measured by <strong>the</strong> carbohydrate cycle, <strong>the</strong><br />
condition factor and <strong>the</strong> percent dry weight. Proceedings of <strong>the</strong> National Shellfisheries<br />
Association. 41:20-25.<br />
Engle, V.D., J.K. Summers, and G.R. Gaston. 1994. A benthic index of<br />
environmental condition in Gulf of Mexico estuaries. Estuaries 17: 372-384.<br />
Estevez, E. D. 2000. A Review and Application of Literature Concerning Freshwater<br />
Flow Management in Riverine Estuaries. Mote Marine Laboratory Technical Report<br />
Number 680. Prepared <strong>for</strong> South Florida Water Management District.<br />
Fantle, M. S., Dittel, A. I., Schwalm, S. M., Epifanio, C. E., and Fogel, M. L. 1999. A<br />
food web analysis of <strong>the</strong> juvenile blue crab, Callinectes sapidus, using stable isotopes in<br />
whole animals and individual amino acids. Oecologia 120, 416-426.<br />
FDCA, 1995. Strategic Management Initiative <strong>for</strong> McKay Bay: A Comprehensive<br />
Mangement Plan. Office of <strong>the</strong> Secretary Publication. Florida Department of Community<br />
Affairs Tallahassee, Fl. pp 257.<br />
Fingerman, M. and L. D. Fairbanks. 1957. Heat death and associated weight loss of <strong>the</strong><br />
oyster Crassostrea virginica. Tulane Studies in Zoology and Botany 5:55-68.<br />
Fingerman, M. and L.D. Fairbanks. 1956. Bleeding and heart death in <strong>the</strong> sou<strong>the</strong>rn<br />
oyster. Comm. Fisheries Review. 18(10): 4-5.<br />
Fisher, W. S., J. T. Winstead, L. M. Oliver, H. L. Edminston and G. O Bailey. 1996.<br />
Physiological variability of eastern oysters from Apalachicola Bay, Florida. Journal of<br />
Shellfish Research. 15: 543-555.<br />
Francis-Floyd, R. 2002. Dissolved oxygen <strong>for</strong> fish production. University of Florida IFAS<br />
Extension ( http://edis.ifas.ufl.edu/FA002 )<br />
Gabbot, P. A. 1976. Energy metabolism. Pages 293-355 InB. L. Bayne (ed). Marine<br />
Mussels: Their Ecology and Physiology. Cambridge University Press, Cambridge.<br />
D:\TBC\Report\TBC_MFL.doc Last Save : 5/16/05 3:15 PM<br />
Page 7 / 129
May 15, 2005 Draft<br />
Gabbot, P. A. 1983. Developmental and seasonal metabolic activities in marine<br />
mollusks. Pages 165-217 In P. W. Hochachka (ed). The Mollusca, Vol 2. Academic<br />
Press, New York.<br />
Galtsoff, P. S. 1940. Physiology of reproduction of Ostrea virginica. III. Stimulation of<br />
spawning in <strong>the</strong> male oyster. Biological Bulletin. 78: 117-135.<br />
Galtsoff, P. S. 1964. The American Oyster Crassostrea virginica Gmelin. Fishery<br />
Bulletin. 64:1-480.<br />
Galtsoff, P.S., H. F. Pry<strong>the</strong>rch, and H. C. McMillin. 1930. An experimental study in<br />
production and collection of seed oysters. Bulletin Bur. Fish. 46: 197-263.<br />
Geraghty and Miller, Inc. 1982. Evaluation of Water-Supply Potential of <strong>the</strong> <strong>Tampa</strong><br />
<strong>Bypass</strong> <strong>Canal</strong>. Prepared <strong>for</strong> West Coast Regional Water Supply Authority, Clearwater,<br />
FL, 43 pp w/appendices.<br />
Gibbons, M. C., and M. Castagna. 1984. Serotonin as an inducer of spawning in six<br />
bivalve species. Aquaculture. 40: 189-191.<br />
Giese, A. C. and H. Kanatani. 1987. Maturation and spawning. Pages 251-329 in A. C.<br />
Giese, J. S. Pearse and V. B. Pearse (eds.). Reproduction of Marine Invertebrates,<br />
Volume IX. Blackwell Scientific Publications, Palo Alto.<br />
Giese, A. C. and J. S. pearse. 1974. Introduction: general principles. Pages 1-49 in A.<br />
C. Giese and J. S. Pearse (eds.). Reproduction of Marine Invertrebrates, Volume 1.<br />
Academic Press, New York.<br />
Glancy, T. P., T. K. Frazer, C. E. Cichra, and W. J. Lindberg. 2003. Comparative<br />
patterns of occupancy by decapod crustaceans in seagrass, oyster, and marsh-edge<br />
habitats in a nor<strong>the</strong>ast Gulf of Mexico estuary. Estuaries. 26: 1291−1301.<br />
Gorzelany, J. 1986. Oyster associated fauna, Volume V: A data collection program <strong>for</strong><br />
selected coastal estuaries in Hernando, Citrus, and Levy counties, Florida. Report<br />
prepared by Mote Marine Laboratory <strong>for</strong> <strong>the</strong> <strong>Southwest</strong> Florida Water Management<br />
District.<br />
Grabe, S.A., D.J. Karlen, C.M. Holden, B. Goetting, T. Dix, S. Markham, and C.<br />
Pearson. 2004. Hillsborough Independent Monitoring Program: Pre-operational<br />
Characterization of Benthic Habitats of <strong>the</strong> Lower Hillsborough & Little Manatee<br />
Rivers. Environmental Protection Commission of Hillsborough County,<strong>Tampa</strong>.<br />
January 15, 2004 Draft.<br />
Grant, J. and J. McDonald. 1979. Dessication tolerance of Eurypanopeus depressus<br />
(Smith) (Decapoda: Xanthidae) and <strong>the</strong> exploitation of microhabitat. Estuaries. 2:<br />
172−177.<br />
D:\TBC\Report\TBC_MFL.doc Last Save : 5/16/05 3:15 PM<br />
Page 8 / 129
May 15, 2005 Draft<br />
Grizzle, R. E., J. R. Adams, and L. J. Walters. 2002. Historical changes in intertidal<br />
oyster (crassostrea virginica) reefs in a Florida lagoon potentially related to boating<br />
activities. Journal of Shellfish Research. 21: 749-756.<br />
Gunter, G. 1953. The relationship of <strong>the</strong> Bonnet Carre Spillway to oyster beds in <strong>the</strong><br />
Mississippi Sound and <strong>the</strong> Louisiana Marsh with a report on <strong>the</strong> 1950 opening.<br />
Publication of <strong>the</strong> Institute of Marine Science, University of Texas 3: 21-72.<br />
Gunter, G. 1961. Some relations of estuarine organisms to salinity. Limnology and<br />
Oceanography. 6: 182-190.<br />
Harding, J. M. and R. Mann. 2001a. Oyster reefs as fish habitat: opportunistic use of<br />
restored reefs by transient fishes. Journal of Shellfish Research. 20: 951−959.<br />
Harding, J. M. and R. Mann. 2001b. Diet and habitat use by bluefish, Pomatomus<br />
saltatrix, in a Chesapeake Bay estuary. Environmental Biology of Fishes. 60: 401−409.<br />
Harry, H. W. 1985. Synopsis of <strong>the</strong> supraspecific classification of living oysters (Bivalvia:<br />
Gryphaeidae and Ostreidae). Veliger. 28: 121-158.<br />
Hayes, P. F., and R. W. Menzel. 1981. The reproductive cycle of early setting<br />
Crassostrea virginica (Gmelin) in <strong>the</strong> nor<strong>the</strong>rn Gulf of Mexico, and it’s implications <strong>for</strong><br />
population recruitment. Biological Bulletin. 160: 80-88.<br />
EPCHC (Hillsborough County Environmental Protection Commission). 1995. Surface<br />
Water Quality 1992-1994, <strong>Tampa</strong>, Florida.<br />
EPCHC (Hillsborough County Environmental Protection Commission). 2000. Surface<br />
Water Quality 1998-2000, <strong>Tampa</strong>, Florida.<br />
Hedgecock, D. and N. B. Okazaki. 1984. Genetic diversity within and between<br />
populations of American oysters (Crassostrea). Malacologia. 25: 535-549.<br />
Henderson, J. T. 1929. Lethal temperatures of lamellibranchiate. Contrib. Cananda Biol.<br />
Fish. 4:399-411.<br />
Hidu, H. and H. H. Haskin. 1971. Setting of <strong>the</strong> American oyster related to<br />
environmental factors and larval behavior. Proceedings of <strong>the</strong> National Shellfish<br />
Association. 61: 35-50.<br />
Hidu, H., and H. H. Haskin. 1978. Swimming speeds of oyster larvae Crassostrea<br />
virginica in different salinities and temperatures. Estuaries. 1: 252-255.<br />
Hofstetter, R. P. 1977. Trends in population levels of <strong>the</strong> American oyster Crassostrea<br />
virginica Gmelin on public reefs in Galveston Bay, Texas. Texas Parks and Wildlife<br />
Department, Technical Series 24. 90 pp.<br />
D:\TBC\Report\TBC_MFL.doc Last Save : 5/16/05 3:15 PM<br />
Page 9 / 129
May 15, 2005 Draft<br />
Hopkins, S. H. 1962. Distribution of species of Cliona (boring sponge) on <strong>the</strong> eastern<br />
shore of Virginia in relation to salinity. Chesapeake Science. 3: 121-124.<br />
HRD, 1994. Environmental Assessment of <strong>the</strong> Palm River, <strong>Tampa</strong>/Hillsborough County,<br />
Florida. Prepared <strong>for</strong> The Palm River Management Committee. March, 1994.<br />
HSW, 2004. Ungaged Flow to McKay Bay –Regression Summary Report. Letter report<br />
prepared by HSW <strong>for</strong> <strong>Southwest</strong> Florida Water Management District.<br />
Ingle, R. M. and C. E. Dawson, Jr. 1953. A survey of <strong>the</strong> Cedar Key area. State of<br />
Florida Board of Conservation. Technical Series 9:1-27.<br />
Ingle, R. M. and F. G. W. Smith. 1956. Oyster culture in Florida. State of Florida Board<br />
of Conservation, Education Series 5. 25 pp.<br />
Ingle, R. M., A. E. Joyce, J. A. Quick, and S. W. Morey. 1971. Basic considerations in<br />
<strong>the</strong> vealuation of <strong>the</strong>rmal effluents in Florida A preliminary investigation: <strong>the</strong> effect of<br />
elevated temperature on <strong>the</strong> American oyster Crassostrea virginica (Gmelin). Florida<br />
Department of Natural Resources Professional Paper Series. 15:vii-viii.<br />
International Mussel Watch. 1980. National Academy of Sciences, Washington, D. C.<br />
248 pp.<br />
Janicki Environmental, Inc. 2003. Development of a Benthic Salinity Index <strong>for</strong> <strong>the</strong><br />
Segments and Estuarine Tributaries of <strong>Tampa</strong> Bay, Florida. Prepared <strong>for</strong> <strong>Tampa</strong> Bay<br />
Water. Janicki Environmental, Inc., St. Petersburg, FL.<br />
Jassby, A. D., W. J. Kimmerer, S. G. Monismith, C. Armor, J. E. Cloern, T. M. Powell, J.<br />
R. Schubel, and T. J. Vendlinski. 1995. Isohaline position as a habitat indicator <strong>for</strong><br />
estuarine populations. Ecological Applications. 5: 272−289.<br />
Jones, C. G., J. H. Lawton, and M. Shachak. 1994. Organisms as ecosystems<br />
engineers.<br />
Jones, P. W., Martin, F. D., and Hardy, J. D. 1978. Development of Fishes of <strong>the</strong> Mid-<br />
Atlantic Bight - an atlas of egg, larval, and juvenile stages, Vol 1, Acipenseridae through<br />
Ictaluridae. U.S. Fish Wildl. Serv. Biol. Rep. FWS/OBS-78/12.<br />
Keck, R. D. Maurer, J. C. Kauer and W. A. Sheppard. 1971. Chemical stimulants<br />
affecting larval settlement in <strong>the</strong> American oyster. Proceedings of <strong>the</strong> National Shellfish<br />
Association. 61: 24-28.<br />
Kennedy, A. V. and H. I. Battle. 1964. Cyclic changes in <strong>the</strong> gonad of <strong>the</strong> American<br />
oyster Crassostrea virginica (Gmelin). Canadian Journal of Zoology. 42: 305-321.<br />
D:\TBC\Report\TBC_MFL.doc Last Save : 5/16/05 3:15 PM<br />
Page 10 / 129
May 15, 2005 Draft<br />
Kennedy, V. S. 1996. Biology of larvae and spat. Pages 371 - 421 In V. S. Kennedy, R.<br />
I. E. Newell and A. F. Eble (eds.), The Eastern Oyster Crassostrea virginica. Maryland<br />
Sea Grant College Publication, College Park, Maryland.<br />
Kennedy, V. S., R. I. E. Newell, G. E. Krantz, and S. Otto. Reproductive capacity of <strong>the</strong><br />
eastern oyster Crassostrea virginica infected with <strong>the</strong> parasite Perkinsus marinus.<br />
Diseases of Aquatic Organisms. 23: 135-144.<br />
Kenny, P. D., W. K. Michener and D. M. Allen. 1990. Spatial and temporal patterns of<br />
oyster settlement in a high salinity estuary. Journal of Shellfish Research. 9: 329-339.<br />
Knott, D., C. Boyko, and A. Harvey. 1999. Introduction of <strong>the</strong> green porcelain crab,<br />
Petrolis<strong>the</strong>s armatus (Gibbes, 1850) into <strong>the</strong> South Atlantic Bight, p. 404. In J. Pederson<br />
(ed.), Marine Bioinvasions: Proceedings of <strong>the</strong> First National Conference.<br />
Massachusetts Institute of Technology, Cambridge, Massachusetts.<br />
Knutilla and Corral. 1984. Impacts of <strong>the</strong> <strong>Tampa</strong> <strong>Bypass</strong> <strong>Canal</strong> System on <strong>the</strong> Areal<br />
Hydrology, Hillsborough County, Florida. U.S. Geological Survey Water Resources<br />
Investigations Report 84-4222, 65pp.<br />
Krantz, G. E. and J. W. Chamberlin. 1978. Blue crab predation on cultchless oyster<br />
spat. Proceeding of <strong>the</strong> National Shellfish Association. 68: 38-41.<br />
Kristensen, I. 1964. Hypersaline bays as an environment of young fish. Proc. Gulf and<br />
Carib. Fish. Inst. 16, 139-142.<br />
La Peyre, M. K., A. D. Nickens, A. K. Volety, S. G. Tolley, and J. F. La Peyre. 2003.<br />
Environmental significance of freshets in reducing Perkinsus marinus infections in<br />
eastern oysters (Crassostrea virginica): potential management implications. Marine<br />
Ecology Progress Series. 248: 165-176.<br />
Landers, W. S. and E. W. Rhodes, Jr. 1970. Some factors influencing predation by <strong>the</strong><br />
flatworm, Stylochus ellipticus (Girard), on oysters. Chesapeake Science. 11: 55-60.<br />
Langdon, C. J., and R. I. E. Newell. 1996. Digestion and nutrition in larvae and adults.<br />
Pages 231-270. In V. S. Kennedy, R. I. E. Newell, and A. F. Eble (eds.), The Eastern<br />
Oyster Crassostrea virginica. Maryland Sea Grant College Publication, College Park,<br />
Maryland.<br />
Laughlin, R. A. 1982. Feeding habits of <strong>the</strong> blue crab, Callinectes sapidus Rathbun, in<br />
<strong>the</strong> Apalachicola estuary, Florida. Bulletin of Marine Science. 32: 807−822.<br />
Lehnert, R. L. and D. M. Allen. 2002. Nekton use of subtidal oyster shell habitat in a<br />
sou<strong>the</strong>astern U.S. estuary. Estuaries. 25: 1015−1024.<br />
D:\TBC\Report\TBC_MFL.doc Last Save : 5/16/05 3:15 PM<br />
Page 11 / 129
May 15, 2005 Draft<br />
Lenihan, H. S. and C. H. Peterson. 1998. How habitat degradation through fishery<br />
disturbance enhances impacts of hypoxia on oyster reefs. Ecological Applications 8:<br />
128−140.<br />
Lenihan, H. S., C. H. Peterson, J. E. Byers, J. H. Grabowski, G. W. Thayer and D. R.<br />
Colby. 2001. Cascading of habitat degradation: oyster reefs invaded by refugee fishes<br />
escaping stress. Ecological Applications. 11: 764−782.<br />
Llanso, R.J. 1991. Tolerance of low dissolved oxygen and hydrogen sulfide by <strong>the</strong><br />
polychaete Streblospio benedicti (Webster). Journal of Experimental Marine Biology and<br />
Ecology. 153(2):165-178.<br />
Loodanoff, V. L. 1932. Observations on propagation of oysters in James and<br />
Corrotoman Rivers and <strong>the</strong> seaside of Virginia. Virginia Commission on Fisheries,<br />
Newport News, VA (USA), pp. 1-45.<br />
Loosanoff, V. L. 1945. Effects of sea water of reduced salinities upon starfish, A.<br />
<strong>for</strong>besi, of Long Island Sound. Trans. Conn. Acad. Arts and Sciences 36: 813-835.<br />
Loosanoff, V. L. 1953a. Behavior of oysters in waters of low salinity. Proceddings of <strong>the</strong><br />
National Shellfisheries Association. (1952). 135-151.<br />
Loosanoff, V. L. 1953b.Lack of relation between age of oysters or clams and quality of<br />
<strong>the</strong>ir spawn. Serv. Fisheries Bulletin. 4:1-2.<br />
Loosanoff, V. L. 1956. Two obscure oyster enemies in New England waters. Science<br />
123: 1119-1120.<br />
Loosanoff, V. L., and H. C. Davis. 1963. Rearing of bivalve mollusks. Advances in<br />
Marine Biology. 1: 1-136.<br />
Lowe, E.F. 1994. Final Report, District Water Management Plan – Conventions<br />
Subcommittee on Impacts to Natural Systems. (with contributions by FDEP and water<br />
management districts.) St. Johns Water Management District, Palatka,Fl. 119 pp.<br />
Lowe, O. M., M. N. Moore and K. R. Clarke. 1981. Effects of oil on digestive cells in<br />
mussels. Quantitative alterations in cellular and lysosomal structure. Aquatic<br />
Toxicology. 1:213-226.<br />
Lugo, A.E. and S.C. Snedaker. 1974. The Ecology of Mangroves In Annual Review of<br />
Ecology and Systematics. Volume 5. 1974. Published by Annual Reviews, Inc. Palo<br />
Alto, CA.<br />
Lu<strong>the</strong>r, M. E. and Meyers, S. D. 2005 Hydrodynamic simulations of circulation and<br />
dependent physical parameters in <strong>the</strong> Palm River and McKay Bay. Report prepared by<br />
<strong>the</strong> University of South Florida College of Marine Science <strong>for</strong> <strong>the</strong> <strong>Southwest</strong> Florida<br />
Water Management District. January 15, 2005 Draft.<br />
D:\TBC\Report\TBC_MFL.doc Last Save : 5/16/05 3:15 PM<br />
Page 12 / 129
May 15, 2005 Draft<br />
Lutz R. A., H. Hidu, and K. G. Drobeck. 1970. Acute temperature increase as a stimulus<br />
to setting in <strong>the</strong> American oyster, Crassostrea virginica (Gmelin). Proceeding of<br />
National Shellfisheries Association. 60: 68-71.<br />
MacKenzie, Clyde L. Jr. 1970. Causes of oyster spat mortality, conditions of oyster<br />
setting beds, and recommendations <strong>for</strong> oyster bed management. Proceeding of <strong>the</strong><br />
National Shellfisheries Association. 60: 59-67.<br />
MacKenzie, Clyde. L. Jr. 1977. Sea anemone predation on larval oysters in<br />
Chesapeake Bay (Maryland). Proceeding of <strong>the</strong> National Shellfisheries Association. 67:<br />
113-117.<br />
Mackie, G. 1984. Bivalves. Pages 351-418 in A.S. Tompa, N.H. Verdonk and J.A.M.<br />
van den Biggelaar (eds.). The Mollusca, Volume 7. Academic Press, New York.<br />
Mann, R. and J. S. Rainer. 1990. Effect of decreasing oxygen tension on swimming rate<br />
of Crassostrea virhginica (Gmelin 1791) larvae. Journal of Shellfish Research. 9: 323-<br />
327.<br />
Mann, R., B. M. Campos and M. W. Luckenbach. 1991. Swimming rate and responses<br />
of larvae of three mactrid bivalves to salinity discontinuities. Marine Ecology Progress<br />
Series. 68: 257-269.<br />
Manzi, J. J. 1970. Combined effects of salinity and temperature on <strong>the</strong> feeding,<br />
reproductive, and survival rates of Eupleura caudata (Say) and Urosalpinx cinera (Say)<br />
(Prosobranchia: Muricidae). Biological Bulletin. 138: 35-46.<br />
Marcus, N.H., C. Richmond, C.Sedlacek, G. Miller and C. Oppert. 2003. Impact of<br />
hypoxia on <strong>the</strong> survival, egg production and population dynamics of Acartia tonsa Dana.<br />
Journal of Experimental Marine Biology and Ecology. 301(2):111-128.<br />
Matsutani, T., and T. Nomura. 1982. Induction of spawning by serotonin in <strong>the</strong> scallop<br />
Patenopected yeossoensis (Jay). Marine Biology Letters. 3: 353-358.<br />
Mattson, R. A. 2002. A resource-based framework <strong>for</strong> establishing freshwater inflow<br />
requirements <strong>for</strong> <strong>the</strong> Suwannee River estuary. Estuaries. 25: 1333−1342.<br />
Mazzotti, F. J, L. G. Pearlstine, D. Irvine, A. M. Weinstein, T. Barnes, and A. K. Volety.<br />
Stressor response models <strong>for</strong> <strong>the</strong> American oyster and blue crab. Draft report,<br />
Technical Assistance <strong>for</strong> an Ecological Evaluation of <strong>the</strong> <strong>Southwest</strong> Florida Feasibility<br />
Study. 24 pp.<br />
McDermott, J. J. 1960. The predation of oysters and barnacles by crabs of <strong>the</strong> family<br />
Xanthidae. Pennsylvania Academy of Science 34: 199−211.<br />
D:\TBC\Report\TBC_MFL.doc Last Save : 5/16/05 3:15 PM<br />
Page 13 / 129
May 15, 2005 Draft<br />
McMichael Jr., R. H., Peters, K. M., and Parsons, G. R. 1989. Early life history of <strong>the</strong><br />
snook, Centropomus undecimalis, in <strong>Tampa</strong> Bay, Florida. Nor<strong>the</strong>ast Gulf Sci. 10,<br />
113125.<br />
McMichael, R. H., Jr., and K. M. Peters. 1989. Early life history of spotted seatrout,<br />
Cynoscion nebulosus (Pisces: Sciaenidae) in <strong>Tampa</strong> Bay, Florida. Estuaries 12: 98−<br />
110.<br />
McNatt, R.A and J.A. Rice. 2004. Hypoxia-induced growth rate reduction in two juvenile<br />
estuary-dependent fishes. Journal of Experimental Marine Biology and Ecology.<br />
311(1):147-156.<br />
Menke, C.G., E.W. Meridith, and W.S. Wetterhall. 1961. Water Resources of<br />
Hillsborough County, Florida. Florida Bureau of Geology, Water Resources<br />
Investigations Report 25, Tallahassee, FL.<br />
Menzel, R. W. and F. E. Nichy. 1958. Studies of <strong>the</strong> distribution and feeding habits of<br />
some oyster predators in Alligator Harbor, Florida. Bulletin of Marine Science of <strong>the</strong> Gulf<br />
and Caribbean 8: 125−145.<br />
Menzel, R. W. and S. H. Hopkins. 1956. Crabs as predators of oysters in Louisiana.<br />
Proceedings of <strong>the</strong> National Shellfisheries Association 46: 177−184.<br />
Menzel, R. W., N. C. Hulings and R. R. Hathaway. 1966. Oyster abundance in<br />
Apalachicola Bay, Florida in relation to biotic association influenced by salinity and o<strong>the</strong>r<br />
factors. Gulf Res. Report 2: 73-96.<br />
Merriner, J. V. and J. W. Smith. 1979. A report to <strong>the</strong> oyster industry of Virginia on <strong>the</strong><br />
biology and management of <strong>the</strong> cownose ray (Rhinoptera bonasus, Mitchill) in lower<br />
Chesapeake Bay. Virginia Institute of Marine Science, Special Report Applied Science<br />
Ocean Engineering, 35 pp.<br />
Meyer, D. L. 1994. Habitat partitioning between <strong>the</strong> xanthid crabs Panopeus herbstii<br />
and Eurypanopeus depressus on intertidal oyster reefs (Crassostrea virginica) in<br />
sou<strong>the</strong>astern North Carolina. Estuaries 17: 674−679.<br />
Morisita, M. 1959. Measuring <strong>the</strong> interspecific association and similarity between<br />
communities. Memoirs Faculty Science Kyushu University Series E (Biology) 3: 65−80.<br />
Motz, L.H. 1975. Hydrologic Effects of <strong>the</strong> <strong>Tampa</strong> <strong>Bypass</strong> <strong>Canal</strong> System. Florida<br />
Bureau of Geology Report of Investigations 82. Tallahassee, FL.<br />
Muller, R. G. 2003. Eastern Oyster. Florida’s Inshore and Nearshore Species: 2002<br />
Status and Trends Report.<br />
http://www.floridamarine.org/features/category_main.asp?id=1663 (August 20,2004).<br />
D:\TBC\Report\TBC_MFL.doc Last Save : 5/16/05 3:15 PM<br />
Page 14 / 129
May 15, 2005 Draft<br />
Muth, M. K., D. W. Anderson, S. A. Karns, B. C. Murray and J. L. Domanico. 2000.<br />
Economic impacts of requiring post-harvest treatment of oysters. Final Report to <strong>the</strong><br />
Interstate Shellfish Sanitation Conference. Research Triangle Institute, Research<br />
Triangle Park, North Carolina.<br />
Nelson, J. 1912. Report of <strong>the</strong> Biologist: Observations of natural propagation of oysters<br />
at Barnegat, N. J. in 1911. Pages 271-309 In Annual Report of New Jersey Agricultural<br />
Experimental Station. 1911. New Brunswick, NJ.<br />
Nelson, J. 1914. Report of <strong>the</strong> Biologist: Oyster propagation observations <strong>for</strong> 1913.<br />
Pages 489-534, In Annual Report of New Jersey Agricultural Experimental Station.<br />
1911. New Brunswick, NJ.<br />
Nelson, T. C. 1891. Report of <strong>the</strong> Biologist: ostracultural experiments. Pages 251-320 In<br />
Annual Report of New Jersey Agricultural Experimental Station. 1890. Trenton, NJ.<br />
Nelson, J. 1909. Report of <strong>the</strong> Biologist: Studies of natural oyster propagation at<br />
Barnegat, N.J., 1908. Pages 151-177 in Annual Report of <strong>the</strong> New Jersey Agricultural<br />
Experimental Station. 1908. New Brunswick, NJ.<br />
Nelson, T. C. 1928a. On <strong>the</strong> distribution of critical temperatures <strong>for</strong> spawning and <strong>for</strong><br />
ciliary activity in bivalve Mollusca. Science. 67: 220-221.<br />
Nelson, T. C. 1928b. Relation of spawning of <strong>the</strong> oyster to temperature. Ecology. 9:<br />
145-154.<br />
Nelson, T. C. 1953. Some observations on <strong>the</strong> migrations and setting of oyster larvae.<br />
Proceedings of <strong>the</strong> National Shellfisheries Association. 43: 99-104.<br />
Nelson, T. C. 1955. Observations on <strong>the</strong> behavior and distribution of oyster larvae.<br />
Proceedings of <strong>the</strong> National Shellfisheries Association. 45: 23-28.<br />
Nelson, T. C. 1957. Some scientific aids to <strong>the</strong> oyster industry. American Scientist. 45:<br />
301-332.<br />
Nelson, T. C., and E. B. Perkins. 1932. Report of <strong>the</strong> Department of Biology. Pages<br />
111-122 In Annual Report of New Jersey Agricultural Experimental Station. 1931. New<br />
Brunswick, NJ.<br />
Newell , R. I. E and C. J. Langdon. 1986. Digestion and absorption of refractory carbon<br />
from <strong>the</strong> plant Spartina alterniflora by <strong>the</strong> oyster Crassostrea virginica. Marine Ecology<br />
Progress Series. 34: 105−115.<br />
Newell, R. I. E. 1988. Ecological changes in Chesapeake Bay: Are <strong>the</strong>y <strong>the</strong> result of<br />
overharvesting <strong>the</strong> American oyster, Crassostrea virginica?, p. 536−546. In M. P. Lynch,<br />
and E. C. Krome (eds.), Understanding <strong>the</strong> Estuary: Advances in Chesapeake Bay<br />
Research. Chesapeake Research Consortium, Publication 129. CBP/TRS 24/88.<br />
D:\TBC\Report\TBC_MFL.doc Last Save : 5/16/05 3:15 PM<br />
Page 15 / 129
May 15, 2005 Draft<br />
Odum, W. E. 1970. Insidious alteration of <strong>the</strong> estuarine environment. Trans. Am. Fish.<br />
Soc. 99, 836-850.<br />
OIKOS. 69: 373-386.<br />
Osman, R. W. and G. R. Abbe. 1995. Post-Settlement factors affecting oyster<br />
recruitment in <strong>the</strong> Chesapeake Bay, USA. Pages 335-340 in K. R. Dyer and R. J. Orth<br />
(eds.). Changes in Fluxes in Estuaries. Olsen and Olsen Press, Fredensborg, Denmark.<br />
Osman, R. W., R. B. Whitlatch and R. J. Malatesta. 1992. Potential role of micropredators<br />
in determining recruitment into a marine community. Marine Ecology Progress<br />
Series. 83: 35-43.<br />
Osman, R. W., R. B. Whitlatch and R. N. Zajac. 1989. Effects of resident species on<br />
recruitment into a community: larval settlement versus post-settlement mortality in <strong>the</strong><br />
oyster Crassostrea virginica. Marine Ecology Progress Series. 54: 61-73.<br />
Overstreet, R. M. and R. W. Heard. 1978. Food of <strong>the</strong> red drum, Sciaenops ocellata,<br />
from Mississippi Sound. Gulf Research Reports 6: 131−135.<br />
Oxygen Demand and Hypoxia in Charlotte Harbor, Florida, 2002-2003. Presented at<br />
Passioura, J.B., M.C. Ball and J.H. Knight. 1992. Mangroves May Salinize <strong>the</strong> Soil and<br />
in So Doing Limit <strong>the</strong>ir Transpiration Rate. Functional Ecology 6: 476-481.<br />
Paul, R. and A. Schnapf. 1993. Memorandum. Subject : “Meeting on Spread of Spartina<br />
onto <strong>the</strong> mudflats at McKay Bay. “<br />
Paul, R.T. and G. E. Woolfenden. 1985. Current Status and Recent Trends in Bird<br />
Populations of <strong>Tampa</strong> Bay. In: Proceedings, <strong>Tampa</strong> Bay Scientific In<strong>for</strong>mation<br />
Symposium (BASIS), May, 982. Florida Sea Grant College Report No. 65. Minneapolis,<br />
MN. Pp. 426-447. S.F. Treat, J.L. Simon, R.R. Lewis and R.L. Whiman,Jr. (Eds.)<br />
PBS&J, 2003(a). Hydro-Biological Monitoring Program (HBMP) Year 3 Interpretive<br />
Report. Prepared <strong>for</strong> <strong>Tampa</strong> Bay Water, Clearwater Florida.<br />
PBS&J, Inc., 1998. Assessment of Potential Impacts on Biological Communities of<br />
McKay Bay from Proposed Reductions in Freshwater Inflow from <strong>the</strong> <strong>Tampa</strong> <strong>Bypass</strong><br />
<strong>Canal</strong>. Prepared <strong>for</strong> <strong>Tampa</strong> Bay Water.<br />
PBS&J, Inc., 2000. <strong>Tampa</strong> <strong>Bypass</strong> <strong>Canal</strong>/Alafia River Water Supply Projects<br />
Hydrological Monitoring Program. Final Design Document. <strong>Tampa</strong>.<br />
PBS&J, Inc., 2003(b). <strong>Tampa</strong> <strong>Bypass</strong> <strong>Canal</strong>/Alafia River Water Supply Projects<br />
Hydrobiological Monitoring Program. Prepared <strong>for</strong> <strong>Tampa</strong> Bay Water, Clearwater<br />
Florida.<br />
D:\TBC\Report\TBC_MFL.doc Last Save : 5/16/05 3:15 PM<br />
Page 16 / 129
May 15, 2005 Draft<br />
Peebles, E. B and T.L. Hopkins,1993. Feeding habits of eight fish species from <strong>Tampa</strong><br />
Bay, with observations on opportunistic predation. Report prepared by <strong>the</strong> University of<br />
South Florida Department of Marine Science <strong>for</strong> <strong>the</strong> Florida Marine Research Institute,<br />
Florida Department of Environmental Protection, St. Petersburg, Florida.<br />
Peebles, E. B. 2002a. An assessment of <strong>the</strong> effects of freshwater inflows on fish and<br />
invertebrate habitat use in <strong>the</strong> Manatee-Braden estuary. Report prepared by <strong>the</strong><br />
University of South Florida College of Marine Science <strong>for</strong> <strong>the</strong> <strong>Southwest</strong> Florida Water<br />
Management District.<br />
Peebles, E. B. 2002b. An assessment of <strong>the</strong> effects of freshwater inflows on fish and<br />
invertebrate habitat use in <strong>the</strong> Peace River and Shell Creek estuaries. Report prepared<br />
by <strong>the</strong> University of South Florida College of Marine Science <strong>for</strong> <strong>the</strong> <strong>Southwest</strong> Florida<br />
Water Management District.<br />
Peebles, E. B. 2002c. Temporal resolution of biological and physical influences on bay<br />
anchovy Anchoa mitchilli egg abundance near a river-plume frontal zone. Mar. Ecol.<br />
Prog. Ser. 237, 257-269.<br />
Peebles, E. B. 2004. An analysis of freshwater inflow effects on <strong>the</strong> early stages of fish<br />
and <strong>the</strong>ir invertebrate prey in <strong>the</strong> Alafia River estuary. Report prepared by <strong>the</strong> University<br />
of South Florida College of Marine Science <strong>for</strong> <strong>the</strong> <strong>Southwest</strong> Florida Water<br />
Management District.<br />
Peebles, E.B. 2004. An Analysis of Fish and Invertebrate Data Related to <strong>the</strong><br />
Establishment of <strong>Minimum</strong> <strong>Flows</strong> <strong>for</strong> <strong>the</strong> <strong>Tampa</strong> <strong>Bypass</strong> <strong>Canal</strong>. Report prepared by <strong>the</strong><br />
University of South Florida College of Marine Science <strong>for</strong> <strong>the</strong> <strong>Southwest</strong> Florida Water<br />
Management District.<br />
Peebles, E. B. and M.S. Flannery. 1992. Fish nursery use of <strong>the</strong> Little Manatee River<br />
estuary Florida: Relationships with freshwater discharge. <strong>Southwest</strong> Florida Water<br />
Management District: Brooksville, Florida.<br />
Peters, K. M. 1981. Reproductive biology and developmental osteology of <strong>the</strong> Florida<br />
blenny, Chasmodes saburrae (Perci<strong>for</strong>mes: Blenniidae). Nor<strong>the</strong>ast Gulf Science. 4: 79−<br />
98.<br />
Peters, K. M. 1983. Larval and early juvenile development of <strong>the</strong> frillfin goby,<br />
Bathygobius soporator (Perci<strong>for</strong>mes: Gobiidae). Nor<strong>the</strong>ast Gulf Science. 6: 137−153.<br />
Peters, K. M., and R. H. McMichael, Jr. 1987. Early life history of <strong>the</strong> red drum,<br />
Sciaenops ocellatus (Pisces: Sciaenidae), in <strong>Tampa</strong> Bay, Florida. Estuaries. 10: 92−<br />
107.<br />
D:\TBC\Report\TBC_MFL.doc Last Save : 5/16/05 3:15 PM<br />
Page 17 / 129
May 15, 2005 Draft<br />
Peterson, B. J. and K. L. Heck, Jr. 2001. Positive interactions between suspensionfeeding<br />
bivalves and seagrass−a facultative mutualism. Marine Ecology Progress<br />
Series. 213: 143−155.<br />
Posey, M. H., T. D. Alpin, C. M. Powell, and E. Townsend. 1999. Use of oyster reefs as<br />
habitat <strong>for</strong> epibenthic fish and decapods, p. 133−159. In M. W. Luckenbach, R. Mann,<br />
and J. A. Wesson (eds.), Oyster reef habitat restoration: a synopsis and syn<strong>the</strong>sis of<br />
approaches. Virginia Institute of Marine Science Press, Gloucester Point, Virginia. 366<br />
p.<br />
Pry<strong>the</strong>rch, H. F. 1929. Investigation of <strong>the</strong> physical conditions controlling spawning of<br />
oysters and <strong>the</strong> occurrence, distribution, and setting of oyster larvae in Mil<strong>for</strong>d Harbor,<br />
Connecticut. Bulletin Bur. Fish. 44: 429-503.<br />
Purcell, J. E. 1985. Predation on fish eggs and larvae by pelagic cnidarians and<br />
ctenophores. Bull Mar Sci 37, 739-755.<br />
Purcell, J. E. and Arai, M. N. 2001. Interactions of pelagic cnidarians and ctenophores<br />
with fish: a review. Hydrobiologia 451, 27-44.<br />
Purcell, J. E., F. Cresswell, D. G. Cargo and V. S. Kennedy. 1991. Differential ingestion<br />
and digestion of bivalve larvae by <strong>the</strong> scyphozoan Chrysaora quinquecirrha and <strong>the</strong><br />
ctenophore Mnemiopsis leidyi. Biological Bulletin. 180: 103-111.<br />
Quayle, D. B. 1988. Pacific oyster culture in British Columbia. Canadian Bulletin of<br />
Fisheries and Aquatic Sciences. 218: 241 pp.<br />
Rakoncinski, C.F. 2004. Macrobenthic Communities as Indicators of Hydrobiological<br />
Variability in <strong>the</strong> Hillsborough River and Palm River – McKay Bay Watershes between<br />
1995 and 2003. Draft Final Report submitted to <strong>Southwest</strong> Florida Water Management<br />
District. August 3, 2004.<br />
Ritchie, T. P. and R. W. Menzel. 1969. Influence of light on larval settlement of<br />
American oysters. Proceedings of <strong>the</strong> National Shellfisheries Association. 59: 116-120.<br />
Robins, J. B., Halliday, I. A., Staunton-Smith, J., Mayer, D. G., and Sellin, M. J. (in<br />
press). Freshwater flow requirements of estuarine fisheries in tropical Australia: a<br />
review of <strong>the</strong> state of knowledge and application of a suggested approach. Mar. Freshw.<br />
Res.<br />
Rochow, T.R. 1994. The Effects of Water Table Changes on Fresh-water Marsh and<br />
Cypress Wetlands in <strong>the</strong> Nor<strong>the</strong>rn <strong>Tampa</strong> Bay Region – A Review. Technical Report<br />
1994-1, <strong>Southwest</strong> Florida Water Management District. February 1994.<br />
Rothschild, B. J. 1986. Dynamics of Marine Fish Populations. Harvard University Press:<br />
Cambridge, Mass.<br />
D:\TBC\Report\TBC_MFL.doc Last Save : 5/16/05 3:15 PM<br />
Page 18 / 129
May 15, 2005 Draft<br />
Ruddy, G. M., S. Y. Feng and G. S. Campbell. 1975. The effect of prolonged exposure<br />
to elevated temperatures on <strong>the</strong> biochemical constituents, gonadal development and<br />
shell depostion of <strong>the</strong> American oyster, Crassostrea virginica. Comparative<br />
Biochemistry and Physiology. 51B: 157-164.<br />
Runyan, S. 1961. Early development of <strong>the</strong> clingfish Gobiesox strumosus Cope.<br />
Chesapeake Science. 2: 113−141.<br />
Russell-Hunter, W. D. 1979. A Life of Invertebrates. Macmillan, New. York.<br />
Sastry, A. N. 1966. Temperature effects in reproduction of <strong>the</strong> bay scallop, Aequipecten<br />
irradians Lamarck. Biological Bulletin. 130: 118-134.<br />
Sastry, A. N. 1968. The relationships among food, temperature, and gonad<br />
development of <strong>the</strong> bay scallop Aequipecten irradians Lamarck. Physiological zoology.<br />
41:44-53.<br />
Savarese, M., A. K. Volety, and S. G. Tolley. 2003. Influence of watershed alteration on<br />
oyster health and oyster-reef habitat: management implications <strong>for</strong> <strong>the</strong> Faka-Union and<br />
Estero Bays. Final Report (Award # C-13252) submitted to <strong>the</strong> South Florida Water<br />
Management District, 86 pp.<br />
Schoener, T. W. 1970. Nonsynchronous spatial overlap of lizards in patchy habitats.<br />
Ecology. 51: 408−418.<br />
Schwamborn, R. and M.M. Criales. 2000. Feeding strategy and daily ration of juvenile<br />
pink shrimp Farfantepenaeus duorarum in a South Florida seagrass bed. Mar. Bio. 137,<br />
139-147.<br />
Shumway, S. E. 1983. Oxygen consumption and salinity tolerance in four Brazilian<br />
crabs. Crustaceana 44: 76−82.<br />
Shumway, S. E. 1996. Natural environmental factors. Pages 467-513 in V. S. Kennedy,<br />
R. I. E. Newell, and A. F. Eble (eds.), The Eastern Oyster Crassostrea virginica.<br />
Maryland Sea Grant College Publication, College Park, Maryland.<br />
Sidwell, V. D., A. L. Loomis and R. M. Grodner. 1979. Geographic and monthly variation<br />
in composition of oysters Crassostrea virginica. Marine Fisheries Review. 41:13-17.<br />
Smith, T.J. Personal Communication (email dated11/22/2004).<br />
Soniat, T. M. 1985. Changes in levels of infection of oysters by Perkinsus marinus, with<br />
special reference to <strong>the</strong> interaction of temperature and salinity upon parasitism.<br />
Nor<strong>the</strong>ast Gulf Science. 7: 171-174.<br />
Soniat, T. M. 1996. Epizootiology of Perkinsus marinus disease of eastern oysters in <strong>the</strong><br />
Gulf of Mexico. Journal of Shellfish Research 15:35-43.<br />
D:\TBC\Report\TBC_MFL.doc Last Save : 5/16/05 3:15 PM<br />
Page 19 / 129
May 15, 2005 Draft<br />
Stalnaker, C., B. L. Lamb, J. Henriksen, K. Bovee, and J. Bartholow. 1995. The<br />
Instream Flow Incremental Methodology: A Primer <strong>for</strong> IFIM. Biological Report 29, U. S.<br />
Department of <strong>the</strong> Interior, National Biological Service, Washington, D. C. 44 p.<br />
Steinberg, P. D. and V. S. Kennedy. 1979. Predation upon Crassostrea virginica<br />
(Gmelin) larvae by two invertebrate species common to Chesapeake Bay oyster bars.<br />
Veliger 22: 78-84.<br />
Stiles, S. S., and C. A. longwell. 1973. Fertilization, meiosis and clevage in eggs from<br />
large mass spawnings of Crassostrea virginica Gmelin, <strong>the</strong> commercial American<br />
oyster. Caryologia. 26: 253-262.<br />
SWFWMD (South Florida Water Management District). Coastal Ecosystems: Estuaries<br />
Projects. http://www.sfwmd.gov/org/wrp/wrp_ce/projects/oyster_program.html (August<br />
20, 2004).<br />
SWFWMD (<strong>Southwest</strong> Florida Water Management District), 2001. Regional Water<br />
Supply Plan. Board Approved August 2001.<br />
SWFWMD (<strong>Southwest</strong> Florida Water Management District), 2004. Alafia <strong>Minimum</strong><br />
<strong>Flows</strong> and Levels. Freshwater Segment Including Lithia and Buckhorn Springs Internal<br />
Peer Review Draft. November 2004.<br />
SWFWMD (<strong>Southwest</strong> Florida Water Management District),1990. A Plan <strong>for</strong> <strong>the</strong> Use<br />
and Management of <strong>the</strong> <strong>Tampa</strong> <strong>Bypass</strong>/Harney <strong>Canal</strong>. SWFWMD, Brooksville, FL.<br />
SWFWMD (<strong>Southwest</strong> Florida Water Management District),1996. Nor<strong>the</strong>rn <strong>Tampa</strong><br />
Water Resources Assessment Project, Volumes l & lll, March.<br />
SWFWMD (<strong>Southwest</strong> Florida Water Management District),1999. An Analysis of<br />
Hydrologic and Ecological Factors Related to <strong>the</strong> Establishment of <strong>Minimum</strong> <strong>Flows</strong> <strong>for</strong><br />
<strong>the</strong> <strong>Tampa</strong> <strong>Bypass</strong> <strong>Canal</strong> at Structure 160. Final Draft.<br />
Systat, 1998. Statistics Manual (pg 350) <strong>for</strong> Systat 8.0 software. SPSS, Inc. Chicago,<br />
IL.<br />
Tabb, D. C., and R. B. Manning. 1961. A checklist of <strong>the</strong> flora and fauna of nor<strong>the</strong>rn<br />
Florida Bay and adjacent brackish waters of <strong>the</strong> Florida mainland collected during <strong>the</strong><br />
period July, 1957 through September, 1960. Bulletin of Marine Science of <strong>the</strong> Gulf and<br />
Caribbean. 11: 552−649.<br />
Takasuka, A., Aoki, I., and Mitani, I. 2004. Three synergistic growth-related mechanisms<br />
in <strong>the</strong> short-term survival of larval Japanese anchovy Engraulis japonicus in Sagami<br />
Bay. Mar. Ecol. Prog. Ser. 270, 217-228.<br />
D:\TBC\Report\TBC_MFL.doc Last Save : 5/16/05 3:15 PM<br />
Page 20 / 129
May 15, 2005 Draft<br />
Tamburri, M. N., R. K. Zimmer-Faust and M. L. Tamplin. 1992. Natural sources and<br />
properties of chemical inducers mediation settlement of oyster larvae: A re-examination.<br />
Biology Bulletin. 183: 327-338.<br />
<strong>Tampa</strong> Bay Water. 1998. Master Water Plan. Clearwater.<br />
Taylor, J.C and J.M. Miller. 2002. Physiological per<strong>for</strong>mance of juvenile sou<strong>the</strong>rn<br />
flounder, Paralichthys lethostigma (Jordan and Gilbert, 1884), in chronic and episodic<br />
hypoxia. Journal of Experimental Marine Biology and Ecology. 258(2):195-214.<br />
TBNEP (<strong>Tampa</strong> Bay National Estuary Program), 1996. Statistical Analysis of <strong>the</strong><br />
<strong>Tampa</strong> Bay National Estuary Program 1993 Benthic Survey. TBNEP Technical Report<br />
#11-95.<br />
TBNEP (<strong>Tampa</strong> Bay National Estuary Program),1996. Charting <strong>the</strong> Course: The<br />
Comprehensive Conservation and Management Plan <strong>for</strong> <strong>Tampa</strong> Bay. St. Petersburg.<br />
TBNEP (<strong>Tampa</strong> Bay National Estuary Program),1997. Hillsborough River and Palm<br />
River/TBC <strong>Minimum</strong> Flow Advisory Group. Summary Recommendations to <strong>the</strong><br />
<strong>Southwest</strong> Florida Water Management District. Memorandum addressed to David<br />
Moore. July 10, 1997.<br />
Ter Braak, C.J.F. 1988. CANOCO - A FORTRAN Program <strong>for</strong> Canonical Community<br />
Ordination by Correspondence Analysis, Principal Components Analysis and<br />
Redundancy Analysis. Groep Land bouwwiskunde , Tech. Rpt.: LW A-88-02,<br />
Wageningen , The Ne<strong>the</strong>rlands. 95 pp.<br />
Thompson, R. J., R. I. E. Newell, V. S. Kennedy, and R. Mann. 1996. Reproductive<br />
processes and early development. Pages 335-370. In V. S. Kennedy, R. I. E. Newell,<br />
and A. F. Eble (eds.), The Eastern Oyster Crassostrea virginica. Maryland Sea Grant<br />
College Publication, College Park, Maryland.<br />
Tribou, E. and P.A. Noble. 2004. Neuroet: a simple artificial neural network <strong>for</strong><br />
scientists. Civil and Environmental Engineering, University of Washington, Seattle.<br />
Tsou, T. and R.E. Ma<strong>the</strong>son,Jr. 2002. Seasonal changes in <strong>the</strong> nekton community of<br />
<strong>the</strong> Suwannee River estuary and <strong>the</strong> potential impacts of freshwater withdrawal.<br />
Estuaries 25, 1372-1381.<br />
Turner, H. J., Jr. and C. J. George. 1955. Some aspects of <strong>the</strong> behavior of <strong>the</strong> quahaug,<br />
Venus mercenaria, during <strong>the</strong> early stages. Eight Rep. Invest. Shellfish Mass,. Pp. 155-<br />
156.<br />
Twilley, R. R. Personal Communication (email dated 12/27/2004)<br />
Ulanowicz, R. E., W. C. Caplins and E. A. Dunnington. 1980. The <strong>for</strong>ecasting of oyster<br />
harvest in central Chesapeake Bay. Estuarine Coastal Marine Science. 11: 101-106.<br />
D:\TBC\Report\TBC_MFL.doc Last Save : 5/16/05 3:15 PM<br />
Page 21 / 129
May 15, 2005 Draft<br />
Underwood A. J. and P. G. Fairwea<strong>the</strong>r. 1989. Supply-side ecology and benthic marine<br />
assemblages. Trends Ecology and Evolution. 4: 16-20.<br />
United States Department of Commerce. 1997. Magnuson-Stevens Fishery<br />
Conservation and Management Act, as amended through October 11, 1996. National<br />
Oceanic and Atmospheric Administration technical memorandum NMFS-F/SPO-23. U.<br />
S. Government Printing Office, Washington, D. C.<br />
United States Environmental Protection Agency. 1987. Estuary Program Primer,<br />
Environmental Protection Agency, Office of Marine and Estuarine Protection,<br />
Washington, D. C.<br />
USC&GS (U.S. Coast and Geodetic Society), 1885 Coastal chart no. 177, <strong>Tampa</strong> Bay,<br />
Florida<br />
USDA (U.S. Department of Agriculture, Bureau of Soils), 1916. Soil Survey of<br />
Hillsborough County, Fla. USDA Field Operations of <strong>the</strong> Bureau of Soils, 18 th Annual<br />
Report: 749-786.<br />
USGS (U.S. Geological Survey),1956 – <strong>Tampa</strong> and Brandon Quadrangles<br />
USGS (U.S. Geological Survey),1983. Water Resources Data <strong>for</strong> Florida, Water Year<br />
1982. v.3A, <strong>Southwest</strong> Florida Surface Water. U.S. Geological Survey, Water-Data<br />
Report FL-82-3A, Tallahassee, FL. 616 pp.<br />
USGS (United States Geological Survey),2004.<br />
(http://nwis.waterdata.usgs.gov/fl/nwis/discharge/?site_no=02301802 )<br />
Veitch, F. P. and H. Hidu. 1971. Gregarious setting in <strong>the</strong> American oyster Crassostrea<br />
virginica Gmelin: I. Properties of a partially purified ”setting factor”. Chesapeake<br />
Science. 12: 173-178.<br />
Vernberg, F., C. Schlieper and D. Schneider. 1963. The influence of temperature and<br />
salinity on ciliary activity of excised gill tissue of mollusks from North Carolina.<br />
Comparative Biochemistry and Physiology. 8: 271-285.<br />
Volety, A. K., and M. Savarese. 2001. Oysters as indicators of ecosystem health:<br />
determining <strong>the</strong> impacts of watershed alterations and implications <strong>for</strong> restoration. Final<br />
Report submitted to National Fish and Wildlife Foundation, South Florida Water<br />
Management District (Big Cypress Basin), and Florida Gulf Coast University<br />
Foundation, 104 pp.<br />
Volety, A. K., F. O. Perkins, R. Mann and P. R. Hershberg. 2000. Progression of<br />
diseases caused by <strong>the</strong> oyster parasites, Perkinsus marinus and Haplosporidium<br />
nelsoni, in Crassostrea virginica on constructed artificial reefs. Journal of Shellfish<br />
Research. 19: 341-347.<br />
D:\TBC\Report\TBC_MFL.doc Last Save : 5/16/05 3:15 PM<br />
Page 22 / 129
May 15, 2005 Draft<br />
Volety, A. K., S. G. Tolley, and J. W. Winstead. 2003. Investigations into effects of<br />
seasonal and water quality parameters on oysters (Crassostrea virginica) and<br />
associated fish populations in <strong>the</strong> Calooshatchee Estuary. Interpretive Report (Award<br />
#C12412-A1) submitted to <strong>the</strong> South Florida Water management District, 111 pp.<br />
Volety, A.K. and S.G. Tolley. 2004. Analyses of <strong>the</strong> effects of freshwater inflow<br />
alteration on oysters (Crassostrea virginica) in <strong>the</strong> <strong>Tampa</strong> <strong>Bypass</strong> <strong>Canal</strong>/McKay Bay<br />
estuarine system. Draft Report prepared <strong>for</strong> <strong>Southwest</strong> Florida Water Management<br />
District.<br />
Richter, B.D., J.V. Baumgartner, J. Powell, and D.P. Braun. 1996. A Method <strong>for</strong><br />
Assessing Hydrologic Alteration within Ecosystems. Conservation Biology 10(4):1163-<br />
1174.<br />
Waller, T. R. 1981. Functional morphology and development of veliger larvaeof <strong>the</strong><br />
European oyster, Ostrea edulis Linne. Smithsonian Contributions in Zoology. 328: 1-70.<br />
Wannamaker, C.M. and J.A. Rice. 2000. Effects of hypoxia on movements and behavior<br />
of selected estuarine organisms from <strong>the</strong> sou<strong>the</strong>astern United States. Journal of<br />
Experimental Marine Biology and Ecology. 249(2):145-163.<br />
Water & Air Research, Inc. & SDI Environmental Services, Inc. 1993. First Progress<br />
Report: <strong>Tampa</strong> <strong>Bypass</strong> <strong>Canal</strong> and Hillsborough River Biological Assessment &<br />
Monitoring Program. Prepared <strong>for</strong> West Coast Regional Water Supply Authority.<br />
Clearwater .<br />
Water & Air Research, Inc. & SDI Environmental Services, Inc. 1994. Second<br />
Interpretive Report <strong>Tampa</strong> <strong>Bypass</strong> <strong>Canal</strong> and Hillsborough River Monitoring Program.<br />
Prepared <strong>for</strong> West Coast Regional Water Supply Authority. Clearwater. Water and Air<br />
Research, Inc & SDI Environmental Services, Inc., 1995. Second Interpretive Report<br />
<strong>Tampa</strong> <strong>Bypass</strong> <strong>Canal</strong> and Hillsborough River Hydro-Biological Monitoring Program<br />
Volume I of III. Prepared <strong>for</strong> West Coast Regional Water Supply Authority Clearwater,<br />
Florida and City of <strong>Tampa</strong>, <strong>Tampa</strong>, FL.<br />
Water and Air Research, Inc. 1988. <strong>Tampa</strong> <strong>Bypass</strong> <strong>Canal</strong> Ecological Monitoring<br />
Annual Report. Prepared <strong>for</strong> West Coast Regional Water Supply Authority, Clearwater,<br />
FL.<br />
Watts, B. D. 1988. Foraging implications of food usage patterns in yellow-crowned<br />
night-herons. The Condor. 90: 860−865.<br />
Weiner, R. M., A. M. Segall, and R. R. Colwell. 1985. Characterization of a marine<br />
bacterium associated with Crassostrea virginica (<strong>the</strong> eastern oyster.) Applied and<br />
Environmental Microbiology. 49: 83-90.<br />
D:\TBC\Report\TBC_MFL.doc Last Save : 5/16/05 3:15 PM<br />
Page 23 / 129
May 15, 2005 Draft<br />
Wells, H. W. 1961. The fauna of oyster beds, with special reference to <strong>the</strong> salinity<br />
factor.<br />
Wenner, E., H. R. Beatty and L. Coen. 1996. A method <strong>for</strong> quantitatively sampling<br />
nekton on intertidal oyster reefs. Journal of Shellfish Research. 15: 769−775.<br />
White, M. E., and E. A. Wilson. 1996. Predators, pests, and competitors, p. 559-580. In<br />
V. S. Kennedy, R. I. E. Newell, and A. F. Eble (eds.), The Eastern Oyster Crassostrea<br />
virginica. Maryland Sea Grant College Publication, College Park, Maryland.<br />
Williams, A. B. 1978. True crabs. In W. Fischer (ed.), FAO Species Identification Sheets<br />
<strong>for</strong> Fishery Purposes, Western Central Atlantic, Fishing Area 31. Vol. VI. Food and<br />
Agriculture Organization of <strong>the</strong> United Nations, Rome.<br />
Wilson, B. R. 1969. Survival and reproduction of <strong>the</strong> mussel Xenostrobus securis<br />
(Lamarck) (Mollusca; Bivalvia; Mytilidaae) in a Western Australian estuary. Part II.<br />
Reproduction, growth, and longevity. Journal of Natural History. 3: 93-120.<br />
Winstead, J. T. 1995. Digestive tubule atrophy in eastern oysters, Crassostrea virginica<br />
(Gmelin 1791), exposed to salinity and starvation stress. Journal Shellfish Research.<br />
14: 105-111.<br />
Wood, L. and W. J. Hargis, Jr. 1971. Transport of bivalve larvae in a tidal estuary.<br />
Pages 29-44 in D. J. Crisp (ed.). Fourth European Marine Biology Symposium.<br />
Cambridge University Press, New York.<br />
Woodburn, K. D. 1965. Clams and oysters in Charlotte Co. and vicinity. Florida Board of<br />
Conservation, vol. 62-12. 29 pp.<br />
Worth, D. 1998. Review of Methodologies and Issues Concerning <strong>Minimum</strong> Flow and<br />
Level Establishment by Water Management Agencie. Office of Water Policy, Florida<br />
Department of Environmental Protection, Tallahassee, Fl., 73 pp.<br />
Zimmer-Faust, R. K. and M. N. Tamburri. 1994. Chemical identity and ecological<br />
implications of a waterborne, larval settlement cue. Limnology Oceanography. 39: 1075-<br />
1087.<br />
D:\TBC\Report\TBC_MFL.doc Last Save : 5/16/05 3:15 PM<br />
Page 24 / 129
May 15, 2005 Draft<br />
D:\TBC\Report\TBC_MFL.doc Last Save : 5/16/05 3:15 PM<br />
Page 25 / 129


