Cashier downtime in retail vsf 07 12 11 final web
Cashier downtime in retail vsf 07 12 11 final web
Cashier downtime in retail vsf 07 12 11 final web

You also want an ePaper? Increase the reach of your titles
YUMPU automatically turns print PDFs into web optimized ePapers that Google loves.
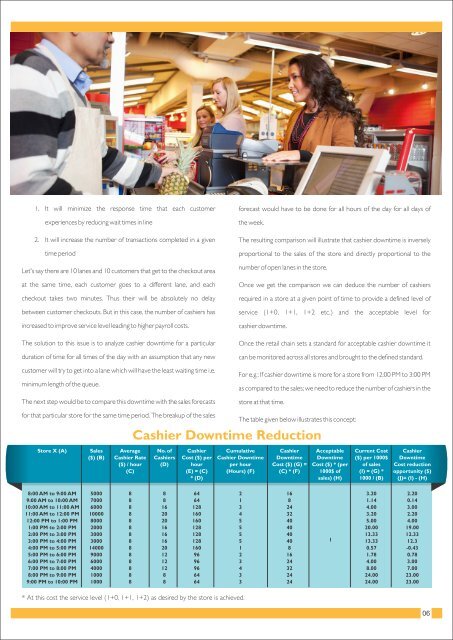
1. It will m<strong>in</strong>imize the response time that each customer<br />
experiences by reduc<strong>in</strong>g wait times <strong>in</strong> l<strong>in</strong>e<br />
2. It will <strong>in</strong>crease the number of transactions completed <strong>in</strong> a given<br />
time period<br />
Let's say there are 10 lanes and 10 customers that get to the checkout area<br />
at the same time, each customer goes to a different lane, and each<br />
checkout takes two m<strong>in</strong>utes. Thus their will be absolutely no delay<br />
between customer checkouts. But <strong>in</strong> this case, the number of cashiers has<br />
<strong>in</strong>creased to improve service level lead<strong>in</strong>g to higher payroll costs.<br />
The solution to this issue is to analyze cashier <strong>downtime</strong> for a particular<br />
duration of time for all times of the day with an assumption that any new<br />
customer will try to get <strong>in</strong>to a lane which will have the least wait<strong>in</strong>g time i.e.<br />
m<strong>in</strong>imum length of the queue.<br />
The next step would be to compare this <strong>downtime</strong> with the sales forecasts<br />
for that particular store for the same time period. The breakup of the sales<br />
Store X (A)<br />
8:00 AM to 9:00 AM<br />
9:00 AM to 10:00 AM<br />
10:00 AM to <strong>11</strong>:00 AM<br />
<strong>11</strong>:00 AM to <strong>12</strong>:00 PM<br />
<strong>12</strong>:00 PM to 1:00 PM<br />
1:00 PM to 2:00 PM<br />
2:00 PM to 3:00 PM<br />
3:00 PM to 4:00 PM<br />
4:00 PM to 5:00 PM<br />
5:00 PM to 6:00 PM<br />
6:00 PM to 7:00 PM<br />
7:00 PM to 8:00 PM<br />
8:00 PM to 9:00 PM<br />
9:00 PM to 10:00 PM<br />
Sales<br />
($) (B)<br />
5000<br />
7000<br />
6000<br />
10000<br />
8000<br />
2000<br />
3000<br />
3000<br />
14000<br />
9000<br />
6000<br />
4000<br />
1000<br />
1000<br />
Average<br />
<strong>Cashier</strong> Rate<br />
($) / hour<br />
(C)<br />
8<br />
8<br />
8<br />
8<br />
8<br />
8<br />
8<br />
8<br />
8<br />
8<br />
8<br />
8<br />
8<br />
8<br />
No. of<br />
<strong>Cashier</strong>s<br />
(D)<br />
8<br />
8<br />
16<br />
20<br />
20<br />
16<br />
16<br />
16<br />
20<br />
<strong>12</strong><br />
<strong>12</strong><br />
<strong>12</strong><br />
8<br />
8<br />
<strong>Cashier</strong><br />
Cost ($) per<br />
hour<br />
(E) = (C)<br />
* (D)<br />
64<br />
64<br />
<strong>12</strong>8<br />
160<br />
160<br />
<strong>12</strong>8<br />
<strong>12</strong>8<br />
<strong>12</strong>8<br />
160<br />
96<br />
96<br />
96<br />
64<br />
64<br />
forecast would have to be done for all hours of the day for all days of<br />
the week.<br />
The result<strong>in</strong>g comparison will illustrate that cashier <strong>downtime</strong> is <strong>in</strong>versely<br />
proportional to the sales of the store and directly proportional to the<br />
number of open lanes <strong>in</strong> the store.<br />
Once we get the comparison we can deduce the number of cashiers<br />
required <strong>in</strong> a store at a given po<strong>in</strong>t of time to provide a def<strong>in</strong>ed level of<br />
service (1+0, 1+1, 1+2 etc.) and the acceptable level for<br />
cashier <strong>downtime</strong>.<br />
Once the <strong>retail</strong> cha<strong>in</strong> sets a standard for acceptable cashier <strong>downtime</strong> it<br />
can be monitored across all stores and brought to the def<strong>in</strong>ed standard.<br />
For e.g.: If cashier <strong>downtime</strong> is more for a store from <strong>12</strong>:00 PM to 3:00 PM<br />
as compared to the sales; we need to reduce the number of cashiers <strong>in</strong> the<br />
store at that time.<br />
The table given below illustrates this concept:<br />
<strong>Cashier</strong> Downtime Reduction<br />
Cumulative<br />
<strong>Cashier</strong> Downtime<br />
per hour<br />
(Hours) (F)<br />
* At this cost the service level (1+0, 1+1, 1+2) as desired by the store is achieved.<br />
2<br />
1<br />
3<br />
4<br />
5<br />
5<br />
5<br />
5<br />
1<br />
2<br />
3<br />
4<br />
3<br />
3<br />
<strong>Cashier</strong><br />
Downtime<br />
Cost ($) (G) =<br />
(C) * (F)<br />
16<br />
8<br />
24<br />
32<br />
40<br />
40<br />
40<br />
40<br />
8<br />
16<br />
24<br />
32<br />
24<br />
24<br />
Acceptable<br />
Downtime<br />
Cost ($) * (per<br />
1000$ of<br />
sales) (H)<br />
1<br />
Current Cost<br />
($) per 1000$<br />
of sales<br />
(I) = (G) *<br />
1000 / (B)<br />
3.20<br />
1.14<br />
4.00<br />
3.20<br />
5.00<br />
20.00<br />
13.33<br />
13.33<br />
0.57<br />
1.78<br />
4.00<br />
8.00<br />
24.00<br />
24.00<br />
<strong>Cashier</strong><br />
Downtime<br />
Cost reduction<br />
opportunity ($)<br />
(J)= (I) - (H)<br />
2.20<br />
0.14<br />
3.00<br />
2.20<br />
4.00<br />
19.00<br />
<strong>12</strong>.33<br />
<strong>12</strong>.3<br />
-0.43<br />
0.78<br />
3.00<br />
7.00<br />
23.00<br />
23.00