Economic evaluation of road safety measures - Swov
Economic evaluation of road safety measures - Swov
Economic evaluation of road safety measures - Swov

Create successful ePaper yourself
Turn your PDF publications into a flip-book with our unique Google optimized e-Paper software.
5.5. Other methods<br />
unit-effect can be calculated for each alternative. This is usually referred to<br />
as the cost-effectiveness ratio.<br />
Where the alternatives have been scored according to various effects<br />
(intended and unintended, positive and/or negative, direct and/or indirect),<br />
the result will be a table or balance sheet in which the effects <strong>of</strong> all<br />
alternatives are systematically arranged (positive against negative).<br />
5.5.1. Overview table methods<br />
The use <strong>of</strong> an overview table method involves a limited modification <strong>of</strong> the<br />
effects overview as described in the project-effects matrix. The intention is<br />
not to arrive at any ranking or 'league table' <strong>of</strong> alternatives, and it is<br />
certainly not to arrive at any firm statement regarding the socio-economic<br />
pr<strong>of</strong>itability <strong>of</strong> the alternatives. Rather, overview table methods are used to<br />
arrange the information about the alternatives thus far collected in such a<br />
way as to make it more accessible to those who must make a decision.<br />
They will be the ones to judge ('weight') the various aspects. Examples <strong>of</strong><br />
this type <strong>of</strong> <strong>evaluation</strong> method include the planning balance sheet method<br />
and the scorecard method.<br />
The scorecard method is used to facilitate the comparison <strong>of</strong> various<br />
alternatives without making any judgement regarding their order <strong>of</strong> priority.<br />
It is a presentation tool which enables a clear impression <strong>of</strong> the advantages<br />
and disadvantages <strong>of</strong> the alternative under review to be given. An example<br />
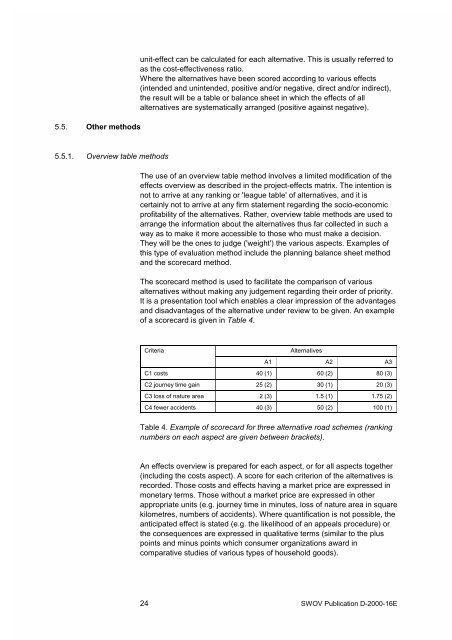
<strong>of</strong> a scorecard is given in Table 4.<br />
Criteria<br />
Alternatives<br />
A1 A2 A3<br />
C1 costs 40 (1) 60 (2) 80 (3)<br />
C2 journey time gain 25 (2) 30 (1) 20 (3)<br />
C3 loss <strong>of</strong> nature area 2 (3) 1.5 (1) 1.75 (2)<br />
C4 fewer accidents 40 (3) 50 (2) 100 (1)<br />
Table 4. Example <strong>of</strong> scorecard for three alternative <strong>road</strong> schemes (ranking<br />
numbers on each aspect are given between brackets).<br />
An effects overview is prepared for each aspect, or for all aspects together<br />
(including the costs aspect). A score for each criterion <strong>of</strong> the alternatives is<br />
recorded. Those costs and effects having a market price are expressed in<br />
monetary terms. Those without a market price are expressed in other<br />
appropriate units (e.g. journey time in minutes, loss <strong>of</strong> nature area in square<br />
kilometres, numbers <strong>of</strong> accidents). Where quantification is not possible, the<br />
anticipated effect is stated (e.g. the likelihood <strong>of</strong> an appeals procedure) or<br />
the consequences are expressed in qualitative terms (similar to the plus<br />
points and minus points which consumer organizations award in<br />
comparative studies <strong>of</strong> various types <strong>of</strong> household goods).<br />
24 SWOV Publication D-2000-16E