Groundwater search by remote sensing: A methodological ... - FAO.org
Groundwater search by remote sensing: A methodological ... - FAO.org
Groundwater search by remote sensing: A methodological ... - FAO.org

You also want an ePaper? Increase the reach of your titles
YUMPU automatically turns print PDFs into web optimized ePapers that Google loves.
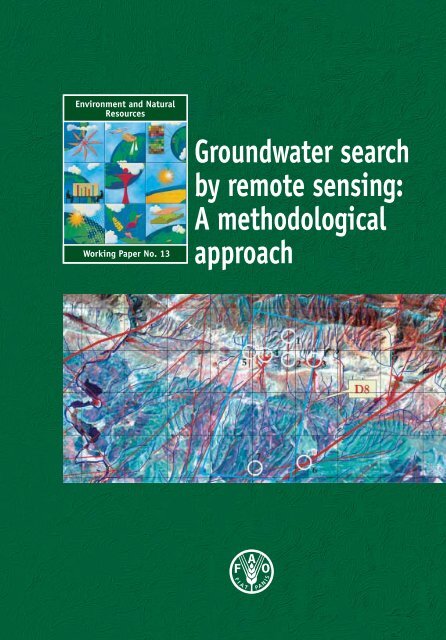
Environment and Natural<br />
Resources<br />
Working Paper No. 13<br />
<strong>Groundwater</strong> <strong>search</strong><br />
<strong>by</strong> <strong>remote</strong> <strong>sensing</strong>:<br />
A <strong>methodological</strong><br />
approach
Environment and Natural<br />
Resources<br />
Working Paper No. 13<br />
<strong>Groundwater</strong> <strong>search</strong><br />
<strong>by</strong> <strong>remote</strong> <strong>sensing</strong>:<br />
A <strong>methodological</strong><br />
approach
iii<br />
<strong>Groundwater</strong> <strong>search</strong> <strong>by</strong> <strong>remote</strong> <strong>sensing</strong>: A <strong>methodological</strong> approach<br />
<strong>by</strong> C. Travaglia and N. Dainelli<br />
41 pp., 16 figures, 1 table, Environment and Natural Resources Working Paper No. 13<br />
<strong>FAO</strong>, Rome, 2003.<br />
ABSTRACT<br />
In the framework of the technical assistance provided to the <strong>Groundwater</strong> Unit (GWU) of the<br />
<strong>FAO</strong>-implemented IRAQ/SCR/986 "Three-year Agricultural Programme" for the three Iraqi<br />
Northern Governorates, a comprehensive <strong>remote</strong> <strong>sensing</strong>/GIS methodology was developed to<br />
identify potential sites for groundwater exploitation.<br />
The approach used in the study was a development of the traditional standard sequence of<br />
drainage, landforms, cover and lineaments analyses, to which several improvements and<br />
additions were made, such as:<br />
! all data were in digital format and stored in a geo-database as GIS layers;<br />
! all analyses and interpretations were performed directly from the computer screen;<br />
! on the basis of a previous positive experience, thermal lineaments analysis was<br />
performed;<br />
! a comprehensive geo-database was created including all GIS layers which were<br />
considered of interest for the study;<br />
! <strong>by</strong> using the potentiality of GIS software, which allows stacking of georeferenced data for<br />
comparison and integration and data query for subsetting the needed information, selected<br />
layers of the database were superimposed on the Landsat image kept as background and a<br />
logical series of observations was made, leading to a well-substantiated set of<br />
interpretation assumptions.<br />
The creation of a GIS database, including the data format and entry, is a time-consuming and<br />
laborious exercise, as high accuracy is definitely mandatory. However, once the database is<br />
complete, interpretation of features leading to selection of promising sites for groundwater<br />
<strong>search</strong> is carried out easily and quickly. This as a result of data availability of all needed<br />
information in a GIS environment.<br />
Thirty test areas, selected <strong>by</strong> the field team, were investigated and 198 promising sites were<br />
identified for further ground survey and subsequent drilling.<br />
Unfortunately, the political situation in the region deteriorated and thus it was impossible for<br />
the field team of GWU to check and exploit the results of the study. However, they managed<br />
to assess some of the potential sites indicated in the first maps provided and reported an<br />
accuracy of about 90 percent.<br />
Keywords: groundwater <strong>search</strong>, Northern Iraq, <strong>remote</strong> <strong>sensing</strong><br />
This series replaces the following:<br />
* Environment and Energy Series<br />
* Remote Sensing Centre Series<br />
* Agrometeorology Working Papers<br />
List of documents published in the above series and other information can be found at the<br />
following web site: http://www.fao.<strong>org</strong>/sd
iv<br />
Acknowledgements<br />
This study was carried out in the framework of <strong>FAO</strong> humanitarian programme in Iraq,<br />
implemented <strong>by</strong> <strong>FAO</strong>'s Service for Special Emergency Programmes (TCES).<br />
The authors are greatly indebted to all who assisted in the implementation and completion of<br />
this study <strong>by</strong> providing information, advice and facilities.<br />
Special appreciation is directed to Mr. Miroslav Markovic and to Mr. Zoran Stevanovic,<br />
<strong>Groundwater</strong> Unit of the Water Resources and Irrigation Subsector, <strong>FAO</strong> humanitarian<br />
programme in Iraq, for their provision of significant information and data coupled with field<br />
support.<br />
The authors wish to express their gratitude to Mr. Brian Jackson, TCES, because without his<br />
initial support, this study would not have been carried out.
v<br />
TABLE OF CONTENTS<br />
Page<br />
ABSTRACT<br />
iii<br />
CHAPTER 1: INTRODUCTION 1<br />
1.1 Background 1<br />
1.2 Objectives of the study<br />
1.3 Study area 2<br />
1.4 Data/software used 5<br />
CHAPTER 2: METHODOLOGY 7<br />
2.1 Topographic maps georeferentiation 7<br />
2.2 Satellite data georeferentiation 9<br />
2.3 Drainage analysis/watersheds identification 11<br />
2.4 Landforms analysis 15<br />
2.5 Cover analysis 16<br />
2.6 Lineaments analysis 17<br />
2.7 Database preparation 20<br />
2.8 Interpretation 22<br />
2.9 Field checking 23<br />
CHAPTER 3: RESULTS 25<br />
CHAPTER 4: CONCLUSIONS 39<br />
REFERENCES 41<br />
FIGURES<br />
1. Study area 3<br />
2. Topographic maps index 8<br />
3. Landsat scenes index 10<br />
4. Watersheds occuring in the study area 13<br />
5. Example of drainage network 14<br />
6. Typical anticline and syncline sequence of the Border Folds region 16<br />
7. Regional and local lineaments 18<br />
8. Thermal and other lineaments 18<br />
9. Rosette diagrams 19<br />
10. Location of test sites 22<br />
11. Correct positioning of rig 23<br />
12. Priority area E 2 29
vi<br />
Page<br />
13. Priority area E 7 31<br />
14. Priority area D 8 33<br />
15. Priority area S 7 35<br />
16. Priority area S 4 37<br />
TABLE<br />
1. Satellite data (Landsat 7) used in the study 5
1<br />
CHAPTER 1<br />
INTRODUCTION<br />
1.1 Background<br />
In the immediate aftermath of the Gulf War in 1991, the United Nations sent a mission to Iraq<br />
which reported the makings of “an imminent catastrophe … if minimum life supporting needs<br />
are not rapidly met.” The Security Council responded <strong>by</strong> offering Iraq, in August 1991, an<br />
opportunity to sell oil to meet its people’s basic needs while the sanctions, imposed in August<br />
1990, remained in place. That offer was not accepted and over the following five years there<br />
was widespread suffering with food shortages, an absence of essential medicines and a<br />
general deterioration in essential social services.<br />
In 1996 the Government of Iraq and the United Nations Secretariat reached an agreement on a<br />
Memorandum of Understanding, setting out the details of implementing Security Council<br />
resolution 986 (1995) which had been adopted 13 months earlier. Resolution 986 (1995) set<br />
terms of reference for the "Oil-for-Food" programme.<br />
"Oil-for-Food" is a unique programme, established <strong>by</strong> the Council as a temporary measure to<br />
provide for the humanitarian needs of the Iraqi people.The programme is funded exclusively<br />
with proceeds from Iraqi oil exports, authorized <strong>by</strong> the Security Council. Currently 72 percent<br />
of Iraqi oil export proceeds goes to fund the humanitarian programme, of which 59 percent is<br />
earmarked for the contracting of supplies and equipment <strong>by</strong> the Government of Iraq for<br />
the 15 Central and Southern Governorates and 13 percent for the three Northern<br />
Governorates, where the United Nations implements the programme on behalf of the<br />
Government of Iraq.<br />
There are nine United Nations agencies and programmes involved in the "Oil-for-Food”<br />
programme. These are: <strong>FAO</strong>, ITU, UNDP, UNESCO, UN-Habitat, UNICEF, UNOPS, WFP,<br />
and WHO.<br />
<strong>FAO</strong> is implementing the IRAQ/SCR 986 Three-Year Agricultural Programme in the three<br />
Northern Governorates, for the sustainable rehabilitation of the agricultural sector, including<br />
all aspects of agriculture, forestry and fishery. The Water Resources and Irrigation Sub-Sector<br />
(WRISS) is the largest of the agriculture-related activities in the three Northern Governorates,<br />
with six major fields of activity as follows:<br />
- rehabilitation of existing irrigation infrastructures, ensuring agricultural production on<br />
irrigable land;<br />
- construction of new irrigation schemes, extending the irrigated area, and introducing water<br />
saving irrigation technologies;<br />
- water harvesting through the construction of run-off collection dams and soil and water<br />
conservation measures, increasing soil moisture availability for crop production;<br />
- drilling of deep wells, rehabilitation of shallow wells and maintenance of springs, increasing<br />
groundwater resources use for crop production;<br />
- water resources management, ensuring water availability for irrigation purposes in sufficient<br />
quantity and quality;
2<br />
- human resources development, ensuring local professional capacity building and<br />
institutional strengthening.<br />
Within the framework of WRISS, a groundwater unit (GWU) was established with the<br />
objective of appraising the groundwater availability of the region and identifying sites for<br />
groundwater exploitation.<br />
1.2 Objectives of the study<br />
The general objective of the study was to provide the field team of WRISS/GWU with<br />
information to facilitate and speed up their ground investigations for groundwater appraisal<br />
and exploitation.<br />
In this framework specific objectives were:<br />
- to provide a reliable and uniform topographic coverage of the three Iraqi Northern<br />
Governorates;<br />
- to provide, from <strong>remote</strong> <strong>sensing</strong> data, detailed information on drainage and watersheds;<br />
- to prepare a comprehensive database in ArcView format including layers from <strong>remote</strong><br />
<strong>sensing</strong> data interpretation as well as from traditional data, relevant for groundwater <strong>search</strong><br />
and hydrological applications;<br />
- to identify for the 30 areas selected <strong>by</strong> the field team, encompassing a total of 2 044 km 2 ,<br />
specific potential groundwater sites for the necessary ground investigations (field checking<br />
and geoelectric surveys) and subsequent drilling, coupled with the information on lithology,<br />
geomorphology and, when possible, on expected water quality for every site.<br />
1.3 Study area<br />
The study area covers entirely the three Iraqi Northern Governorates (Dohuk, Erbil and<br />
Sulaymaniyah) encompassing 40 627 km 2 (Fig. 1). The main features of the region are<br />
reported herein.<br />
Physiography<br />
Northern Iraq can be divided into three main physiographic zones, namely:<br />
1. The northern range of the Zagros Mountains<br />
2. The central range of the Border Folds<br />
3. The southern plains of the Tigris River<br />
The north-northeastern part is characterized <strong>by</strong> the Iraqi Zagros Mountain range with heights<br />
up to 3 600 m above sea level (a.s.l.). This range separates the three Governorates of Northern<br />
Iraq from Turkey to the north and from Iran to the northeast. In this area morphology is rather<br />
rough, with steep slopes and narrow valleys. Snow coverage is common at high altitudes and<br />
vegetation cover is widespread, constituted of both grasses and forests.<br />
A smoother morphology occurs in the central part; the area being characterized <strong>by</strong> an<br />
anticline/syncline system (the Border Folds, Boccaletti and Dainelli, 1982) which gives rise<br />
to a relief with a general orientation NW-SE. Heights up to 2000 m a.s.l. are reached. Wider<br />
valleys occur in this zone, which are strongly influenced <strong>by</strong> tectonic control. Vegetation is<br />
rather sparse, mainly herbaceous.
3<br />
The southwestern part is dominated <strong>by</strong> the low alluvial plains of the Tigris River and its<br />
tributaries. Average altitude is around 400 m a.s.l.<br />
Fig. 1. Study area<br />
Geology and hydrogeology<br />
Northern and north-eastern Iraq geologically are part of the extensive alpine mountain belt of<br />
the Near East. The Taurus-Zagros belt developed during the collision of the Afro-Arabian<br />
continent with the Eurasian continent (the latter including a number of microplates and island<br />
arcs) that culminated in the Miocene–Pliocene.<br />
The Taurus–Zagros belt includes two main zones: the folded zone (Border Folds, see above)<br />
and the thrust zone. The thrust zone forms the suture zone of the collided plates and occurs as<br />
a narrow strip in the extreme north, just outside the border between Iraq and Turkey, and in<br />
the northeast, along the border between Iraq and Iran. The folded zone is much wider (~200<br />
km) and can be subdivided according to the intensity of folding into two main parts: the<br />
imbricated folds zone, which consists of a relatively narrow zone of intensely faulted and<br />
thrusted large folds near the thrust zone border, and the simply folded zone, which is much<br />
wider and consists of smaller and less disrupted folds. The simple folds are further subdivided<br />
into two subzones: the high mountain zone, which consists of a series of relatively large<br />
mostly asymmetric anticlines separated <strong>by</strong> narrow synclines, and the foothill zone, which<br />
consists of a series of relatively small and narrow anticlines separated <strong>by</strong> wide synclines<br />
(Ameen, 1992).
4<br />
The Taurus-Zagros thrust zone mainly consists of the oldest formations, from Ordovician to<br />
Cretaceous, with occurrence of carbonatic and clastic rocks as well as igneous and<br />
metamorphics. In the folded zone Triassic to Pliocene units outcrop, mainly sedimentary<br />
rocks, with a predominance of limestones and dolomitic limestone. These formations are very<br />
significant, because of the intensive karst phenomena and the large volume of potential<br />
groundwater storage. Recent Quaternary deposits (alluvium, terrace, colluvium) fill the<br />
valleys and follow the main riverbed in the northern and central part, and cover the older<br />
Tertiary formations in the plains.<br />
Hydrology<br />
Significant surface water resources occur in the northern part of North Iraq. The major<br />
perennial rivers are the Tigris (which runs at or near the southwestern border), the Great<br />
Zab, the Small Zab (both in a NNE-SSW orientation) and the Diyala (at the southeastern<br />
border of the region). In the northern part of the study area the main tributaries are perennial,<br />
however the river runoff reduces towards the south. Ultimately, on the plains, all tributaries<br />
(wadis) are ephemeral and dry out regularly <strong>by</strong> the end of springtime. The main wadis in the<br />
south (Erbil area) are Wadi Kurdara and Shiwasor and Wadi Bastora. It is important to note<br />
that almost all the major rivers crossing the study area have their origin outside it, namely in<br />
Turkey (the Tigris and the Great Zab) or in Iran (the Small Zab and the Diyala), thus their<br />
entire watershed covers broad regions outside the study area. Only the Small Zab has a<br />
catchment area that extends, for a limited portion, beyond the Northern Iraqi border.<br />
The average discharge of the Great Zab at the Eskikelek gauge station registered over the<br />
period 1970-1973 was of 313 m 3 /s. Daily river flow varied from 118 m 3 /s to 2439 m 3 /s. Data<br />
from the Altun Kupri station on the Small Zab show an average discharge of 290 m 3 /s<br />
(period 1970-1972), with a minimum of 82 m 3 /s and maximum of 1 265 m 3 /s.<br />
Two dams control the Small Zab (Dokan Lake) and the Diyala River (Darbandikhan Dam) in<br />
the central part, and their main purpose is to generate hydropower. The construction of the<br />
large Bekhma Dam on the Great Zab was not completed. Water from the Dohuk Reservoir<br />
and from the numerous impoundments constructed on the smaller rivers is used for traditional<br />
irrigation schemes (gravity channels) or for water supply.<br />
Climate<br />
The whole of the study area is characterized <strong>by</strong> cold and snowy winters and warm dry<br />
summers. On the plains, typical semi-arid climatic conditions prevail. Precipitation occurs<br />
from October to May, decreasing from the NE to SW. The existing data at Sulaymaniyah<br />
meteorological station (in the middle of the territory) show an annual average precipitation of<br />
674 mm for the period 1941-1999. The total annual rainfall registered at this station in 1999<br />
was 338 mm. The mean annual rainfall in the Erbil plain for the period 1941-1970 was<br />
425 mm/year while observed yearly values range between 200 to 700 mm. Rainfall reduction<br />
has been observed recently: during the winter and springtime of 1998/99: the observed<br />
rainfall was three times lower than average. Comparison of data from all three Governorates<br />
for October 1999 to April 2000 shows a reduction of about 50 percent as compared to the<br />
mean rainfall for this period of the year.
5<br />
1.4 Data/software used<br />
The following data and softwares were used in the framework of this study:<br />
Satellite data<br />
Landsat Enhanced Thematic Mapper (ETM) data in digital format were preferred over other<br />
satellite data due to the availability of three near- to mid-infrared bands, extremely useful for<br />
terrain and lineaments analyses. Furthermore, as Landsat ETM provides eight co-registered<br />
spectral channels (one panchromatic with 15 m spatial resolution, six bands ranging from<br />
visible to mid-infrared with 30 m spatial resolution, and one thermal band with 60 m spatial<br />
resolution), this permitted a large spectrum of band combinations, useful in visual<br />
interpretation of different features.<br />
In view of the hydrogeological objectives of the study, Landsat ETM data were selected as<br />
acquired in the dry season, to evidentiate features (vegetation, soil moisture) related to the<br />
occurrence of water and to avoid overshadowing <strong>by</strong> too much vegetation.<br />
Six Landsat scenes fully covered the study area, but another four were also available, acquired<br />
in different months and/or years.<br />
The Landsat data used in the study are listed in Table 1.<br />
Table 1: Satellite data (Landsat 7) used in the study<br />
Topographic and thematic data<br />
Path Row Date of acquisition<br />
168 35 28/06/2000<br />
31/08/2000<br />
168 36 28/06/2000<br />
31/08/2000<br />
169 34 03/06/2000<br />
169 35 19/06/2000<br />
170 34 26/06/2000<br />
13/06/2001<br />
170 35 09/05/2000<br />
13/06/2001<br />
The Operational Navigation Chart (ONC), at scale 1:1 000 000, sheet G 4, edition 10, revised<br />
in 1974, available in paper format, was used for a general overview of the area.<br />
Initially the main problem was to locate topographic maps covering the whole area of the<br />
study, so as to have a uniform topographic coverage. The field team unfortunately had only<br />
topographic maps, at different scales and projections, covering scattered areas. Thus Russian<br />
topographic maps, at scale 1:100 000, series J-38 and I-38, in Gauss Kruger projection, were<br />
purchased. Maps were provided in raster tiff format <strong>by</strong> scanning the original sheets.
6<br />
Lithostratigraphic map, at scale 1:500 000, prepared <strong>by</strong> Salahaddin University (Erbil) and<br />
geological maps, scale 1:100 000 prepared <strong>by</strong> Gara Bureau (Erbil), Salahaddin University<br />
(Erbil) and Sulaimaniyah University (Sulaimaniyah), were provided <strong>by</strong> the Mapping Unit of<br />
the field staff, in paper and raster format. These maps, unfortunately, do not cover the whole<br />
study area.<br />
Vector data<br />
Boundaries of the country and of the three Northern Governorates were obtained in ArcView<br />
shapefile format from the official <strong>FAO</strong> GIS database. This data was provided in geographic<br />
coordinates (latitude, longitude) and WGS84 datum.<br />
GIS layers in Map Info vector format were provided <strong>by</strong> the field staff, concerning:<br />
- geology and tectonics for the whole study area at 1:500 000 scale and for seven smaller<br />
areas not covering the whole three Governorates at 1:100 000 scale;<br />
- springs and deep wells drilled <strong>by</strong> <strong>FAO</strong> all over the study area.<br />
Table data<br />
MS Excel worksheets containing data on springs, deep and shallow wells for only five areas<br />
in the three Governorates (Aqra, Arbat & Kourmal, Chamchamal, Sumail and Zakho) were<br />
provided <strong>by</strong> the field team.<br />
Softwares<br />
The following softwares were used:<br />
ENVI 3.5 (and later on 3.6) was used for georeferentiation and general image processing. The<br />
same software was used <strong>by</strong> the field team;<br />
ERDAS 8.4 for visual analysis and interpretation;<br />
ArcView 3.2 for GIS data acquisition, analysis and presentation. A freeware extension, named<br />
"Rose Tool" was used for creating rosette diagrams from lineaments data;<br />
Terranova ShArc 3.0 for vector data editing.
7<br />
CHAPTER 2<br />
METHODOLOGY<br />
The methodology used in this study follows the standard sequence of drainage, landforms,<br />
cover and lineaments analyses and the integration of their results for geological and<br />
hydrogeological assessment. This approach was used successfully for many years with both<br />
aerial photographs and satellite images for the above tasks. However, in this study several<br />
improvements and additions were made, namely:<br />
1. all data were in digital format and stored in a geo-database as GIS layers;<br />
2. all analyses and interpretations were performed directly from the computer screen;<br />
3. on the basis of a previous positive experience, thermal lineaments analysis was performed<br />
(see 2.6);<br />
4. a comprehensive geo-database was created including all GIS layers which were considered<br />
of interest for the study (see 2.7); for instance tabular data on wells and springs with their<br />
location, discharge and other pertinent information, vector data on geology; drainage and<br />
lineaments and raster data on satellite images;<br />
5. <strong>by</strong> using the potentiality of GIS software, which allows stacking of georeferenced data for<br />
comparison and integration and data query for subsetting the needed information, selected<br />
layers of the database were superimposed on the Landsat image kept as background and a<br />
logical series of observations was made, leading to a well-substantiated set of<br />
interpretation assumptions.<br />
The creation of a GIS database, including the data format and entry, is a time-consuming and<br />
laborious exercise, as high accuracy is definitely mandatory. The time required for its<br />
preparation is also related to the area under consideration. However, once the database is<br />
complete, interpretation of features leading to selection of promising sites for groundwater<br />
<strong>search</strong> is carried out easily and quickly. This as a result of data availability of all needed<br />
information in a GIS environment.<br />
2.1 Topographic maps georeferentiation<br />
Topographic coverage of the three Northern Governorates area is given <strong>by</strong> a series of 62 maps<br />
at 1:100 000 scale. (Fig. 2). These maps were provided as raster files (tiff format) scanned<br />
from the original paper version. They are of Russian origin with the following projection<br />
parameters:<br />
! Projection: Gauss-Kruger<br />
! Ellipsoid: Krassowski<br />
! Datum: Pulkovo 1942<br />
! Zone 8 (42°-48° East)<br />
! Units: meters
8<br />
Fig. 2. Topographic maps index<br />
In order to georeference these data in the projection used in the project (i.e. UTM – WGS 84),<br />
a coordinate conversion was carried out on the corners of the 62 maps. The conversion was<br />
performed using a module of ENVI 3.6 software (Map Coordinate Converter), in which each<br />
single couple of coordinates east and north were recalculated from one system to another. In<br />
this case, from Gauss Kruger – Pulkovo 42 to UTM – WGS 84. A table, listing the four<br />
corners coordinates (x and y, in meters) for each map was, thus, created. Two adjacent maps<br />
have the two coordinate couples in common, which guarantees a perfect matching at least at<br />
the corners.<br />
The table of coordinates mentioned above was also used to create a GIS layer representing the<br />
topographic maps index of the topographic coverage (Fig. 2). This layer was created with the<br />
GIS software TN-Sharc, with a command that generates regular grids, represented <strong>by</strong> lines<br />
and polygons, according to a specified distance on the x and y axes. In this case, the distance<br />
was given <strong>by</strong> the difference between the coordinates of map corners. The topographic maps<br />
index GIS layer has been then converted in shapefile format in order to be integrated in<br />
ArcView with the other layers of the database.<br />
The topographic maps index layer was essential each time it was necessary to know which<br />
topographic map covered a given area, such as in the georeferencing of Landsat images, in the<br />
digitizing of the stream network and in the interpretation of geologic features.<br />
A problem to be solved before starting the georeferentiation procedure was represented <strong>by</strong> the<br />
fact that the original raster files of topographic maps included both the map area and the<br />
accessory elements, such as title, legends, etc. Thus, a further step was to subset the map area<br />
with a cutting tool of a generic raster image manipulation software, in order to generate the<br />
files ready to be georeferenced.
9<br />
The georeferencing procedure was carried out using ENVI Registration Module, with the<br />
Ground Control Point (GCP) method. For each map file, the four corner coordinates have<br />
been entered as GCPs and a first order polynomial transformation was used to re-calculate the<br />
coordinates of each pixel in the raster layer. The Root Mean Square error (RMS) always<br />
resulted less than the pixel value.<br />
After resampling (the cubic convolution method was used in order to obtain a smooth<br />
appearance of the map), a new raster file (geotiff format), with a resolution of ten metres, was<br />
generated for each topographic map file, carrying the correct UTM –WGS 84 coordinates.<br />
An evaluation of the quality of georeferentiation was carried out <strong>by</strong> loading in ArcView both<br />
the topographic maps index layer and the georeferenced maps and checking for mismatching.<br />
Slight differences were found especially on the sides of the maps (around 20 m), probably<br />
related to deformations present in the original paper maps or errors occurring during the<br />
scanning procedure. These differences were judged insignificant for the further process of<br />
georeferentiation of Landsat imagery.<br />
Georeferenced topographic maps were used for: 1) Landsat images geocoding, 2) stream<br />
network acquisition (in support to satellite images) and 3) morphology interpretation in the<br />
phase of location of sites suitable for groundwater <strong>search</strong>. They were immediately sent to the<br />
field team, as they constituted the essential baseline information for any field work.<br />
.<br />
2.2 Satellite data georeferentiation<br />
Ten Landsat 7 ETM scenes were available for the study; their characteristics are reported in<br />
paragraph 1.4. Satellite data were made available <strong>by</strong> the distributor in a raw format, with<br />
system correction but without georeferentiation. This means that they were not oriented to any<br />
given coordinate system, thus they cannot be integrated with other geocoded GIS layers.<br />
The first operation to be carried out on satellite images is then to geocode them, using already<br />
geocoded data as a reference. Normally, the most common data used for this task are<br />
topographic maps.<br />
Operatively, each Landsat scene was firstly imported in ENVI 3.5 in order to be managed <strong>by</strong><br />
the software. Three different files were generated for each scene: one containing the<br />
panchromatic band, another the six multispectral bands and the third the thermal band,<br />
making a total of 30 image files. The procedure of georeferentiation (or geocoding) was then<br />
applied first to the ten multispectral images, which were the first to be used in the study. In a<br />
second phase, the thermal and panchromatic image files were georeferenced, using as a<br />
reference, the multispectral files.<br />
Since the process of georeferentiation was carried out as an image-to-image registration (i.e. a<br />
single image registered on another single image), and not with manually entered coordinates<br />
taken from hardcopy maps, a problem arose, as each Landsat scene covers an area far greater<br />
than the one covered <strong>by</strong> a single topographic map. Consequently, topographic maps had to be<br />
combined together in mosaics to cover the area of each Landsat scene. The following<br />
procedure was used to select the maps to mosaic: using ArcView, the topographic maps index<br />
layer previously produced (see para. 2.1) was overlaid on the Landsat scenes index layer (Fig.<br />
3), which is a vector shapefile created from the coordinates of the four corners of each of the<br />
six Landsat scenes (taken from the header file) representing with polygons the areas covered
10<br />
<strong>by</strong> the scenes. A spatial query was applied to retrieve all the topographic maps intersecting a<br />
given Landsat scene. By means of the ENVI tool Mosaicking, six topographic mosaics were<br />
then generated, which were used as reference in the georeferentiation process.<br />
Fig. 3. Landsat scenes index<br />
The procedure of image-to-image registration uses Ground Control Points (GCP)<br />
recognizable both on the satellite image and on the topographic maps in order to attribute<br />
ground coordinates (in a given coordinate system) to the first one. GCPs are located on the<br />
reference image, usually on features such as cross roads, river confluences, corners of fields.<br />
In the specific case, several limitations were found in the choice of GCPs: first of all the large<br />
time span existing between the topographic maps editing, dated between 1972 and 1982, and<br />
the Landsat imagery (2000-2001). Urban areas and roads had undergone a significant<br />
development in the last few years, making such features on the topographic maps almost<br />
always unrecognizable on the satellite image. However, as a whole the region still maintain a<br />
natural environment. Secondly, a certain amount of approximation was detected in the<br />
drawing of some topographic maps elements, especially roads and tracks, but also rivers,<br />
although the main differences were detected on alluvial plains where river courses could have<br />
changed over the last 20 years.<br />
For the above reasons, the choice of GCPs to be used fell in the majority of cases on river<br />
confluences in valleys cut in hard rocks or on roads crossing, that is only where a good match<br />
between topographic map and Landsat image features was evident.<br />
Moreover, the total number of GCPs identified for each scene was consequently low<br />
compared with the recommended minimum values of 10-20. A mean value of 10 GCPs was<br />
used for each Landsat scene, trying to choose the points homogeneously over the image. The<br />
RMS errors were always kept less than the pixel unit (0,4 to 0,6).<br />
The parameters of the coordinate system used for geocoding the Landsat scenes are:
11<br />
! Projection: UTM<br />
! Ellipsoid: International 1909<br />
! Datum: WGS84<br />
! Zone 38 (42°-48° East)<br />
! Units: meters<br />
For every scene, a second order polynomial transformation was applied which provided better<br />
results than the first order, while keeping distortions low enough. For the resampling step, the<br />
cubic convolution method was used, in order to obtain a highly readable image. This<br />
resampling technique modifies the pixel value permanently, thus it cannot be used when the<br />
real radiance values of pixels must be calculated. Since the use of Landsat data in this study<br />
was foreseen only for visual analysis, cubic convolution was considered the most appropriate<br />
method.<br />
As a result of georeferentiation, 30 new resampled images were generated, namely: ten<br />
geocoded multispectral scenes (six bands, 30 m spatial resolution), ten geocoded<br />
panchromatic scenes (one band, 15 m spatial resolution) and ten thermal scenes (one band, 60<br />
m spatial resolution).<br />
These images were converted also into other formats other than the ENVI format, such as<br />
ERDAS .img and geotiff, in order to be managed in ArcView and ERDAS Imagine.<br />
Once georeferenced, Landsat scenes are ready for any further elaboration and interpretation,<br />
and any GIS layer created in ArcView starting from these images automatically gets the<br />
georeferentiation from them.<br />
2.3 Drainage analysis/watershed identification<br />
Significance of drainage pattern<br />
The drainage system, which develops in an area, is strictly dependent on the slope, the nature<br />
and attitude of bedrock and on the regional and local fracture pattern. Drainage, which is<br />
easily visible on <strong>remote</strong> <strong>sensing</strong> imagery, therefore reflects to varying degrees the lithology<br />
and structure of a given area and can be of great value for groundwater resources evaluation.<br />
Drainage is studied according to its pattern type and its texture (or density of dissection)<br />
(Way, 1973). Whilst the first parameter is associated to the nature and structure of the<br />
substratum, the second is related to rock/soil permeability (and, thus, also to rock type).<br />
Actually, the less a rock is permeable, the less the infiltration of rainfall, which conversely<br />
tends to be concentrated in surface runoff. This gives origin to a well-developed and fine<br />
drainage system. On the other hand, in karst regions, where the underground circulation of<br />
water is much more developed than the surficial one, drainage is less developed or missing<br />
altogether.<br />
Six basic types of drainage patterns were identified, namely: 1) dendritic, 2) trellis, 3) parallel,<br />
4) radial, 5) anular and 6) rectangular. Their features and occurrence are as follows (Way,<br />
1973):<br />
1. In the dendritic pattern, a tree-like branching of tributaries join the mainstream at acute<br />
angles. Usually this pattern occurs in homogeneous rocks such as soft sedimentary or<br />
volcanic tuffs.
12<br />
2. Trellis is a modification of dendritic, with parallel tributaries converging at right angles.<br />
It is indicative of bedrock structure rather than material of bedrock. It can be associated to<br />
tilted or interbedded sedimentary rocks, where the main channels follow the strike of<br />
beds.<br />
3. In the parallel pattern, major tributaries are parallel to major streams and join them at<br />
approximately the same angle. It can occur in homogeneous, gentle and uniformly<br />
sloping surfaces whose main streams may indicate a fault or fracture zone. Common in<br />
pediment zones.<br />
4. The radial pattern is a circular network of approximately parallel channels flowing away<br />
from a central high point. It usually occurs in volcanoes or domelike structures<br />
characterized <strong>by</strong> resistant bedrock.<br />
5. Anular pattern is a concentric network of channels flowing down and around a central<br />
high point. This pattern is usually controlled <strong>by</strong> layered, jointed and fractured bedrock, in<br />
granitic or sedimentary domes.<br />
6. The rectangular is a modification of the dendritic pattern, with tributaries joining<br />
mainstream at right angles, forming rectangular shapes. It is controlled <strong>by</strong> bedrock<br />
jointing, foliation and fracturing, indicative of slate, schist, gneiss and resistant sandstone.<br />
Further modifications of the six basic schemes give origin to more than 20 other patterns that<br />
cover almost all the possible existing cases.<br />
In addition to the pattern characterization, drainage can also be described in terms of texture<br />
or density of dissection. On this basis, three types can be identified: 1) fine, which is<br />
indicative of high levels of runoff, suggesting impervious bedrock and/or fine textured soils<br />
scarcely permeable; 2) medium, which can be related to a medium runoff and mixed<br />
lithology, and 3) coarse, which indicates little runoff and consequently resistant, permeable<br />
bedrock and coarse, permeable soil materials.<br />
Digitalization of the drainage network and of the watersheds boundaries<br />
The GIS layers of the drainage network, lakes and watershed boundaries for the whole study<br />
area were digitized at the computer screen <strong>by</strong> analysing the Landsat images and the rasterized<br />
topographic maps. The digitalization of the drainage network was the most time-consuming<br />
since almost 60 000 stream segments were acquired. Nine catchments cover the three<br />
Governorates of Northern Iraq and four artificial reservoirs occur in this area.<br />
The digitizing procedure for the above-mentioned GIS layers was carried out using both<br />
ArcView GIS and Terranova SHarc. The first software provided the environment for data<br />
entry, while the second was used for the construction of the topology of the GIS layers that<br />
were created.<br />
Concerning watershed divides, the three Governorates of Northern Iraq are crossed or<br />
bounded <strong>by</strong> four main rivers: the Nahr Dijlah (the Tigris), the Nahr Az Zab Al Kabir (the<br />
Great Zab), the Nahr Az Zab As Saghir (the Small Zab) and the Nahr Diyala. Of those, only<br />
the Small Zab has a watershed which is almost completely contained inside the administrative<br />
boundaries of the three Governorates. The other three main rivers cross the study area<br />
originating from other countries such as Iran and Turkey. Thus, their basins are far greater<br />
than the area under analysis and the data available (<strong>remote</strong> <strong>sensing</strong> and topographic maps)<br />
were not sufficient to delineate the watershed boundaries for these rivers.
13<br />
For these reasons, only the Small Zab watershed was completely mapped, as it has only a<br />
small portion outside Iraq. Consequently, only the Small Zab watershed is suitable for further<br />
hydrologic studies, since it is the only one for which data are already available.<br />
The watershed boundaries were digitized as GIS layer, using both the Landsat images (mainly<br />
False Colour Composite 453) and the topographic maps as references. The acquisition of this<br />
GIS layer was carried out at a scale of 1:50 000. Further corrections and improvements of the<br />
preliminary version were carried out during the digitizing of the drainage network (Fig. 4).<br />
Fig. 4. Watersheds occurring in the study area<br />
For the mapping of the drainage network, separate shapefiles were produced for each main<br />
catchment area. This was mainly due to the fact that priorities on certain areas had to be<br />
respected. Starting from the main stream in the catchment, classified as first order channel,<br />
the tributaries up to the ninth order were digitized. Later on, the shapefiles related to each<br />
basin were merged in a single drainage network GIS layer.<br />
The digitalization of the drainage network was carried out <strong>by</strong> analysing as background<br />
reference the Landsat images at the visualization scale of 1:50 000. Band 5 was preferred<br />
among the other spectral channels, due to the fact that, as an infrared band, contrast of light<br />
and shadow is enhanced. False Colour Composites were also used, especially to detect<br />
drainage <strong>by</strong> means of riparian vegetation in low areas. FCC 453 or 456 were chosen.<br />
In order to optimise the digitizing procedure, Landsat whole scenes were also subset, to obtain<br />
smaller and easy to load and manage images. Subsets were usually tailored on groups of<br />
topographic maps according to the watershed under consideration. Contrast stretching
14<br />
techniques (linear and piecewise linear) were applied to these images to enhance the<br />
readability, giving good results. High pass filters (edge enhance) were tried, too, but without<br />
appreciable improvement of image characteristics.<br />
In all those cases where drainage was not clearly detectable from Landsat images, essentially<br />
in areas with almost flat morphology or on darker slopes, topographic maps were used as a<br />
reference to complement the information provided <strong>by</strong> the satellite images (Fig. 5).<br />
Fig. 5. Example of drainage network<br />
The digitizing of the coastline of lakes was performed <strong>by</strong> using the Landsat band 5 to take<br />
advantage of the absence of reflectance of water in the infrared wavelengths. Topographic<br />
maps were utilized only as reference to observe the high variability of coastline in time (from<br />
the 1970s to present). A certain variability was also observed between Landsat images of<br />
June 2000 and August 2001. Lake coastlines were thus acquired only from one date, namely<br />
June 2000.<br />
Drainage analysis<br />
The three physiographic regions ( see para 1.3) occurring in the study area largely influence<br />
the drainage network.<br />
In the Iraqi Zagros Mountain Range a generally dendritic pattern is usually observed. Locally,<br />
a control of stream segments <strong>by</strong> fractures and faults is clearly recognizable and the pattern can<br />
change to angulate. This is a variation of dendritic in which linear features have modified the
15<br />
original shape. Furthermore, in this area a frequent orientation of valleys in the alpine<br />
direction (NW-SE) can be detected.<br />
The Border Folds zone, characterized <strong>by</strong> an anticline/syncline system with a variable trend<br />
(from alpine in the centre-southeast to E-W in the northwest), greatly influences the drainage<br />
pattern. In general terms, this area is characterized <strong>by</strong> a trellis-like drainage, where the<br />
mainstream typically runs along syncline axes in topographic lows or inside an eroded<br />
anticline. Tributaries coming down from the slopes of fold flanks are short, frequently<br />
ephemeral and at right angles in respect to the mainstream. Frequent cases of antecedence<br />
were observed, where rivers cross an anticline in deep g<strong>org</strong>es. Locally, examples of captures<br />
also occur, which greatly contributed to making the stream network rather complicated (a<br />
contorted pattern can possibly be identified). In the Border Folds zone, plains of different<br />
size, located among the folded terrain, also occur. In those flat areas, the drainage pattern<br />
tends to be dendritic, with a predisposition to parallel. A strong control <strong>by</strong> linear features is<br />
also observed. Areas with absence of drainage have been observed as a rather common feature<br />
in this portion of the study area. Geological maps have confirmed the calcareous nature of<br />
bedrock in those zones, where, due to karst phenomena, underground water circulation is<br />
much more developed than surface runoff.<br />
As we move towards the southern borders of the three Governorates, flat alluvial areas<br />
become predominant. Here the drainage pattern is definitely dendritic and parallel, although<br />
some pinnate examples with long tributaries are still present in connection to folded areas.<br />
Tectonic control of river channels is noticeable, especially concerning the main tributaries of<br />
the Tigris, of the Small Zab and of the Diyala which have parts of their course clearly oriented<br />
along NE-SW (anti-alpine) fractures.<br />
2.4 Landforms analysis<br />
Landforms analysis was performed on the screen from Landsat 453 FCCs and band 5 images<br />
only for areas around each of the 30 test sites, as it was known since the onset, that detailed<br />
study for identification of groundwater promising sites would have to be carried out only for<br />
selected test sites and not for the whole area. It was thus unnecessary to have a comprehensive<br />
landforms GIS layer in the database,<br />
Detailed landforms analysis was therefore performed for areas around and including each test<br />
site, noting all terrain features of interest, such as anticlines, synclines, monoclines, erosion<br />
forms, dip and tickness of beds, etc., that is all features that were possibly influencing<br />
groundwater storage and transmission. Figure 6 shows the typical landforms occurring in the<br />
Border Folds physiographic region.
16<br />
Fig. 6. Typical anticline and syncline sequence of the Border Folds region<br />
Alluvial fans and pediments were, however, mapped for the whole study area and the relevant<br />
GIS layer was entered into the database, in view of locating potential sites for shallow wells<br />
drilling.<br />
2.5 Cover analysis<br />
Cover analysis was performed directly on the screen and consequently a GIS layer related to<br />
cover features was not included in the database.<br />
For hydrogeological studies the occurrence and types of natural vegetation and their spatial<br />
distribution may provide useful information. However, very little natural vegetation is present<br />
in the region, all hills and mountains of the study area being mainly covered <strong>by</strong> sparse<br />
grasses, dry in the period of Landsat data acquisition (June-August).<br />
Thus, attention was focused on patches, sometimes large, of green grasses, indicating the<br />
possible occurrence of springs. In several cases this assumption proved correct, either through<br />
ancillary data (spring layer) or <strong>by</strong> the particular location of the grass patches, for instance<br />
located along the contact between pervious and impervious rocks or on lineaments.<br />
Furthermore, areas of green grasses indicated increased soil moisture or the occurrence of<br />
water, providing further inputs in the selection of promising sites for groundwater <strong>search</strong>.
17<br />
2.6 Lineaments analysis<br />
With limited exceptions, geological formations, ranging from Trias to Miocene, outcropping<br />
in the study area, are essentially composed of limestone, dolomitic limestone, dolomite,<br />
marls, marly limestone and sandstone. Towards the borders of Iran and Turkey, igneous,<br />
metamorphic and sedimentary rocks outcrop, however no test site was selected <strong>by</strong> the field<br />
team in this area.<br />
Thus, the lithologies occurring in the region can be considered as "hard rocks" from a<br />
hydrogeological point of view.<br />
In this kind of rock, the amount of groundwater available is entirely dependent on the storage<br />
and rate of infiltration in the faults and fractures. This, in turn, depends on whether the<br />
fracture is open or tight. It can be said quite simply that a tight fracture contains no water<br />
while an open one may produce a considerable yield of groundwater. In most cases this can<br />
be related to tension or shear phenomena in the ruptural deformation of the rocks (Larsson,<br />
1977).<br />
Tensional faults, that is those parallel to the direction of the tectonic stress or orthogonal to<br />
the direction of crustal extension, may be believed open and somewhat wider than<br />
compressive/shear faults, which are orthogonal or inclined with respect to the direction of<br />
tectonic stress and consequently tend to be tighter. Thus, it should be much easier to<br />
recognize tensional faults in a satellite scene than shear faults and this should be reflected in<br />
the lineaments frequency histogram.<br />
It is well known that fracture traces and lineaments are important in rocks where secondary<br />
permeability and porosity dominate and where intergranular characteristics combine with<br />
secondary openings influencing weathering and groundwater movement. Latthman and<br />
Parizek (1964) established the important relationship between the occurrence of groundwater<br />
and fracture traces for carbonate aquifers and, in particular, that fracture traces are underlain<br />
<strong>by</strong> zones of localized weathering and increased permeability and porosity. Fracture traces and<br />
lineaments are likely to be areas of secondary permeability and porosity development in<br />
carbonate rocks. The fracture zones form an interlaced network of high transmissivity and<br />
serve as local groundwater conduits from massive rocks in interfracture areas. Thus, as<br />
fracturing greatly increases the solution of limestone and dolomite, creating preferential<br />
avenues for groundwater movement, there is not a real need, in theory, to discriminate among<br />
lineaments; the basis for the selection, in a carbonate area, of a suitable place for groundwater<br />
development, including the necessary field investigations, is the occurrence of a well-defined<br />
lineament along which topographic lows should be selected, according to accessibility and<br />
local water needs.The importance of a comprehensive lineament analysis in a groundwater<br />
<strong>search</strong> is thus evident.<br />
The digitalization of lineaments was carried out through visual analysis at the screen of<br />
Landsat band 5 and of enhanced images. Special elaborations, such as filters (high pass, edge<br />
detect and directional) were applied to scenes to extract more information. Ronchi Gratings<br />
were also used as an aid to lineaments identification.<br />
As for drainage, lineaments were firstly digitized for each separate watershed and then<br />
merged together. Moreover, the linear features were classified as regional and local, based on<br />
their relevance (Fig. 7 ). Regional lineaments represent fractures or faults crossing a large part
18<br />
of the study area, affecting a deeper portion of the bedrock, and thus can play an important<br />
role in groundwater storage and transmission. Local lineaments cross a limited area but may<br />
be of interest when they represent a tensional fracture or in karst areas.<br />
Fig. 7. Regional and local lineaments<br />
Following the positive experience gained in the Syrian Arab Republic (Travaglia and Ammar,<br />
1998) and as the Landsat scenes were all acquired during the dry season, the mapping of<br />
thermal lineaments was performed.<br />
The rationale for this is that good<br />
amounts of water percolating into<br />
fractures should affect, <strong>by</strong> capillarity,<br />
the moisture content of the soil above,<br />
making it cooler than the<br />
surroundings. Therefore, through<br />
simple digital enhancements of<br />
Landsat band 6 (60 m spatial<br />
resolution, resampled at 28.5 m for<br />
correlation with the other bands) it<br />
was possible to map linear thermal<br />
anomalies corresponding to areas<br />
slightly cooler than the surroundings.<br />
A critical review of the results<br />
allowed for the removal of creeks,<br />
rivers and irrigation canals with<br />
Fig. 8. Thermal and other lineaments
19<br />
flowing water. The remaining thermal lineaments often coincided with lineaments mapped<br />
previously. When this happened, the occurrence of a thermal anomaly provided further<br />
reasons to select the lineament for field investigations (Fig. 8).<br />
As a result of the lineament analysis, three GIS layers were included in the database, namely<br />
regional, local and thermal lineaments.<br />
In hard rock hydrogeology, the most important lineaments are those indicating tensional<br />
fractures, although in karst terrain all fractures may favour weathering and solution of the<br />
carbonate rocks. In this case the most promising lineaments are those having the same<br />
direction of the slope.<br />
Rosette diagrams, performed through "Rose Tool", indicated, for almost the whole region, a<br />
clear N35E trend. Only in the northern part of the region, in the vicinity of the town of<br />
Atrush, there is a clear shift to an almost N-S trend (Fig. 9).<br />
Fig. 9. Rosette diagrams<br />
As a suite of textbook-like anticlines and synclines occur in the region, easily recognized in<br />
the Landsat scenes, the identification of the tensional trend is immediate. Actually, tensional<br />
fractures are parallel to the direction of the tectonic stress, that is orthogonal to the axis of the<br />
folds. A quick verification of the above provides a N35E tensional trend, confirming the<br />
rosette diagram results.<br />
In the northern part of the region, the folds have an almost E-W axis, due to some rotation of<br />
the tectonic stress. There the tensional trend is N-S, but regional lineaments with the N35E
20<br />
direction should also be regarded as tensional. In that area tensional fractures are probably<br />
related to two different episodes of tectonic stress or result from the combination of two<br />
simultaneous stresses.<br />
2.7 Database preparation<br />
For the purpose of this study, a geographical database (or geo-database) was created, made up<br />
of several information layers in raster (Landsat images, topographic maps) and in vector<br />
format. The creation and management of all the data was carried out using ENVI 3.6, ERDAS<br />
IMAGINE 8.4, ArcView 3.2 and TNSharc 3.0. All layers in the database were projected into<br />
the UTM-WGS84 system in order to be overlaid without problems.<br />
The information layers that constitute the geo-database belong to three different categories: 1)<br />
reference data, 2) derived data and 3) external data.<br />
Reference data are all that information used as background and reference for the creation of<br />
new layers on the basis of visual analysis. Examples are the Landsat images and the<br />
topographic maps. It must be stressed that, regarding the former, the geo-database does not<br />
include only the ten Landsat scenes, with panchromatic, multispectral and thermal bands, but<br />
also numerous subset images created for various purposes, in order to keep image dimensions<br />
low for a better management. In particular, 17 subsets were created (including multispectral<br />
and thermal bands), covering the whole study area, to digitalize both the drainage network<br />
and the lineaments, while another six sub-scenes (including panchromatic, multispectral and<br />
thermal bands) were clipped for examining in detail the thirty priority areas.<br />
With regards to the topographic maps, 62 georeferenced maps were entered into the database,<br />
plus a series of six topographic mosaics produced <strong>by</strong> joining groups of maps for the purpose<br />
of georeferencing the Landsat scenes.<br />
Derived data constitute all the newly created information on the basis of reference and other<br />
data, mainly <strong>by</strong> means of visual interpretation, but also through different elaborations. If all<br />
the temporary layers are excluded, a total of almost 60 new GIS layers were created.<br />
Most of these layers were digitized on the computer screen from visual interpretation of<br />
Landsat images and topographic maps at 1:50 000 scale, namely the drainage network, the<br />
lakes, the watershed boundaries, the lineaments (both normal and thermal), the pediments and<br />
alluvial fans. For these GIS layers an unique shapefile covering the whole study area was<br />
produced plus separate files for each watershed in order to fulfil the project needs. Other<br />
layers, such as the topographic maps and Landsat scenes indexes, were created on the basis of<br />
coordinates taken from the images headers and other tables.<br />
External data was provided both <strong>by</strong> <strong>FAO</strong> geo-database and <strong>by</strong> the <strong>FAO</strong> Field Team in Iraq.<br />
From the first source, the officially recognized borders of the three Governorates of Northern<br />
Iraq were supplied in vector shapefile format. This information layer was used as a reference<br />
for determining the borders of the study area: in fact, whenever the watershed boundaries of<br />
the main rivers extended far outside the three Governorate areas, they were traced coincident<br />
with the administrative boundaries. The only problem related with this layer is that its original<br />
scale of acquisition is smaller than 1:50 000. This is fairly clear from the high approximation<br />
of the boundary in respect to morphologic features such as mountain crests or rivers. Since<br />
this problem could not be solved (no other source of administrative boundaries at a greater<br />
scale was available), the GIS layer was left as it was.
21<br />
Data from the <strong>FAO</strong> Field Team was provided in vector and tabular format. Among the vector<br />
information layers, all in MapInfo format, which were firstly converted into shapefile, only<br />
those pertaining to geology, tectonics and springs/wells were used in the database. Six<br />
information layers concerning lithostratigraphy of discontinuous areas in Northern Iraq were<br />
received. These six coverages, acquired from data at 1:100 000 scale, cover only a limited<br />
part of the whole study area. Other six layers concerning tectonics (faults, fractures and folds)<br />
for the same areas have been coupled to the lithostratigraphy to have a general geological<br />
framework of these zones. Moreover, a layer on lithostratigraphy of the whole three<br />
Governorates was available, taken from a 1:250 000 source, thus less accurate than the<br />
previous. Finally, two more coverages with information on springs and deep wells drilled <strong>by</strong><br />
<strong>FAO</strong> for the whole study area were provided.<br />
Tabular data, in Excel format, were the source of other information on wells and springs, but<br />
in this case for limited areas. Five zones (Aqra, Arbat/Kourmal, Chamchamal, Sumail and<br />
Zakho) were covered. For each of the above zones, tables showing information on small<br />
rivers and wadi, deep wells, shallow wells and springs were made available. Each table had a<br />
couple of fields containing the X and Y UTM-WGS84 coordinates and a great number of<br />
other data. Among them, the discharge for springs and wells was particularly important for<br />
the purpose of our study. Thanks to the coordinate fields, these Excel tables were converted to<br />
a point GIS layer and integrated with the other coverages in our possession.<br />
The purpose of this data (geology, springs and wells) was to provide a reference in the<br />
interpretation for the investigation of promising sites for groundwater in the 30 priority areas.<br />
Lithostratigraphy and tectonics, placed on top of Landsat images were used to obtain an<br />
interpretation key of satellite data to locate those geologic formations most suitable for<br />
groundwater storing (e.g. limestones with karst phenomena). Springs and wells, compared<br />
with lineaments, both normal and thermal, could give precious indications on which fractures<br />
allow the higher circulation of water. Unfortunately, a part of the provided data could not be<br />
used properly, mainly due to a lack of accuracy. Stratigraphic data acquired from 1:250 000<br />
scale source was too approximate for our working scale (1:50 000) and when superimposed to<br />
Landsat images, this evident inaccuracy made this layer almost useless. Geological data from<br />
1:100 000 scale source showed a better precision, although for limited areas. For this reason,<br />
these layers were used only for a small number of the priority areas. Regarding springs and<br />
wells, three different kind of problems were encountered. One problem was lack of<br />
information: the data provided did not cover in detail the whole study area. Another was about<br />
springs discharge values, which in some cases appeared to be too high to be credible (around<br />
38 000 l/s). The last was the positioning of wells and springs. A considerable number of<br />
points showed coordinates far outside the study area, possibly due to typing or some other<br />
data entry mistakes, or GPS reading errors. This uncertainty on data reliability greatly<br />
influenced the utility of these GIS layers in the investigation. Their necessary limited usage<br />
was always subject to critical evaluation.<br />
The availability of other data sets could have helped in the investigation carried out for the<br />
location of promising sites for groundwater, however, they were not immediately available. A<br />
digital elevation model (DEM) could have provided useful information on morphology and<br />
surface water routes. Coupled with meteorological data (also lacking), it could have been used<br />
for water balance estimations. A DEM with a ground resolution compatible with the study<br />
scale (30 m) could have been generated from height information taken from topographic<br />
maps. Another missing useful GIS layer was an updated road network. This could have given<br />
information on where to plan ground investigations for the validation of <strong>remote</strong> <strong>sensing</strong>-based
22<br />
interpretation. An updated road network could have been acquired <strong>by</strong> Landsat images, using<br />
the panchromatic band. Finally, a land cover GIS layer could have shown those areas where<br />
water is needed (e.g. arable land). Landsat images can easily provide a valid background for<br />
land cover classification. Time constraints did not allow for their preparation.<br />
2.8 Interpretation<br />
The field team of WRISS/GWU selected 30 test areas (Fig. 10) according to local<br />
requirements and subdivided them into three classes of first, second and third priority (ten test<br />
areas for each class), thus interpretation was performed according to this order of priority.<br />
Fig. 10. Location of test sites<br />
Taking advantage of the large spectrum of information available in the database, the<br />
following procedure was used to identify the best sites for further field investigation.The<br />
Landsat FCC 453 subscene encompassing the test area to be investigated was firstly displayed<br />
at 1:100 000 scale to have an overview of the area from a geological point of view.<br />
Landforms, dip and tickness of beds, erosion features, limits of formations were carefully<br />
noted and lithologies were inferred (the authors are both geologists). Only then the geological<br />
layer was overlaid. Often the formation limits of the geological map did not match the same<br />
kind of boundaries clearly visible on the satellite image, however this layer was used to<br />
extract information on the lithologies occurring in the different formations and<br />
complement/confirm the geological interpretation assumptions already made.The overlaying<br />
of the drainage layer on the Landsat FCC, kept as background, with its types and density of<br />
dissection, then provided precious information on the bedrock and its permeability, karst<br />
areas, erosion features and soil permeability in the plains. During this part of the interpretation<br />
exercise, the Landsat image was often displayed at 1:50 000 scale to observe some features in
23<br />
detail. Band 5 was also used to evaluate terrain morphology. On the Landsat FCC, from this<br />
point onward at 1:50 000 scale, the green patches of grasses were noted, indicating either<br />
springs or humid zones. At this point the regional and local lineament layers were overlaid.<br />
Tensional lineaments, preferably regional, were considered first and then their crossing with<br />
other lineaments. The overlaying of the thermal lineament layer provided further important<br />
inputs for the selection of a site. Actually, if a thermal lineament coincided with a regional or<br />
local lineament, then there were good reasons to infer the occurrence of water into that<br />
fracture.<br />
Layers of springs and wells were then overlaid. Although not fully trustworthy, as indicated in<br />
the previous paragraph, these layers provided further inputs in the site selection process.<br />
Actually, the occurrence of wells producing above average or of springs with considerable<br />
discharge located on a lineament, provided further positive proof for the selection of an<br />
adequate site on that fracture. Similarly, the presence of springs at the boundary between<br />
pervious and impervious rocks, the former having a recharge area at higher elevation,<br />
suggested potential drilling sites for confined aquifer. Once selected on the basis of the above<br />
considerations, the site was indicated on the map for ground assessment <strong>by</strong> the field team.<br />
2.9 Field checking<br />
By applying the interpretation procedure indicated in the previous paragraph to the 30 test<br />
areas selected <strong>by</strong> the field team of WRISS/GWU, 198 promising sites for groundwater<br />
assessment were identified.<br />
During the interpretation exercise many more potential sites were also identified thanks to the<br />
availability, through the database, of a complete range of information. However, only 198<br />
sites for further field investigation<br />
were reported on the 30 maps<br />
provided to the field team, and that for<br />
three reasons, namely:<br />
1. they were classed as the best sites to<br />
field check;<br />
2. the field check will take months to<br />
be completed, thus it was unnecessary<br />
to provide second choice sites to<br />
inspect;<br />
3. it was always possible to consult<br />
the database to locate other sites if the<br />
field team so requested.<br />
In some cases, sites in the close<br />
vicinity, but outside the test area<br />
indicated, were selected, as they were<br />
ranked as much more promising than<br />
other sites inside.<br />
All maps (see Chapter 3) were<br />
prepared at scale 1:50.000, georeferenced<br />
to UTM WGS84, with a<br />
Landsat FCC 453 as background and<br />
drainage and lineaments layers<br />
overlaid.<br />
Fig. 11. Correct positioning of rig<br />
The following field procedure was
24<br />
suggested to the field teams:<br />
- identification on the ground of a site indicated on the map through GPS;<br />
- identification of lineament or crossing of lineaments on the ground through its/their terrain<br />
features;<br />
- selection of a topographic low along the tensional lineament and in the vicinity of the site<br />
indicated;<br />
- carring out of a geoelectric survey orthogonal to the lineament (best if tensional) trace to<br />
ascertain wideness and dip of the fracture zone and occurrence and depth of groundwater.<br />
Vertical electric sounding according to the Schlumberger method (four electrodes laid out<br />
using the Schlumberger configuration) was the recommended procedure;<br />
- according to the results of the geo-resistivity survey, if positive, placing of the well rig in the<br />
appropriate site.<br />
Figure 11 indicates a possible scenario.