Accepted Manuscript - TARA
Accepted Manuscript - TARA
Accepted Manuscript - TARA
Create successful ePaper yourself
Turn your PDF publications into a flip-book with our unique Google optimized e-Paper software.
191<br />
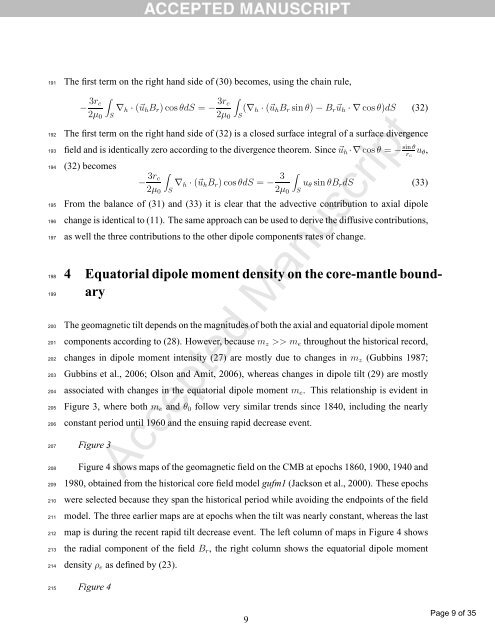
The first term on the right hand side of (30) becomes, using the chain rule,<br />
192<br />
193<br />
194<br />
195<br />
196<br />
197<br />
198<br />
199<br />
200<br />
201<br />
202<br />
203<br />
204<br />
205<br />
206<br />
207<br />
208<br />
209<br />
210<br />
211<br />
212<br />
213<br />
214<br />
− 3r c<br />
∇ h · (⃗u h B r ) cosθdS = −<br />
2µ 0<br />
∫S<br />
3r c<br />
(∇ h · (⃗u h B r sin θ) − B r ⃗u h · ∇ cosθ)dS (32)<br />
2µ 0<br />
∫S<br />
The first term on the right hand side of (32) is a closed surface integral of a surface divergence<br />
field and is identically zero according to the divergence theorem. Since ⃗u h ·∇ cosθ = − sin θ<br />
r c<br />
u θ ,<br />
(32) becomes<br />
− 3r c<br />
∇ h · (⃗u h B r ) cosθdS = − 3 u θ sin θB r dS (33)<br />
2µ 0<br />
∫S<br />
2µ 0<br />
∫S<br />
From the balance of (31) and (33) it is clear that the advective contribution to axial dipole<br />
change is identical to (11). The same approach can be used to derive the diffusive contributions,<br />
as well the three contributions to the other dipole components rates of change.<br />
4 Equatorial dipole moment density on the core-mantle boundary<br />
The geomagnetic tilt depends on the magnitudes of both the axial and equatorial dipole moment<br />
components according to (28). However, because m z >> m e throughout the historical record,<br />
changes in dipole moment intensity (27) are mostly due to changes in m z (Gubbins 1987;<br />
Gubbins et al., 2006; Olson and Amit, 2006), whereas changes in dipole tilt (29) are mostly<br />
associated with changes in the equatorial dipole moment m e . This relationship is evident in<br />
Figure 3, where both m e and θ 0 follow very similar trends since 1840, including the nearly<br />
constant period until 1960 and the ensuing rapid decrease event.<br />
Figure 3<br />
<strong>Accepted</strong> <strong>Manuscript</strong><br />
Figure 4 shows maps of the geomagnetic field on the CMB at epochs 1860, 1900, 1940 and<br />
1980, obtained from the historical core field model gufm1 (Jackson et al., 2000). These epochs<br />
were selected because they span the historical period while avoiding the endpoints of the field<br />
model. The three earlier maps are at epochs when the tilt was nearly constant, whereas the last<br />
map is during the recent rapid tilt decrease event. The left column of maps in Figure 4 shows<br />
the radial component of the field B r , the right column shows the equatorial dipole moment<br />
density ρ e as defined by (23).<br />
215<br />
Figure 4<br />
9<br />
Page 9 of 35


