Social and Mental Health - Tarrant County
Social and Mental Health - Tarrant County
Social and Mental Health - Tarrant County

Create successful ePaper yourself
Turn your PDF publications into a flip-book with our unique Google optimized e-Paper software.
<strong>Tarrant</strong> <strong>County</strong> Community <strong>Health</strong> Report 2003<br />
Domain VI. <strong>Social</strong> & <strong>Mental</strong> <strong>Health</strong><br />
<strong>Social</strong> <strong>and</strong> <strong>Mental</strong> <strong>Health</strong> - Definitions <strong>and</strong> Data Sources<br />
Suicide Rate<br />
o Numerator - Number of deaths due to suicide: ICD-10 codes X60 - X84, Y87.0<br />
o Denominator - Census 2000 <strong>and</strong> 2001 population estimates<br />
o Rates - per 100,000 (not age adjusted)<br />
o Source - TDH Bureau of Vital Statistics<br />
<strong>Mental</strong> <strong>Health</strong><br />
o<br />
o<br />
o<br />
Number of clients who received mental health services from <strong>Mental</strong> <strong>Health</strong> <strong>and</strong> <strong>Mental</strong><br />
Retardation (MHMR) of <strong>Tarrant</strong> <strong>County</strong><br />
Source – MHMR of <strong>Tarrant</strong> <strong>County</strong><br />
More Information - http://www.mhmrtc.org/<br />
Substance Abuse<br />
‣ Substance abuse–related death rate<br />
o Numerator - Total alcohol <strong>and</strong> drug-related deaths<br />
o Denominator - Census 2000 <strong>and</strong> 2001 population estimates<br />
o Rates - per 100,000 (not age adjusted)<br />
o Data Source - Texas Commission on Alcohol <strong>and</strong> Drug Abuse (TCADA)<br />
o More Information - http://www.tcada.state.tx.us/<br />
‣ Substance use <strong>and</strong> abuse<br />
o<br />
o<br />
o<br />
Substance use <strong>and</strong> abuse in secondary school students<br />
Data Source – Challenge Inc., TCADA<br />
More Information - http://www.tcchallenge.org/;http://www.tcada.state.tx.us/<br />
‣ Access to substance abuse treatment<br />
o<br />
o<br />
o<br />
Number of clients who received treatment for substance abuse from TCADA<br />
Data Source –TCADA<br />
More Information - http://www.tcada.state.tx.us/<br />
Child Abuse Rate<br />
o Numerator - Number of confirmed cases of child abuse <strong>and</strong> neglect<br />
o Denominator - Census 2000 <strong>and</strong> 2001 population estimates of children 17 years <strong>and</strong> younger<br />
o Rate - per 1,000<br />
o Data Source - Texas Department of Protective <strong>and</strong> Regulatory Services<br />
o More Information - http://www.tdprs.state.tx.us/<br />
Monitoring & Assessment Project 129
<strong>Tarrant</strong> <strong>County</strong> Community <strong>Health</strong> Report 2003<br />
Domain VI. <strong>Social</strong> & <strong>Mental</strong> <strong>Health</strong><br />
<strong>Social</strong> <strong>and</strong> <strong>Mental</strong> <strong>Health</strong> - Definitions <strong>and</strong> Data Sources<br />
Crime Arrest Rate<br />
o Numerator - Number of arrests<br />
o Denominator - Census 2000 <strong>and</strong> 2001 population estimates<br />
o Rates - per 1,000<br />
o Data Source – Texas Department of Public Safety<br />
o More Information - http://www.txdps.state.tx.us/crimereports/<br />
Divorce Rate<br />
o Numerator - Number of divorces<br />
o Denominator - Census 2000 <strong>and</strong> 2001 population estimates<br />
o Rates - per 1,000<br />
o Data Source - TDH Bureau of Vital Statistics<br />
Monitoring & Assessment Project 130
<strong>Tarrant</strong> <strong>County</strong> Community <strong>Health</strong> Report 2003<br />
Domain VI. <strong>Social</strong> & <strong>Mental</strong> <strong>Health</strong><br />
Indicator VI-1.<br />
Suicide<br />
Suicide is a major indicator of mental<br />
health in individuals <strong>and</strong> the<br />
community. Suicide is the 9 th leading<br />
cause of death among adults 25 <strong>and</strong><br />
older <strong>and</strong> the 3 rd leading cause of<br />
death among age 24 <strong>and</strong> younger in<br />
<strong>Tarrant</strong> <strong>County</strong> (1) .<br />
Overall, 278 suicides were reported in<br />
<strong>Tarrant</strong> <strong>County</strong> during the years 2000<br />
<strong>and</strong> 2001 (Table 1). The suicide rate<br />
in <strong>Tarrant</strong> <strong>County</strong> in 2001 was<br />
comparable to that of the previous<br />
year.<br />
The overall incidence rate of suicide<br />
in males is more than four times that<br />
of females in both years (Table 1).<br />
The incidence rate of suicide in<br />
Whites is more than twice that of<br />
Blacks or Hispanics (Table 2), <strong>and</strong><br />
about 15 percent of suicide deaths<br />
were among 21 <strong>and</strong> under (Table 3).<br />
Firearms were the primary mode for<br />
committing suicide followed by<br />
hanging (Table 4).<br />
Table 1: <strong>Tarrant</strong> <strong>County</strong> Suicide by Gender<br />
2000 2001<br />
Case Rate Case Rate<br />
Male 115 17.3 114 16.6<br />
Female 20 2.8 29 4.0<br />
*Total 135 9.6 143 10.0<br />
Rates per 100,000 population<br />
p>0.05<br />
Table 2: <strong>Tarrant</strong> <strong>County</strong> Suicide by Race/Ethnicity<br />
2000 2001<br />
Case Rate Case Rate<br />
White 109 11.9 116 12.4<br />
Black 10 5.3 9 4.6<br />
Hispanic 13 4.6 11 3.6<br />
Other < 5 @.@ 7 10.1<br />
Rates per 100,000 population<br />
@.@ numerator too small for rate calculation<br />
Table 3: <strong>Tarrant</strong> <strong>County</strong> Suicide by Age Group<br />
2000 2001<br />
Case Rate Case Rate*<br />
10-17 8 4.5 6 3.4<br />
18-21 15 18.4 12 14.7<br />
22-24 11 17.6 9 14.4<br />
25-34 25 10.6 26 11.0<br />
35-44 26 10.5 31 12.4<br />
45-54 26 14.0 30 16.1<br />
55-64 10 9.5 15 14.3<br />
65 + 14 11.6 14 11.6<br />
Rates per 100,000 population<br />
* 2001 rates were calculated by using 2000 population<br />
Table 4: <strong>Tarrant</strong> <strong>County</strong> Suicide by Modes of Death<br />
2000 2001<br />
Case Percent Case Percent<br />
Drugs 10 7.4 % 12 8.4 %<br />
Gases 8 5.9 % 6 4.2 %<br />
Firearms 72 53.5 % 97 67.8 %<br />
Hanging 35 25.9 % 24 16.8 %<br />
Self-poisoning by other than drugs 8 5.9 % 3 2.1 %<br />
Other 2 1.5% 1 0.7 %<br />
Data Source: TDH Bureau of Vital Statistics<br />
Monitoring & Assessment Project 131
<strong>Tarrant</strong> <strong>County</strong> Community <strong>Health</strong> Report 2003<br />
Domain VI. <strong>Social</strong> & <strong>Mental</strong> <strong>Health</strong><br />
Geographical Distribution of Suicide<br />
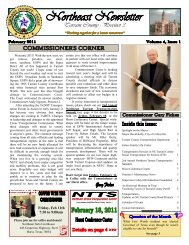
Fig 1: <strong>Tarrant</strong> <strong>County</strong> Suicide Rates, 2000<br />
There is no consistent pattern or<br />
clustering shown in the ZIP Code<br />
distribution of suicide cases for both<br />
years. ZIP Codes 76114, 76053 <strong>and</strong><br />
76034 had the highest suicide rates in<br />
2000, while 76052 <strong>and</strong> 76018 had the<br />
highest rates in 2001.<br />
Although the overall incidence rate<br />
remained stable, the cases in 2000<br />
were distributed more evenly<br />
throughout the county; consequently,<br />
the rates in each quartile were lower<br />
in 2000 compared to 2001 (see<br />
legend below).<br />
Fig 2: <strong>Tarrant</strong> <strong>County</strong> Suicide Rates, 2001<br />
Legend<br />
Crude Rate (per 100,000)<br />
2000 2001<br />
Highest Quartile > 18.45 > 25.73<br />
2 nd Quartile 12.31 – 18.45 17.16 – 25.73<br />
3 rd Quartile 6.16 – 12.30 8.58 – 17.15<br />
Lowest Quartile < 6.16 < 8.58<br />
No Case or no Data<br />
These rates are not age-adjusted<br />
Monitoring & Assessment Project 132
<strong>Tarrant</strong> <strong>County</strong> Community <strong>Health</strong> Report 2003<br />
Domain VI. <strong>Social</strong> & <strong>Mental</strong> <strong>Health</strong><br />
Comparison with Texas <strong>and</strong> United States<br />
In the year 2000 <strong>and</strong> 2001, the overall incidence rates of suicide in <strong>Tarrant</strong> <strong>County</strong> were<br />
marginally lower than those of Texas <strong>and</strong> the nation. The differences were not significant.<br />
Table 5: Suicide per 100,000 population<br />
<strong>Tarrant</strong> Texas U.S.<br />
2000 9.6 10.4 10.7<br />
2001 10.0 10.9 10.3<br />
Data Source: TDH Bureau of Vital Statistics, CDC National Statistics Report<br />
p>0.05<br />
Comparison with <strong>Health</strong> People 2010 Objective<br />
Table 6: <strong>Mental</strong> <strong>Health</strong> <strong>and</strong> <strong>Mental</strong> Illness<br />
<strong>Tarrant</strong> <strong>County</strong><br />
18-1. Reduce suicide rate to 5 per 100,000 population.<br />
(Baseline: 11.3 per 100,000 in 1998 -- age adjusted to year<br />
2000 st<strong>and</strong>ard population)<br />
• Current Status:<br />
<br />
9.6 per 100,000<br />
<br />
10.0 per 100,000<br />
Data Source: TDH Bureau of Vital Statistics<br />
As of 2001, the overall suicide rate did not meet the <strong>Health</strong>y People 2010 objective. There is a<br />
need for continuing efforts in <strong>Tarrant</strong> <strong>County</strong> to reduce the suicide rate, in part by assuring<br />
mental health services.<br />
Monitoring & Assessment Project 133
<strong>Tarrant</strong> <strong>County</strong> Community <strong>Health</strong> Report 2003<br />
Domain VI. <strong>Social</strong> & <strong>Mental</strong> <strong>Health</strong><br />
Indicator VI-2.<br />
<strong>Mental</strong> Illness<br />
<strong>Mental</strong> health is not only the absence of mental illness but a state of successful mental functioning,<br />
resulting in productive activities, fulfilling relationships <strong>and</strong> the ability to adapt to change <strong>and</strong> cope<br />
with adversity. <strong>Mental</strong> health is indispensable to personal well-being, family <strong>and</strong> interpersonal<br />
relationships, <strong>and</strong> one’s contribution to society. 1<br />
According to the CDC, approximately 20 percent of the United States population is affected by<br />
mental illness. Of all mental illnesses, depression is the most common disorder. More than 19<br />
million adults in the United States suffer from depression, <strong>and</strong> major depression is the leading<br />
cause of disability <strong>and</strong> is the cause of more than two-thirds of suicides each year. Only about 20<br />
percent of adults diagnosed with depression actually receive treatment.<br />
The magnitude of mental illness in <strong>Tarrant</strong> <strong>County</strong> is not known because there is no<br />
comprehensive surveillance system for mental illness. Currently, mental illness is not a reportable<br />
disease, therefore clients who receive treatment from private mental health practitioners are hard to<br />
capture.<br />
The data presented in this report is for clients served by mental health services of <strong>Mental</strong> <strong>Health</strong><br />
<strong>and</strong> <strong>Mental</strong> Retardation (MHMR) of <strong>Tarrant</strong> <strong>County</strong>. MHMR receives referrals from psychiatrists<br />
<strong>and</strong> other health practitioners in <strong>Tarrant</strong> <strong>County</strong>. A total of 13,698 county residents received<br />
treatment for mental illness during the year 2000, <strong>and</strong> 14,071 in 2001(Table 7). This translates to<br />
9.5 per 1,000 residents receiving treatment for mental illness in <strong>Tarrant</strong> <strong>County</strong> for both years.<br />
Slightly less than 10 percent of MHMR clientele were children <strong>and</strong> adolescents (Table 7). Among<br />
adult clients receiving treatment, there was no noticeable difference between genders; however, a<br />
higher number of male than female children <strong>and</strong> adolescents received treatment for mental illness<br />
at MHMR in both years (Table 7). Among different racial/ethnic groups, Whites accounted for the<br />
highest percentage of those receiving mental health services (Table 8). The majority (70 percent)<br />
of MHMR clients resided in the City of Fort Worth (Table 9).<br />
1. http://www.healthypeople.gov/Document/html/uih/uih_bw/uih_4.htm#mentalhealth<br />
Table 7: <strong>Tarrant</strong> <strong>County</strong> Clients in <strong>Mental</strong> <strong>Health</strong> Services by Gender<br />
Adult<br />
Children <strong>and</strong> Adolescents<br />
2000 2001 2000 2001<br />
Case Percent Case Percent* Case Percent Case Percent<br />
Male 5,709 46.2 % 5,936 45.6% 964 72.3 % 735 70.7 %<br />
Female 5,829 47.1 % 6,075 46.6% 363 27.2 % 305 29.3 %<br />
Not-reported 826 6.7 % 1,020 7.8% 7 0.5 % 0 0.0 %<br />
Total 12,364 100% 13,031 100% 1,334 100% 1,040 100%<br />
Data Source: MHMR of <strong>Tarrant</strong> <strong>County</strong><br />
Monitoring & Assessment Project 134
<strong>Tarrant</strong> <strong>County</strong> Community <strong>Health</strong> Report 2003<br />
Domain VI. <strong>Social</strong> & <strong>Mental</strong> <strong>Health</strong><br />
Table 8: <strong>Tarrant</strong> <strong>County</strong> Clients in <strong>Mental</strong> <strong>Health</strong> Services by Race/Ethnicity<br />
Adult<br />
Children <strong>and</strong> Adolescents<br />
2000 2001 2000 2001<br />
Case Percent Case Percent Case Percent Case Percent<br />
White 7,830 63.3 % 8,131 62.4 % 784 58.8 % 550 52.9 %<br />
Black 2,879 23.3 % 3,074 23.6 % 372 3.0 % 340 2.7 %<br />
Hispanic 697 5.6 % 783 6.0 % 153 11.5 % 131 12.6 %<br />
Other 184 1.5 % 182 1.4 % 18 1.3 % 8 0.8 %<br />
Not-reported 774 6.3 % 861 6.6 % 7 0.5 % 11 1.1 %<br />
Total 12,364 100% 13,031 100.0 % 1,334 100% 1,040 100%<br />
Table 9: <strong>Tarrant</strong> <strong>County</strong> Clients in <strong>Mental</strong> <strong>Health</strong> Services by Geographic Distribution<br />
Adult<br />
2000 2001<br />
Case Percent Case Percent<br />
Fort Worth 8,680 70.2 % 9,090 69.8 %<br />
Arlington 1,713 13.9 % 1,854 14.2 %<br />
North East <strong>Tarrant</strong> <strong>County</strong> 1,025 8.3 % 1,113 8.5 %<br />
Other 373 3.0 % 550 4.2 %<br />
Unknown 573 4.6 % 424 3.3 %<br />
Child <strong>and</strong> Adolescent<br />
2000 2001<br />
Case Percent Case Percent<br />
Fort Worth 842 63.1 % 687 66.1 %<br />
Arlington 290 21.7 % 200 19.2 %<br />
North East <strong>Tarrant</strong> <strong>County</strong> 110 8.2 % 84 8.1 %<br />
Other 94 5.4 % 47 3.5 %<br />
Unknown 20 1.5 % 33 3.2 %<br />
Data Source: MHMR of <strong>Tarrant</strong> <strong>County</strong><br />
HP 2010 chapter 18 is dedicated to mental health issues. Objectives 18-6 through 18-11<br />
are designed to encourage an increase in mental health services <strong>and</strong> treatment. These<br />
are developmental objectives that do not have specific stated goals. Consequently, the<br />
data for <strong>Tarrant</strong> <strong>County</strong> is not comparable to any specific HP2010 objective at this time.<br />
Monitoring & Assessment Project 135
<strong>Tarrant</strong> <strong>County</strong> Community <strong>Health</strong> Report 2003<br />
Domain VI. <strong>Social</strong> & <strong>Mental</strong> <strong>Health</strong><br />
Indicator VI-3.<br />
Substance Abuse Deaths<br />
Total Alcohol-related Deaths<br />
Direct Alcohol-related Deaths<br />
Indirect Alcohol-related Deaths<br />
Total Drug-related Deaths<br />
Direct Drug-related Deaths<br />
Indirect Drug-related Deaths<br />
Substance Abuse<br />
Table 10: <strong>Tarrant</strong> <strong>County</strong> Substance Abuse Deaths<br />
2000 2001<br />
Case Rate* Case Rate*<br />
619<br />
106<br />
513<br />
181<br />
135<br />
46<br />
59.5<br />
10.2<br />
49.3<br />
17.4<br />
13.0<br />
4.4<br />
646<br />
101<br />
545<br />
208<br />
167<br />
41<br />
62.1<br />
9.7<br />
52.4<br />
20.0<br />
16.1<br />
3.9<br />
* crude death rates per 100,000 population<br />
Substance abuse deaths are comprised<br />
of deaths involving alcohol or drug<br />
use, or both. The Texas Commission<br />
on Alcohol <strong>and</strong> Drug Abuse reports<br />
more than 800 deaths per year directly<br />
or indirectly related to substance abuse.<br />
In 2000 <strong>and</strong> 2001, alcohol-related<br />
deaths were about three times higher<br />
than drug-related deaths (Table 10).<br />
The rates for both increased from 2000<br />
to 2001.<br />
More males than females experience<br />
substance abuse deaths (Table 11).<br />
Blacks had the highest rates of<br />
substance abuse deaths in both years,<br />
followed closely by Whites (Table 12).<br />
Hispanics <strong>and</strong> those of other races had<br />
rates that are too low to report.<br />
Substance abuse deaths increase with<br />
age, the highest rate being in people 65<br />
years <strong>and</strong> older (Table 13). For people<br />
65 <strong>and</strong> older, substance abuse deaths<br />
include alcohol-related deaths only.<br />
Drug-related deaths are usually<br />
excluded because of the high rate of<br />
prescription drug overdose among the<br />
elderly. From 2000 to 2001, substance<br />
abuse death rates increased in all age<br />
categories except those younger than<br />
15 years.<br />
Table 11: <strong>Tarrant</strong> <strong>County</strong> Substance Abuse Deaths by Gender<br />
2000 2001<br />
Case *Rate Case *Rate<br />
Male 489 96.2 534 105.1<br />
Female 311 58.5 319 60.0<br />
*Crude death rates per 100,000 population<br />
Table 12: <strong>Tarrant</strong> <strong>County</strong> Substance Abuse Deaths by<br />
Race/Ethnicity<br />
2000 2001<br />
Case *Rate Case *Rate<br />
White 656 95.1 707 101.4<br />
Black 127 102.1 135 104.2<br />
Hispanic < 5 @.@ < 5 @.@<br />
Other 0 0.0 < 5 @.@<br />
*Crude death rates per 100,000 population<br />
Table 13: <strong>Tarrant</strong> <strong>County</strong> Substance Abuse Deaths by Age<br />
2000 2001<br />
Case *Rate Case *Rate<br />
< 15 14 4.1 7 2.10<br />
15-24 76 36.5 77 37.0<br />
25-34 71 30.1 235 100.0<br />
35-44 104 41.9 120 48.3<br />
45-54 127 68.3 152 81.8<br />
55-64 107 101.9 128 121.9<br />
**65 + 302 250.5 304 252.1<br />
*Crude death rates per 100,000 population<br />
**Drug-related deaths not included<br />
Data Source: Texas Commission on Alcohol <strong>and</strong> Drug Abuse<br />
Monitoring & Assessment Project 136
<strong>Tarrant</strong> <strong>County</strong> Community <strong>Health</strong> Report 2003<br />
Domain VI. <strong>Social</strong> & <strong>Mental</strong> <strong>Health</strong><br />
The following data is the blood alcohol level <strong>and</strong> toxicology results of all the victims of accidental<br />
deaths in <strong>Tarrant</strong> <strong>County</strong> as reported by the Medical Examiner’s office in 2001. According to<br />
Texas Penal Code § 49.01, a person with a blood alcohol level more than 0.08 is determined to be<br />
legally intoxicated. Among the 355 accidental deaths reported by the Medical Examiner’s office,<br />
23 percent had a blood alcohol level of 0.06 or above <strong>and</strong> 20 percent were more than 0.11 (Table<br />
14). Accidental deaths with no detectable alcohol level are not included in the table below. There<br />
is no identifiable pattern between the number of deaths <strong>and</strong> the blood alcohol level.<br />
Toxicology tests performed by the Medical Examiner’s office on accidental death victims include<br />
ABN, Cannabinoid such as Marijuana, Opiates (Heroin or Morphine), <strong>and</strong> BZD (Benzodiazepine).<br />
ABN is a general test that st<strong>and</strong>s for acid, base <strong>and</strong> neutral media of extractions for various drugs.<br />
It is always positive when any illegal drug is present in the blood of victims tested. A follow-up<br />
test is then done to identify which specific drug is involved. In some situations, the specific drug<br />
may not be identifiable. Toxicology tests performed in 2001 identified a detectable blood drug<br />
level in 52 percent of accidental death victims (Table 15). Cocaine <strong>and</strong> opiates were most<br />
frequently detected in victims of accidental deaths. Those under ABN category are victims whose<br />
blood is known to have illegal drugs present, but the specific drug was not identified (Table 15).<br />
Table 14: <strong>Tarrant</strong> <strong>County</strong> Accidental Deaths by Age <strong>and</strong> Blood Alcohol, 2001<br />
0.01 - 0.05 0.06 - 0.10 0.11 – 0.20 0.21 – 0.30 > 0.30<br />
< 10 0 0 0 0 0<br />
11 – 20 2 1 5 5 0<br />
21 – 30 2 3 7 12 2<br />
31 – 40 2 1 6 8 3<br />
41 – 50 3 2 6 5 4<br />
51- 60 1 1 3 2 0<br />
61 + 0 1 3 0 0<br />
Total 10 9 30 32 9<br />
Table 15: <strong>Tarrant</strong> <strong>County</strong> Accidental Deaths by Age <strong>and</strong> Toxicology, 2001<br />
ABN Cocaine Cannabinoid Opiates BZD<br />
< 10 4 0 0 0 0<br />
11 – 20 5 2 6 6 3<br />
21 – 30 21 16 10 10 7<br />
31 – 40 23 21 3 20 14<br />
41 – 50 22 5 16 8 19<br />
51- 60 12 6 1 6 3<br />
61 + 3 2 0 2 0<br />
Total 90 52 36 52 46<br />
Data Source: Medical Examiner’s office in <strong>Tarrant</strong> <strong>County</strong><br />
Monitoring & Assessment Project 137
<strong>Tarrant</strong> <strong>County</strong> Community <strong>Health</strong> Report 2003<br />
Domain VI. <strong>Social</strong> & <strong>Mental</strong> <strong>Health</strong><br />
Geographic Distribution of Substance Abuse-Related Deaths<br />
Fig 3: <strong>Tarrant</strong> <strong>County</strong> Substance Abuse Deaths,<br />
2000 - 2001<br />
In this map, substance abuse deaths<br />
for years 2000 <strong>and</strong> 2001 were<br />
combined because of low numbers<br />
reported.<br />
The reported substance abuse deaths<br />
were distributed throughout the<br />
county. ZIP Codes in central <strong>and</strong><br />
south <strong>Tarrant</strong> <strong>County</strong> reported<br />
relatively higher crude death rates<br />
than other areas. ZIP Codes with the<br />
highest substance abuse deaths are<br />
76102, 76104 <strong>and</strong> 76105 in central<br />
<strong>Tarrant</strong> <strong>County</strong>, 76135 in northwest<br />
<strong>Tarrant</strong> <strong>County</strong> <strong>and</strong> 76060 in south<br />
<strong>Tarrant</strong> <strong>County</strong>.<br />
Legend<br />
Crude Rate (per 100,000)<br />
2000 - 2001<br />
Highest Quartile ≥ 15.0<br />
2 nd Quartile 10.0 – 14.9<br />
3 rd Quartile 5.0 – 9.9<br />
Lowest Quartile < 5.0<br />
No Case or no Data<br />
Rates are not age-adjusted<br />
Monitoring & Assessment Project 138
<strong>Tarrant</strong> <strong>County</strong> Community <strong>Health</strong> Report 2003<br />
Domain VI. <strong>Social</strong> & <strong>Mental</strong> <strong>Health</strong><br />
Comparison with Texas <strong>and</strong> United States<br />
In 2000 <strong>and</strong> 2001, the substance abuse death rates in <strong>Tarrant</strong> <strong>County</strong> were lower than those of<br />
Texas. The rates for the United States were not available. In the year 2000, <strong>Tarrant</strong> <strong>County</strong> had a<br />
lower Driving While Intoxicated (DWI) death rate than Texas <strong>and</strong> the United States.<br />
Table 16: Substance Abuse Deaths* per 100,000 population<br />
<strong>Tarrant</strong> Texas U.S.**<br />
2000 55.3 64.8 NA<br />
2001 59.1 67.1 NA<br />
* Substance abuse deaths include alcohol <strong>and</strong> drug-related deaths<br />
** Available United States data includes only drug induced deaths<br />
Table 17: Driving While Intoxicated Motor Vehicle Fatalities per 100,000 population<br />
<strong>Tarrant</strong> Texas U.S.<br />
2000 2.70 4.94 5.92<br />
2001 NA NA 5.92<br />
NA: Not available<br />
Data Source: Texas Commission on Alcohol <strong>and</strong> Drug Abuse, CDC National <strong>Health</strong> Statistics<br />
Comparison with <strong>Health</strong>y People 2010 Objective<br />
Table 18: Substance Abuse Deaths<br />
<strong>Tarrant</strong> <strong>County</strong><br />
26-1. Reduce deaths caused by alcohol-related motor vehicle<br />
crashes to 4 per 100,000 population. (Baseline: 5.9 per<br />
100,000 in 1998)<br />
26-3. Reduce drug-induced deaths to 1 per 100,000 population.<br />
(Baseline: 6.3 per 100,000 in 1998 -- preliminary data age<br />
adjusted to year 2000 st<strong>and</strong>ard population)<br />
• Current Status:<br />
<br />
2.70 per 100,000<br />
<br />
17.4 per 100,000<br />
<br />
20.0 per 100,000<br />
Data Source: Texas Accident Record Bureau, Bureau of Vital Statistics<br />
As of 2000, the rate of death for alcohol-related motor vehicle crashes in <strong>Tarrant</strong> <strong>County</strong> is<br />
below the corresponding <strong>Health</strong>y People 2010 objective. In both years, the overall substance<br />
abuse death rates in <strong>Tarrant</strong> <strong>County</strong> were much higher than the <strong>Health</strong>y People 2010 objective.<br />
Monitoring & Assessment Project 139
<strong>Tarrant</strong> <strong>County</strong> Community <strong>Health</strong> Report 2003<br />
Domain VI. <strong>Social</strong> & <strong>Mental</strong> <strong>Health</strong><br />
Indicator VI-3.<br />
Substance Abuse<br />
Substance use <strong>and</strong> abuse<br />
An important goal of the United States policy for reducing substance abuse is to increase the<br />
percentage of young people who reach adulthood without using illicit drugs or alcohol.<br />
Strengthening the ability of children <strong>and</strong> teenagers to reject all such substances is an important <strong>and</strong><br />
critical element in substance abuse prevention because the acquired skills <strong>and</strong> attitudes can carry<br />
over into adulthood, long after family constraints <strong>and</strong> other influences have lost their<br />
effectiveness. 1<br />
The 2000 Texas school survey of substance use among secondary school students revealed that the<br />
average age of first use of alcohol in <strong>Tarrant</strong> <strong>County</strong> was about two years younger than the average<br />
age for Texas (Table 19). The number of students from the school districts that agreed to<br />
participate in the 2001 survey was not sufficient to show a trend in alcohol usage by young people.<br />
Table 19: Average age of first use of alcohol<br />
<strong>Tarrant</strong> Texas U.S.<br />
2000 11.6 13.8 NA<br />
NA: Data not available<br />
Data Source: Challenge Inc., <strong>Tarrant</strong> <strong>County</strong>, Texas School Survey of Drug <strong>and</strong> Alcohol Use, 2000<br />
1. http://www.healthypeople.gov/Document/HTML/Volume2/26Substance.htm<br />
Monitoring & Assessment Project 140
<strong>Tarrant</strong> <strong>County</strong> Community <strong>Health</strong> Report 2003<br />
Domain VI. <strong>Social</strong> & <strong>Mental</strong> <strong>Health</strong><br />
Comparison with <strong>Health</strong>y People 2010 Objective<br />
According to the Texas 2000 school survey of substance use among secondary school students, 29<br />
percent of <strong>Tarrant</strong> <strong>County</strong>’s high school seniors reported that they had never used alcohol, <strong>and</strong> 73<br />
percent reported that they had never used marijuana. The use of alcohol <strong>and</strong> marijuana among<br />
adolescents 12 -17 in the past month was 38 percent <strong>and</strong> 12 percent, respectively.<br />
The perception of risk of harm from illegal drugs is an important factor in decreasing usage. Lower<br />
levels of perception of harm are associated with increased use. In 2000, the percentages of <strong>Tarrant</strong><br />
<strong>County</strong> adolescents in grades 7-12 who perceived a great risk associated with alcohol <strong>and</strong><br />
marijuana use were 51 percent <strong>and</strong> 63 percent, respectively.<br />
Table 20: Substance Abuse<br />
<strong>Tarrant</strong> <strong>County</strong><br />
(2000)<br />
26-9. Increase the age <strong>and</strong> proportion of adolescents who remain<br />
alcohol <strong>and</strong> drug free (Increase adolescents never using<br />
substances)<br />
Objective: Increase average age of first use of substance in<br />
adolescents aged 12 to 17 years<br />
26-9a. Alcohol : 16.1 years<br />
26-9b. Marijuana: 17.4 years<br />
Objective: Increase in high school seniors never using substances<br />
26-9c. Alcohol: 29%<br />
26-9d. Illicit drugs: 56%<br />
26-10. Reduce past-month use of illicit substances.<br />
26-10a. Increase the proportion of adolescents not using alcohol<br />
or any illicit drugs during the past 30 days to 89%.<br />
26-10b. Reduce the proportion of adolescents reporting use of<br />
marijuana during the past 30 days to 0.7 percent.<br />
<br />
26-9a. 11.6 years<br />
26-9c. 38 % never used<br />
<br />
26-9b.. NA<br />
26-9d. 73 %<br />
(data for all illicit drugs<br />
– not available)<br />
26-10a<br />
< Alcohol> 62 %<br />
<br />
NA<br />
26-10b<br />
< Marijuana> 12 %<br />
26-17. Increase the proportion of adolescents who perceive great < Alcohol> 51 %<br />
risk associated with substance abuse to 80%. (Baseline: 31-<br />
54% in 1998) < Marijuana> 63 %<br />
Data Source: Challenge Inc., <strong>Tarrant</strong> <strong>County</strong>, Texas School Survey of Drug <strong>and</strong> Alcohol Use<br />
• Current Status:<br />
As of 2000, <strong>Tarrant</strong> <strong>County</strong> did not meet any of the corresponding <strong>Health</strong>y People 2010<br />
objectives for substance abuse, except for the proportion of high school seniors who never used<br />
alcohol or marijuana.<br />
Monitoring & Assessment Project 141
<strong>Tarrant</strong> <strong>County</strong> Community <strong>Health</strong> Report 2003<br />
Domain VI. <strong>Social</strong> & <strong>Mental</strong> <strong>Health</strong><br />
Indicator VI-3.<br />
Substance Abuse<br />
Treatment for substance abuse<br />
The number of <strong>Tarrant</strong> <strong>County</strong><br />
residents receiving treatment from<br />
TCADA for substance abuse increased<br />
by 7 percent in 2001 from the 2000<br />
baseline (Table 21).<br />
In both years, more males than females<br />
received substance abuse treatment in<br />
<strong>Tarrant</strong> <strong>County</strong> (Table 22).<br />
More than half of those who received<br />
substance abuse treatment were<br />
Whites, followed by Blacks <strong>and</strong><br />
Hispanics (Table 23). Close to onethird<br />
of people receiving substance<br />
abuse treatment are 30-39 years old<br />
(Table 24).<br />
Cocaine was the most common<br />
substance for which received treatment<br />
in both years (Table 25).<br />
There are no corresponding<br />
objectives for substance abuse<br />
treatment in <strong>Health</strong>y People<br />
2010; however there are several<br />
developmental objectives.<br />
Table 22: <strong>Tarrant</strong> <strong>County</strong> Substance Abuse Treatment<br />
by Gender<br />
2000 2001<br />
Case Percent Case Percent<br />
Male 1,502 56.0% 1,573 54.8 %<br />
Female 1,181 44.0% 1,299 45.2%<br />
Table 23: <strong>Tarrant</strong> <strong>County</strong> Substance Abuse Treatment<br />
by Race/Ethnicity<br />
2000 2001<br />
Case Percent Case Percent<br />
White 1,547 57.7 % 1,651 57.5%<br />
Black 751 28.0% 754 26.3%<br />
Hispanic 346 12.9% 423 14.7%<br />
Other 39 1.5% 44 1.5%<br />
Table 24: <strong>Tarrant</strong> <strong>County</strong> Substance Abuse Treatment<br />
by Age<br />
2000 2001<br />
Case Percent Case Percent<br />
10-19 517 19.3% 574 20.0%<br />
20-29 619 23.1% 646 22.5%<br />
30-39 881 32.8% 872 30.4%<br />
40 + 666 24.8% 780 27.2%<br />
Table 25: <strong>Tarrant</strong> <strong>County</strong> Substance Abuse Treatment by<br />
Substance<br />
Substance<br />
Table 21: <strong>Tarrant</strong> <strong>County</strong> Substance Abuse<br />
Treatment*<br />
2000 2001<br />
Total 2,683 2872<br />
* Substance abuse treatment provided by TCADA-Funded Programs<br />
2000 2001<br />
Case Percent Case Percent<br />
Amphetamines 240 9.05 % 286 10.0 %<br />
Cocaine 719 26.8 % 689 24.0 %<br />
Hallucinogens 10 0.4 % 12 0.4 %<br />
Heroin 417 15.5 % 490 17.1 %<br />
Other Opiates/Narcotics 77 2.9 % 98 3.4 %<br />
*Other Substances 1220 45.5% 1297 45.2 %<br />
* Other substances include antidepressants, aromatic analgesics, barbiturates,<br />
salicylate <strong>and</strong> propionic acid derivates<br />
Data Source: Texas Commission on Alcohol <strong>and</strong> Drug Abuse<br />
Monitoring & Assessment Project 142
<strong>Tarrant</strong> <strong>County</strong> Community <strong>Health</strong> Report 2003<br />
Domain VI. <strong>Social</strong> & <strong>Mental</strong> <strong>Health</strong><br />
Indicator VI-4.<br />
There were more than 2,000<br />
confirmed child abuse <strong>and</strong> neglect<br />
cases in <strong>Tarrant</strong> <strong>County</strong> reported<br />
to the Texas Department of<br />
Protective <strong>and</strong> Regulatory<br />
Services in each year for 2000<br />
<strong>and</strong> 2001 (Table 26). In 2001, the<br />
overall rate of confirmed child<br />
abuse <strong>and</strong> neglect in <strong>Tarrant</strong><br />
<strong>County</strong> declined by 14 percent<br />
from 2000 baseline (Table 26).<br />
Females experienced a higher rate<br />
of child abuse <strong>and</strong> neglect than<br />
males in both years (Table 27).<br />
Child Abuse <strong>and</strong> Neglect<br />
Table 26: <strong>Tarrant</strong> <strong>County</strong> Child Abuse <strong>and</strong> Neglect<br />
2000 2001<br />
Case s Rate Case s Rate<br />
Total 2,613 6.4 2,309 5.5<br />
Rates per 1,000 children age 0-17<br />
Table 27: <strong>Tarrant</strong> <strong>County</strong> Child Abuse <strong>and</strong> Neglect by Gender<br />
2000 2001<br />
Case s Rate Case s Rate<br />
Male 1,215 5.8 1,060 5.0<br />
Female 1,385 7.0 1,239 6.1<br />
Not-reported 13 - 10 -<br />
Rates per 1,000 children age 0-17<br />
The rate of child abuse <strong>and</strong><br />
neglect in Whites was more than<br />
twice that of Blacks <strong>and</strong><br />
Hispanics in both years (Table<br />
28).<br />
Confirmed child abuse <strong>and</strong><br />
neglect was highest for infants<br />
under 1 year (Table 29). The rate<br />
of child abuse <strong>and</strong> neglect in<br />
infants under 1 year was more<br />
than twice that of children in<br />
other age groups (Table 29).<br />
Table 28: <strong>Tarrant</strong> <strong>County</strong> Child Abuse <strong>and</strong> Neglect by<br />
Race/Ethnicity<br />
2000 2001<br />
Case s Rate Case s Rate<br />
White 798 12.5 651 10.2<br />
Black 1,210 5.5 1,018 4.7<br />
Hispanic 493 4.6 555 4.9<br />
Other 41 2.2 43 2.2<br />
Not-reported 71 - 42 -<br />
Rates per 1,000 children age 0-17<br />
Table 29: <strong>Tarrant</strong> <strong>County</strong> Child Abuse <strong>and</strong> Neglect by Age<br />
2000 2001<br />
Case s Rate Case s Rate<br />
< 1 401 17.1 341 13.7<br />
1 – 3 482 7.0 427 6.1<br />
4 – 6 560 8.2 456 6.6<br />
7 – 9 482 6.9 409 5.8<br />
10 – 12 344 5.0 316 4.5<br />
13 – 17 343 3.2 358 3.2<br />
Rates per 1,000 children age 0-17<br />
*<br />
Data Source: Texas Department of Protective <strong>and</strong> Regulatory Services<br />
Monitoring & Assessment Project 143
<strong>Tarrant</strong> <strong>County</strong> Community <strong>Health</strong> Report 2003<br />
Domain VI. <strong>Social</strong> & <strong>Mental</strong> <strong>Health</strong><br />
Geographic Distribution of Child Abuse <strong>and</strong> Neglect<br />
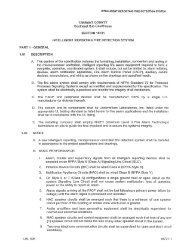
Fig 4: <strong>Tarrant</strong> <strong>County</strong> Confirmed Child Abuse <strong>and</strong><br />
Neglect, 2000<br />
In 2000, child abuse <strong>and</strong> neglect<br />
incidences were reported throughout<br />
<strong>Tarrant</strong> <strong>County</strong>. Higher rates were<br />
reported predominantly in central<br />
<strong>Tarrant</strong> <strong>County</strong>. This trend was more<br />
noticeable in 2001.<br />
ZIP Codes 76102 <strong>and</strong> 76104 reported<br />
the highest rates in both 2000 <strong>and</strong><br />
2001.<br />
<strong>Tarrant</strong> <strong>County</strong> experienced a decline<br />
in reported child abuse <strong>and</strong> neglect in<br />
2001 <strong>and</strong> the rates in each quartile<br />
were lower in 2001 compared to 2000<br />
(see legend below).<br />
Fig 5: <strong>Tarrant</strong> <strong>County</strong> Confirmed Child Abuse <strong>and</strong><br />
Neglect, 2001<br />
Legend<br />
Rate (per 1,000 children)<br />
2000 2001<br />
Highest Quartile > 23.36 > 13.59<br />
2 nd Quartile 15.59 – 23.36 9.06 – 13.58<br />
3 rd Quartile 7.80 – 15.58 4.54 – 9.05<br />
Lowest Quartile < 7.79 < 4.53<br />
No Case or no Data<br />
Monitoring & Assessment Project 144
<strong>Tarrant</strong> <strong>County</strong> Community <strong>Health</strong> Report 2003<br />
Domain VI. <strong>Social</strong> & <strong>Mental</strong> <strong>Health</strong><br />
Comparison with Texas <strong>and</strong> United States<br />
<strong>Tarrant</strong> <strong>County</strong> rates of child abuse <strong>and</strong> neglect were lower than that of Texas <strong>and</strong> the United<br />
States in 2000 <strong>and</strong> 2001.<br />
Table 30: Rate of Confirmed Victims of Child Abuse/Neglect (per 1,000 children)<br />
<strong>Tarrant</strong> Texas U.S.<br />
2000 6.4 8.3 12.2<br />
2001 5.5 7.2 12.4<br />
Data Source: Texas Department of Protective <strong>and</strong> Regulatory Services, U.S. Department of Human <strong>and</strong> <strong>Health</strong> Services<br />
Comparison with <strong>Health</strong>y People 2010 Objective<br />
Table 31: Child Abuse <strong>and</strong> Neglect<br />
<strong>Tarrant</strong> <strong>County</strong><br />
15-33a. Reduce child maltreatment to 11.1 per 1,000 population of 6.4 per 1,000<br />
children younger than 18 years of age (20% improvement).<br />
(Baseline: 13.9 per 1,000 population in 1997). 5.5 per 1,000<br />
• Current Status:<br />
As of 2000 <strong>and</strong> 2001, the confirmed child abuse <strong>and</strong> neglect rate in <strong>Tarrant</strong> <strong>County</strong> had met <strong>and</strong><br />
substantially surpassed the <strong>Health</strong>y People 2010 objective for child maltreatment. Child<br />
maltreatment is equivalent to child abuse <strong>and</strong> neglect.<br />
Monitoring & Assessment Project 145
<strong>Tarrant</strong> <strong>County</strong> Community <strong>Health</strong> Report 2003<br />
Domain VI. <strong>Social</strong> & <strong>Mental</strong> <strong>Health</strong><br />
Indicator VI-5.<br />
Adults<br />
Crime Arrest<br />
Each year, the Texas Department of<br />
Public Safety reported more than<br />
70,000 adult crime arrests in<br />
<strong>Tarrant</strong> <strong>County</strong>. This translates to<br />
an overall adult crime arrest rate of<br />
about 69 per 1,000 persons (Table<br />
32).<br />
Males had a much higher crime<br />
arrest rate than females (Table 32).<br />
In both years, the male arrest rate<br />
was more than three times that of<br />
females.<br />
The crime arrest rate in Blacks was<br />
highest, followed by Hispanics <strong>and</strong><br />
Whites (Table 33). The arrest rate<br />
in Blacks was more than twice that<br />
of Hispanics <strong>and</strong> Whites in both<br />
years.<br />
`<br />
Adult crime arrests declined with<br />
age (Table 34). People 18-24 had<br />
the highest rate (Table 34). This is<br />
more than twice that of the next age<br />
group with the second highest rate,<br />
25-34 years (Table 34). The crime<br />
arrest rates declined in all age<br />
groups from 2000 to 2001 (Table<br />
34).<br />
Alcohol-related offenses were the<br />
most reported crimes, followed by<br />
drug-related offenses <strong>and</strong> crimes<br />
against people in both years (Table<br />
35).<br />
Table 32: <strong>Tarrant</strong> <strong>County</strong> Adult Crime Arrest by Gender<br />
2000 2001<br />
Case Rate Case Rate<br />
Male 54,880 108.0 56,239 107.3<br />
Female 16,994 32.0 17,765 32.5<br />
Total 71,874 69.1 74,004 69.1<br />
Age 18 years <strong>and</strong> older<br />
Rates per 1,000 population<br />
Table 33: <strong>Tarrant</strong> <strong>County</strong> Adult Crime Arrest by Race<br />
2000 2001<br />
Case Rate Case Rate<br />
White 36,269 71.1 37,413 74.3<br />
Black 20,694 166.3 20,481 158.1<br />
Hispanic 14,338 80.0 15,572 80.4<br />
Other 573 12.4 536 10.7<br />
Age 18 years <strong>and</strong> older<br />
Rates per 1,000 population<br />
Table 34: <strong>Tarrant</strong> <strong>County</strong> Adult Crime Arrest by Age<br />
Group<br />
2000 2001<br />
Case Rate Case Rate<br />
18-24 27180 188.7 25362 171.4<br />
25-34 21208 90.0 20982 86.9<br />
35-44 17402 70.0 17374 69.1<br />
45-54 6492 34.9 6430 32.8<br />
55-64 1322 12.6 1338 12.1<br />
65 + 400 3.3 388 3.1<br />
Rates per 1,000 population<br />
Data Source: Texas Department of Public Safety<br />
Monitoring & Assessment Project 146
<strong>Tarrant</strong> <strong>County</strong> Community <strong>Health</strong> Report 2003<br />
Domain VI. <strong>Social</strong> & <strong>Mental</strong> <strong>Health</strong><br />
Classification of Offenses<br />
Crime Against Person<br />
Murder <strong>and</strong> non-negligent<br />
manslaughter<br />
Table 35: <strong>Tarrant</strong> <strong>County</strong> *Adult Crime Arrests by Offense<br />
2000 2001<br />
Male Female Male Female<br />
Total<br />
60 2 58 8 128<br />
Manslaughter by negligence 3 0 4 2 9<br />
Forcible rape 125 0 157 4 286<br />
Robbery 332 50 358 83 823<br />
Aggravated assault 903 251 853 211 2,218<br />
Other assaults 6,448 1,985 7,459 2,318 18,210<br />
Crime Against Property<br />
Burglary- breaking or entering 579 66 613 79 1,337<br />
Larceny 3,686 2,090 3,910 2,254 11,940<br />
Arson 9 5 13 8 35<br />
Forgery <strong>and</strong> counterfeiting 416 310 469 369 1,564<br />
Fraud <strong>and</strong> embezzlement 382 326 33 21 762<br />
Stolen property: buying, selling,<br />
receiving<br />
12 2 20 6<br />
V<strong>and</strong>alism 431 114 499 112 1,156<br />
Domestic Violence<br />
Crimes against family <strong>and</strong> children 88 34 83 55 260<br />
Narcotics (drug-related arrest)<br />
Drug abuse violations 4,271 1,158 4,003 1,003 10,435<br />
Sale/manufacturing 350 112 293 67 822<br />
Possession 3,921 1,046 3,710 936 9,613<br />
Alcohol-related Arrest<br />
Driving under the influence of alcohol 5,081 905 5,323 1,035 12,344<br />
Liquor laws 3,056 611 3,600 737 8,004<br />
Drunkenness 7,637 1,106 7,223 1,220 17,186<br />
Miscellaneous Offenses<br />
Weapons; carrying, possessing 521 58 495 46 1,120<br />
Prostitution <strong>and</strong> commercialized vice 528 1,806 423 1,918 4,675<br />
Sex offenses (other) 528 36 225 23 812<br />
Disorderly conduct 2,774 621 3,068 654 7,117<br />
Vagrancy 1,155 208 1,105 141 2,609<br />
All gambling 152 24 104 2 282<br />
Other offenses 16,036 5,233 15,876 5,195 42,340<br />
Total 59,484 18,159 59,977 18,507 15,627<br />
40<br />
*Age 18 years <strong>and</strong> older<br />
Data Source: Texas Department of Public Safety<br />
Monitoring & Assessment Project 147
<strong>Tarrant</strong> <strong>County</strong> Community <strong>Health</strong> Report 2003<br />
Domain VI. <strong>Social</strong> & <strong>Mental</strong> <strong>Health</strong><br />
Indicator VI-5.<br />
Youth<br />
Crime Arrest<br />
The overall youth crime rate in<br />
<strong>Tarrant</strong> <strong>County</strong> remained<br />
unchanged from 2000 to 2001<br />
(Table 35). There were more than<br />
19,000 youth criminal arrests in<br />
<strong>Tarrant</strong> <strong>County</strong> for each year. This<br />
translates to a youth crime rate of<br />
48 arrests per 1,000 people (Table<br />
35).<br />
Similar to adults, males had a<br />
higher arrest rate than females, but<br />
the difference was less (Table 36).<br />
The male crime arrest rate was<br />
twice that of females.<br />
Crime arrest rates were also highest<br />
for Blacks, followed by Whites <strong>and</strong><br />
Hispanics (Table 37).<br />
Table 36: <strong>Tarrant</strong> <strong>County</strong> *Youth Crime Arrest by Gender<br />
2000 2001<br />
Case Rate Case Rate<br />
Male 13,363 64.3 13,583 63.9<br />
Female 6,343 31.4 6,639 32.6<br />
Total 19,706 48.5 20,222 48.6<br />
Age < 18<br />
Rates per 1,000 population<br />
Table 37: <strong>Tarrant</strong> <strong>County</strong> *Youth Crime Arrest by Race<br />
2000 2001<br />
Case Rate Case Rate<br />
White 8,110 73.0 8,396 79.0<br />
Black 6,157 96.7 5,943 90.4<br />
Hispanic 5,465 51.5 5,639 50.0<br />
Other 247 13.5 244 12.6<br />
Age < 18<br />
Rates per 1,000 population<br />
Youths 15 to 17 had a rate that was<br />
more than twice that of younger<br />
people in 2000 <strong>and</strong> 2001(Table 38).<br />
Crimes against property were the<br />
most frequent cause of arrest in<br />
2000 <strong>and</strong> 2001, followed by crimes<br />
against people <strong>and</strong> drug-related<br />
offenses (Table 39).<br />
Table 38: <strong>Tarrant</strong> <strong>County</strong> *Youth Crime Arrest by Age<br />
Group<br />
2000 2001<br />
Case Rate Case Rate<br />
10-14 2,630 23.5 2,561 22.1<br />
15-17 3,713 57.8 2,664 40.6<br />
* Age < 18<br />
Rates per 1,000 population<br />
Data Source: Texas Department of Public Safety<br />
Monitoring & Assessment Project 148
<strong>Tarrant</strong> <strong>County</strong> Community <strong>Health</strong> Report 2003<br />
Domain VI. <strong>Social</strong> & <strong>Mental</strong> <strong>Health</strong><br />
Classification of Offenses<br />
Crime Against Person<br />
Murder <strong>and</strong> non-negligent<br />
manslaughter<br />
Table 39: <strong>Tarrant</strong> <strong>County</strong> Number of *Youth Crime Arrests by Offense<br />
2000 2001<br />
Male Female Male Female<br />
Total<br />
6 2 4 1 13<br />
Manslaughter by negligence 2 0 1 0 3<br />
Forcible rape 42 0 38 0 80<br />
Robbery 91 9 108 20 228<br />
Aggravated assault 231 81 228 54 594<br />
Other assaults 2,101 1,059 2,264 1,381 6,805<br />
Crime Against Property<br />
Burglary- breaking or entering 350 25 387 50 812<br />
Larceny 2,008 1,422 1,957 1,464 6,851<br />
Arson 23 5 1 5 34<br />
Forgery <strong>and</strong> counterfeiting 14 18 30 11 73<br />
Fraud <strong>and</strong> embezzlement 34 16 22 11 83<br />
Stolen property 5 0 6 0 11<br />
V<strong>and</strong>alism 550 109 515 98 1,272<br />
Domestic Violence<br />
Crimes against family <strong>and</strong> children 2 3 4 0 9<br />
Narcotics (drug related arrest)<br />
Drug abuse violations 991 172 847 156 2,166<br />
Sale/manufacturing 31 5 30 8 74<br />
Possession 960 167 817 148 2,092<br />
Alcohol Related Arrest<br />
Driving under the influence 76 16 111 29 232<br />
Liquor laws 518 166 691 206 1,581<br />
Drunkenness 184 30 252 39 505<br />
Miscellaneous Offenses<br />
Weapons; carrying, possessing 162 13 112 16 303<br />
Prostitution <strong>and</strong> commercialized<br />
vice<br />
7 8 3 4 22<br />
Sex offenses (other) 136 10 130 16 292<br />
Disorderly conduct 461 147 514 165 1,287<br />
Vagrancy <strong>and</strong> runaway 1,480 1,617 1,030 1,269 5,396<br />
Curfew <strong>and</strong> loitering law violations 1,180 531 1,123 575 3,409<br />
All gambling 21 0 5 3 29<br />
Other offenses 2,960 884 3,183 1,066 8,093<br />
Total 14,626 6,515 14,413 6,795 42,349<br />
*Youths 17 <strong>and</strong> younger<br />
Monitoring & Assessment Project 149
<strong>Tarrant</strong> <strong>County</strong> Community <strong>Health</strong> Report 2003<br />
Domain VI. <strong>Social</strong> & <strong>Mental</strong> <strong>Health</strong><br />
Geographic Distribution of Crime Arrests<br />
Fig 6: <strong>Tarrant</strong> <strong>County</strong> Crime Arrests, 2000 - 2001<br />
In this map, crime arrests for both<br />
youths <strong>and</strong> adult in years 2000 <strong>and</strong><br />
2001 were combined because of low<br />
numbers reported in each year.<br />
ZIP Codes 76102, 76104 <strong>and</strong> 76105<br />
in central <strong>Tarrant</strong> <strong>County</strong> reported the<br />
highest rates of crime arrest <strong>and</strong> these<br />
are surrounded by ZIP Codes in the<br />
next highest quartile of crime arrest<br />
rate.<br />
Legend<br />
Rate (per 1,000)<br />
2000 - 2001<br />
Highest Quartile ≥ 134.41<br />
2 nd Quartile 89.61 – 134.40<br />
3 rd Quartile 44.81 – 89.80<br />
Lowest Quartile < 44.80<br />
No Case or no Data<br />
Monitoring & Assessment Project 150
<strong>Tarrant</strong> <strong>County</strong> Community <strong>Health</strong> Report 2003<br />
Domain VI. <strong>Social</strong> & <strong>Mental</strong> <strong>Health</strong><br />
Comparison with Texas <strong>and</strong> United States<br />
In 2000 <strong>and</strong> 2001, the crime arrest rate in <strong>Tarrant</strong> <strong>County</strong> was higher than that of Texas. The<br />
crime arrest rate for the United States was not available.<br />
Table 40: Crime arrest rate (per 1,000 population)<br />
<strong>Tarrant</strong> Texas U.S.<br />
2000 63.3 50.7 NA<br />
2001 63.4 48.5 NA<br />
Data Source: TX Department of Public Safety<br />
<strong>Health</strong>y People 2010 does not have a corresponding objective for the<br />
overall crime arrest rate.<br />
Monitoring & Assessment Project 151
<strong>Tarrant</strong> <strong>County</strong> Community <strong>Health</strong> Report 2003<br />
Domain VI. <strong>Social</strong> & <strong>Mental</strong> <strong>Health</strong><br />
Indicator VI-6.<br />
Divorce<br />
In <strong>Tarrant</strong> <strong>County</strong>, there were more than 7,500 divorces reported per year <strong>and</strong> the overall divorce<br />
rate remained unchanged from 2000 to 2001 (Table 41). Overall, divorce rates in 2001 were<br />
comparable to that of the previous year for males but not for females (Table 42). Within each<br />
gender, Whites had the highest divorce rate followed by Blacks (Table 42). Rates in Whites <strong>and</strong><br />
Blacks were close to three times that of Hispanics <strong>and</strong> other races (Table 42). The majority (72.2<br />
percent) of divorces occurred in White couples for both years (Tables 43 <strong>and</strong> 44).<br />
Table 41: <strong>Tarrant</strong> <strong>County</strong> Divorce Rates<br />
2000 2001<br />
Case Rate Case Rate<br />
Total 7,574 5.2 7,742 5.2<br />
Rates per 1,000 population<br />
Table 42: <strong>Tarrant</strong> <strong>County</strong> Divorce Rates by Race/Ethnicity<br />
2000 2001<br />
Race/Ethnicity Male Female Male Female<br />
Case Rate Case Rate Case Rate Case Rate<br />
White 5710 12.9 5764 6.3 5660 12.6 5705 12.2<br />
Black 1028 11.6 963 4.9 1049 11.4 976 9.5<br />
Hispanic 528 3.5 497 1.6 629 3.9 622 4.3<br />
Other 129 4.0 139 2.0 174 5.0 182 5.3<br />
Unknown 174 - 206 - 222 - 249 -<br />
Table 43: <strong>Tarrant</strong> <strong>County</strong> Divorce by Couple’s by Race/Ethnicity 2000<br />
Wife’s Race/Ethnicity<br />
Rates per 1,000 population<br />
Husb<strong>and</strong>’s White Black Hispanic Other<br />
Race/Ethnicity Cases Percent* Cases Percent* Cases Percent* Cases Percent*<br />
White 5,466 72.2% 27 0.4% 114 1.5% 46 0.6%<br />
Black 82 1.1% 911 12.0% 12 0.2% 6 0.1%<br />
Hispanic 148 2.0% 7 0.1% 358 4.7% 6 0.1%<br />
Other 33 0.4% 7 0.1% 7 0.1% 79 1.0%<br />
Table 44: <strong>Tarrant</strong> <strong>County</strong> Divorce by Couple’s by Race/Ethnicity 2001<br />
Wife’s Race/Ethnicity<br />
Husb<strong>and</strong>’s White Black Hispanic Other<br />
Race/Ethnicity Cases Percent* Cases Percent* Cases Percent* Cases Percent*<br />
White 5,373 69.4% 33 0.4% 125 1.6% 65 0.8%<br />
Black 82 1.1% 921 11.9% 20 0.3% 7 0.1%<br />
Hispanic 154 2.0% 5 0.1% 451 5.8% 6 0.1%<br />
Other 46 0.6% 4 0.1% 13 0.2% 103 1.3%<br />
* Percent of the total divorces<br />
Divorce cases reported without race/ethnicity were excluded from this table<br />
Data Source: TDH Vital Statistics<br />
Monitoring & Assessment Project 152
<strong>Tarrant</strong> <strong>County</strong> Community <strong>Health</strong> Report 2003<br />
Domain VI. <strong>Social</strong> & <strong>Mental</strong> <strong>Health</strong><br />
Close to half of the divorces occurred in couples 20-39 in both years (Tables 45 <strong>and</strong> 46). There<br />
were no reported divorces in teenagers in <strong>Tarrant</strong> <strong>County</strong>.<br />
Husb<strong>and</strong>’s Age<br />
Table 45: <strong>Tarrant</strong> <strong>County</strong> Divorce by Couple’s Age, 2000<br />
Wife’s Age<br />
20-29 30-39 40-49 50-59 60+<br />
Cases Percent Cases Percent Cases Percent Cases Percent Cases Percent<br />
20-29 1,090 14.4% 149 2.0% 19 0.3% 2 0.0% 3 0.0%<br />
30-39 610 8.1% 1,698 22.4% 266 3.5% 21 0.3% 4 0.1%<br />
40-49 40 0.5% 698 9.2% 1,101 14.5% 122 1.6% 7 0.1%<br />
50-59 4 0.1% 73 1.0% 359 4.7% 325 4.3% 34 0.4%<br />
60+ 4 0.1% 11 0.1% 22 0.3% 99 1.3% 103 1.4%<br />
Husb<strong>and</strong>’s Age<br />
Table 46: <strong>Tarrant</strong> <strong>County</strong> Divorce by Couple’s Age, 2001<br />
Wife’s Age<br />
20-29 30-39 40-49 50-59 60+<br />
Cases Percent Cases Percent Cases Percent Cases Percent Cases Percent<br />
20-29 1,068 13.8% 158 2.0% 11 0.1% 2 0.0% 1 0.0%<br />
30-39 581 7.5% 1,619 20.9% 291 3.8% 23 0.3% 5 0.1%<br />
40-49 66 0.9% 665 8.6% 1,157 14.9% 119 1.5% 6 0.1%<br />
50-59 11 0.1% 96 1.2% 367 4.7% 389 5.0% 23 0.3%<br />
60+ 2 0.0% 16 0.2% 33 0.4% 107 1.4% 116 1.5%<br />
Percent of the total divorces<br />
Divorce cases reported without age were excluded from this table<br />
Data Source: TDH Vital Statistics<br />
Comparison with Texas <strong>and</strong> United States<br />
<strong>Tarrant</strong> <strong>County</strong> had a higher divorce rate than Texas <strong>and</strong> the United States in 2000 <strong>and</strong> a higher rate<br />
than Texas in 2001. Data was not available for the United States in 2001.<br />
Table 47:Divorce Rate s per 1,000 population<br />
<strong>Tarrant</strong> Texas U.S.<br />
2000 5.2 4.0 4.1<br />
2001 5.2 3.9 NA<br />
Data Source: TDH Bureau of Vital Statistics<br />
<strong>Health</strong>y People 2010 does not have a corresponding objective for divorce rate.<br />
Monitoring & Assessment Project 153
<strong>Tarrant</strong> <strong>County</strong> Community <strong>Health</strong> Report 2003<br />
Domain VI. <strong>Social</strong> & <strong>Mental</strong> <strong>Health</strong><br />
Table 48: <strong>Social</strong> <strong>and</strong> <strong>Mental</strong> <strong>Health</strong> Indicators by City in <strong>Tarrant</strong> <strong>County</strong> (2000-2001)<br />
CITY<br />
Suicide*<br />
(per 100,000)<br />
INDICATOR<br />
Substance Abuse Deaths* **<br />
(per 100,000)<br />
2000 2001 2000 2001<br />
ARLINGTON 9.6 10.2 5.7 4.2<br />
AZLE 10.4 20.8 0.0 0.0<br />
BEDFORD 10.6 17 6.4 8.5<br />
BENBROOK 4.9 0.0 @.@ @.@<br />
BLUE MOUND 4.8 0.0 0.0 0.0<br />
COLLEYVILLE 20.4 10.2 0.0 @.@<br />
CROWLEY 0.0 13.4 @.@ 0.0<br />
EDGECLIFF VILLAGE 39.2 0.0 0.0 @.@<br />
EULESS 10.9 15.2 @.@ 8.7<br />
EVERMAN 17.1 0.0 0.0 0.0<br />
FORT WORTH 7.7 10.1 6.0 7.5<br />
GRAND PRAIRIE (in <strong>Tarrant</strong>) 1.6 0.8 @.@ @.@<br />
GRAPEVINE 11.9 16.6 @.@ 0.0<br />
HALTOM CITY 10.3 15.4 10.3 7.7<br />
HASLET 0.0 88.2 0.0 0.0<br />
HURST 13.8 13.8 8.3 11.0<br />
KELLER 0.0 0.0 @.@ 0.0<br />
KENNEDALE 0.0 17.1 0.0 @.@<br />
LAKE WORTH 0.0 43.3 @.@ @.@<br />
MANSFIELD 10.7 10.7 @.@ 10.7<br />
NORTH RICHLAND HILLS 7.2 3.6 5.4 7.2<br />
RICHLAND HILLS 0.0 0.0 0.0 0.0<br />
RIVER OAKS 14.3 14.3 @.@ @.@<br />
SAGINAW 8.1 16.2 0.0 0.0<br />
SANSOM PARK 23.9 0.0 0.0 0.0<br />
SOUTHLAKE 0.0 4.6 0.0 @.@<br />
TROPHY CLUB 0.0 0.0 0.0 0.0<br />
WATAUGA 9.1 4.6 0.0 @.@<br />
WESTWORTH VILLAGE 47.1 0.0 0.0 0.0<br />
WHITE SETTLEMENT 6.7 13.5 @.@ 0.0<br />
TARRANT COUNTY 9.3 10.0 - -<br />
* Rates is not age-adjusted.<br />
** Includes only direct substance abuse deaths .<br />
Monitoring & Assessment Project 154
<strong>Tarrant</strong> <strong>County</strong> Community <strong>Health</strong> Report 2003<br />
Domain VI. <strong>Social</strong> & <strong>Mental</strong> <strong>Health</strong><br />
Table 48: <strong>Social</strong> <strong>and</strong> <strong>Mental</strong> <strong>Health</strong> Indicators by City in <strong>Tarrant</strong> <strong>County</strong> (2000-2001<br />
CITY<br />
Child Abuse <strong>and</strong> Neglect<br />
(per 1,000 children age 0-17)<br />
INDICATOR<br />
Crime Arrests<br />
(per 1,000)<br />
2000 2001 2000 2001<br />
ARLINGTON 5.4 5.0 66.2 72.1<br />
AZLE 4.9 8.2 31.2 30.0<br />
BEDFORD 3.9 1.8 30.6 40.2<br />
BENBROOK 7.1 6.0 17.8 27.1<br />
BLUE MOUND FW FW 27.1 26.2<br />
COLLEYVILLE 0.6 0.5 14.6 15.1<br />
CROWLEY 7.8 4.3 22.2 27.6<br />
DALWORTHINGTON GARDENS 0.0 0.0 18.3 13.9<br />
EDGECLIFF VILLAGE 0.0 0.0 NA NA<br />
EULESS 6.3 4.4 31.8 37.7<br />
EVERMAN FW FW 28.6 36.4<br />
FOREST HILL 0.0 0.0 38.6 33.1<br />
FORT WORTH 7.7 6.5 73.0 74.0<br />
GRAND PRAIRIE (in <strong>Tarrant</strong>) 0.9 0.7 NA NA<br />
GRAPEVINE 3.1 3.7 40.3 38.8<br />
HALTOM CITY FW FW 34.5 50.5<br />
HASLET 3.1 0.0 NA NA<br />
HURST 4.7 8.3 56.1 70.8<br />
KELLER 1.7 1.3 19.6 19.3<br />
KENNEDALE 6.6 6.0 27.8 31.6<br />
LAKESIDE TOWN FW FW 19.8 13.1<br />
LAKE WORTH FW FW 138.4 105.2<br />
MANSFIELD 2.0 0.2 29.6 32.5<br />
NORTH RICHLAND HILLS 1.0 0.8 41.9 44.6<br />
PANTEGO 0.0 0.0 33.4 70.9<br />
RENDON 0.4 4.2 NA NA<br />
PELICAN BAY AZ AZ 25.0 37.7<br />
RICHLAND HILLS FW FW 29.9 38.4<br />
RIVER OAKS FW FW 25.5 28.3<br />
SAGINAW 3.8 5.6 27.7 33.1<br />
SANSOM PARK FW FW 29.9 40.5<br />
SOUTHLAKE 0.0 0.0 17.0 14.3<br />
TROPHY CLUB 1.1 0.5 NA NA<br />
WATAUGA 4.1 4.0 19.9 29.5<br />
WESTLAKE TOWN 1.1 0.5 NA NA<br />
WESTWORTH VILLAGE FW FW 19.6 21.6<br />
WHITE SETTLEMENT FW FW 37.2 47.1<br />
TARRANT COUNTY 6.4 7.7 76.7 69.1<br />
FW- included in the rate for Fort Worth; AZ- included in the rate for Azle<br />
Monitoring & Assessment Project 155